Short-term bearish outlook, recommended to watch cautiously and wait for clear signals before entering.
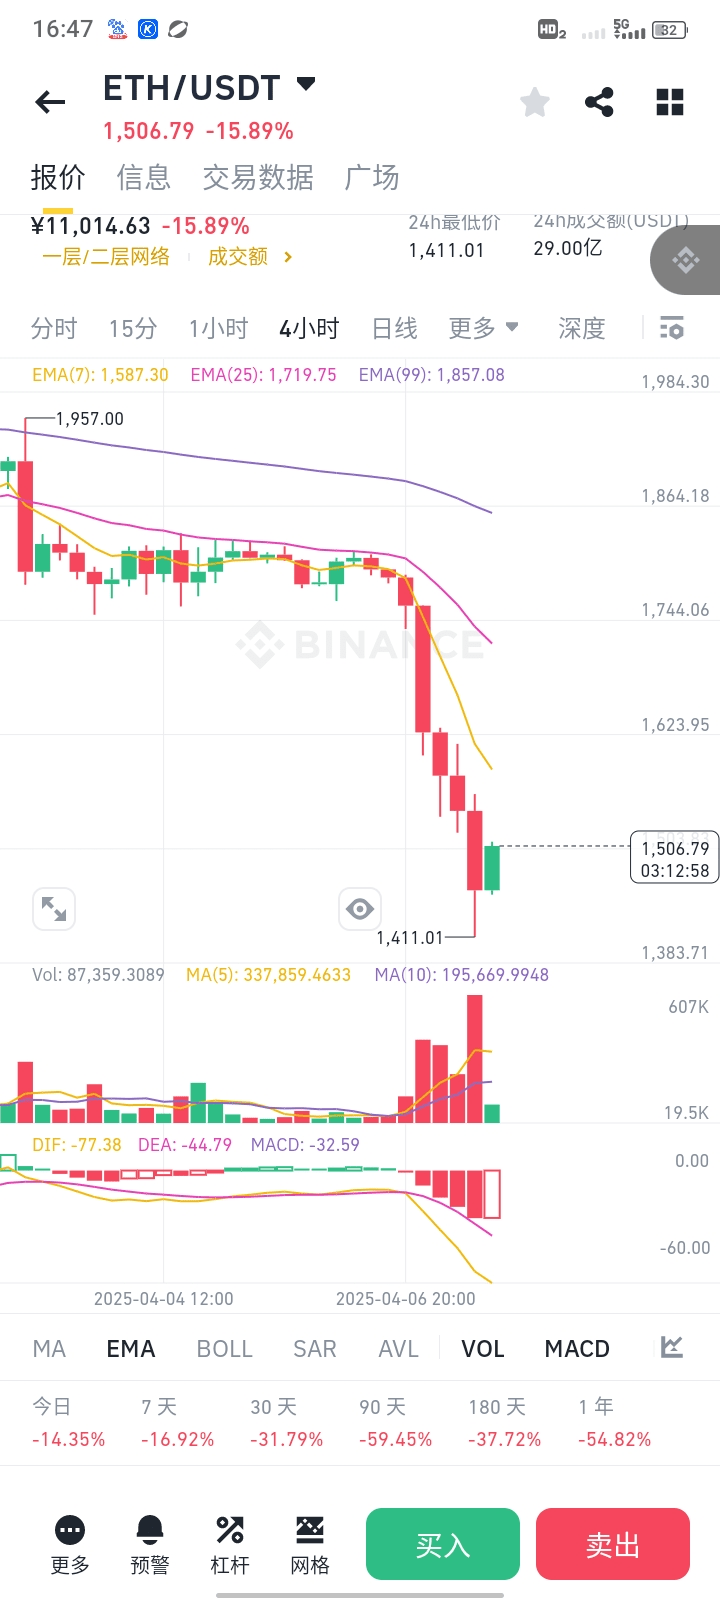
Core basis: First, the current price is 1,506.79, with a drop of 15.89%. This indicates a significant price drop. Users mention a clear downward trend recently with increased trading volume. Generally, increased volume accompanied by price decline may indicate strong selling pressure, with bears in control. Both the DIF and DEA lines in the MACD indicator are in the negative zone, with DIF at -77.38 and DEA at -32.59, which is typically seen as a bear market signal because both lines are below the zero axis, and DIF is below DEA, possibly forming a death cross, further confirming the downward trend.
Next, EMA indicators: The 7-day EMA is at 1,587.30, 25-day at 1,719.75, and 99-day at 1,857.08. The current price is far below these EMA lines, especially the short-term EMA (7-day) which is also below the medium and long-term EMAs, indicating that prices are in a downward trend, with major resistance from various moving averages.
The 24-hour low is 1,411.01, and the current price is close to this low, possibly testing support. If it breaks below, further declines may occur. The 24-hour trading volume is 2.9 billion; high trading volume indicates an active market, possibly continuing the current trend.
In terms of technical indicators, MACD shows that both DIF and DEA are negative, and DIF is below DEA, indicating that downward momentum is strengthening. Although the DEA value is higher than the DIF, both are in the negative zone, and no golden cross has formed, so MACD remains bearish. Additionally, other indicators like the EMA moving averages also support the downward trend.
Other data provided by users, such as the decline over different periods (today -14.35%, 7 days -16.92%, 30 days -31.79%, etc.), indicates that the medium to long-term trend is also downward, and market sentiment is very pessimistic.
However, although the overall trend is bearish, there may be a rebound in the short term, especially when the price is oversold. But based on the current information, rebound signals have not yet appeared, such as the MACD golden cross or price breaking through certain key resistance levels. It is recommended to wait for price stabilization or rebound signals before buying, which may imply that immediate long positions are not advised, but rather to observe for reversal signs.
Regarding entry points, if continuing to be bearish, it may be suggested to short when the price rebounds to resistance (like near the EMA7 of 1,587) or short when breaking below the 24-hour low of 1,411. If considering a long position, wait for the MACD golden cross, price to stand above EMA7, or other reversal signals such as decreased volume indicating weakening downward momentum, or forming bottom patterns (like double bottoms, head and shoulders, etc.). However, none of these reversal signals are mentioned in the current chart, so a bearish stance should be maintained.
Summary: The current trend is clearly downward, and technical indicators support further decline, but caution should be taken for possible oversold rebounds. It is recommended to be bearish in the short term, and entry points can be chosen when rebounding to resistance or following a break below support. If considering a long position, wait for clear rebound signals, which have yet to appear.
Technical indicators are bearish:
MACD: Both DIF (-77.38) and DEA (-32.59) are in the negative zone and have not formed a golden cross, indicating that downward momentum is dominant.
EMA moving averages: The price is below all EMAs (7-day/25-day/99-day), forming a bearish arrangement with major resistance (like the 7-day EMA around 1,587).
Market sentiment and price trend:
The current price (1,506.79) is close to the 24-hour low (1,411.01), and may test support in the short term.
Increased trading volume accompanying price decline suggests that selling pressure has not stopped, and panic sentiment is predominant.
Medium to long-term weakness:
The decline over the past 30 days exceeds 31%, and nearly 60% over 90 days, reflecting that the long-term downward trend has not changed.
Operation suggestion:
Bearish strategy (short position):
Entry point: If the price rebounds to the 7-day EMA (around 1,587) or fails to break through the psychological level of 1,500, a light short position can be taken.
Stop-loss: Set above EMA7 (like at 1,600) or at the previous high resistance level (1,623.95).
Target: Look down at the support of 1,411, and if it breaks, look towards lower positions (like 1,380).
Potential reversal signals (long positions need caution):
Reversal conditions: Need to wait for the MACD golden cross, price stabilizing above EMA7, or a bottom formation on the hourly chart (such as a double bottom).
Trying to go long: If the price breaks through 1,587 with volume and stabilizes, a light long position can be attempted, with a stop-loss set below 1,550.
Summary:
The current market is dominated by bears, and the risk of short-term bottom fishing is high. It is recommended to prioritize shorting opportunities during rebounds. If there are no clear stabilization signals (such as MACD golden cross, volume-price divergence, etc.), maintain a wait-and-see approach. Set strict stop-losses to guard against extreme volatility risks.