Currently, there is a possibility of a short-term rebound in ETHUSDT, but the overall trend remains bearish, so caution is advised. Here are specific suggestions:
Trend Judgment
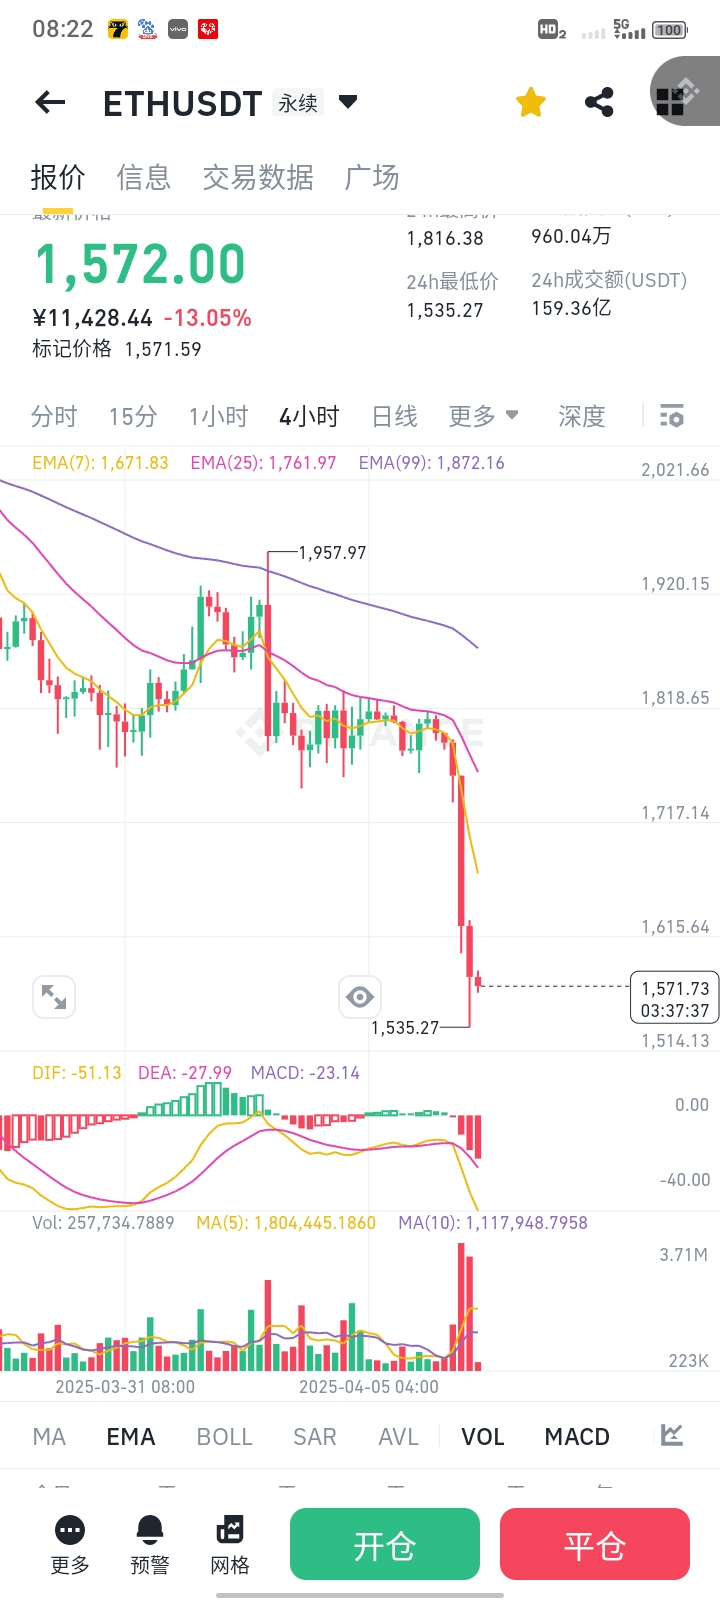
Bearish Dominance
Candlestick Structure: The price continues to create lower lows (1,535.27), with EMA(7) and EMA(25) both above the current price, forming a bearish arrangement.
MACD Indicator: Both DIF and DEA are negative and diverging downwards, MACD histogram expands (-23.14), indicating that the downward momentum has not weakened.
Short-term rebound opportunity
The price is approaching the low from 24 hours ago (1,535.27), which may trigger a technical rebound after being oversold, but verification with volume is needed.
Entry Point Suggestion
Bullish Strategy (high risk, short-term only)
Trigger Conditions:
Price holds above the previous low support of 1,535.27, with hourly candlestick closing positive and accompanied by increased trading volume.
MACD histogram narrowing or bottom divergence in DIF/DEA.
Entry Point: Lightly test long positions within the range of 1,535-1,550.
Stop Loss: Stop loss after breaking the previous low of 1,535.27 (refer to the support below of 1,514.13).
Target: 1,620 (resistance near EMA7) or 1,670 (daily level trend line pressure).
Bearish Strategy (mainly trend-following)
Trigger Conditions:
Price rebounds to EMA(7) (1,671.83) or EMA(25) (1,761.97) and then retreats.
MACD remains negative and has not shown reversal signals.
Entry Point: Gradually position short orders in the range of 1,620-1,670.
Stop Loss: Stop loss after breaking EMA(25) (1,761.97).
Target: Previous low of 1,535.27, if broken, can look down to the psychological level of 1,500.
Key Support and Resistance
Support Level: 1,535.27 (24h low) → 1,514.13 (chart shows potential bottom).
Resistance Levels: 1,620 (EMA7) → 1,760 (EMA25) → 1,818.65 (recent high).
Operation Reminder
Risk Control: The current market sentiment is pessimistic, and positions should be controlled within 5% to avoid excessive leverage.
Attention Events: Pay attention to Ethereum ecosystem dynamics (such as upgrades, staking data) and BTC market correlation.
Technical Verification: If the price rebounds but fails to break through EMA(7), further downside risk should be watched.
It is recommended to prioritize observing the hourly candlestick pattern and confirm stabilization or reversal signals before taking action.