The eye-catching tariff policy was announced by U.S. President Trump at 4 a.m. Beijing time on Thursday, after the closing of the U.S. stock market, unveiling a large-scale tariff plan that exceeded market expectations. A 10% benchmark tariff was set for global trading partners, with higher 'countervailing tariffs' imposed on certain trading partners, with China named first (34%) and Vietnam (46%) also being a focus.
The benchmark tariff rate of [10%] will take effect on April 5, and the countervailing tariffs will take effect at 4 a.m. on April 9. Except for pharmaceuticals, copper, semiconductors, lumber, precious metals such as gold and silver, energy, and specific mineral resources that cannot be obtained within the U.S. are not included in this round of tariffs. The White House stated that the tariffs imposed on China are an increase on the existing 20% tariffs previously applied to Chinese imports, which means that the effective tariff rate on China is 54%.
The market originally expected Trump's new tariff policy to be relatively mild, but the outcome was unexpectedly aggressive. After the news broke, U.S. stock futures fell collectively, with Dow futures once plummeting over 1,100 points, S&P 500 index futures down nearly 4%, and Nasdaq 100 index futures down nearly 3.68% as of the time of writing.
In terms of cryptocurrency, Bitcoin surged by $1500 after being influenced by news of a global benchmark tax rate of 10%, reaching a peak of $88,500, but subsequently fell sharply to a low of $82,137 due to higher 'countervailing tariffs,' with a decline exceeding 7% at one point in four hours. As of the time of writing, the Bitcoin price is $83,664, down approximately 1.15% in the past 24 hours.
Bitcoin four-hour chart

The current price is fluctuating between the middle Bollinger Band (83,500) and the upper band (86,656), under pressure from the middle band. If it breaks below the middle band, it may test the lower band (81,194). If the price breaks above 85,500, it is expected to continue rising to the 88,000-89,000 range. Currently, both the K line value and D line value are at lower levels, while the J line value is close to the oversold area, which may indicate that the market is about to rebound. However, the KDJ indicator has not yet formed a clear golden cross pattern, so we need to closely monitor whether the market will show stabilization signals. The DIF line and DEA line are running below the 0 axis, indicating that the upward momentum is weakening. Additionally, the MACD red histogram is shortening, suggesting that the market may soon reverse. If the DIF line crosses below the DEA line, forming a dead cross pattern, it may trigger a new round of decline, with support levels to watch at 82,000-81,000. If the red bars expand again, and the DIF line breaks above the DEA line, the market may continue to climb.
Bitcoin one-hour chart
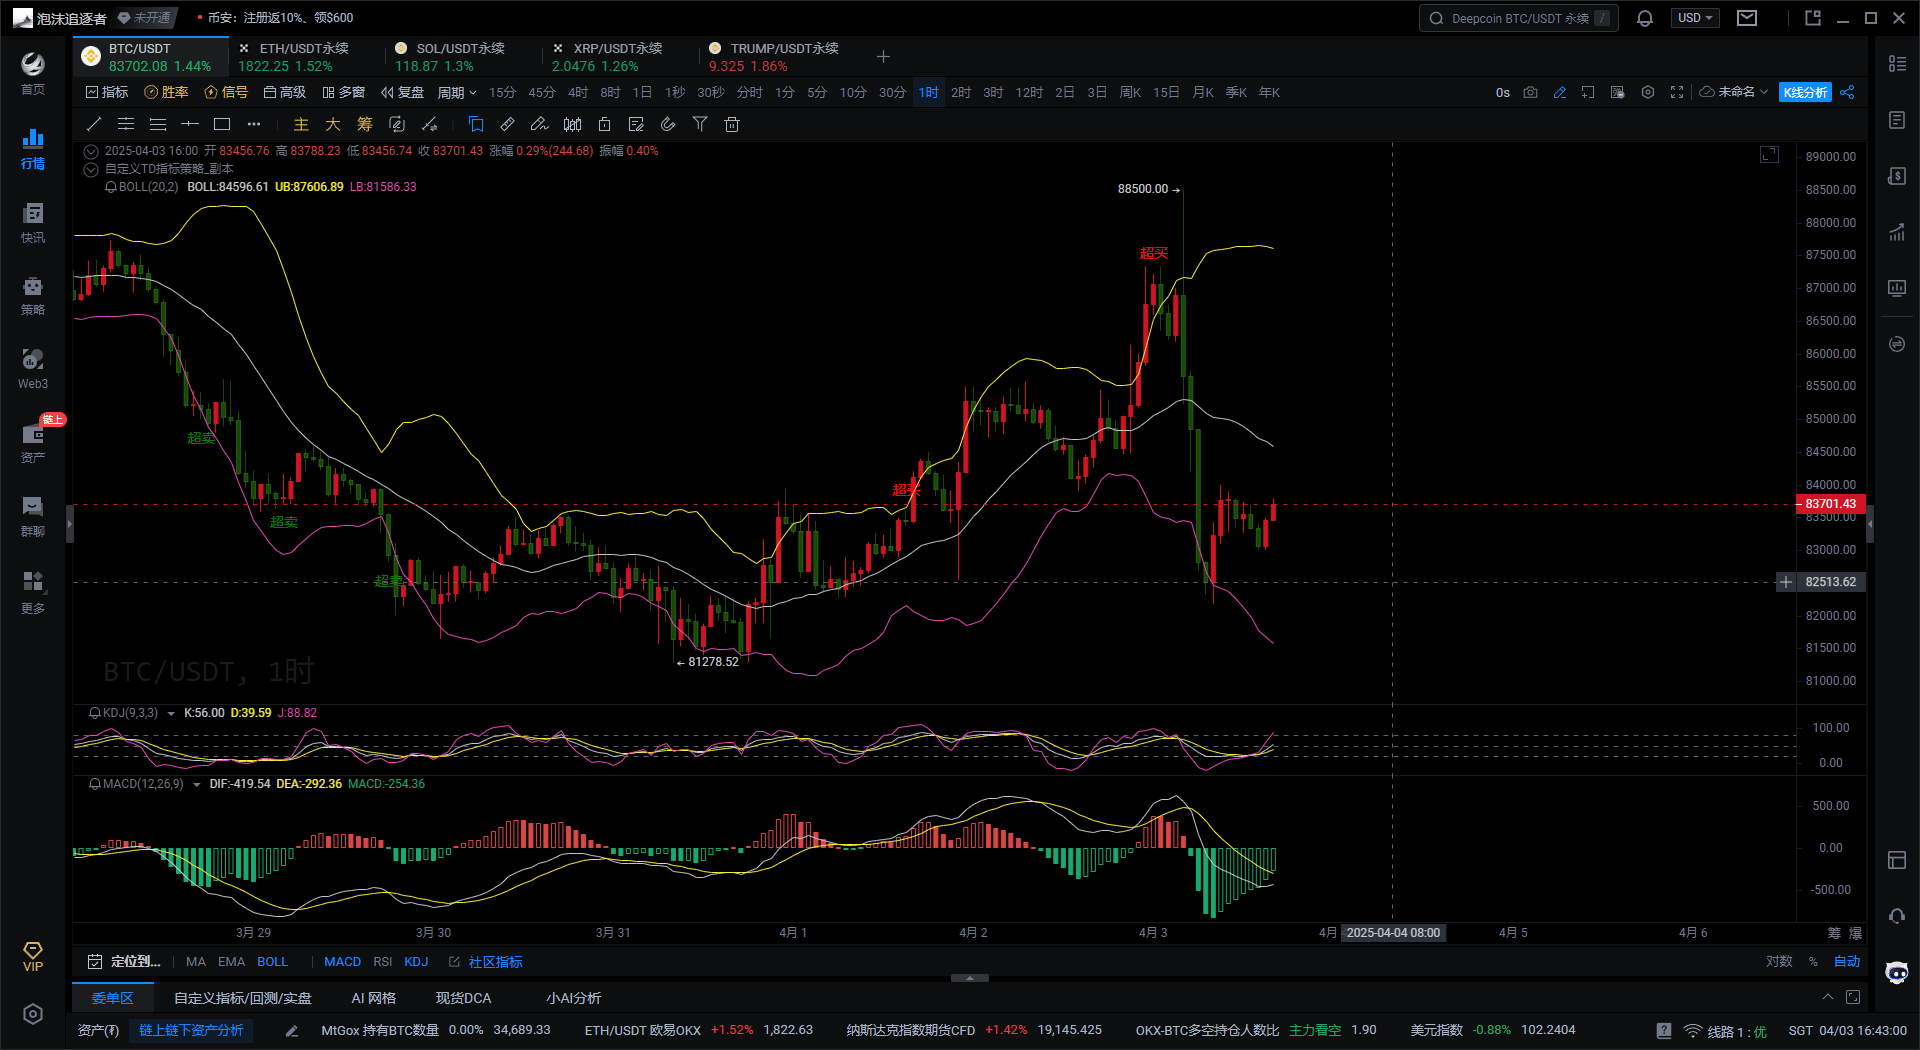
The price of Bitcoin is currently between the lower and middle Bollinger Bands, just recovering after a drop. The current upper band resistance is around 87,606, while the lower band support is at 81,568. If the price can break through the middle band (84,596), it may rise further to 86,000-87,000. However, if the price falls back, it may test the support range of 82,500-81,500. Currently, the three KDJ lines are at a high position, indicating that the market is currently in an overbought state, and suggesting a strong zone in the short term. If the KDJ indicator continues to rise, it may push the price towards the 85,000 point. However, it should be noted that if the J line turns down, it may trigger a short-term adjustment. Both the DIF line and DEA line are running below the 0 axis, indicating that the overall trend is still weak, and the MACD green histogram is gradually shortening, which may mean that short selling momentum is weakening, and bulls are trying to counterattack. We need to wait for the DIF line to cross above the DEA line to form a golden cross pattern to further confirm the rebound trend.
In summary, Da Xian gives the following suggestions for reference
Short Bitcoin near 84,600, with defensive at 85,100 and target at 82,400, with a breakdown looking at 81,300.
Instead of giving you a hundred percent accurate suggestion, it is better to give you a correct thought and trend. After all, teaching a man to fish is better than giving him fish. Suggestions can earn temporarily, but learning the thought can earn a lifetime! Focus on the thought, grasping trends, planning layouts, and position management. What I can do is use my practical experience to help you, guiding your investment decisions and business management in the right direction.
Writing time: (2025-04-03, 16:10)
(Wen-Da Xian Says Coin) hereby declares: Online publication has delays, and the above suggestions are for reference only. The author is dedicated to research and analysis in the fields of Bitcoin, Ethereum, altcoins, foreign exchange, stocks, etc., has been involved in the financial market for many years, and has rich practical operation experience. Investment carries risks; proceed with caution. For more real-time market analysis, please follow the official account Da Xian Says Coin for discussion and exchange.#美国加征关税