Mark Minervini turned thousands of dollars into a 33500% return over five years. He won the U.S. Investment Championship on his first attempt with a 155% return 🥲😍. After participating a second time, he broke the historical record for the $1000000+ category with a 334.8% return~ Mark never hesitates to share his trading methods; he says he has been using the same trading strategies and methods for many years and is now very skilled at trading. What he is doing now is exactly the same as what he did in the past/ He decided to participate in the U.S. trading competition for the second time to prove that his trading methods can withstand the test of time, even if the market and targets are different, it does not affect its profitability!!

Mark believes that trading is a serious business involving real money, and one must have a well-thought-out battle plan before trading; one cannot fight without preparation. His battle plan is a highly precise method called Specific Entry Point Analysis Strategy, also known as SEPA!! The purpose is to filter out extremely strong stocks that are in an upward trend both fundamentally and technically, and to enter at the correct price and time. Through a strict risk mechanism, one can most efficiently obtain considerable returns~

The first step in entering a strategy is to filter out candidate trading targets that meet one’s trading system through specific criteria, and then wait for the catalyst to appear and follow the trend!! Filtering is taken literally, through setting some criteria to filter out unwanted signals. If the net is too wide, many unsuitable fish will slip through; if the net is too tight, good targets may also be filtered out. Therefore, we need our own filtering standards/ The Tradingview filter discussed in the channel is currently the best tool available. It has filters suitable for various targets and can automatically filter based on our criteria, making it very efficient!

The movement of stocks generally goes through four stages: accumulation, advancement, distribution, and decline!! The vast majority of strong stocks must go through the accumulation stage, confirming entry into the advancement stage before starting to rise sharply. Do not rush to enter during the accumulation phase; our goal is not to buy at the lowest price but to enter at the correct price~

Mark has a trend template for selecting targets. The first requirement is that both the price and the 50-day moving average must be above the 150-day and 200-day moving averages, showing a bullish arrangement!! The second requirement is that the 200-day moving average must have been in an upward trend for at least a month; four to five months is even better/ The third requirement is that the current price must be at least 25% higher than the 52-week low, and ideally, it can exceed 100%/ The fourth requirement is that the current price must not exceed 25% below the 52-week high; the closer to the new high, the better. This trend template can roughly filter out over 90% of impurities, leaving us with targets that we subjectively believe are already in a strong advancing trend!

Next, we can understand their fundamentals and wait for the catalyst to appear!! For example, the launch of a new product, important regulatory approvals, positive changes in the company or industry, signing major contracts, breakthrough and disruptive technologies, new solutions, etc. These are often key factors that can drive stock prices up/ We can compare some targets with the fundamentals and technical aspects of similarly strong stocks in the past, which can give us a rough expectation of the subsequent trend. In the end, we only need to focus on the most promising few and wait for suitable entry opportunities!
The second step is to wait for the price to show a specific volatility contraction pattern, known as VCP, which stands for Volatility Contraction Pattern. This is a consolidation pattern where the price fluctuation range and trading volume gradually contract, especially during a strong trend. The longer the consolidation time, the larger the subsequent fluctuation range! There are two commonly effective VCP models. The first is the classic triple bottom VCP/ When the market is in a strong upward trend, it encounters resistance and falls back to form a swing low, then begins to consolidate. As trading volume and price fluctuations gradually shrink, the lows keep rising, ultimately forming a standard triple bottom! This relatively horizontal or descending convergence trend is usually a continuation of the upward movement, with a high probability of further increases. Breakouts during this time typically see both volume and price rising/ Sometimes false breakouts or breakout failures occur, leading to a triple bottom correction, which means forming a new low again. Therefore, we should set stop-loss orders away from the last low; it is better to set them at the lowest price of the breakout candlestick to reduce losses, or at least below the second low to prevent triggering the stop loss!

The second type is the cup and handle pattern, which generally takes a longer time to form. It first has a U-shaped bottom indicating that the price starts to steadily rise after a wave of decline, usually accompanied by a decrease in trading volume!! After the cup is formed, the stock price enters a shorter consolidation range, which is the handle, and the trading volume will further decrease during this stage. The key to the cup and handle pattern is to identify the breakout at the handle position, which must be accompanied by an increase in trading volume~

PAG stock is a classic example!! After more than a year of continuous rise, the stock price began to decline in mid-May 2021, then rose again in early July, and the chart began to form a U-shaped cup pattern. After August, it continued to fluctuate in a narrow range, forming a cup and handle. Mark entered the market on September 1st when it broke out with significant volume, and the increase was very considerable; it can be seen that the price has not returned to this level since then~

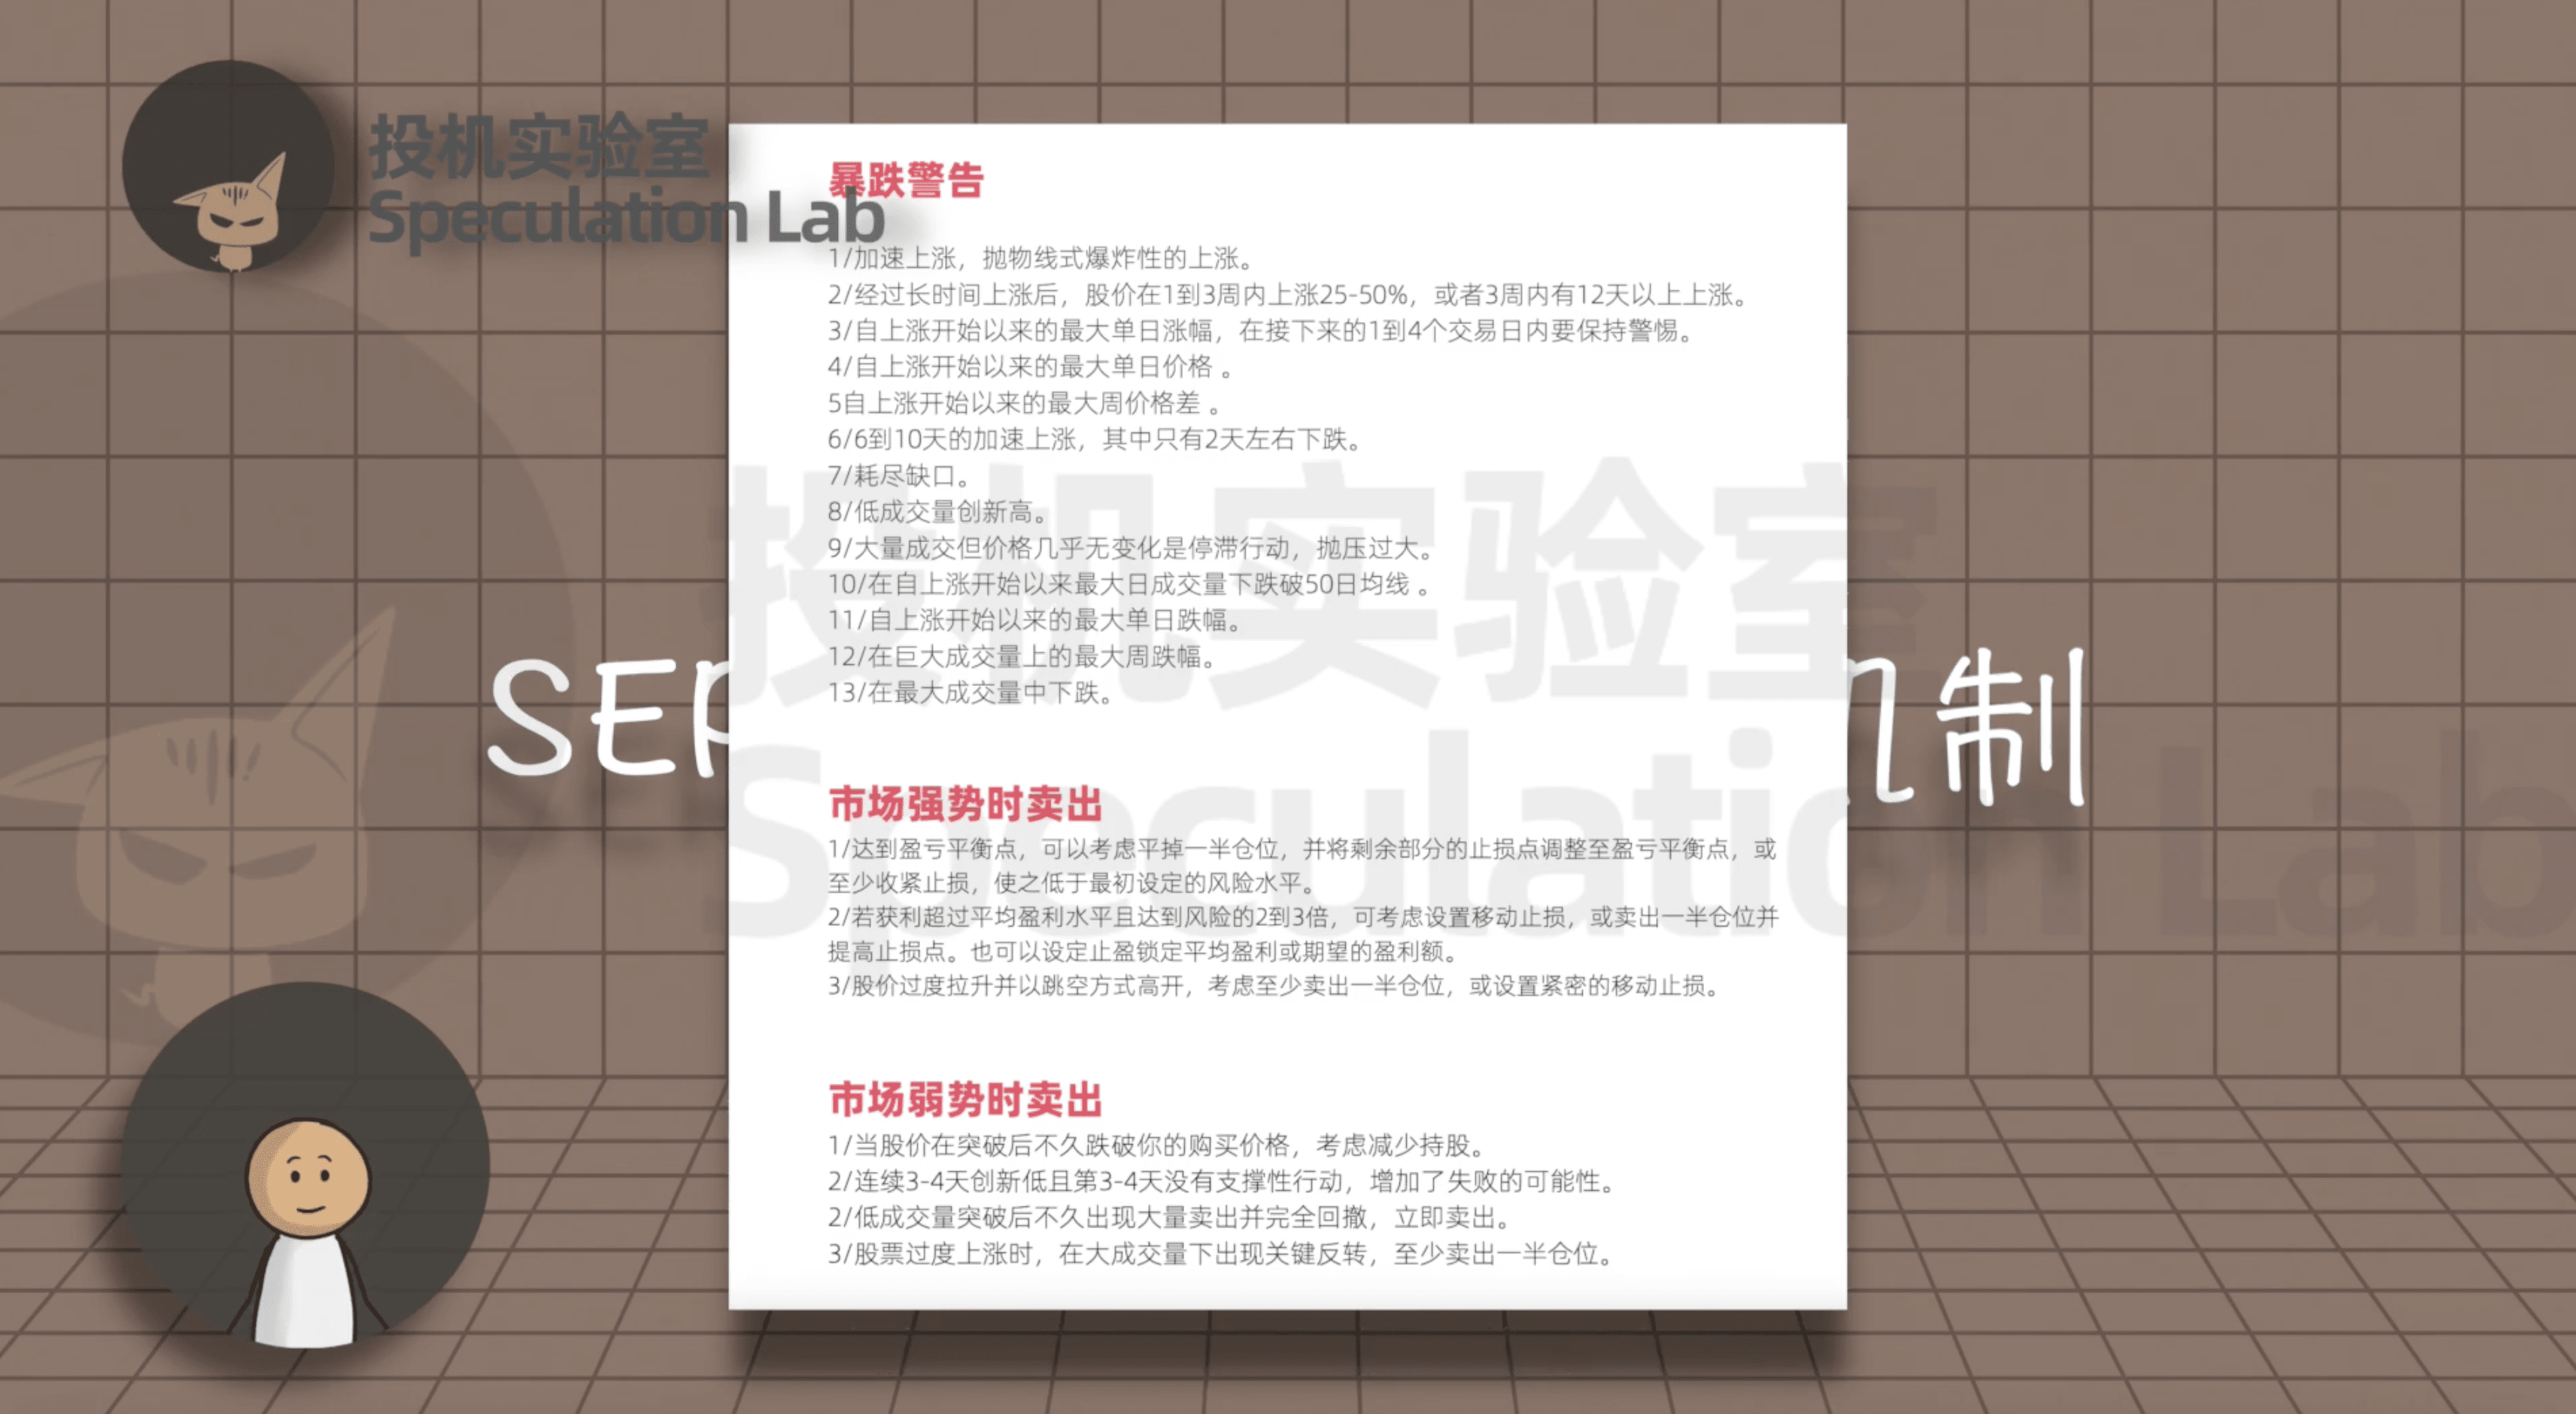
The key to the success of the SEPA strategy lies in a detailed and strict exit mechanism!! This is a selling standard he summarized based on years of trading experience, determining whether the market is strengthening or weakening, as well as selling alerts before major declines. You can save these as a warning~