The Trading Channel is very very famous in the foreign trading community, with over 3 million fans online. He has studied many strategies, but he said this intraday trading strategy is the most effective trading method he has used in his 10-year trading career!
This is a cash printing machine that has always helped him make profits, and the name of the strategy is CEST~
CEST is an acronym, where C stands for conditions, indicating entry conditions; E stands for entry, indicating entry mode; S stands for stop, indicating stop loss; and T stands for targets, indicating profit targets!

This strategy uses a free TradingView indicator and a very specific set of operational details that you can use as a checklist before placing orders!! The strategy requires reference to both large and small time frames. The first step is to use the larger time frame to determine the direction of the trading trend, using the EMA50 moving average and the continuous high and low points to judge the trend~ It is clearly stated that trading should not be conducted during consolidation periods or unclear trends, as a clear trend is very important!

Taking Bitcoin as an example, we choose the 4-hour chart to judge the trend of the larger cycle. Open the indicator search bar, input EMA, click to save and add it to the chart!! Set the time length to 50 and the color to white. When the price is above the EMA50 moving average and there are continuously higher highs and higher lows, both conditions being satisfied allows us to consider that the current trend is upward, and we can look for buying opportunities in the upward trend~ We can find opportunities to buy in the direction of the trend after a higher high is broken and the price retraces to the previous peak~

The conditions for a downtrend are when the price is below the EMA50 moving average and there are continuously lower highs and lower lows. When both conditions are satisfied, it can be considered that the current trend is downward, and we should look for selling opportunities in a downtrend!! We can find opportunities to sell in the direction of the trend after a lower low is broken and the price rebounds near the previous trough~

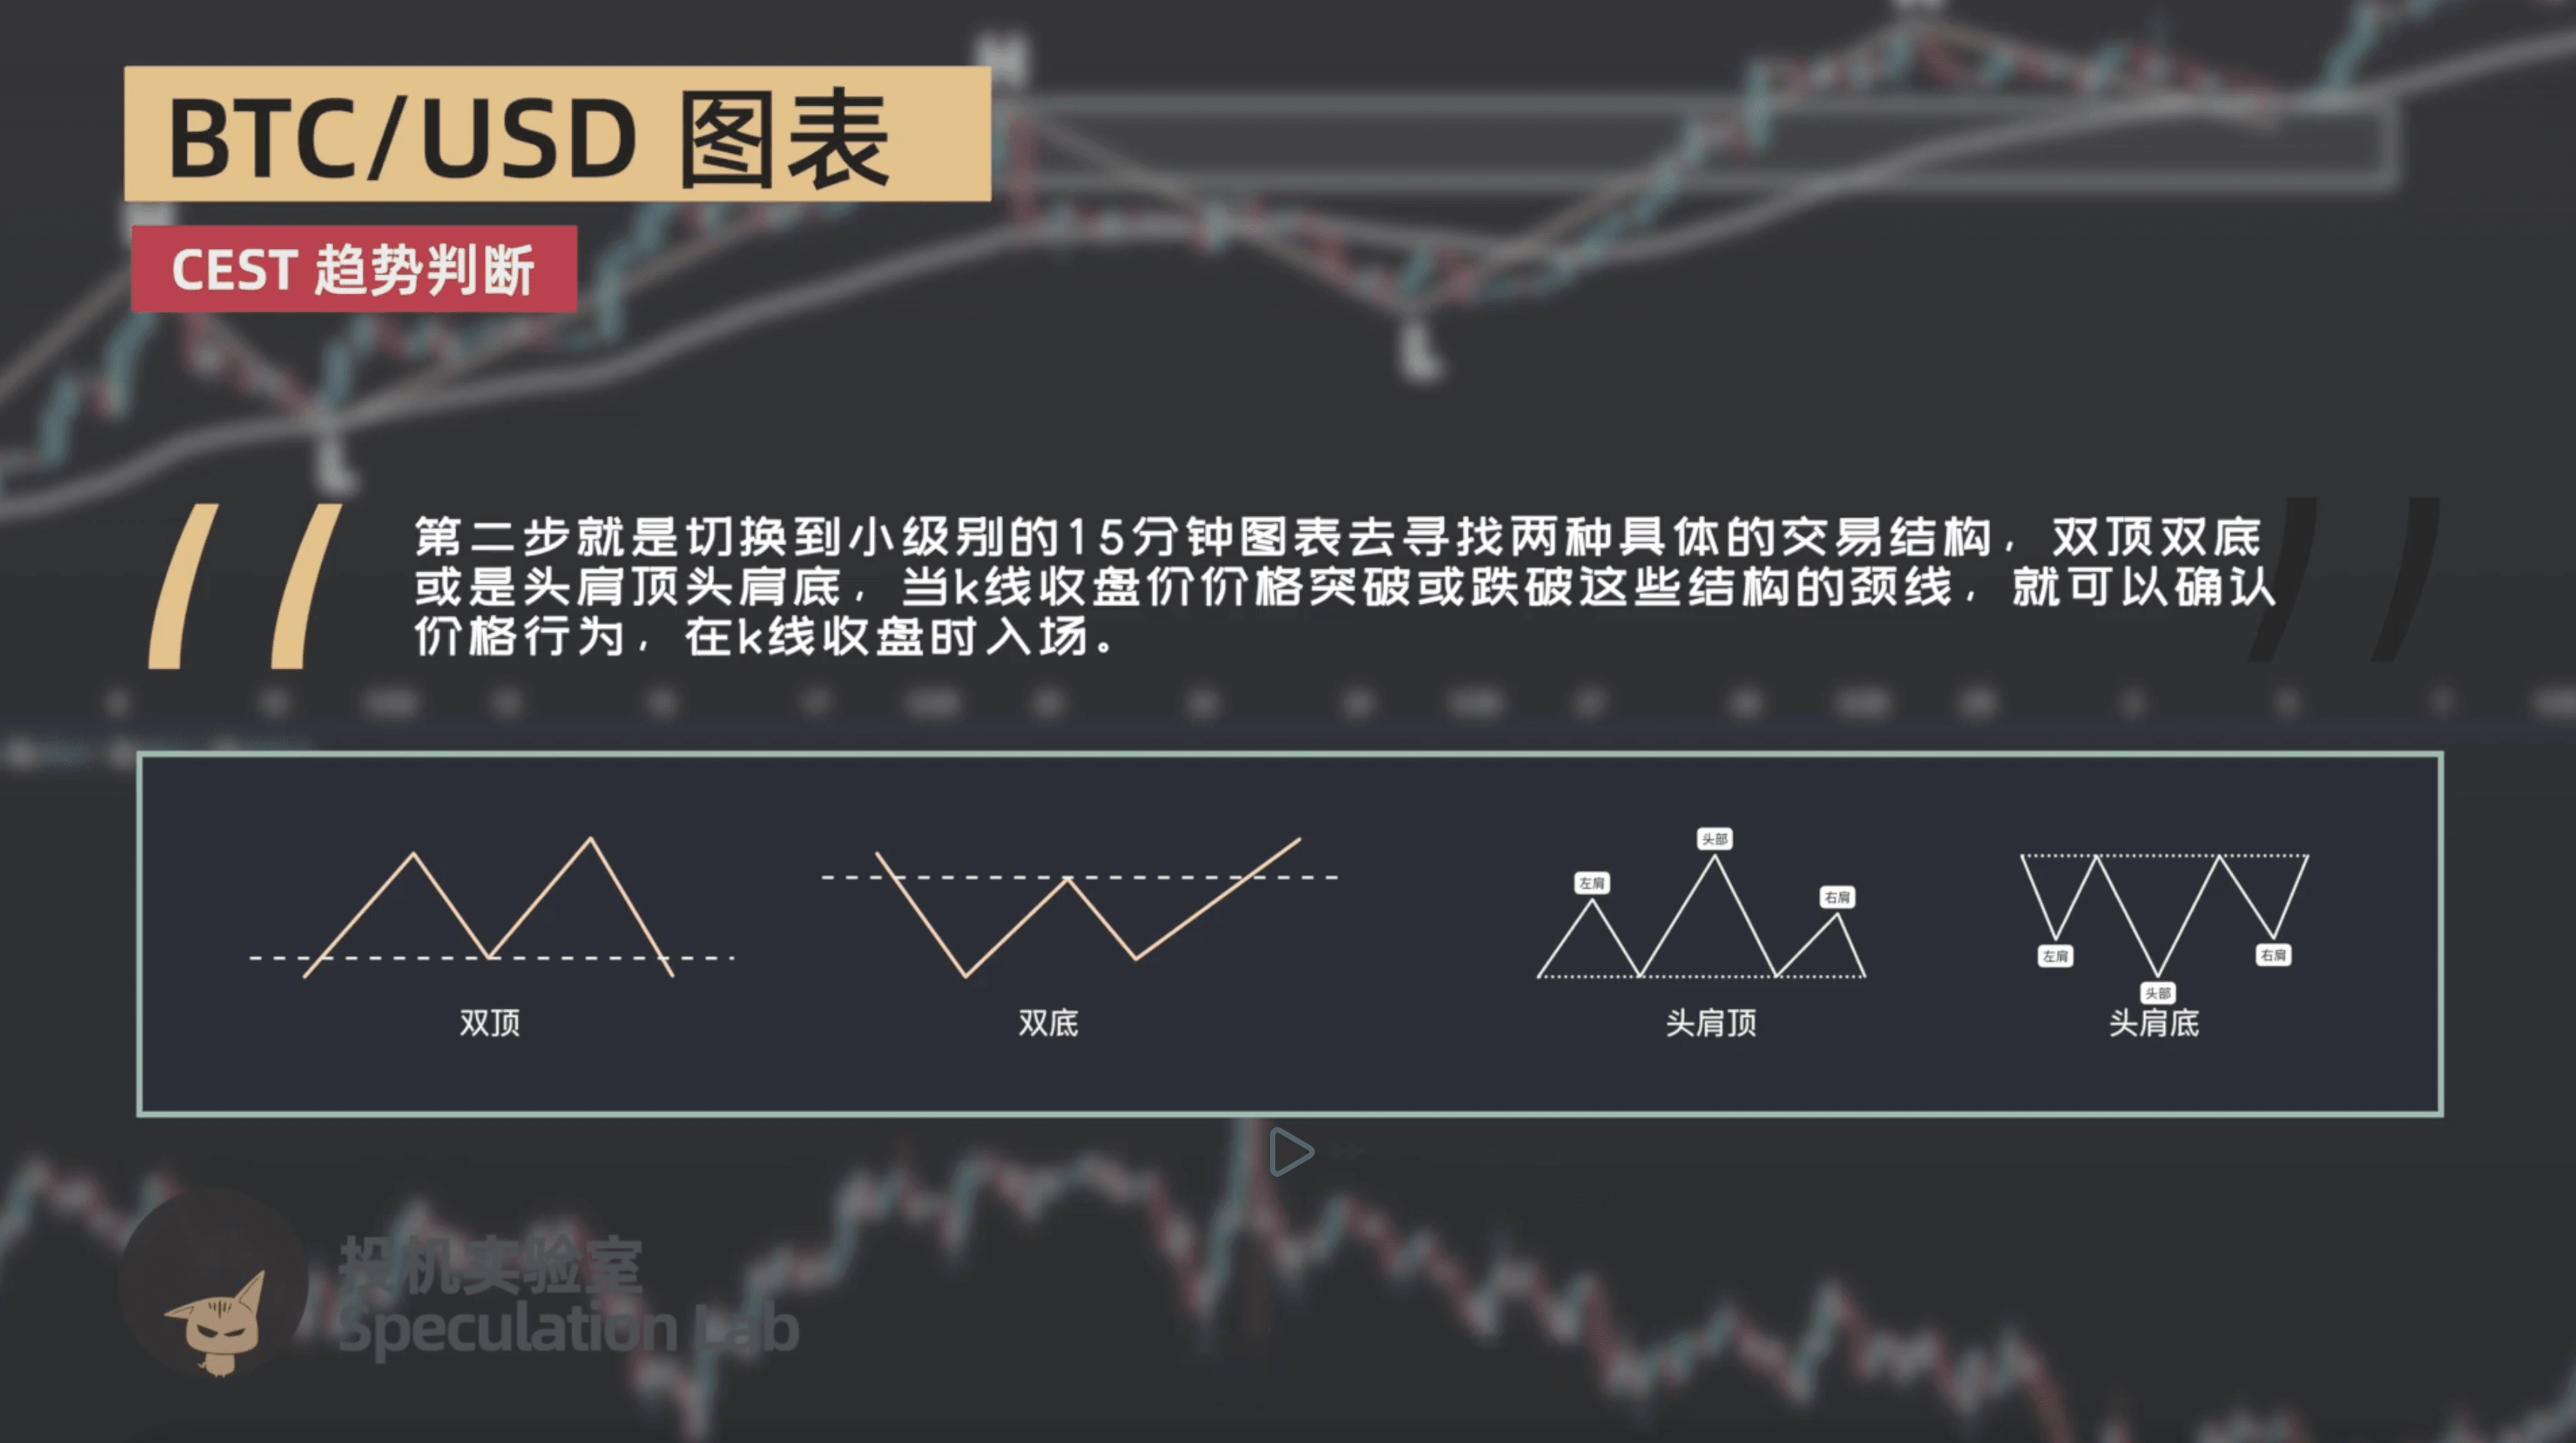
The second step is to switch to a smaller 15-minute chart to look for two specific trading structures, either double tops or double bottoms or head and shoulders patterns. When the closing price of the candlestick breaks through or falls below the neckline of these structures, we can confirm the price action and enter at the closing price of the candlestick!! The current trend shows a clear double bottom structure, and when the price breaks through the neckline, we can enter a long position at the closing price of the candlestick~
Now let's look at an example of a head and shoulders pattern. First, observe the Bitcoin 4-hour chart, where we can see that the current price satisfies both being below the EMA50 and showing consecutive lower highs and lower lows!! This indicates that the current large-scale trend is downward, and we should look for short-selling opportunities when the price rebounds~ Next, switch to the 15-minute chart, and we can see that this trend has formed a clear head and shoulders structure during the rebound. When the closing price of the candlestick falls below the neckline, we can choose to enter a short position at the closing price of the candlestick!

The third step is to set stop loss and take profit. We can set stop loss and take profit based on the structure of the trend and the trading position!! The stop loss can be set near important support and resistance levels, supply and demand zones, previous highs and lows, and the ends of double tops, double bottoms, or head and shoulders patterns, etc.~ The take profit can also be set this way, or we can choose to take profits in batches or use a fixed 1:1.5 risk-reward ratio, which is very simple. This is the framework process of the CEST trading strategy!

To summarize the CEST strategy, C indicates entry conditions, which means observing the EMA50 and the high and low points in the larger time frame to determine whether it meets the long or short entry conditions; E indicates entry mode, whether it is a double top, double bottom, or head and shoulders; S indicates stop loss; and T indicates profit target!! This is a trend-following strategy that focuses on large trends and is relatively easy to capture major trends, just like this year's market~ At the same time, this strategy is highly compatible and can be combined with indicators like Fibonacci, MACD, etc., as resonance signals can greatly enhance the win rate!
