The ICT trading strategy has been very popular in the past two years, and the evangelist, The Inner Circle Trader, has attracted millions of followers online. However, the strategy is relatively complex, so you must combine it with this indicator that covers all core concepts of ICT for use 😍😘. Combined with my family trading strategy, you might be able to quit your job by the end of the year, and you'll become a skilled ICT trader! Make sure to save this!! In one sentence, the ICT trading strategy is a comprehensive trading method that identifies liquidity order blocks, supply value gaps, and other areas using market structure and specific time periods to find buying and selling positions, while also incorporating multi-time frame analysis and risk management~

The ICT Concepts indicator combines all the concepts emphasized by The Inner Circle Trader into a tool that can automatically identify and label ICT areas. With it, it's like having a cheat sheet for mastering the ICT trading method!! We open the indicator search bar, enter ICT Concepts, and click to save and add it to the chart~ The default operating mode of the indicator is current, which can display data within 500 candlesticks and is similar to our manual marking of ICT areas. Switching to historical mode allows us to view previous market structures, but the downside is that the chart may become quite cluttered/ The length of the market structure indicates the lookback period, with a maximum of 10; the greater the length, the larger the range!

MSS is a term for market structure shift, typically indicating a potential change in market trend. For example, in an uptrend, MSS usually consists of higher highs and higher lows!! When the market forms a new low below the previous low, it may indicate a shift in market structure, suggesting that the uptrend may end, while the opposite is true for a downtrend~ Bos refers to specific price levels or areas that break market structure. Once this structure is broken, the area may become future support or resistance. The displacement function will label when the price continuously forms the same bullish or bearish candlestick with large bodies and short shadows!

Order Blocks, abbreviated as OB, refer to the price range typically formed by one or several candlesticks, which is where large institutional funds may place a significant number of orders!! Bullish order blocks are usually found at local bottoms during an uptrend, while bearish order blocks are located at local tops during a downtrend. Marking out the order block implies an expectation that the price will return here again, providing good trading opportunities. Its usage is similar to the supply value gap~ The lookback period refers to the past time units or number of candlesticks needed to determine swing points. It shows the last bullish OB and the recent number of bullish order blocks on the chart, followed by the recent number of bearish order blocks. Historical polarity changes will be tagged at the locations of previous swing highs and lows!

Using the body of the candlestick means using the body of the candlestick as the order block area, rather than a range!! The liquidity Margin refers to the distance or margin between the liquidity area and the actual price, which can help traders determine the size or range of the liquidity area, indicating the price levels where market participants might place limit orders and stop-loss orders~

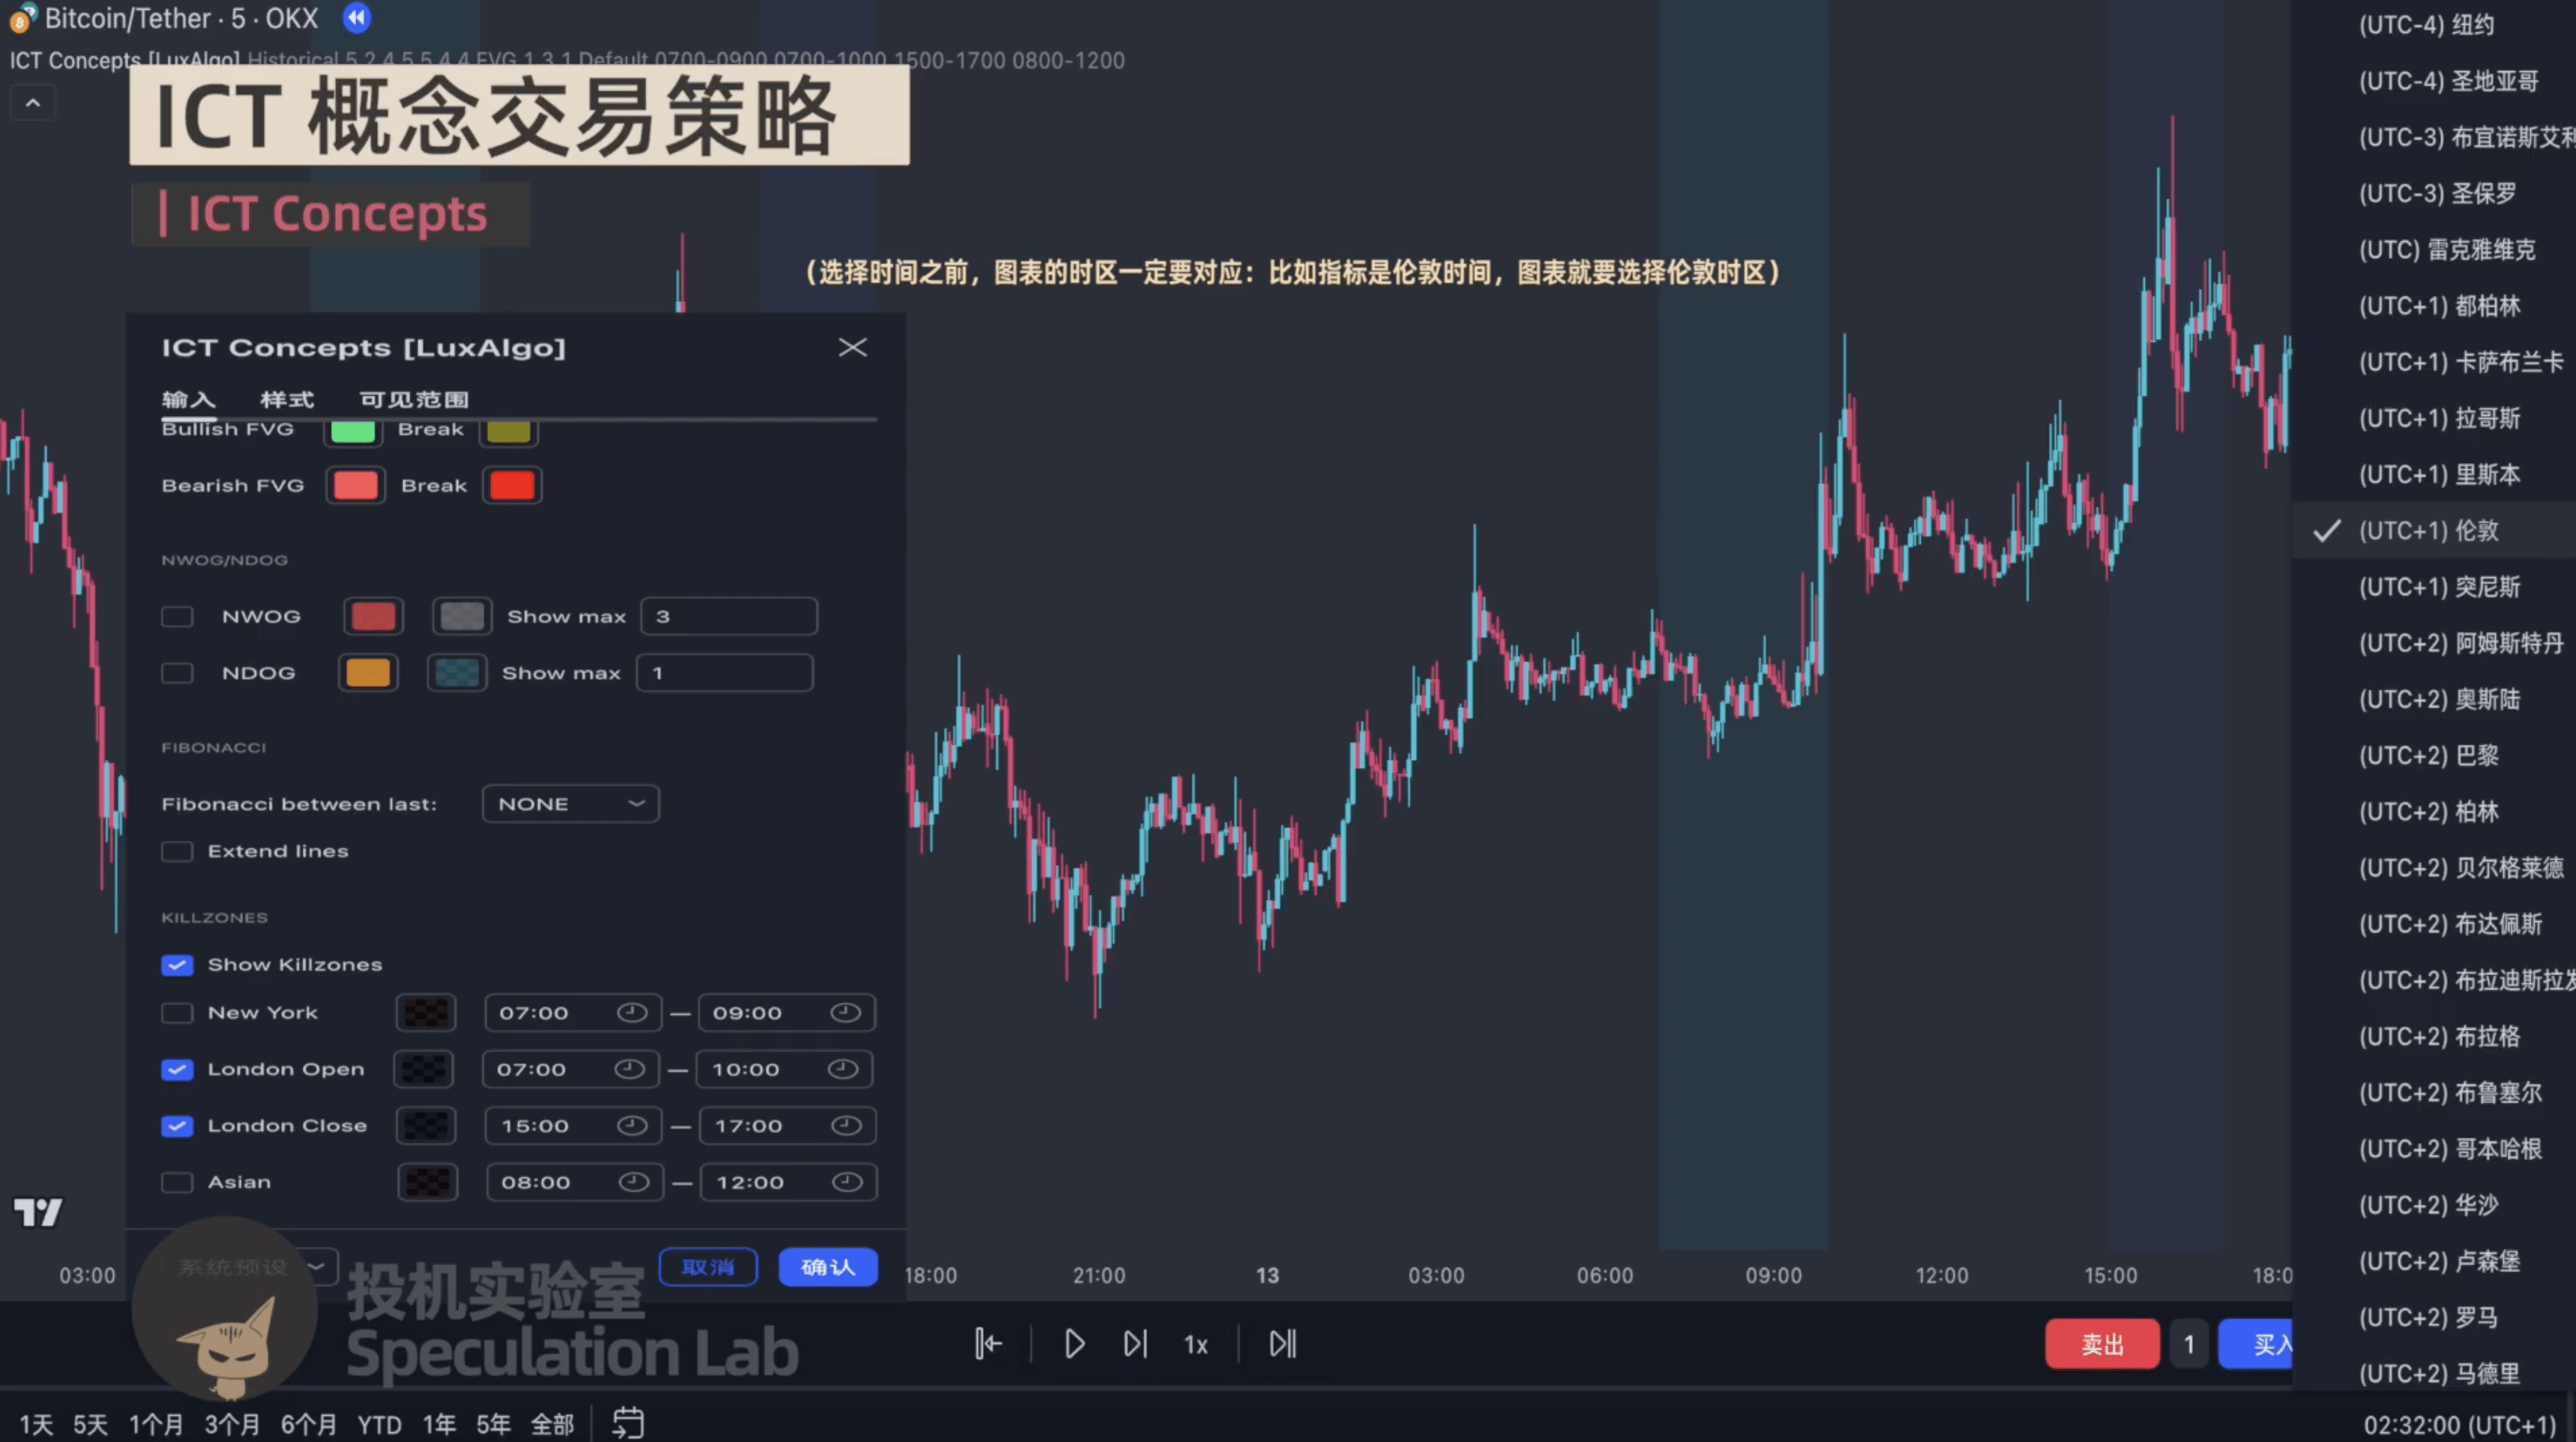
The fair value gap (FVG) will be explained in detail in the later strategies. The indicator can now automatically mark it, which is very convenient. The maximum number of visible FVGs in the same trading direction is 20!! NWG and NDOG represent the new weekly opening gap and the new daily opening gap respectively. These two functions are not easy to use in the cryptocurrency market and can be ignored~

If the built-in Fibonacci tool is opened, it can automatically connect two recent upward or downward structural areas. For example, if we choose OB, the indicator will automatically connect the Fibonacci levels between them from left to right!! The ratios are automatically set to 0.236/0.382/0.5/0.618/0.786/1/1.618, etc. These levels can serve as potential support or resistance, and prices may react at these levels~

The last one is Killzones, which refers to specific time periods that are usually considered moments when trading activity increases and potential turning points are likely to occur. This is very important for both forex and cryptocurrency markets!! Different assets may exhibit different volatility during different periods. Finding trading opportunities during a time period that is liquid and likely to have turning points is key~ However, the cryptocurrency market seems to lack clear time boundaries, which requires everyone to define and look for patterns themselves, such as noticing significant volatility around the recent opening of the US stock market!
The ICT strategy involves three trading steps. Next, I will explain the trading rules using examples!! Open the one-hour chart of Bitcoin. The first step is to find an ascending N structure. An uptrend actually consists of multiple ascending N structures that form higher highs and higher lows~ When the price exceeds the first high and clears the liquidity above, we can move on to the second step, switching to a smaller 5-minute chart. If the closing price of the second candlestick that encounters resistance falls below the lowest price of the previous candlestick, we can look for a fair value gap (FVG)!

There are roughly three types of FVGs, and in the cryptocurrency market, only the first type is generally used!! This type of FVG is formed by three candlesticks, where the non-overlapping part of the middle candlestick's body with the adjacent candlestick's shadows creates a gap. This gap indicates a sudden decrease in trading activity within this price range, forming a one-directional gap that may be filled at some point in the future~

The third step is to find entry and exit positions. If the price range of the gap is large, when the price returns to the gap area, the directions of long and short positions should be opposite. We can enter a short position at the lower edge or middle of the gap, with the stop loss set near the upper shadow of the gap candlestick!! We can also enter at the upper edge of the gap, with the stop loss set at the swing high, and the take profit can be a fixed ratio, such as 1:2, or near the previous high on the hourly level. The trading steps for long positions are the same, just in the opposite direction~ This is the method used in ICT trading strategy, very simple!! The strategies and tools are provided to you. If you are considering using them, remember to backtest at least 100-500 times continuously on the varieties and cycles you are dealing with, so that you can have a good understanding of the long-term operation of the strategy!
