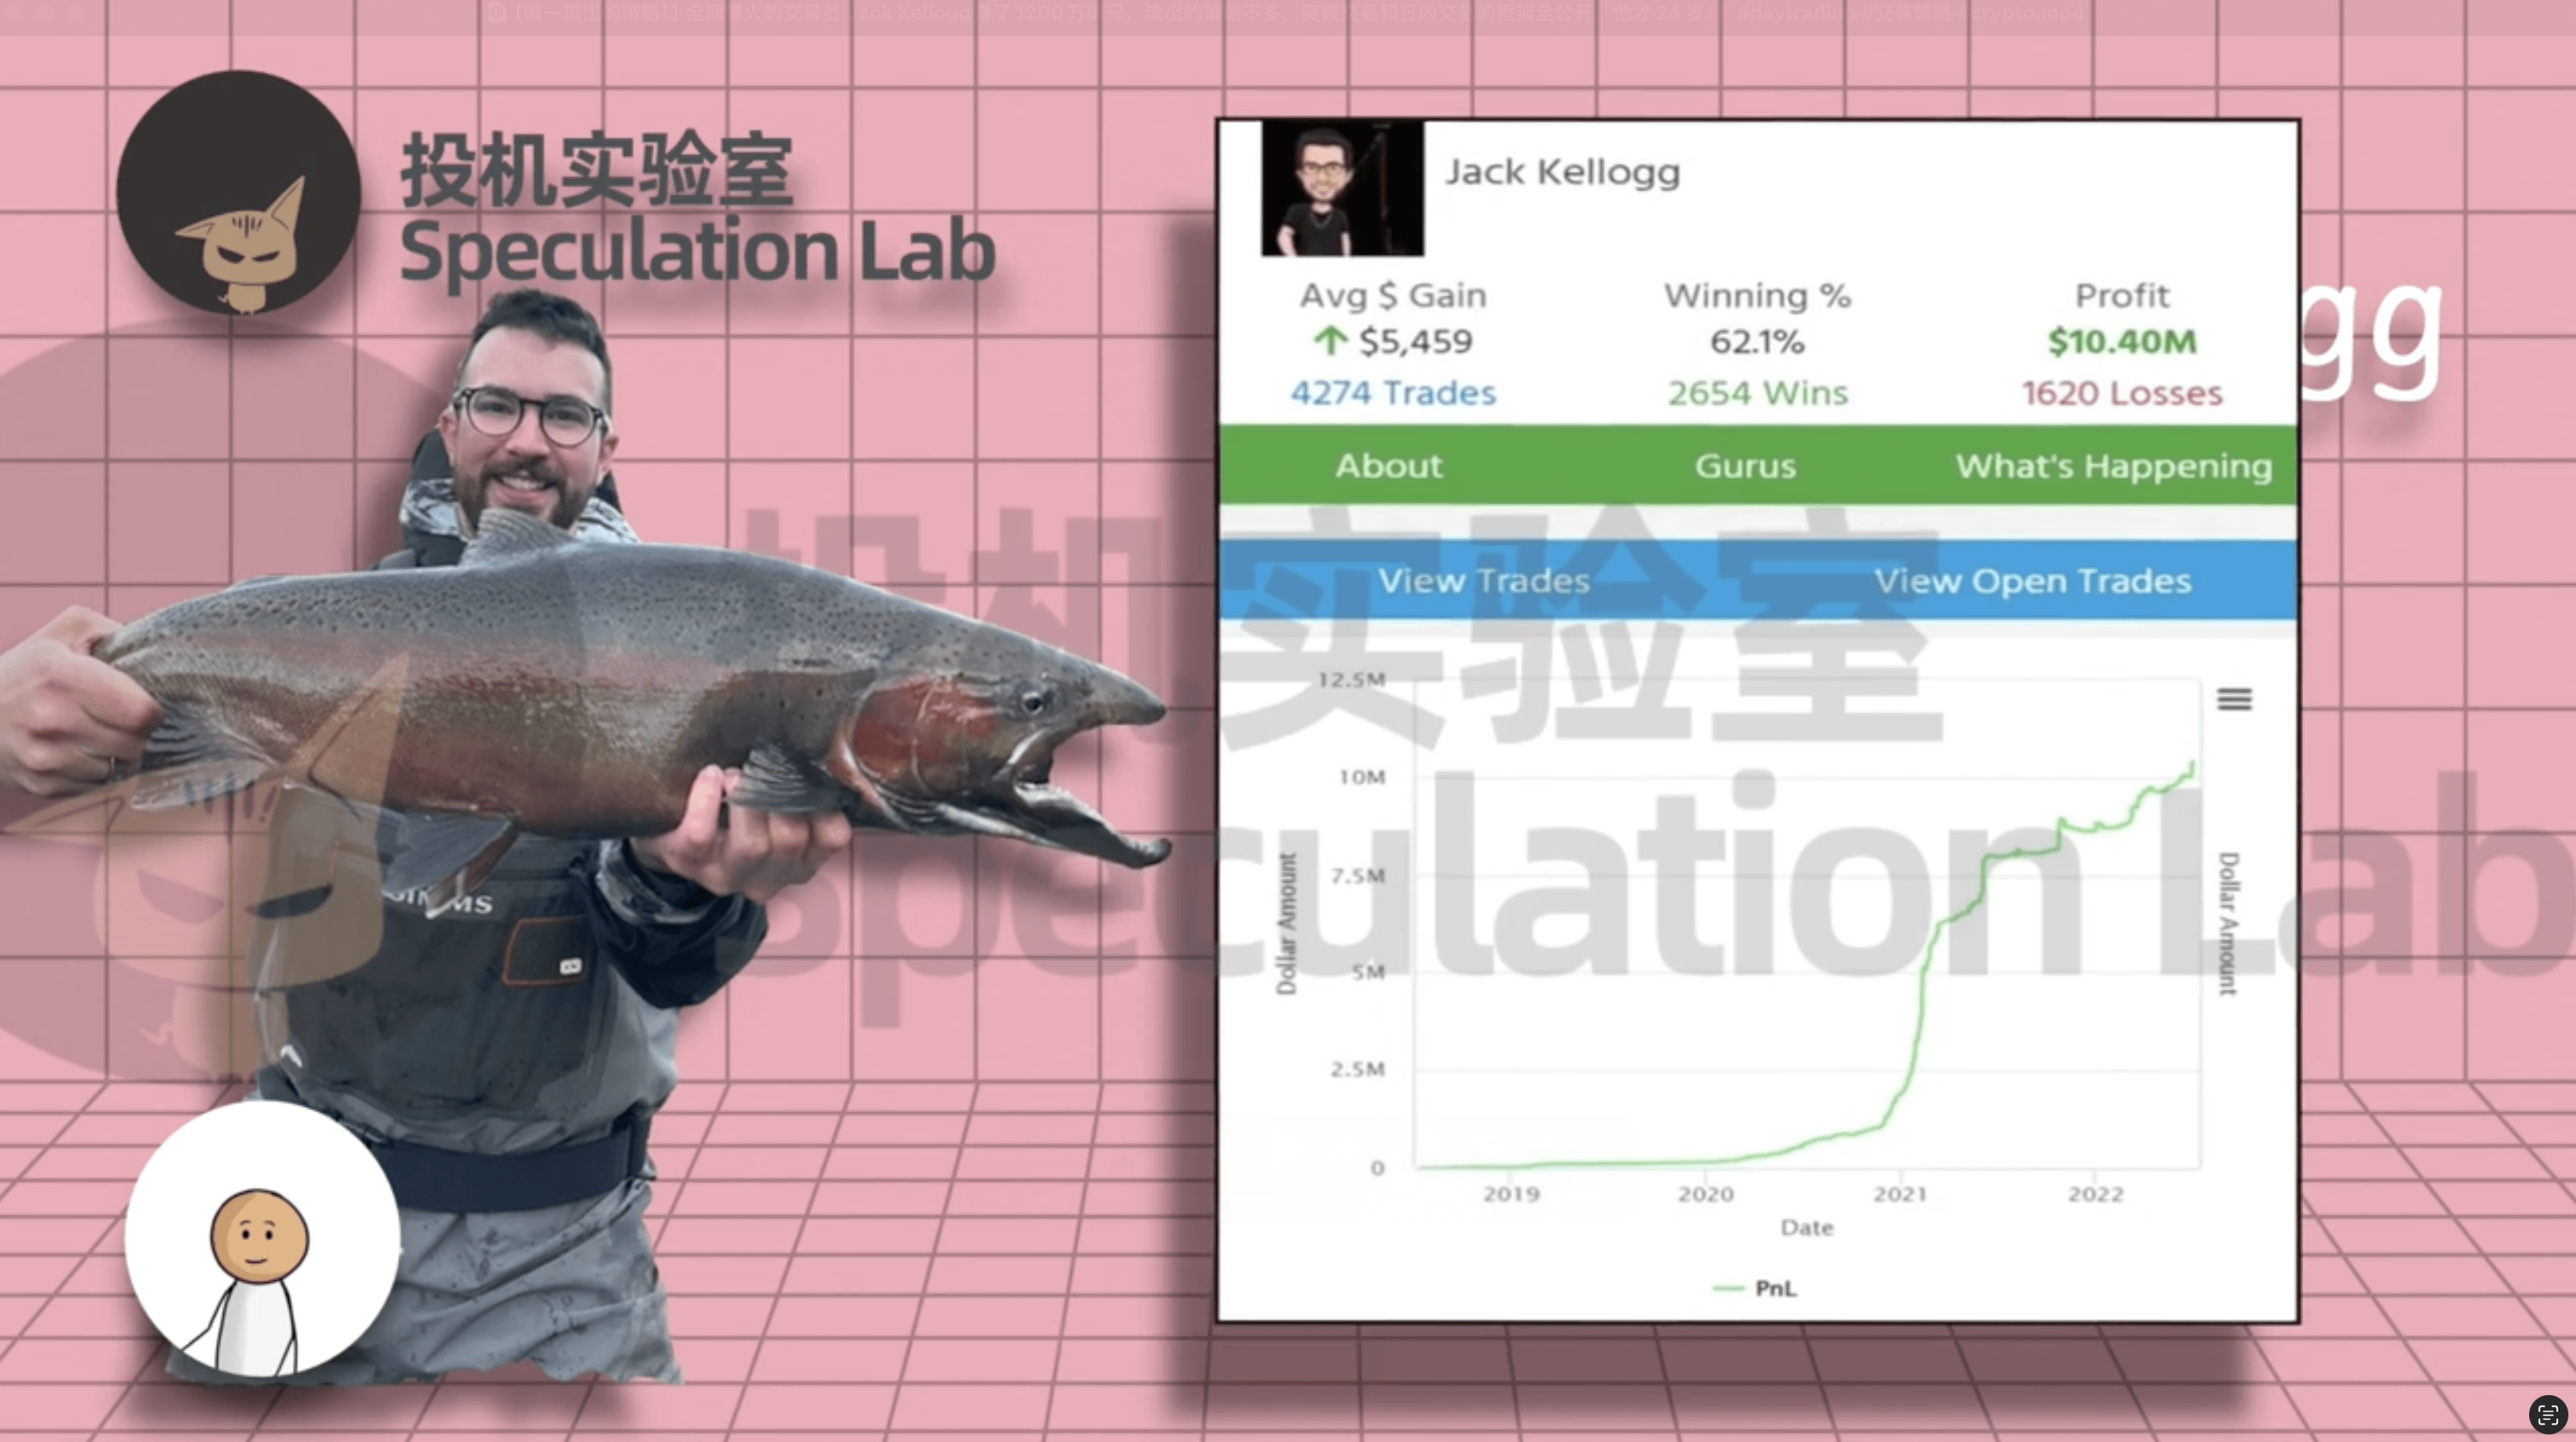
24-year-old American genius trader Jack Kellog earned 8 million in 2021, and by June 2022, his account had surpassed 10 million dollars, all starting from 7,500 dollars 😘😍 He has a lot of news coverage, but very little public content. The breakthrough and intraday trading strategies can be referenced by everyone~ This journey is actually not easy; he has experienced serious illness, fatigue, and failure, and faced various market conditions, including the bull market of 2021 and the bear market of 2022. His trading system has also become more stable and concise as he has grown. His system has a very interesting name: KISS, which means Keep It Simple, Stupid!
For breakthrough strategies, Kellogg uses the weekly and daily chart trends of the S&P 500 index or Nasdaq 100 ETF as indicators to measure the major trends! He believes that these major stock indices, especially the S&P 500, if they have been showing an upward trend for the past month and ideally set new highs in the last week or two, this stable trend is suitable for breakthroughs, and the holding time after entering will change from intraday to several days or longer~

The market is cyclical, and price movements are greatly influenced by the emotions and behavioral patterns of market traders. When prices rise, optimistic emotions will continue to strengthen until greed peaks! He likes to go long in the middle of this process, rather than waiting to catch the last penny~

Before trading, he searches for the stocks with the largest price increases of the day on platforms like Stocks To Trade, Finviz, and TradingView, and then identifies those with high trading volume as well!! Because these two are the most critical factors, indicating that the stocks are very active and have already started~ Avoid those with only 500,000 dollars in trading volume but a price increase of 300%; such prices are easily manipulated and have poor liquidity, severely affecting capital inflow and outflow. He wants stocks with trading volumes reaching tens of millions or even billions of dollars, with price increases of 50% to 100% in a short time, which can be added to his watchlist. Then he reviews their price movements over the past two to three weeks. Those that do not maintain new highs should be avoided, as well as those that break key support levels. Then he observes whether the remaining stocks have news to look for clues about price increases, assessing how long their gains can be sustained~

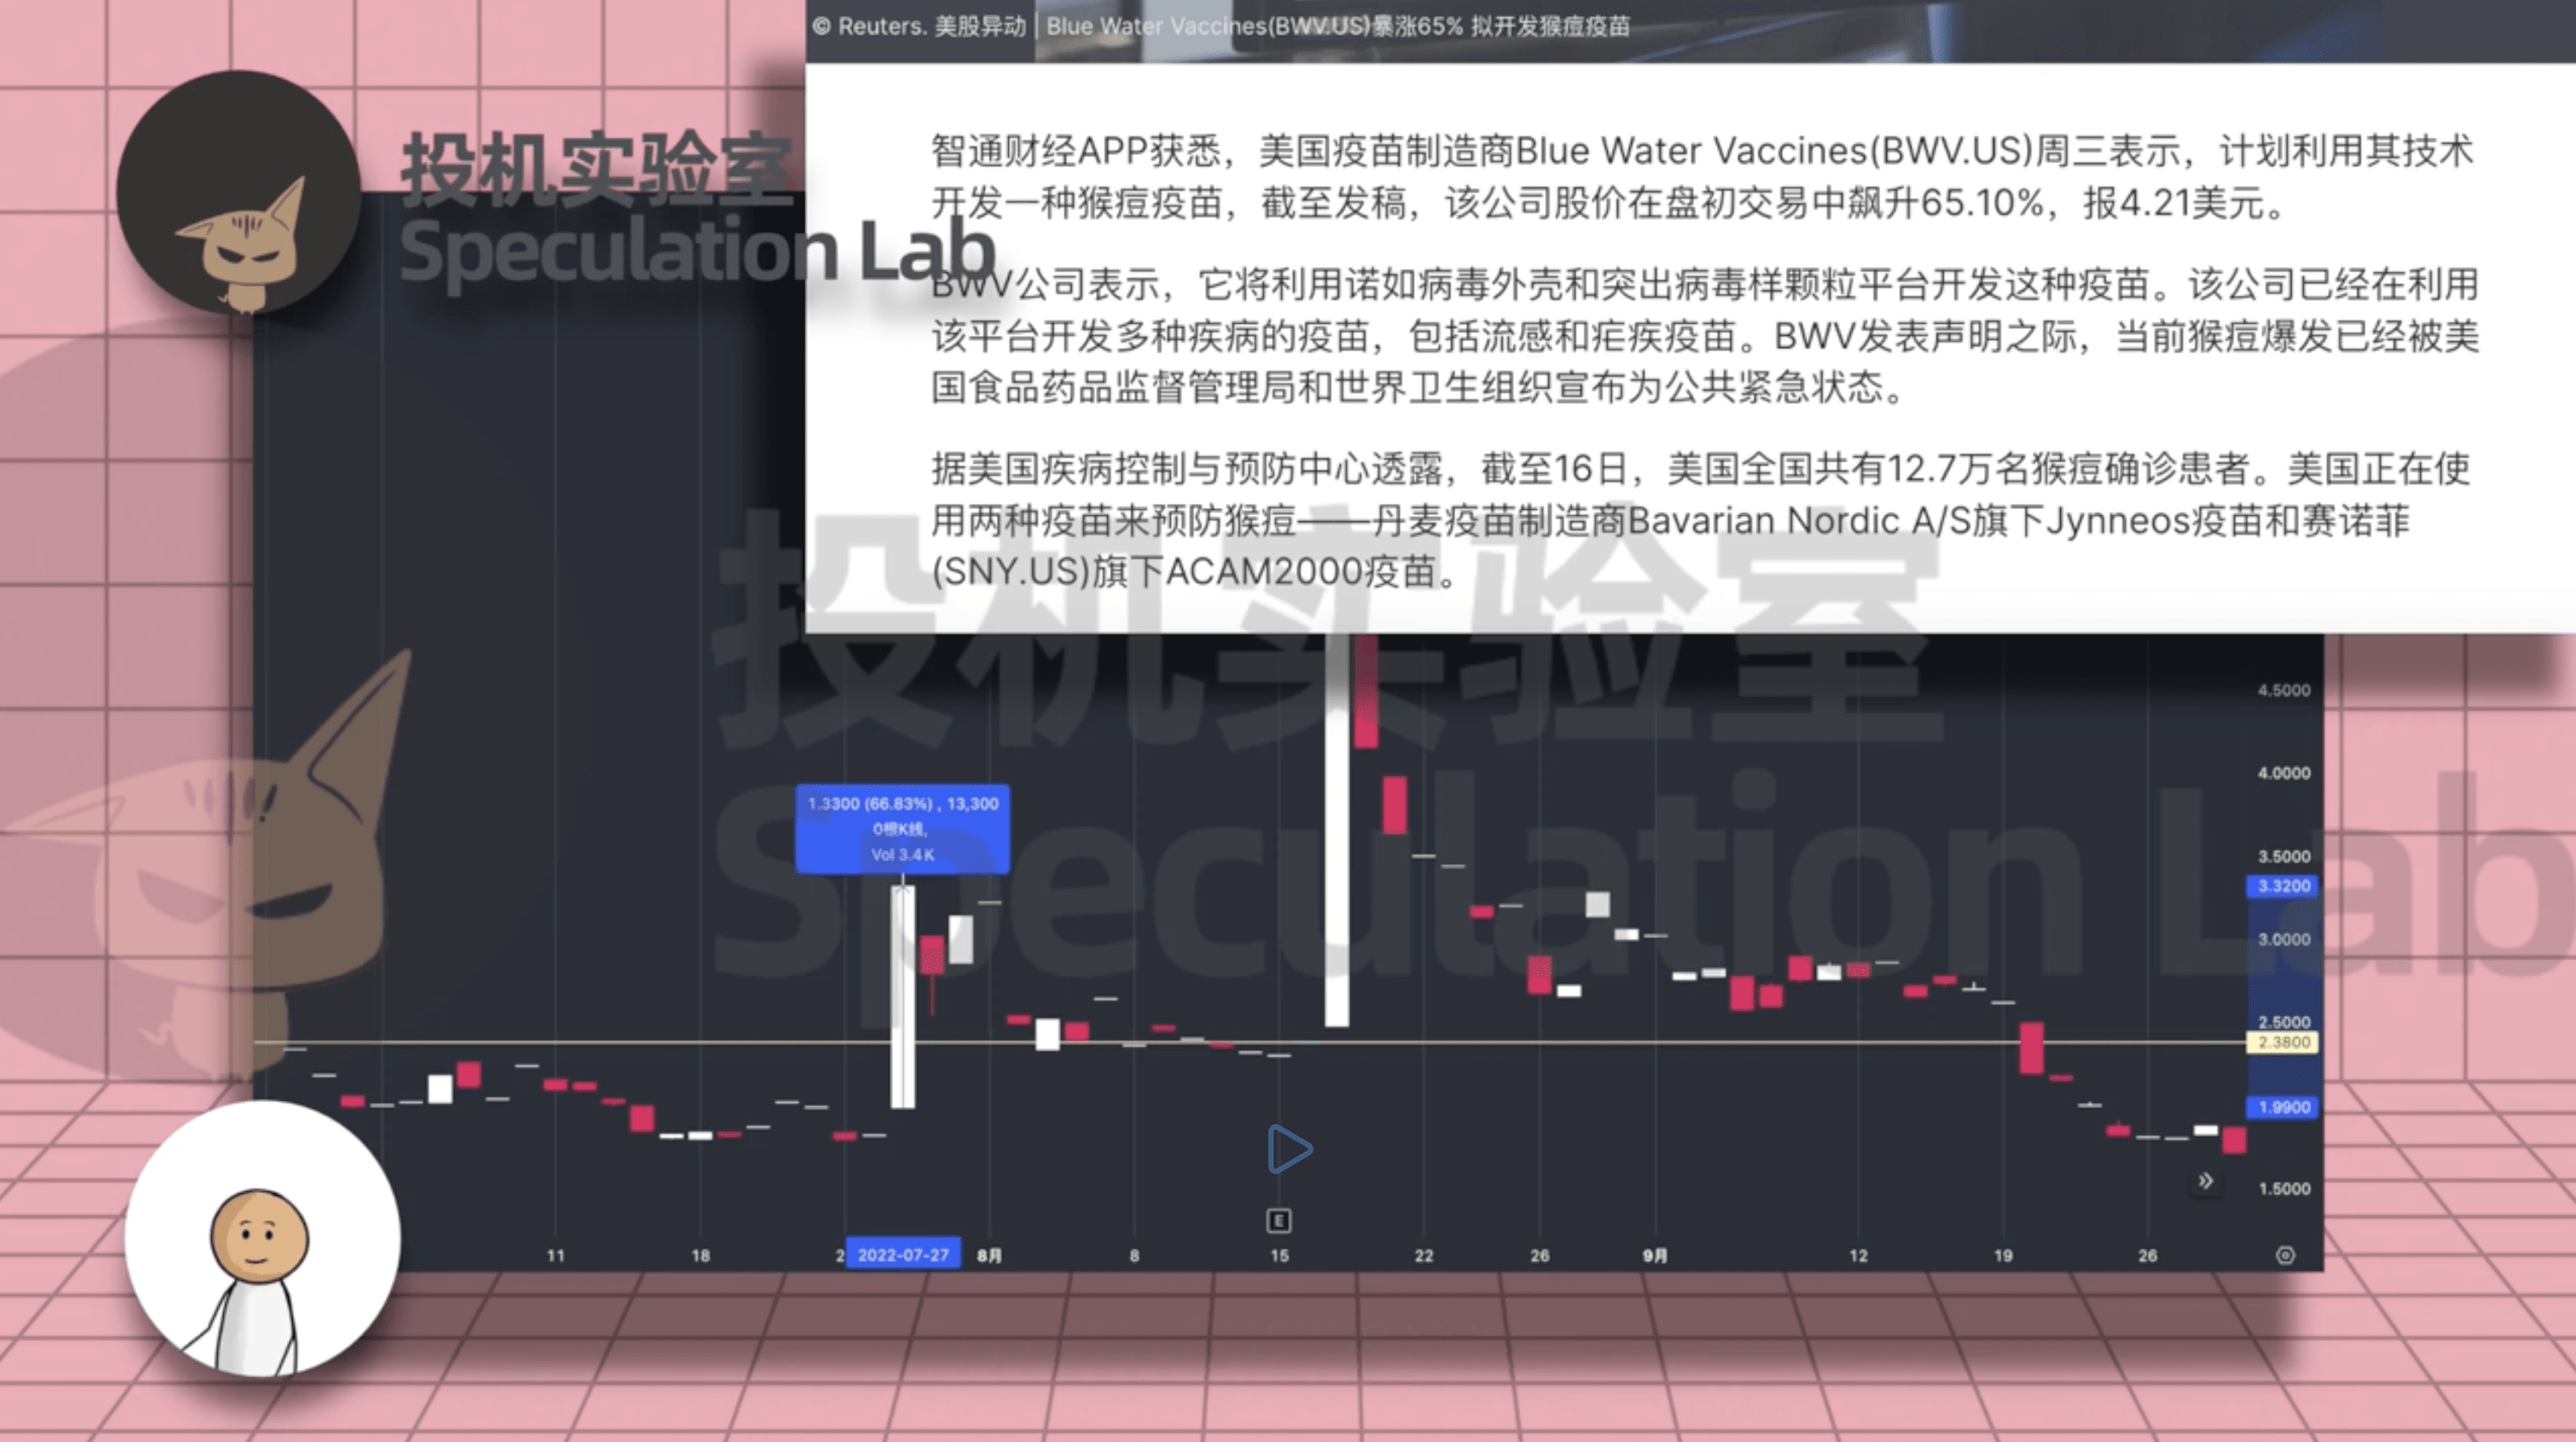
For instance, on July 27, Blue Water Vaccines' stock hit a new high for the day, but the catalyst behind this sudden surge was news about the company's development of a monkeypox vaccine plan!! Such news related to pharmaceuticals is quite complex, especially concerning research and development issues, which take a long time. This type of news can only stimulate a temporary increase, so one must be extra cautious when participating. Even if entering, one should take profits and leave~ After gaining instant profits, one can raise the stop-loss price to the entry price to prevent losses. If the impact of the news catalyst is broad, such as involving regulatory approvals, new market opportunities, and significant events, one can continue to observe their price behavior to determine if there are any high-probability patterns!
His most commonly used strategy is to make breakthroughs; specifically, he hopes that after a significant price surge lasting at least a day or two, the price will approach the high point or break through important resistance levels with increased volume!! When the weekly and daily charts of the S&P 500 index or Nasdaq 100 ETF show irregular trends, he will focus on intraday trading! Kellogg frequently uses the Volume Weighted Average Price (VWAP) indicator, which considers both trading volume and price, showing the market's average price over a specific period. He has set a rule for himself: if the price is above the VWAP line, he cannot enter a long position; conversely, if the price is below the VWAP line, he cannot short. He also uses this indicator to decide when to close positions, for example, if he shorts a stock at 9 dollars while the VWAP is at 7 dollars, he will exit or lock in profits at that price~

Kellogg also uses trading volume as an observation indicator for potential reversals. When he sees a large volume of trades, he can judge that many people are buying in, chasing the price, and many are on the wrong side!! Therefore, if there is a surge in trading volume near the day's high or a large volume of trades in a densely traded resistance area, he can short. We can pay attention to how many times the price reaches a certain level and the time spent at that level to assess the strength of that position~ Although this is not precise, he believes that if the price stays at a certain position for 30 minutes to an hour, it indicates that the resistance there is very strong~
