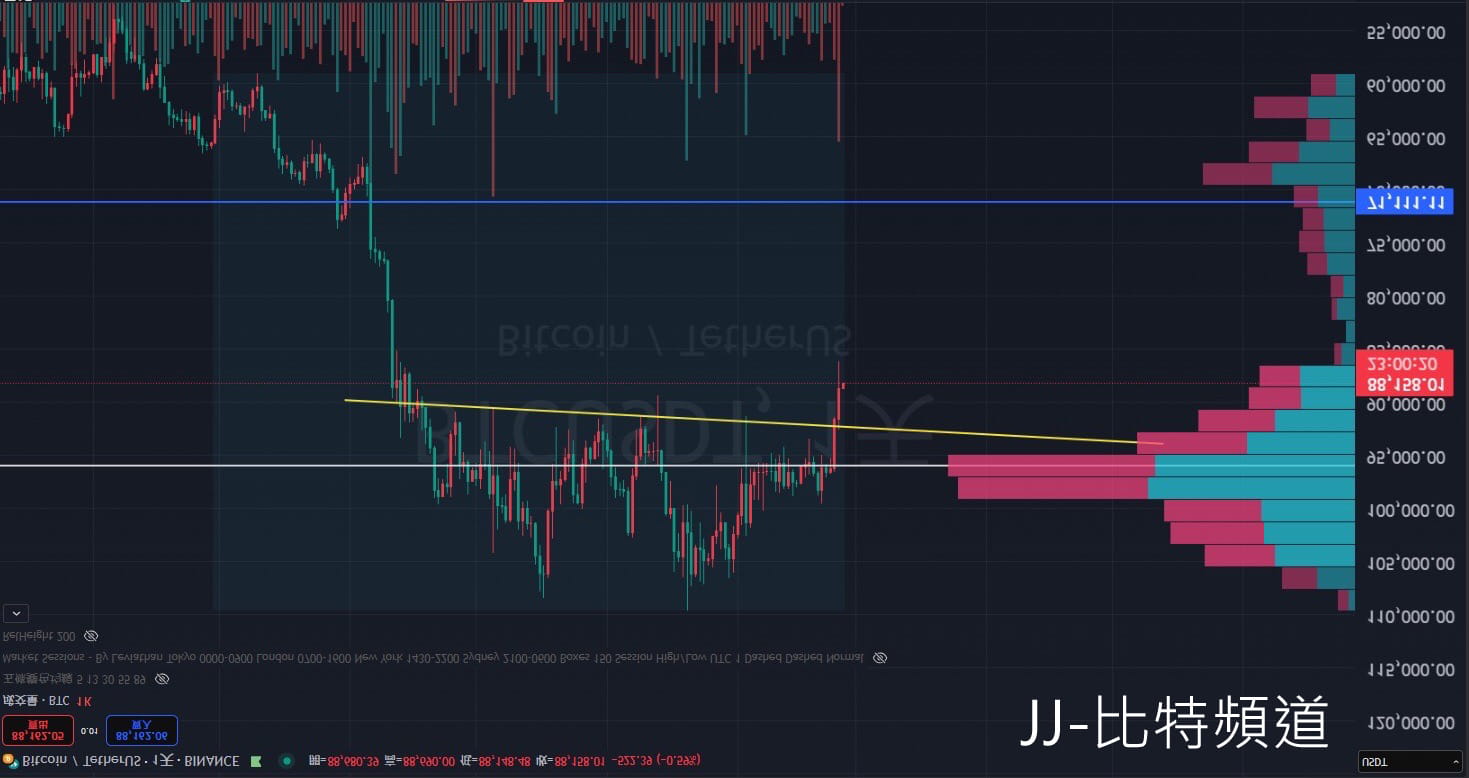
First, looking at the first chart, it shows an extremely precise W-shaped bottom structure, successfully breaking through the neckline and reaching a new high point recently. The trading range above presents a vacuum state; whether experienced investors or newcomers to the market, they will choose to go long with the trend or wait for a price pullback to enter the market.
This chart is the inverted chart of BTC. Assuming we restore the BTC normal chart and chase the rise, it is equivalent to shorting in this inverted chart when it declines, which is a counter-trend operation. We just need to prevent a real breakout of the neckline from turning into a false breakout, meaning we should not regain 92500.
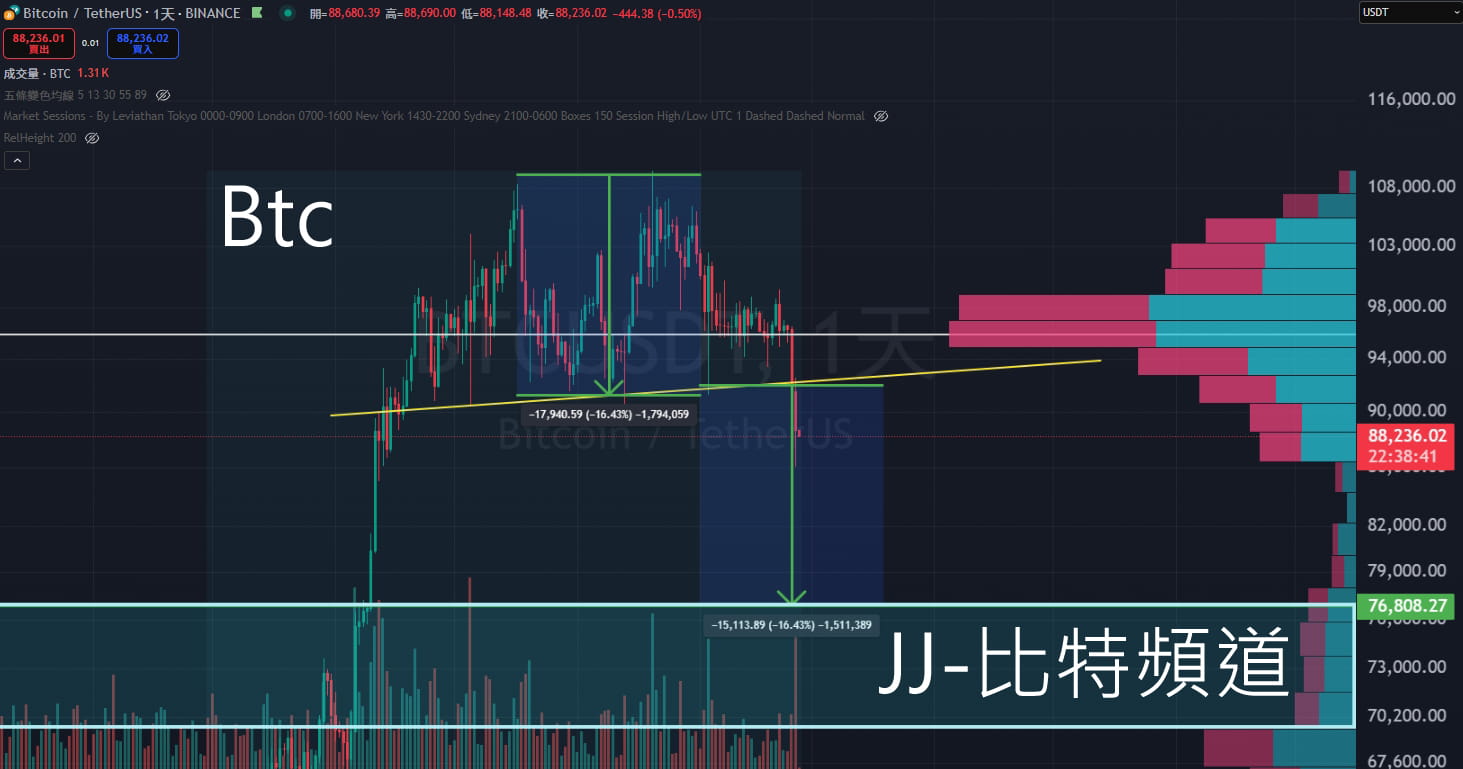
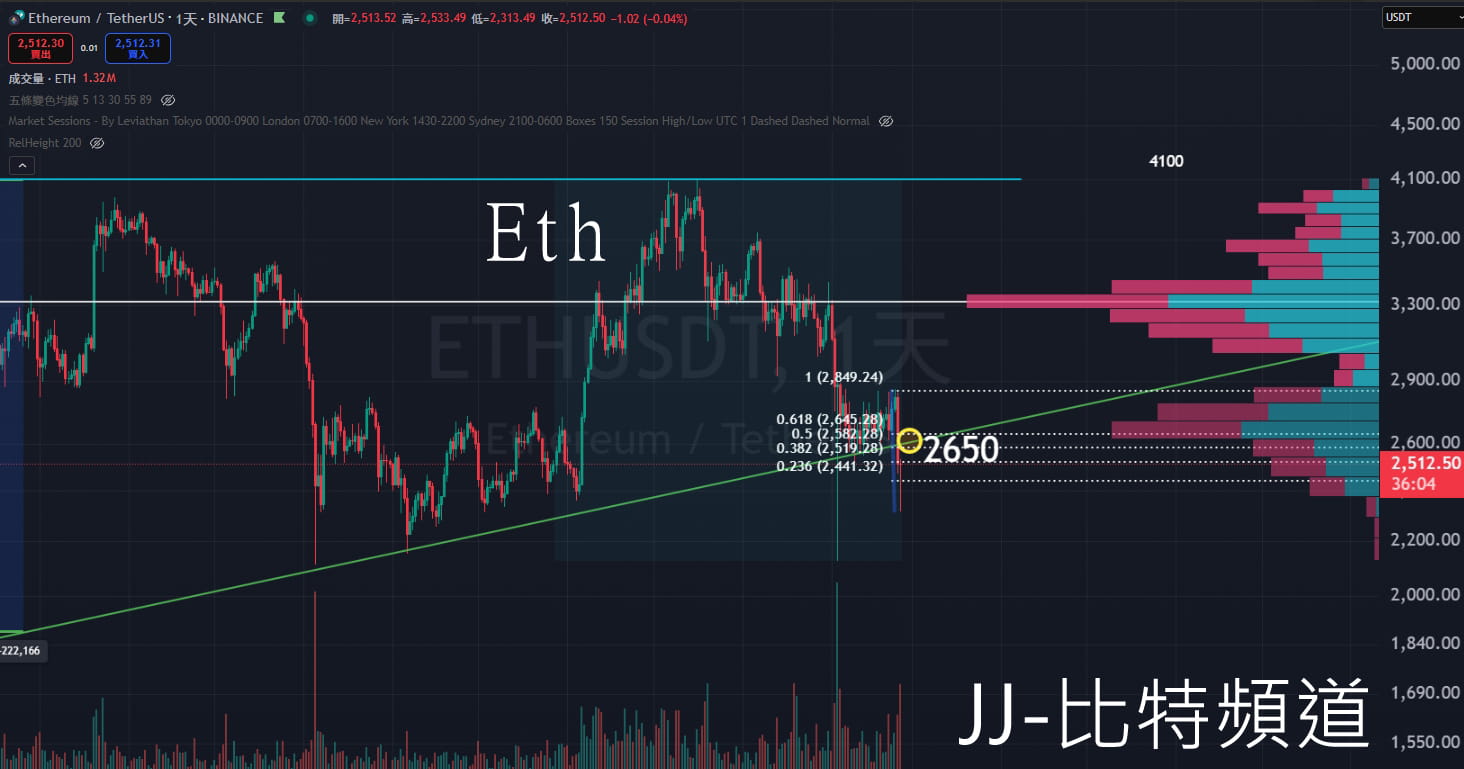
At this stage, BTC has shown a weak rebound after a decline, with the price rising to 89000 (0.236), while ETH has risen to 2515 (0.382). In the future, as long as BTC cannot regain 92500, we should continue to hold short positions until the decline reaches the expected target. However, if BTC rises above 92500, then this breakout can be considered a false breakdown, and we can establish a long position of over 30%. If it continues to strengthen, we can further increase our position and set a stop loss when the price falls below 92500 again.
Expected decline range for BTC: Based on the principle of equal amplitude decline of the head and shoulders pattern, the target price should be around 76000. However, considering that the range between 76000 and 70000 is a low-volume vacuum state, the support may be insufficient. Therefore, in operations, when the price falls below 80000 and approaches the range of 76000, we can start to gradually layout. At the same time, we must also anticipate that the price may fall close to 70000 before it stops declining.
$BTC $ETH $SOL
#Market analysis for reference only #Does not constitute investment advice
#Bitcoin #BTC #ETH #SOL #JJ Bitcoin Channel


