Have you ever wondered why most stock, forex, and crypto traders end up with accounts that are always as thin as an old lady? Losses are inevitable; rushing in without a reliable method will lead to losses for everyone.
Leaking a powerful high win-rate intraday trading method to everyone, using Smart Money to make trading plans, and strict mechanical trading rules may help you transition from large losses to small profits from now on!
If you are always being taken advantage of by the market, make sure to stick it out to the end, and you can still earn a little more!

This trading plan is an intraday trading strategy, meaning that traders open and close positions within the same day, avoiding overnight positions. The benefit of this approach is to avoid overnight risk and focus on capturing short-term price fluctuations!
The difference between intraday trading, swing trading, and scalping is that intraday trading strikes a balance between swing trading and scalping, providing many trading opportunities without being overly affected by extreme fluctuations in lower timeframes while also avoiding the overnight risks of swing trading.
Moreover, intraday trading combines well with the concept of smart money, allowing traders to use liquidity, order blocks, Fair Value Gaps, and market structure for precise trading!
The supply and demand zones in supply and demand theory are key areas on the chart, representing levels where market participants buy or sell in large volumes, causing prices to quickly move away from those areas. We usually mark the starting points of such rapid fluctuations and expect rebounds when prices retrace to these areas.
However, to determine valid supply and demand zones, we need to consider the following three key factors:
/ Market imbalance, when prices quickly leave a certain area, it causes an imbalance of buy and sell orders, forming Fair Value Gaps (FVG), which represent potential reversal points that the market may retrace to fill.
/ Structural break, when prices break through key support and resistance, it indicates a change in market sentiment and confirms the strength of that supply and demand zone. Usually, each structural break will continue the current trend.
/ Push distance, the further the price moves away from the supply and demand zone, the more support that area typically has!

On the 1-hour chart of EUR/USD, we can see that the recent strong upward fluctuation meets all the standards of a high-quality demand zone!
/ Forming FVG (Fair Value Gap)
/ Breaking market structure (BOS)
/ Significant price push
When the price retraces to that area, it is more likely to stop and continue rising. However, if the price breaks below and closes beneath the demand zone, it means that the buyer's strength has failed, and the seller takes over the market, signaling the end of the upward trend and a potential reversal.
This situation is called a market structure change, indicating a significant change in market sentiment!

There are two situations that may lead to an invalid market structure change (CHoCH), and we need to handle them cautiously. The first is liquidity sweep; if the price breaks below a key low, but there is a lot of liquidity in that area, the market may just be a temporary trap rather than a real trend reversal. Smart money often deliberately pushes the price below stop-loss levels to clear liquidity before rebounding!
If the price quickly rebounds after clearing liquidity, it is actually an excellent opportunity to go long!
The second is the filling of Fair Value Gaps (FVG). Identifying FVG while analyzing charts is an important first step, as the market often fills these gaps, which does not necessarily mean a trend reversal.
In a trending market, the market usually fills the FVG first and then continues the main trend; do not misjudge the filling of FVG as a trend change!
Supply and demand control is a comparison of the power between buyers and sellers, determining market direction is the first step in analyzing price charts, the goal is to find the current trend and confirm whether buyers or sellers are dominant.
Trading in the direction of the trend can significantly improve trading win rates!
When the price retraces to a demand zone, buyers are dominant; when the price retraces to a supply zone, sellers are dominant.
When the trend is upward, after each structural break (BOS), a new demand zone is formed, providing entry opportunities when the price retraces.
When the trend is downward, if the price breaks below an effective demand zone, it indicates a market change (CHoCH), with supply dominating the market, and the trend may reverse.

Order blocks are key areas where large institutional traders push the market, representing their entry levels. They can be identified through the following aspects:
/ Order blocks are usually the first candle that forms the FVG.
/ When prices retrace to the order block, a strong reaction may occur.
/ However, order blocks are not 100% effective and need to be confirmed with other technical analysis methods.
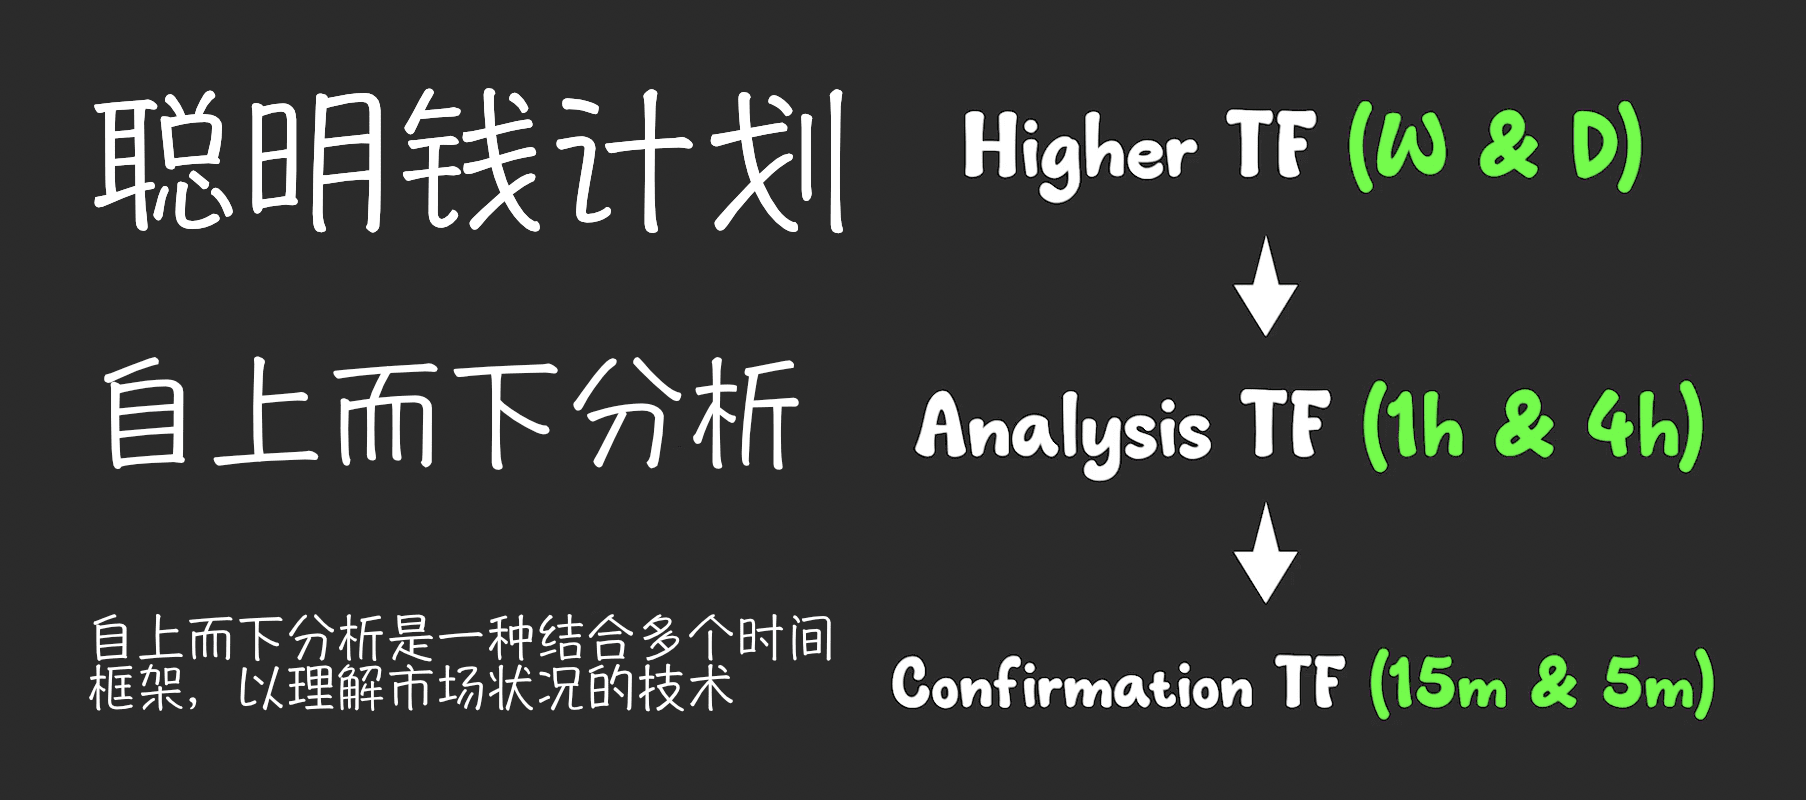
Multi-timeframe analysis is a strategy that analyzes the market from larger timeframes to smaller timeframes, helping traders gain a clearer market background!
Analysis steps:
/ Confirm market trends from higher timeframes such as daily and weekly charts.
/ Look for key supply and demand zone market structures and Fair Value Gaps (FVG) in medium timeframes like 4 hours and 1 hour.
/ Enter lower timeframes like 15 minutes and 5 minutes to find precise entry points.
The key is that the trends must be consistent, ensuring that trends across different timeframes align; observe market structure, BOS confirms the trend, CHoCH warns of trend reversal!
Source: Smart Risk
