
#wyckoff
wyckoff
293,611 views
695 Discussing
Hot
Latest

**What is the Wyckoff method?**
Wyckoff is a market-reading framework created in the 1930s by Richard Wyckoff. It is still relevant because it explains how large volumes move and where liquidity accumulates or gets distributed. Instead of seeing price as lines, Wyckoff teaches you to read **effort vs. result**: if the price drops sharply but then rebounds quickly, the downward effort had no result → possible accumulation. If it rises sharply but can’t hold, the upward effort failed → possible distribution.
The key concepts are:
- **Spring**: a sweep of lows before moving up (a trap for sellers).
- **Upthrust**: a sweep of highs before moving down (a trap for buyers).
- **Phases**: accumulation, markup, distribution, markdown.
In crypto, Wyckoff works especially well because futures markets stack liquidity at obvious levels, and price goes after it before turning around. But be careful: a spring within a bearish bias is a bounce, not a reversal, until proven otherwise by breaking key resistance levels.
Do you use Wyckoff in your analysis, or do you prefer other methods? Share your take in the comments.
#Wyckoff
**What is the Wyckoff method?**
Wyckoff is a market-reading framework created in the 1930s by Richard Wyckoff. It is still relevant because it explains how large volumes move and where liquidity accumulates or gets distributed. Instead of seeing price as lines, Wyckoff teaches you to read **effort vs. result**: if the price drops sharply but then rebounds quickly, the downward effort had no result → possible accumulation. If it rises sharply but can’t hold, the upward effort failed → possible distribution.
The key concepts are:
- **Spring**: a sweep of lows before moving up (a trap for sellers).
- **Upthrust**: a sweep of highs before moving down (a trap for buyers).
- **Phases**: accumulation, markup, distribution, markdown.
In crypto, Wyckoff works especially well because futures markets stack liquidity at obvious levels, and price goes after it before turning around. But be careful: a spring within a bearish bias is a bounce, not a reversal, until proven otherwise by breaking key resistance levels.
Do you use Wyckoff in your analysis, or do you prefer other methods? Share your take in the comments.
#Wyckoff
Wyckoff is a market-reading framework created in the 1930s by Richard Wyckoff. It is still relevant because it explains how large volumes move and where liquidity accumulates or gets distributed. Instead of seeing price as lines, Wyckoff teaches you to read **effort vs. result**: if the price drops sharply but then rebounds quickly, the downward effort had no result → possible accumulation. If it rises sharply but can’t hold, the upward effort failed → possible distribution.
The key concepts are:
- **Spring**: a sweep of lows before moving up (a trap for sellers).
- **Upthrust**: a sweep of highs before moving down (a trap for buyers).
- **Phases**: accumulation, markup, distribution, markdown.
In crypto, Wyckoff works especially well because futures markets stack liquidity at obvious levels, and price goes after it before turning around. But be careful: a spring within a bearish bias is a bounce, not a reversal, until proven otherwise by breaking key resistance levels.
Do you use Wyckoff in your analysis, or do you prefer other methods? Share your take in the comments.
#Wyckoff
97
What is the Wyckoff method?
It’s an analysis system created in the 1930s that teaches you to read the intentions of major market participants by observing price, volume, and the relationship between effort and result.
Wyckoff divides the market into four phases: accumulation (institutions buy quietly), markup (price rises easily), distribution (they sell to latecomers), and markdown (price falls quickly).
Within these phases, you identify key events such as the spring (a sweep of the lows before a rise) or the upthrust (a sweep of the highs before a fall). These are traps that liquidate the crowd before the real move.
The key: when you see high volume but little price movement, someone is absorbing. When you see low volume and a big move, there’s no resistance.
It doesn’t predict the future, but it trains you to see who’s really buying or selling.
Follow us for more guides to help you read the market without relying on lagging indicators.
#Wyckoff
What is the Wyckoff method?
It’s an analysis system created in the 1930s that teaches you to read the intentions of major market participants by observing price, volume, and the relationship between effort and result.
Wyckoff divides the market into four phases: accumulation (institutions buy quietly), markup (price rises easily), distribution (they sell to latecomers), and markdown (price falls quickly).
Within these phases, you identify key events such as the spring (a sweep of the lows before a rise) or the upthrust (a sweep of the highs before a fall). These are traps that liquidate the crowd before the real move.
The key: when you see high volume but little price movement, someone is absorbing. When you see low volume and a big move, there’s no resistance.
It doesn’t predict the future, but it trains you to see who’s really buying or selling.
Follow us for more guides to help you read the market without relying on lagging indicators.
#Wyckoff
It’s an analysis system created in the 1930s that teaches you to read the intentions of major market participants by observing price, volume, and the relationship between effort and result.
Wyckoff divides the market into four phases: accumulation (institutions buy quietly), markup (price rises easily), distribution (they sell to latecomers), and markdown (price falls quickly).
Within these phases, you identify key events such as the spring (a sweep of the lows before a rise) or the upthrust (a sweep of the highs before a fall). These are traps that liquidate the crowd before the real move.
The key: when you see high volume but little price movement, someone is absorbing. When you see low volume and a big move, there’s no resistance.
It doesn’t predict the future, but it trains you to see who’s really buying or selling.
Follow us for more guides to help you read the market without relying on lagging indicators.
#Wyckoff
1
55

🚨 $CRV SWEPT THE BOTTOM AT $0.3747 — WHY SHORTING HERE IS A LIQUIDITY TRAP! 🦈
Smart money just ran a clean liquidity sweep down to $0.3747 on $CRV before snapping back to reclaim $0.3936. 🌊 Chasing shorts straight into a fresh demand block while a potential Wyckoff Spring takes shape is a textbook way to get squeezed.
While structural buyers engineered a local change of character, recovery volume is still idling at just 0.32x its 20-hour average. 📊 Until bulls prove real conviction toward the $0.4016 supply overhead, disciplined capital stays patient. 💡
💬 Will $CRV gather real buying power to reclaim $0.4016, or does this bounce stall below supply? 👇
⚠️ Not financial advice. Always manage your risk. 🛡️
🏷️ #CRV #Wyckoff #SmartMoney #Crypto
🎯 🦈
🚨 $CRV SWEPT THE BOTTOM AT $0.3747 — WHY SHORTING HERE IS A LIQUIDITY TRAP! 🦈
Smart money just ran a clean liquidity sweep down to $0.3747 on $CRV before snapping back to reclaim $0.3936. 🌊 Chasing shorts straight into a fresh demand block while a potential Wyckoff Spring takes shape is a textbook way to get squeezed.
While structural buyers engineered a local change of character, recovery volume is still idling at just 0.32x its 20-hour average. 📊 Until bulls prove real conviction toward the $0.4016 supply overhead, disciplined capital stays patient. 💡
💬 Will $CRV gather real buying power to reclaim $0.4016, or does this bounce stall below supply? 👇
⚠️ Not financial advice. Always manage your risk. 🛡️
🏷️ #CRV #Wyckoff #SmartMoney #Crypto
🎯 🦈
Smart money just ran a clean liquidity sweep down to $0.3747 on $CRV before snapping back to reclaim $0.3936. 🌊 Chasing shorts straight into a fresh demand block while a potential Wyckoff Spring takes shape is a textbook way to get squeezed.
While structural buyers engineered a local change of character, recovery volume is still idling at just 0.32x its 20-hour average. 📊 Until bulls prove real conviction toward the $0.4016 supply overhead, disciplined capital stays patient. 💡
💬 Will $CRV gather real buying power to reclaim $0.4016, or does this bounce stall below supply? 👇
⚠️ Not financial advice. Always manage your risk. 🛡️
🏷️ #CRV #Wyckoff #SmartMoney #Crypto
🎯 🦈
9

·
--
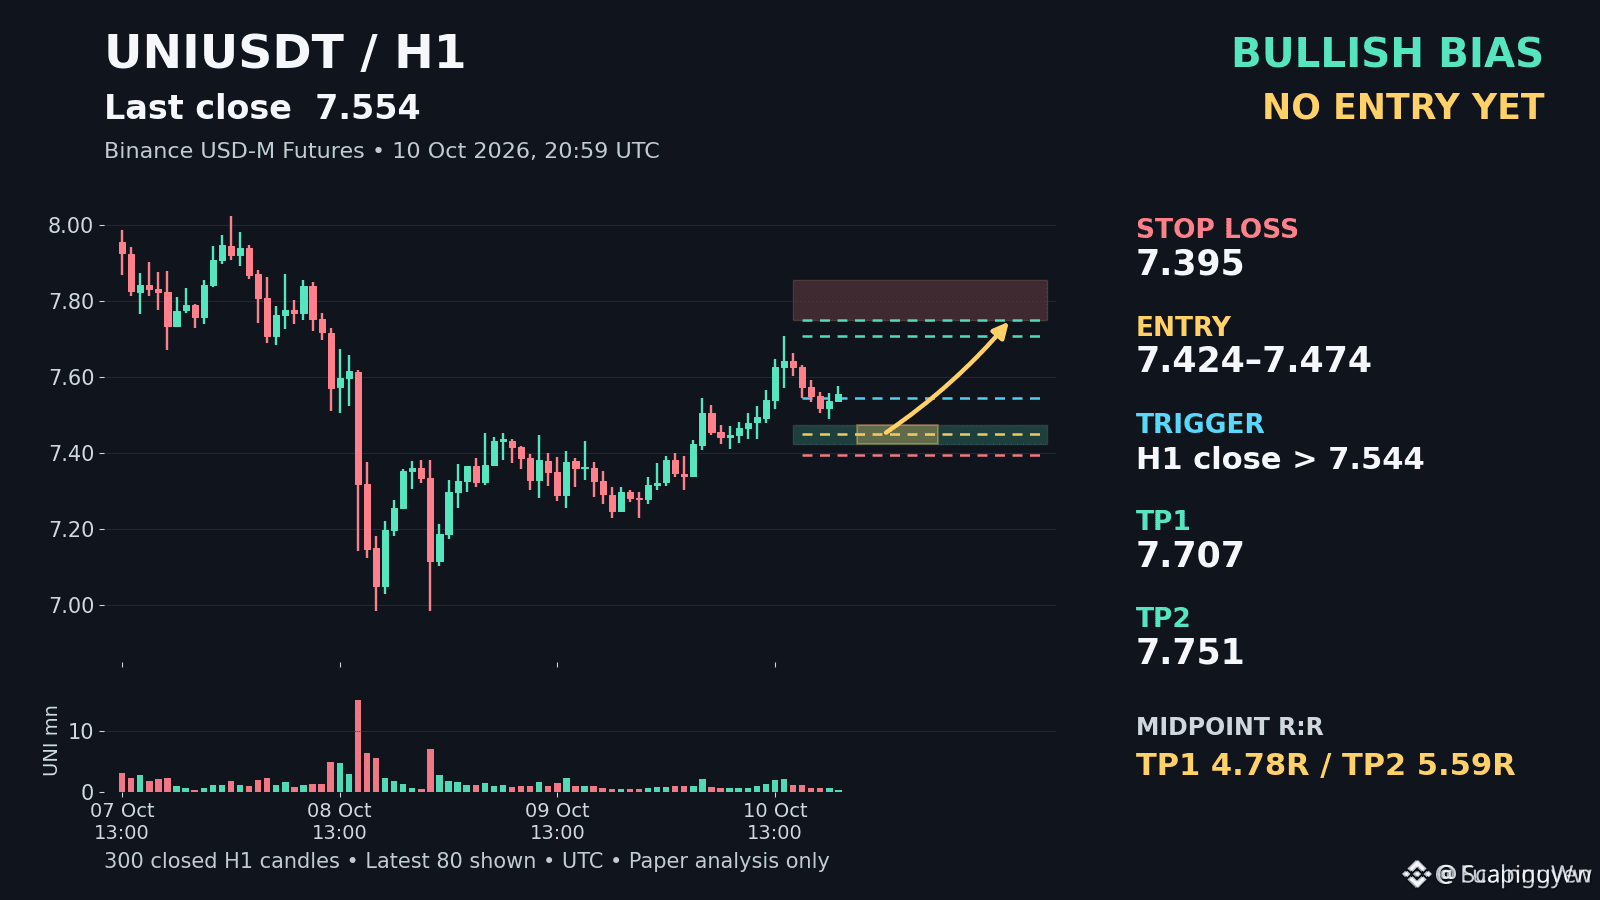
🚨 $UNI IS SHOWING A TEXTBOOK WYCKOFF ACCUMULATION BEFORE THE NEXT EXPLOSIVE LEG! ⚡
Entry: 7.424–7.474 ⚡
Target: 7.707 🚀
Stop Loss: 7.395 ⚠️
$UNI just confirmed a clean bullish break of structure above 7.544 on heavy volume, signaling a powerful Sign of Strength. 🔍 Sellers are exhausting quickly as pullback volume drops to a fraction of average, setting up an ideal demand retest zone.
💡 We are watching for buyers to step up in the 7.424–7.474 block to lock in a textbook higher low. 🌊 If this demand zone holds, momentum is primed for a swift run toward high-RTP targets above 7.700. 💬 Are you waiting for confirmed rejection candles at support, or bidding the retest limit order style? 👇
⚠️ Not financial advice. Always manage your risk. 🛡️
🏷️ #UNI #Wyckoff #LongSetup #Crypto
🔥 🎯
🚨 $UNI IS SHOWING A TEXTBOOK WYCKOFF ACCUMULATION BEFORE THE NEXT EXPLOSIVE LEG! ⚡
Entry: 7.424–7.474 ⚡
Target: 7.707 🚀
Stop Loss: 7.395 ⚠️
$UNI just confirmed a clean bullish break of structure above 7.544 on heavy volume, signaling a powerful Sign of Strength. 🔍 Sellers are exhausting quickly as pullback volume drops to a fraction of average, setting up an ideal demand retest zone.
💡 We are watching for buyers to step up in the 7.424–7.474 block to lock in a textbook higher low. 🌊 If this demand zone holds, momentum is primed for a swift run toward high-RTP targets above 7.700. 💬 Are you waiting for confirmed rejection candles at support, or bidding the retest limit order style? 👇
⚠️ Not financial advice. Always manage your risk. 🛡️
🏷️ #UNI #Wyckoff #LongSetup #Crypto
🔥 🎯
Entry: 7.424–7.474 ⚡
Target: 7.707 🚀
Stop Loss: 7.395 ⚠️
$UNI just confirmed a clean bullish break of structure above 7.544 on heavy volume, signaling a powerful Sign of Strength. 🔍 Sellers are exhausting quickly as pullback volume drops to a fraction of average, setting up an ideal demand retest zone.
💡 We are watching for buyers to step up in the 7.424–7.474 block to lock in a textbook higher low. 🌊 If this demand zone holds, momentum is primed for a swift run toward high-RTP targets above 7.700. 💬 Are you waiting for confirmed rejection candles at support, or bidding the retest limit order style? 👇
⚠️ Not financial advice. Always manage your risk. 🛡️
🏷️ #UNI #Wyckoff #LongSetup #Crypto
🔥 🎯
41

·
--
Bullish
$BTC
{spot}(BTCUSDT)
Wyckoff Strategy | Wyckoff
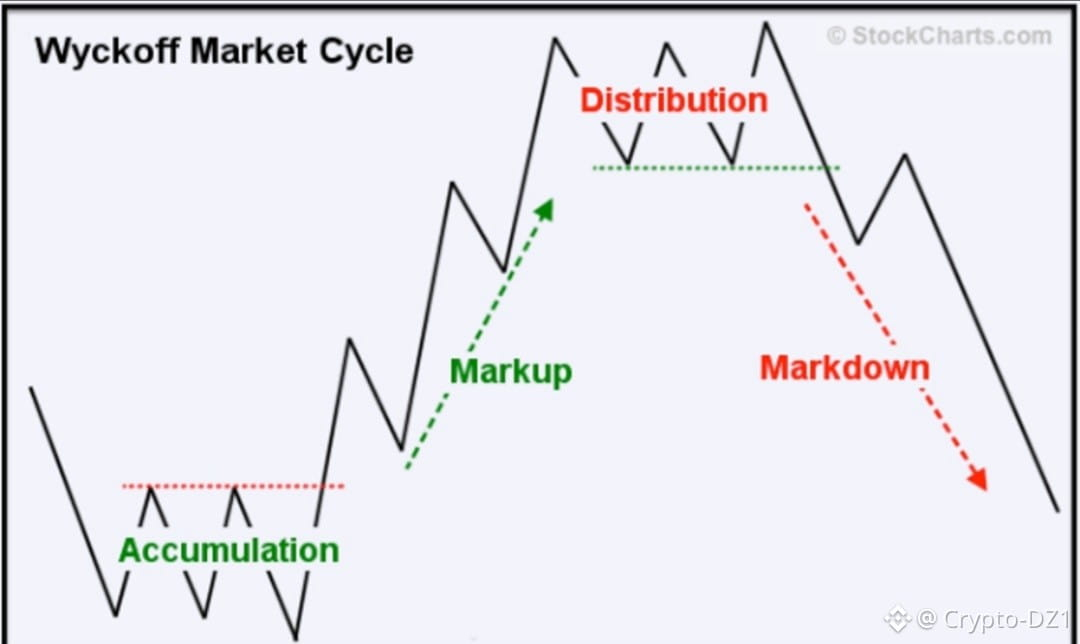
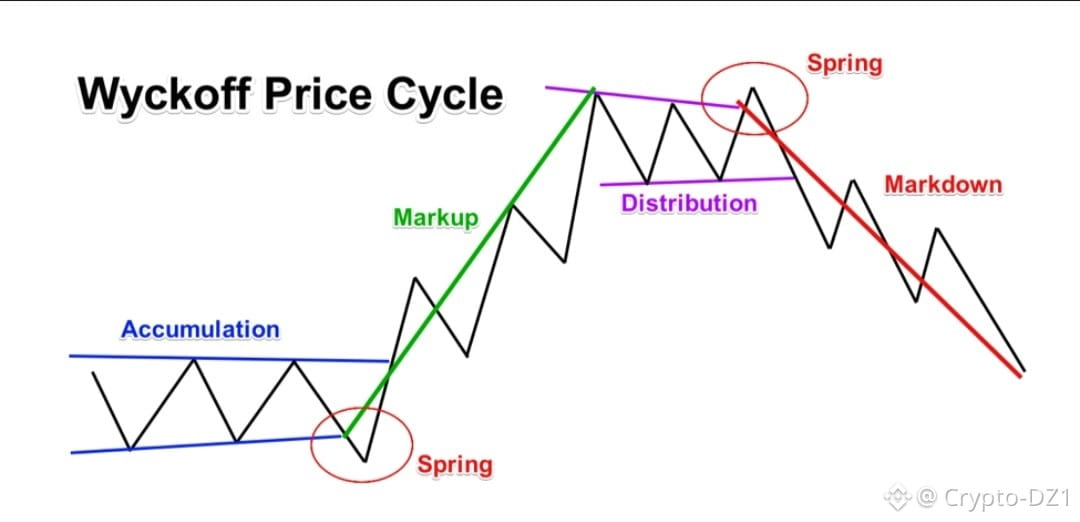
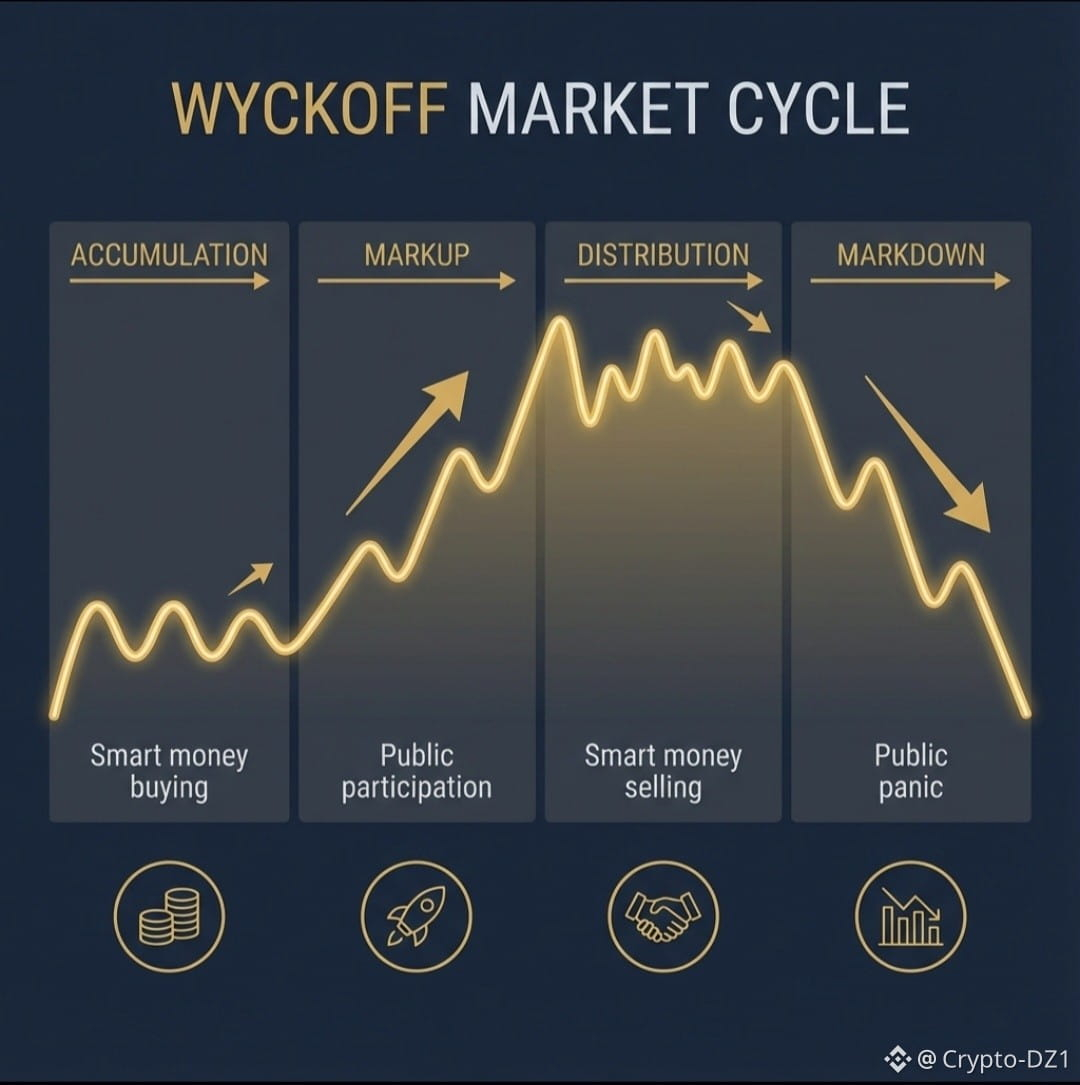
A method of market analysis based on **price action + trading volume** to understand what major traders are doing: are they accumulating before a rise, or distributing before a decline?
**The four phases:**
**1. Accumulation:** After a decline, the price moves sideways while major traders gradually buy.
**2. Markup:** Once accumulation is complete, the uptrend begins, and demand is stronger than supply.
**3. Distribution:** After a strong rise, the price moves sideways while major traders gradually sell.
**4. Markdown:** Once distribution is complete, the downtrend begins, and supply is stronger than demand.
**Key signals:**
**Spring:** A false break below the bottom of the accumulation range, followed by a move back above it ← selling has likely ended, and a rise may begin.
**SOS (Sign of Strength):** A strong rise that breaks resistance within the accumulation range ← evidence that buyers are in control.
**UTAD (Upthrust After Distribution):** A false break above the top of the distribution range, followed by a move back below it ← the rise has likely ended, and a decline may begin.
**📌 Remember it this way:**
• Spring = false break below the bottom ← potential rise
• SOS = strong break above resistance ← confirms the rise
• UTAD = false break above the top ← warning of a decline
#Wyckoff
$APT
{spot}(APTUSDT)
$XLM
{spot}(XLMUSDT)
#أعجبني
$BTC
Wyckoff Strategy | Wyckoff
A method of market analysis based on **price action + trading volume** to understand what major traders are doing: are they accumulating before a rise, or distributing before a decline?
**The four phases:**
**1. Accumulation:** After a decline, the price moves sideways while major traders gradually buy.
**2. Markup:** Once accumulation is complete, the uptrend begins, and demand is stronger than supply.
**3. Distribution:** After a strong rise, the price moves sideways while major traders gradually sell.
**4. Markdown:** Once distribution is complete, the downtrend begins, and supply is stronger than demand.
**Key signals:**
**Spring:** A false break below the bottom of the accumulation range, followed by a move back above it ← selling has likely ended, and a rise may begin.
**SOS (Sign of Strength):** A strong rise that breaks resistance within the accumulation range ← evidence that buyers are in control.
**UTAD (Upthrust After Distribution):** A false break above the top of the distribution range, followed by a move back below it ← the rise has likely ended, and a decline may begin.
**📌 Remember it this way:**
• Spring = false break below the bottom ← potential rise
• SOS = strong break above resistance ← confirms the rise
• UTAD = false break above the top ← warning of a decline
#Wyckoff
$APT
$XLM
#أعجبني
Wyckoff Strategy | Wyckoff
A method of market analysis based on **price action + trading volume** to understand what major traders are doing: are they accumulating before a rise, or distributing before a decline?
**The four phases:**
**1. Accumulation:** After a decline, the price moves sideways while major traders gradually buy.
**2. Markup:** Once accumulation is complete, the uptrend begins, and demand is stronger than supply.
**3. Distribution:** After a strong rise, the price moves sideways while major traders gradually sell.
**4. Markdown:** Once distribution is complete, the downtrend begins, and supply is stronger than demand.
**Key signals:**
**Spring:** A false break below the bottom of the accumulation range, followed by a move back above it ← selling has likely ended, and a rise may begin.
**SOS (Sign of Strength):** A strong rise that breaks resistance within the accumulation range ← evidence that buyers are in control.
**UTAD (Upthrust After Distribution):** A false break above the top of the distribution range, followed by a move back below it ← the rise has likely ended, and a decline may begin.
**📌 Remember it this way:**
• Spring = false break below the bottom ← potential rise
• SOS = strong break above resistance ← confirms the rise
• UTAD = false break above the top ← warning of a decline
#Wyckoff
$APT
$XLM
#أعجبني
2
571

·
--
Bearish
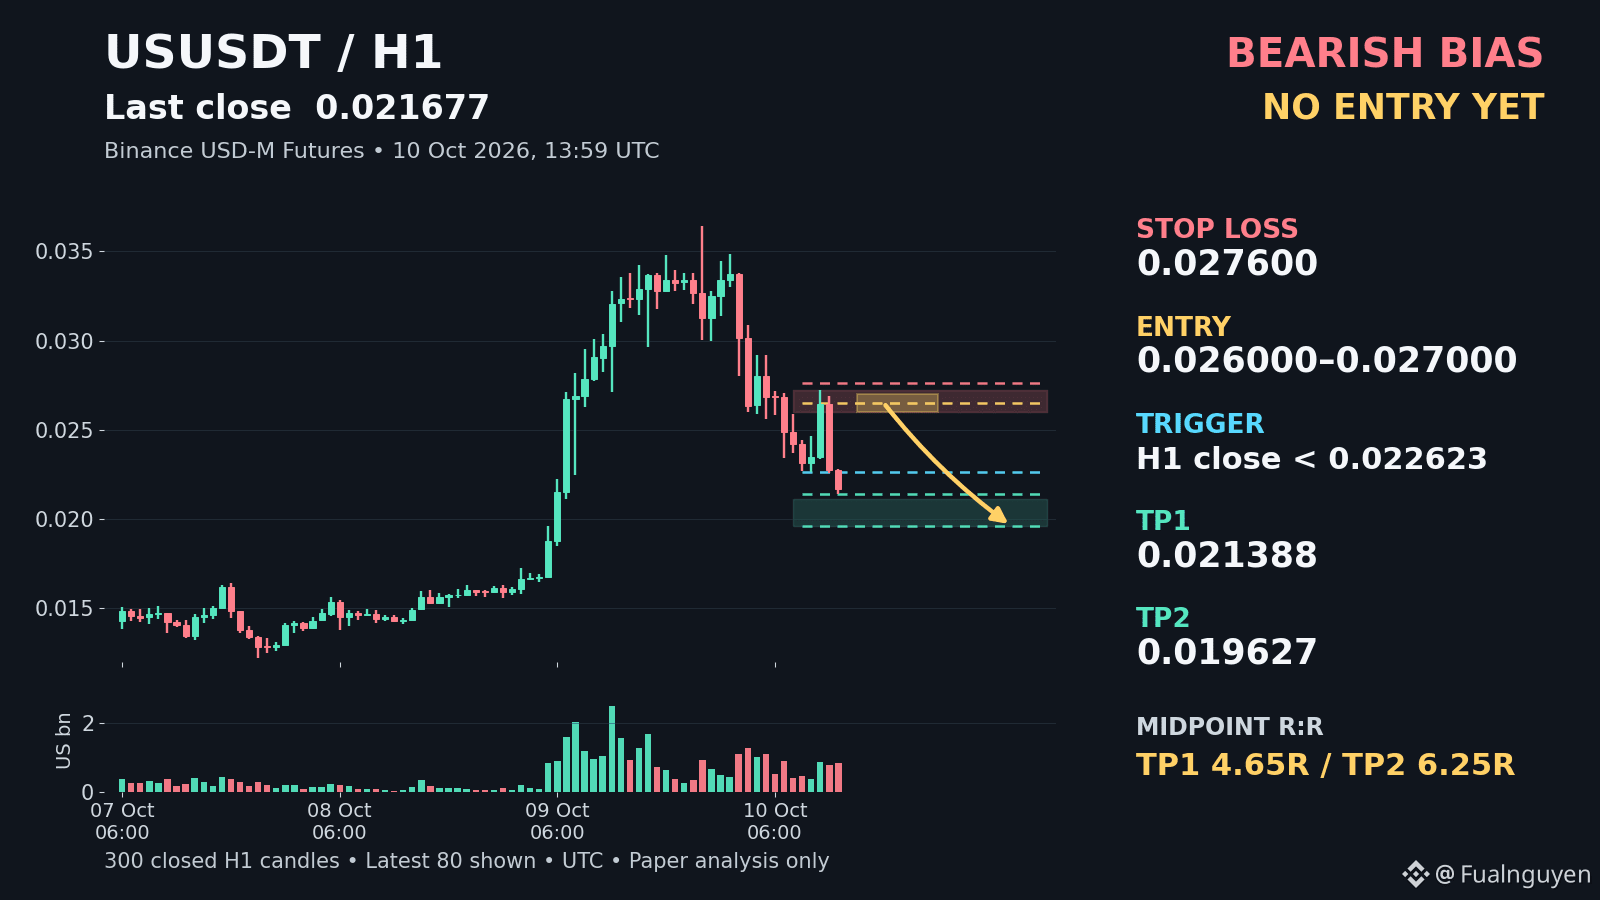
$US BEARISH BIAS: the latest confirmed H1 close at 0.021677 reinforces the bearish CHoCH below 0.030001 and the failed rebound to 0.027233.
Wyckoff suggests potential distribution transitioning into markdown, while a fresh bearish imbalance at 0.022788–0.023370 and volume at 1.21× the preceding 20-candle average support the breakdown.
BEARISH BIAS — NO ENTRY YET: consider only a confirmed failed retest of 0.026000–0.027000, with SL at 0.027600, TP1 at 0.021388 and TP2 at 0.019627, offering 4.65R and 6.25R from the entry midpoint before costs.
An H1 close above 0.027600 invalidates this setup; avoid chasing the drop, and if the retest never comes, let the trade go.
Will the next bounce expose trapped buyers? #Wyckoff #SMC
Paper analysis only; not financial advice
{future}(USUSDT)
$US BEARISH BIAS: the latest confirmed H1 close at 0.021677 reinforces the bearish CHoCH below 0.030001 and the failed rebound to 0.027233.
Wyckoff suggests potential distribution transitioning into markdown, while a fresh bearish imbalance at 0.022788–0.023370 and volume at 1.21× the preceding 20-candle average support the breakdown.
BEARISH BIAS — NO ENTRY YET: consider only a confirmed failed retest of 0.026000–0.027000, with SL at 0.027600, TP1 at 0.021388 and TP2 at 0.019627, offering 4.65R and 6.25R from the entry midpoint before costs.
An H1 close above 0.027600 invalidates this setup; avoid chasing the drop, and if the retest never comes, let the trade go.
Will the next bounce expose trapped buyers? #Wyckoff #SMC
Paper analysis only; not financial advice
Wyckoff suggests potential distribution transitioning into markdown, while a fresh bearish imbalance at 0.022788–0.023370 and volume at 1.21× the preceding 20-candle average support the breakdown.
BEARISH BIAS — NO ENTRY YET: consider only a confirmed failed retest of 0.026000–0.027000, with SL at 0.027600, TP1 at 0.021388 and TP2 at 0.019627, offering 4.65R and 6.25R from the entry midpoint before costs.
An H1 close above 0.027600 invalidates this setup; avoid chasing the drop, and if the retest never comes, let the trade go.
Will the next bounce expose trapped buyers? #Wyckoff #SMC
Paper analysis only; not financial advice
2
721

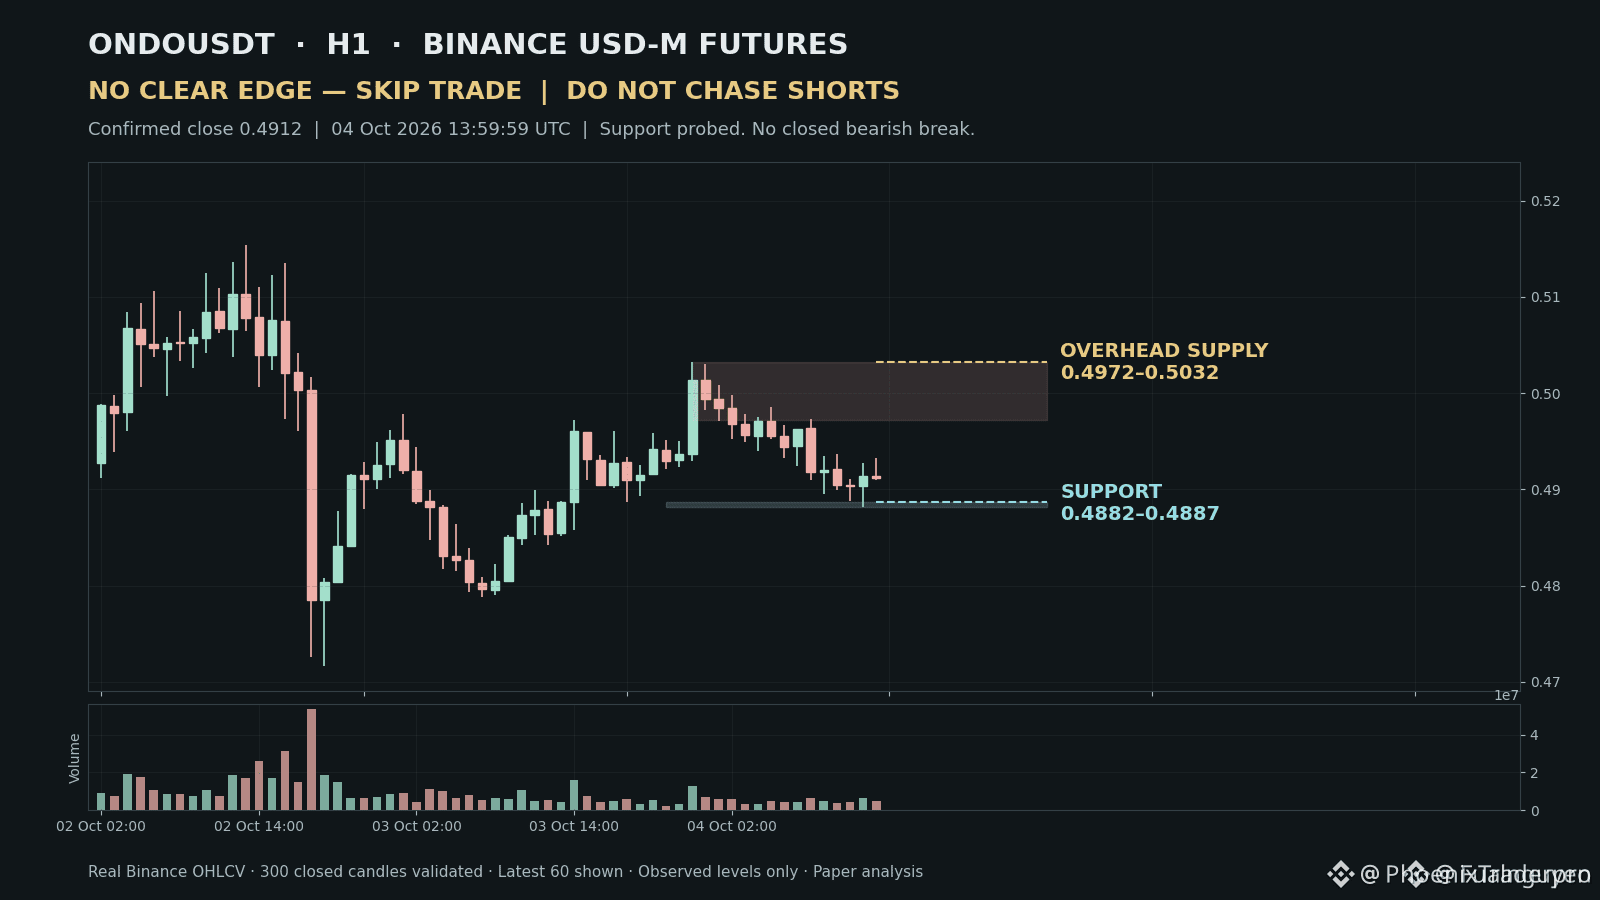
⚠️ WHY SHORTING THE $ONDO DIP RIGHT NOW IS A DANGEROUS LIQUIDITY TRAP! 🚨
Sellers are rushing to hit the bid near $0.4882, but look closer at the H1 print. 📊 That probe below support was just a sub-range liquidity sweep rather than a confirmed structural breakdown, and volume is running cold at 0.92x the average.
Wyckoff market structure shows an unconfirmed range, while SMC signals remain thoroughly mixed after the failed hold above $0.4972. 💡 Shorting into tested demand between $0.4882 and $0.4887 without a decisive candle close is handing capital to the house. 📌 Keep your hands under your seat until high-volume price action confirms the next directional trend. 💬 Are you letting this trap play out, or waiting for a confirmed breakdown first? 👇
⚠️ Not financial advice. Always manage your risk. 🛡️
🏷️ #ONDO #Crypto #SMC #Wyckoff
🦈 👁️
⚠️ WHY SHORTING THE $ONDO DIP RIGHT NOW IS A DANGEROUS LIQUIDITY TRAP! 🚨
Sellers are rushing to hit the bid near $0.4882, but look closer at the H1 print. 📊 That probe below support was just a sub-range liquidity sweep rather than a confirmed structural breakdown, and volume is running cold at 0.92x the average.
Wyckoff market structure shows an unconfirmed range, while SMC signals remain thoroughly mixed after the failed hold above $0.4972. 💡 Shorting into tested demand between $0.4882 and $0.4887 without a decisive candle close is handing capital to the house. 📌 Keep your hands under your seat until high-volume price action confirms the next directional trend. 💬 Are you letting this trap play out, or waiting for a confirmed breakdown first? 👇
⚠️ Not financial advice. Always manage your risk. 🛡️
🏷️ #ONDO #Crypto #SMC #Wyckoff
🦈 👁️
Sellers are rushing to hit the bid near $0.4882, but look closer at the H1 print. 📊 That probe below support was just a sub-range liquidity sweep rather than a confirmed structural breakdown, and volume is running cold at 0.92x the average.
Wyckoff market structure shows an unconfirmed range, while SMC signals remain thoroughly mixed after the failed hold above $0.4972. 💡 Shorting into tested demand between $0.4882 and $0.4887 without a decisive candle close is handing capital to the house. 📌 Keep your hands under your seat until high-volume price action confirms the next directional trend. 💬 Are you letting this trap play out, or waiting for a confirmed breakdown first? 👇
⚠️ Not financial advice. Always manage your risk. 🛡️
🏷️ #ONDO #Crypto #SMC #Wyckoff
🦈 👁️
53
·
--
Bearish
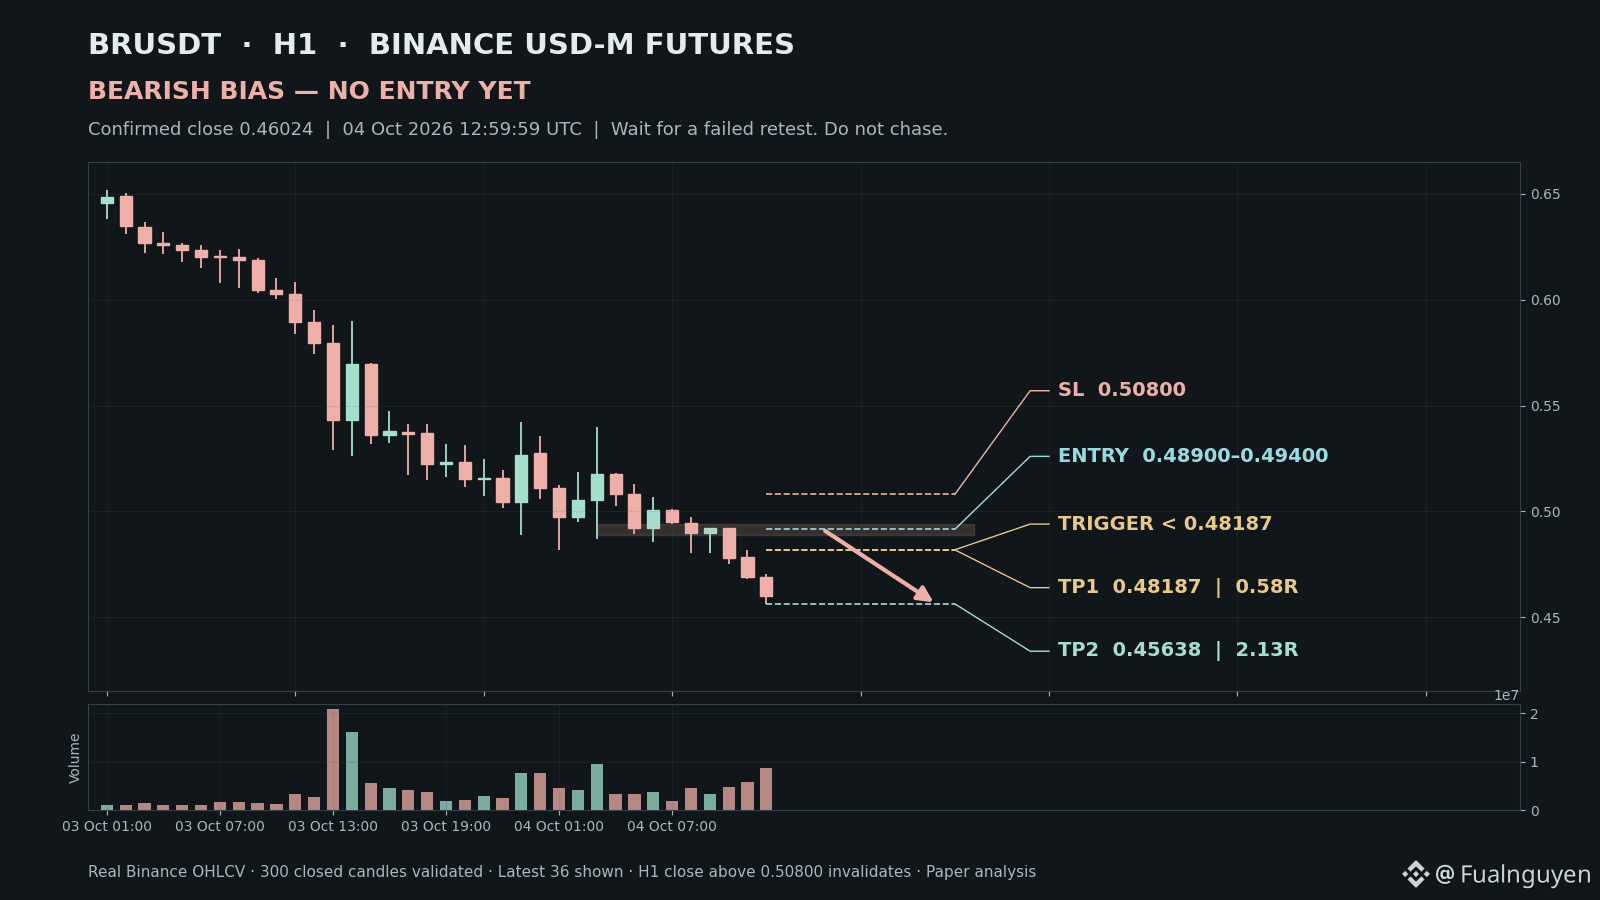
$BR : BEARISH BIAS: SELLERS CONTROL H1—BUT SHORTING THE DROP IS NOT THE SETUP.
Three bearish clues:
• H1 closed at $0.47818 below the $0.48187 swing low, confirming bearish BOS. Two more closed candles extended the decline.
• Rebound highs fell from $0.54200 to $0.53980. The latest $0.45638 low is fresh sell-side liquidity, not a confirmed reversal floor.
• Latest volume was 8.72M BR, 2.04x the preceding 20-hour average. A fresh $0.47061–$0.47500 bearish gap adds imbalance evidence.
Wyckoff: ongoing markdown is the working interpretation. No stable recent trading range or complete SC→AR→ST sequence is confirmed; calling accumulation or a Spring here would be premature.
SMC: the earlier $0.48870 sweep/rebound failed to repair structure. Supply for a conditional failed retest sits at $0.48900–$0.49400, overlapping prior consolidation and the $0.49232–$0.49387 gap. Broader protected high: $0.53980; local rebound high: $0.50687.
ONE CONDITIONAL SHORT MAP
Trigger: H1 close below $0.48187—already confirmed.
Entry: $0.48900–$0.49400 only on a subsequent failed retest; require H1 rejection back below $0.48900 without reclaiming the local rebound structure.
SL: $0.50800, above the local $0.50687 high.
TP1: $0.48187, broken swing level | 0.58R.
TP2: $0.45638, current weak low | 2.13R.
R calculated from midpoint $0.49150, before costs.
BEARISH BIAS — NO ENTRY YET.
Checked price: $0.45975, 6.46% below entry midpoint. No qualifying post-BOS retest has occurred. Do not short into the fresh low or chase red candles. Reassess if that low changes before entry.
Invalidation: an H1 close above $0.50800 cancels this local bearish map.
#Wyckoff #SMC
Paper analysis only. Not financial advice.
Will the next bounce fail at former support, or will sellers lose their grip?
{future}(BRUSDT)
$BR : BEARISH BIAS: SELLERS CONTROL H1—BUT SHORTING THE DROP IS NOT THE SETUP.
Three bearish clues:
• H1 closed at $0.47818 below the $0.48187 swing low, confirming bearish BOS. Two more closed candles extended the decline.
• Rebound highs fell from $0.54200 to $0.53980. The latest $0.45638 low is fresh sell-side liquidity, not a confirmed reversal floor.
• Latest volume was 8.72M BR, 2.04x the preceding 20-hour average. A fresh $0.47061–$0.47500 bearish gap adds imbalance evidence.
Wyckoff: ongoing markdown is the working interpretation. No stable recent trading range or complete SC→AR→ST sequence is confirmed; calling accumulation or a Spring here would be premature.
SMC: the earlier $0.48870 sweep/rebound failed to repair structure. Supply for a conditional failed retest sits at $0.48900–$0.49400, overlapping prior consolidation and the $0.49232–$0.49387 gap. Broader protected high: $0.53980; local rebound high: $0.50687.
ONE CONDITIONAL SHORT MAP
Trigger: H1 close below $0.48187—already confirmed.
Entry: $0.48900–$0.49400 only on a subsequent failed retest; require H1 rejection back below $0.48900 without reclaiming the local rebound structure.
SL: $0.50800, above the local $0.50687 high.
TP1: $0.48187, broken swing level | 0.58R.
TP2: $0.45638, current weak low | 2.13R.
R calculated from midpoint $0.49150, before costs.
BEARISH BIAS — NO ENTRY YET.
Checked price: $0.45975, 6.46% below entry midpoint. No qualifying post-BOS retest has occurred. Do not short into the fresh low or chase red candles. Reassess if that low changes before entry.
Invalidation: an H1 close above $0.50800 cancels this local bearish map.
#Wyckoff #SMC
Paper analysis only. Not financial advice.
Will the next bounce fail at former support, or will sellers lose their grip?
Three bearish clues:
• H1 closed at $0.47818 below the $0.48187 swing low, confirming bearish BOS. Two more closed candles extended the decline.
• Rebound highs fell from $0.54200 to $0.53980. The latest $0.45638 low is fresh sell-side liquidity, not a confirmed reversal floor.
• Latest volume was 8.72M BR, 2.04x the preceding 20-hour average. A fresh $0.47061–$0.47500 bearish gap adds imbalance evidence.
Wyckoff: ongoing markdown is the working interpretation. No stable recent trading range or complete SC→AR→ST sequence is confirmed; calling accumulation or a Spring here would be premature.
SMC: the earlier $0.48870 sweep/rebound failed to repair structure. Supply for a conditional failed retest sits at $0.48900–$0.49400, overlapping prior consolidation and the $0.49232–$0.49387 gap. Broader protected high: $0.53980; local rebound high: $0.50687.
ONE CONDITIONAL SHORT MAP
Trigger: H1 close below $0.48187—already confirmed.
Entry: $0.48900–$0.49400 only on a subsequent failed retest; require H1 rejection back below $0.48900 without reclaiming the local rebound structure.
SL: $0.50800, above the local $0.50687 high.
TP1: $0.48187, broken swing level | 0.58R.
TP2: $0.45638, current weak low | 2.13R.
R calculated from midpoint $0.49150, before costs.
BEARISH BIAS — NO ENTRY YET.
Checked price: $0.45975, 6.46% below entry midpoint. No qualifying post-BOS retest has occurred. Do not short into the fresh low or chase red candles. Reassess if that low changes before entry.
Invalidation: an H1 close above $0.50800 cancels this local bearish map.
#Wyckoff #SMC
Paper analysis only. Not financial advice.
Will the next bounce fail at former support, or will sellers lose their grip?
1
1
254
·
--
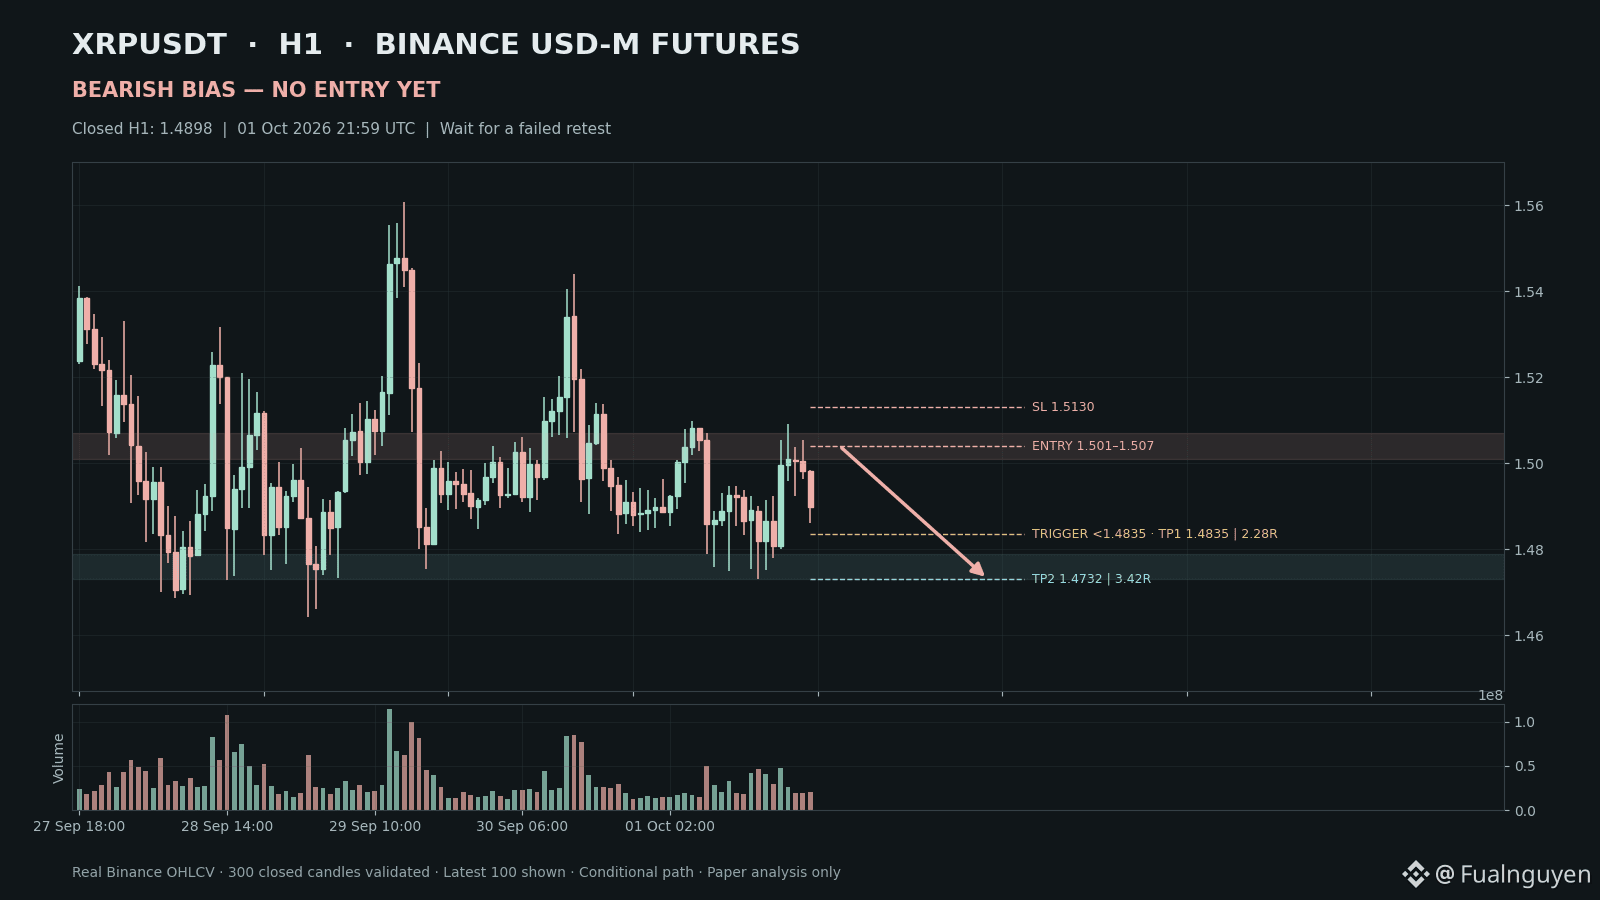
$XRP BEARISH BIAS: the rebound is losing altitude. Chasing a short here is still a bad entry.
Latest confirmed H1 close: $1.4898, 01 Oct 2026 21:59 UTC (02 Oct 04:59 Vietnam). Binance USD-M Futures.
Three clues:
• Lower highs: $1.5440 → $1.5099 → $1.5091.
• H1 closed at $1.4819 below $1.4835 on 2.13× the preceding 20-hour average volume.
• The latest candle swept $1.4963 to $1.4984, then closed back at $1.4898.
Wyckoff: potential redistribution within the recent ~$1.479–$1.507 range; a complete UTAD/SOW/LPSY sequence is NOT confirmed. SMC: bearish BOS and a buy-side rejection favor selling failed rebounds. The bounce also drew volume, so confirmation still matters.
Primary conditional map:
Trigger: H1 close below $1.4835 — already printed.
Entry: $1.501–$1.507 ONLY on a fresh failed retest, followed by an H1 close back below $1.501.
SL: $1.5130, above the local structural high.
TP1: $1.4835 | 2.28R.
TP2: $1.4732 | 3.42R.
R:R uses the $1.5040 entry midpoint.
BEARISH BIAS — NO ENTRY YET.
Price has moved away from the retest zone. A bearish bias is not permission to short at market.
Thesis invalidation: an H1 close above $1.5130.
No early entry, no displacement chasing, and no short directly into the $1.4732–$1.479 demand area.
$XRP #Wyckoff #SMC
Paper analysis only. Not financial advice.
Will the next rebound fail below supply, or will sellers lose control of that zone?
$XRP BEARISH BIAS: the rebound is losing altitude. Chasing a short here is still a bad entry.
Latest confirmed H1 close: $1.4898, 01 Oct 2026 21:59 UTC (02 Oct 04:59 Vietnam). Binance USD-M Futures.
Three clues:
• Lower highs: $1.5440 → $1.5099 → $1.5091.
• H1 closed at $1.4819 below $1.4835 on 2.13× the preceding 20-hour average volume.
• The latest candle swept $1.4963 to $1.4984, then closed back at $1.4898.
Wyckoff: potential redistribution within the recent ~$1.479–$1.507 range; a complete UTAD/SOW/LPSY sequence is NOT confirmed. SMC: bearish BOS and a buy-side rejection favor selling failed rebounds. The bounce also drew volume, so confirmation still matters.
Primary conditional map:
Trigger: H1 close below $1.4835 — already printed.
Entry: $1.501–$1.507 ONLY on a fresh failed retest, followed by an H1 close back below $1.501.
SL: $1.5130, above the local structural high.
TP1: $1.4835 | 2.28R.
TP2: $1.4732 | 3.42R.
R:R uses the $1.5040 entry midpoint.
BEARISH BIAS — NO ENTRY YET.
Price has moved away from the retest zone. A bearish bias is not permission to short at market.
Thesis invalidation: an H1 close above $1.5130.
No early entry, no displacement chasing, and no short directly into the $1.4732–$1.479 demand area.
$XRP #Wyckoff #SMC
Paper analysis only. Not financial advice.
Will the next rebound fail below supply, or will sellers lose control of that zone?
Latest confirmed H1 close: $1.4898, 01 Oct 2026 21:59 UTC (02 Oct 04:59 Vietnam). Binance USD-M Futures.
Three clues:
• Lower highs: $1.5440 → $1.5099 → $1.5091.
• H1 closed at $1.4819 below $1.4835 on 2.13× the preceding 20-hour average volume.
• The latest candle swept $1.4963 to $1.4984, then closed back at $1.4898.
Wyckoff: potential redistribution within the recent ~$1.479–$1.507 range; a complete UTAD/SOW/LPSY sequence is NOT confirmed. SMC: bearish BOS and a buy-side rejection favor selling failed rebounds. The bounce also drew volume, so confirmation still matters.
Primary conditional map:
Trigger: H1 close below $1.4835 — already printed.
Entry: $1.501–$1.507 ONLY on a fresh failed retest, followed by an H1 close back below $1.501.
SL: $1.5130, above the local structural high.
TP1: $1.4835 | 2.28R.
TP2: $1.4732 | 3.42R.
R:R uses the $1.5040 entry midpoint.
BEARISH BIAS — NO ENTRY YET.
Price has moved away from the retest zone. A bearish bias is not permission to short at market.
Thesis invalidation: an H1 close above $1.5130.
No early entry, no displacement chasing, and no short directly into the $1.4732–$1.479 demand area.
$XRP #Wyckoff #SMC
Paper analysis only. Not financial advice.
Will the next rebound fail below supply, or will sellers lose control of that zone?
2
1
141

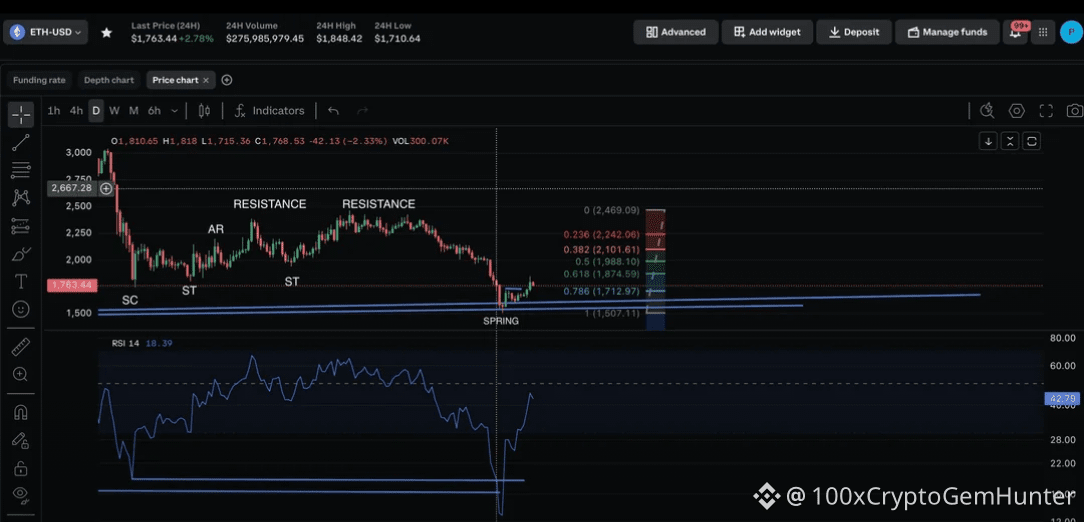
🚨 Is Ethereum ($ETH) Quietly Building a Major Bottom?
{spot}(ETHUSDT)
A growing number of traders believe ETH may be in a Wyckoff Accumulation phase — the stage that often precedes a strong markup move.
📊 Key bullish signals:
✅ Spring at $1,505 followed by a strong recovery
✅ Reclaimed the previous Selling Climax zone near $1,741
✅ Daily RSI reached historically oversold levels before bouncing
✅ Funding rates turned negative, showing traders remain heavily bearish
✅ Large liquidity pools and short positions are stacked above current price
🎯 Key levels to watch:
• $1,875
• $2,000
• $2,100
A breakout and hold above these levels could trigger a significant short squeeze.
❌ Bullish thesis invalidation:
A decisive breakdown below $1,505.
The interesting part? Sentiment remains extremely bearish — exactly the environment where major bottoms often form.
Are we witnessing accumulation before the next leg up, or is this just another bear market rally?
👇 What's your outlook on $ETH?
$ETH $BTC $SOL $BNB $XRP
#Ethereum #ETH #CryptoTrading #wyckoff #TechnicalAnalysis #Altcoins #BinanceSquare #Crypto
🚨 Is Ethereum ($ETH ) Quietly Building a Major Bottom?
A growing number of traders believe ETH may be in a Wyckoff Accumulation phase — the stage that often precedes a strong markup move.
📊 Key bullish signals:
✅ Spring at $1,505 followed by a strong recovery
✅ Reclaimed the previous Selling Climax zone near $1,741
✅ Daily RSI reached historically oversold levels before bouncing
✅ Funding rates turned negative, showing traders remain heavily bearish
✅ Large liquidity pools and short positions are stacked above current price
🎯 Key levels to watch:
• $1,875
• $2,000
• $2,100
A breakout and hold above these levels could trigger a significant short squeeze.
❌ Bullish thesis invalidation:
A decisive breakdown below $1,505.
The interesting part? Sentiment remains extremely bearish — exactly the environment where major bottoms often form.
Are we witnessing accumulation before the next leg up, or is this just another bear market rally?
👇 What's your outlook on $ETH ?
$ETH $BTC $SOL $BNB $XRP
#Ethereum #ETH #CryptoTrading #wyckoff #TechnicalAnalysis #Altcoins #BinanceSquare #Crypto
A growing number of traders believe ETH may be in a Wyckoff Accumulation phase — the stage that often precedes a strong markup move.
📊 Key bullish signals:
✅ Spring at $1,505 followed by a strong recovery
✅ Reclaimed the previous Selling Climax zone near $1,741
✅ Daily RSI reached historically oversold levels before bouncing
✅ Funding rates turned negative, showing traders remain heavily bearish
✅ Large liquidity pools and short positions are stacked above current price
🎯 Key levels to watch:
• $1,875
• $2,000
• $2,100
A breakout and hold above these levels could trigger a significant short squeeze.
❌ Bullish thesis invalidation:
A decisive breakdown below $1,505.
The interesting part? Sentiment remains extremely bearish — exactly the environment where major bottoms often form.
Are we witnessing accumulation before the next leg up, or is this just another bear market rally?
👇 What's your outlook on $ETH ?
$ETH $BTC $SOL $BNB $XRP
#Ethereum #ETH #CryptoTrading #wyckoff #TechnicalAnalysis #Altcoins #BinanceSquare #Crypto
58

🚨 Most people will dismiss this chart.
I did too.
But the longer I study it, the harder it becomes to ignore.
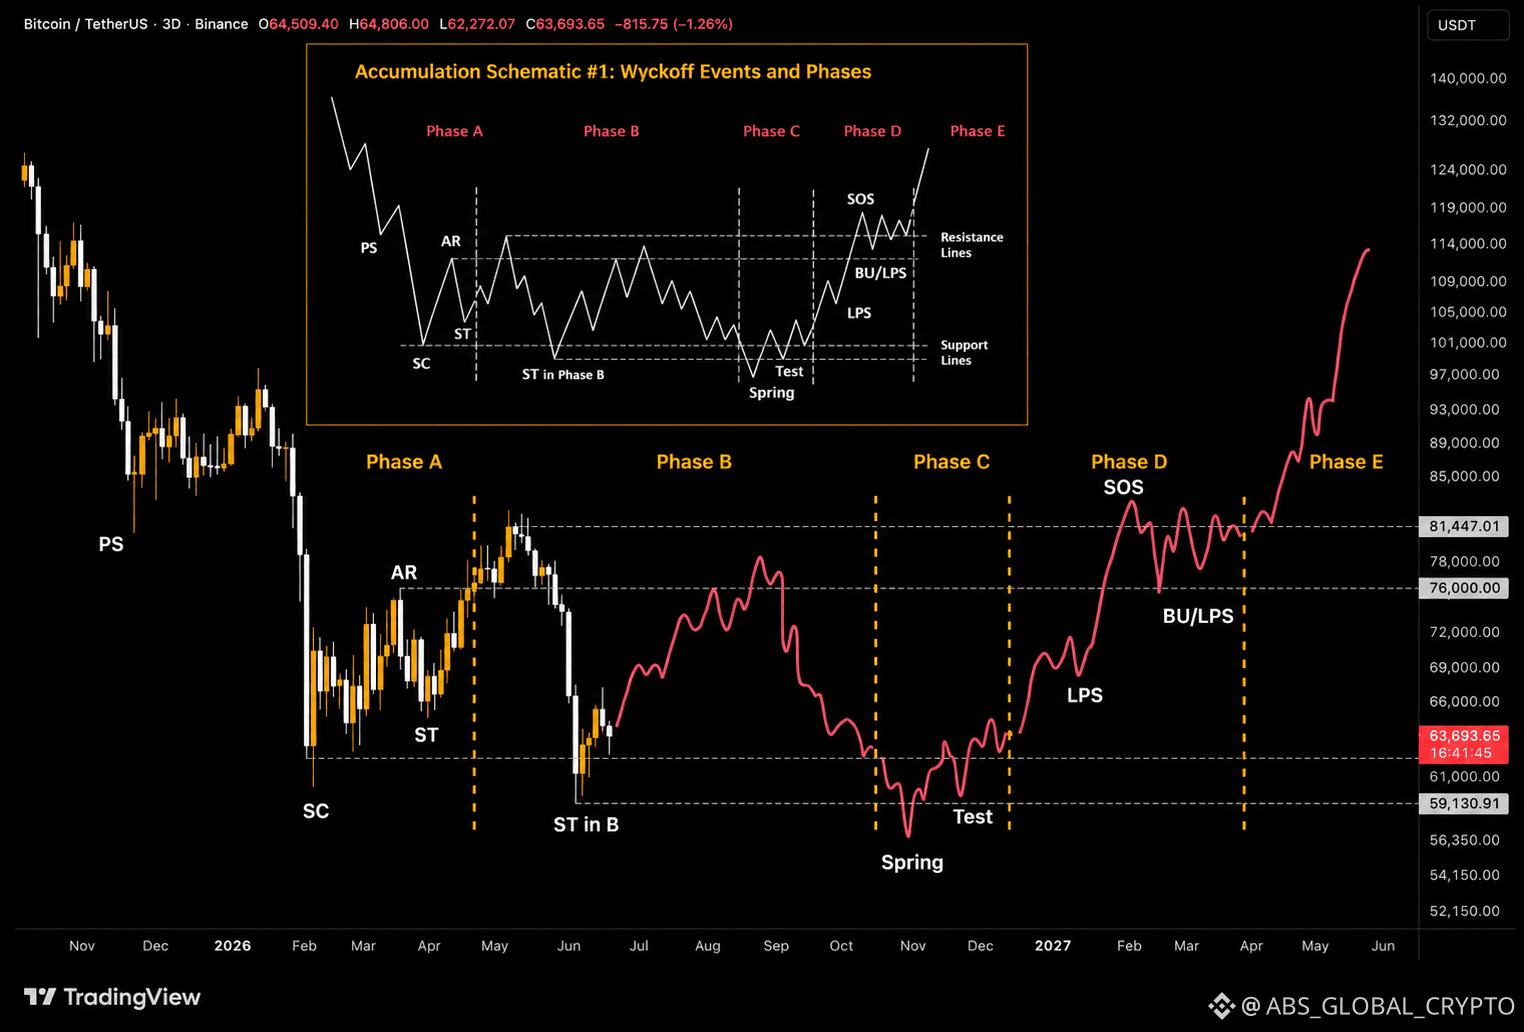
This $BTC structure is following the Wyckoff Accumulation model surprisingly well. 👀
So far we've seen:
✅ Selling Climax (SC)
✅ Automatic Rally (AR)
✅ Secondary Tests (ST)
✅ Extended Accumulation
What's left?
⏳ A potential "Spring" — the phase designed to trap late sellers and shake out weak hands.
If that happens, #bitcoin could spend months moving sideways, frustrating both bulls and bears before the next major trend emerges.
The interesting part?
This scenario aligns closely with the theory that Q3 2026 could mark the final cycle bottom.
Not saying it will happen.
But it's one of the few macro roadmaps that currently makes sense to me.
📊 My view:
65% → Wyckoff plays out.
35% → Market invalidates the structure and takes a different path.
Either way, this chart deserves attention.
Would you buy the Spring?
Or would you think the bull market is over? 🤔👇
{future}(BTCUSDT)
#BTC☀ #Wyckoff
🚨 Most people will dismiss this chart.
I did too.
But the longer I study it, the harder it becomes to ignore.
This $BTC structure is following the Wyckoff Accumulation model surprisingly well. 👀
So far we've seen:
✅ Selling Climax (SC)
✅ Automatic Rally (AR)
✅ Secondary Tests (ST)
✅ Extended Accumulation
What's left?
⏳ A potential "Spring" — the phase designed to trap late sellers and shake out weak hands.
If that happens, #bitcoin could spend months moving sideways, frustrating both bulls and bears before the next major trend emerges.
The interesting part?
This scenario aligns closely with the theory that Q3 2026 could mark the final cycle bottom.
Not saying it will happen.
But it's one of the few macro roadmaps that currently makes sense to me.
📊 My view:
65% → Wyckoff plays out.
35% → Market invalidates the structure and takes a different path.
Either way, this chart deserves attention.
Would you buy the Spring?
Or would you think the bull market is over? 🤔👇
#BTC☀ #Wyckoff
I did too.
But the longer I study it, the harder it becomes to ignore.
This $BTC structure is following the Wyckoff Accumulation model surprisingly well. 👀
So far we've seen:
✅ Selling Climax (SC)
✅ Automatic Rally (AR)
✅ Secondary Tests (ST)
✅ Extended Accumulation
What's left?
⏳ A potential "Spring" — the phase designed to trap late sellers and shake out weak hands.
If that happens, #bitcoin could spend months moving sideways, frustrating both bulls and bears before the next major trend emerges.
The interesting part?
This scenario aligns closely with the theory that Q3 2026 could mark the final cycle bottom.
Not saying it will happen.
But it's one of the few macro roadmaps that currently makes sense to me.
📊 My view:
65% → Wyckoff plays out.
35% → Market invalidates the structure and takes a different path.
Either way, this chart deserves attention.
Would you buy the Spring?
Or would you think the bull market is over? 🤔👇
#BTC☀ #Wyckoff
50

MOST traders are gonna keep LOSING money in crypto due to a simple mistake: focusing on the effect and ignoring the cause.
You see a coin pumping 20% in a day, the FOMO hits, and you rush to buy. That’s trading the effect. It’s the trail of money that’s already moved.
Real profits are made beforehand, at the cause.
According to Wyckoff's Law of Cause and Effect, the strength of a trend (effect) is directly proportional to the time the price spent preparing (cause).
Whales spend weeks quietly accumulating assets, making no noise. When the chart explodes, their work is done and your mistake begins.
Stop chasing giant green candlesticks. Monitor the consolidations with volume.
Are you just gonna keep buying the top or are you gonna learn to track the whales’ accumulation? Comment below.
$ID
#wyckoff
#TradingTips
MOST traders are gonna keep LOSING money in crypto due to a simple mistake: focusing on the effect and ignoring the cause.
You see a coin pumping 20% in a day, the FOMO hits, and you rush to buy. That’s trading the effect. It’s the trail of money that’s already moved.
Real profits are made beforehand, at the cause.
According to Wyckoff's Law of Cause and Effect, the strength of a trend (effect) is directly proportional to the time the price spent preparing (cause).
Whales spend weeks quietly accumulating assets, making no noise. When the chart explodes, their work is done and your mistake begins.
Stop chasing giant green candlesticks. Monitor the consolidations with volume.
Are you just gonna keep buying the top or are you gonna learn to track the whales’ accumulation? Comment below.
$ID
#wyckoff
#TradingTips
You see a coin pumping 20% in a day, the FOMO hits, and you rush to buy. That’s trading the effect. It’s the trail of money that’s already moved.
Real profits are made beforehand, at the cause.
According to Wyckoff's Law of Cause and Effect, the strength of a trend (effect) is directly proportional to the time the price spent preparing (cause).
Whales spend weeks quietly accumulating assets, making no noise. When the chart explodes, their work is done and your mistake begins.
Stop chasing giant green candlesticks. Monitor the consolidations with volume.
Are you just gonna keep buying the top or are you gonna learn to track the whales’ accumulation? Comment below.
$ID
#wyckoff
#TradingTips

211

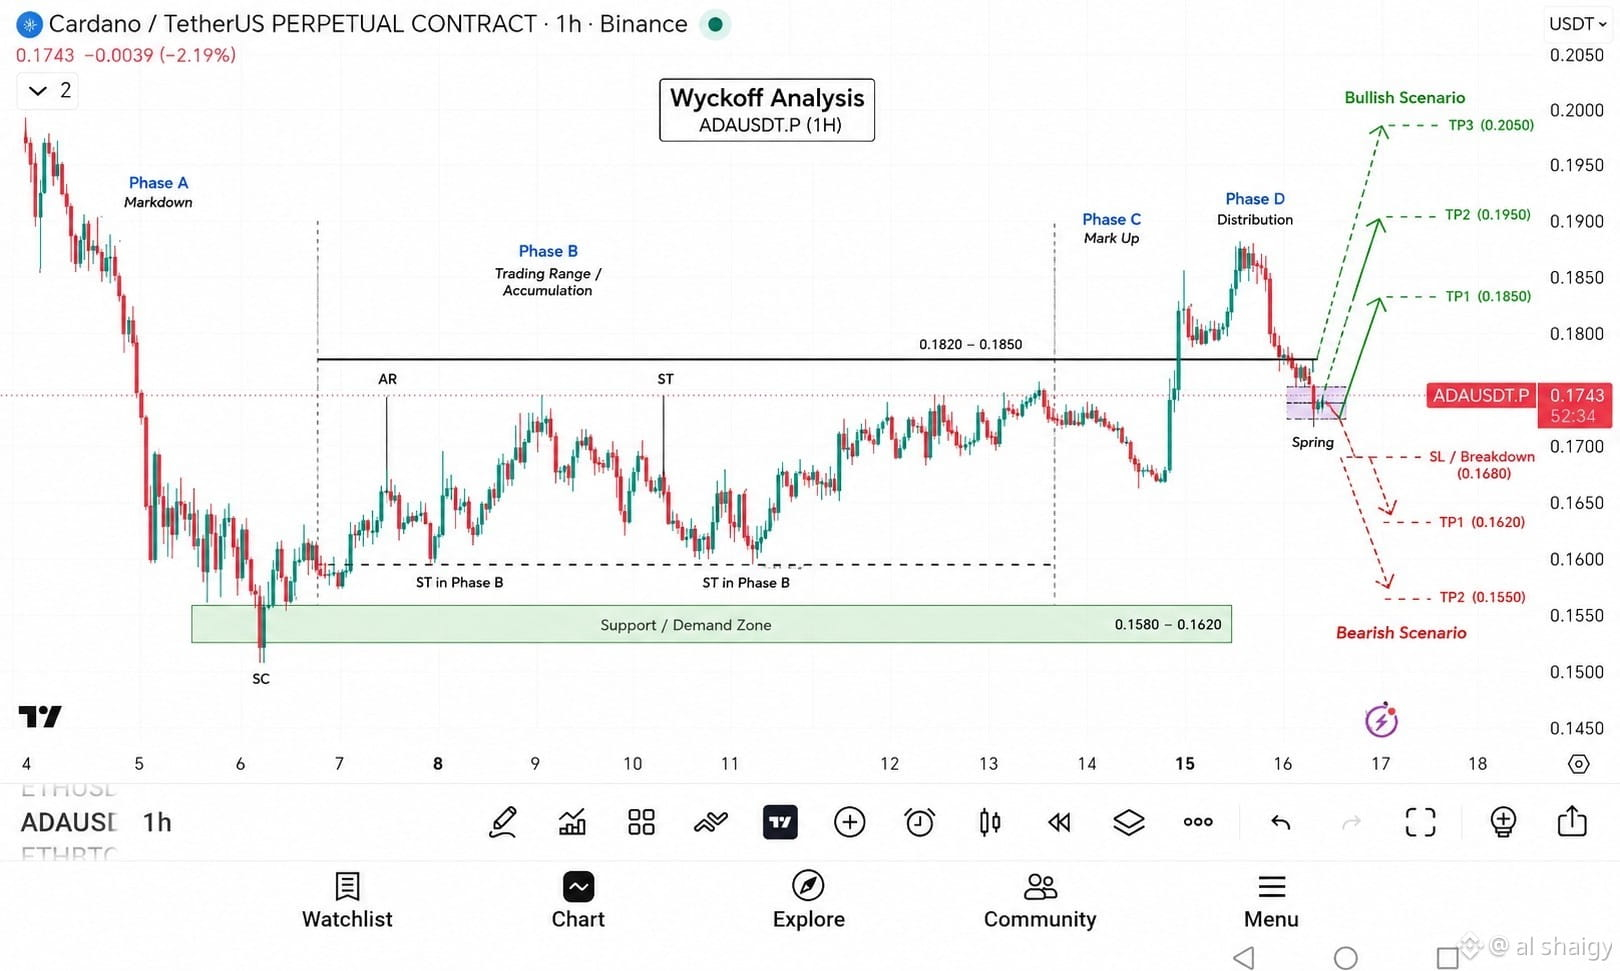
$ADA showing a potential Wyckoff Spring on the 1H candlestick.
✅ Above 0.168 → Targets: 0.185 → 0.195 → 0.205
❌ Below 0.168 → Risk of drop toward 0.162 and 0.155
Key level to watch: 0.168
#ADA #Cardano #Crypto #Wyckoff
#ADAUSDT | Wyckoff Analysis 📊
Looks like #Cardano has wrapped up the Accumulation phase and is now testing a key support area near 0.172-0.174.
🔹 Holding above 0.168 might push the price towards:
🎯 0.185
🎯 0.195
🎯 0.205
🔻 A clear break below 0.168 could open the gates to:
⚠️ 0.162
⚠️ 0.155
Currently, I'm treating the movement as a re-test (Spring) within the Wyckoff model until proven otherwise.
#Crypto #ADA #Cardano #Binance #TradingView #Wyckoff #Altcoins
$ADA showing a potential Wyckoff Spring on the 1H candlestick.
✅ Above 0.168 → Targets: 0.185 → 0.195 → 0.205
❌ Below 0.168 → Risk of drop toward 0.162 and 0.155
Key level to watch: 0.168
#ADA #Cardano #Crypto #Wyckoff
#ADAUSDT | Wyckoff Analysis 📊
Looks like #Cardano has wrapped up the Accumulation phase and is now testing a key support area near 0.172-0.174.
🔹 Holding above 0.168 might push the price towards:
🎯 0.185
🎯 0.195
🎯 0.205
🔻 A clear break below 0.168 could open the gates to:
⚠️ 0.162
⚠️ 0.155
Currently, I'm treating the movement as a re-test (Spring) within the Wyckoff model until proven otherwise.
#Crypto #ADA #Cardano #Binance #TradingView #Wyckoff #Altcoins
✅ Above 0.168 → Targets: 0.185 → 0.195 → 0.205
❌ Below 0.168 → Risk of drop toward 0.162 and 0.155
Key level to watch: 0.168
#ADA #Cardano #Crypto #Wyckoff
#ADAUSDT | Wyckoff Analysis 📊
Looks like #Cardano has wrapped up the Accumulation phase and is now testing a key support area near 0.172-0.174.
🔹 Holding above 0.168 might push the price towards:
🎯 0.185
🎯 0.195
🎯 0.205
🔻 A clear break below 0.168 could open the gates to:
⚠️ 0.162
⚠️ 0.155
Currently, I'm treating the movement as a re-test (Spring) within the Wyckoff model until proven otherwise.
#Crypto #ADA #Cardano #Binance #TradingView #Wyckoff #Altcoins
134

·
--
Bullish
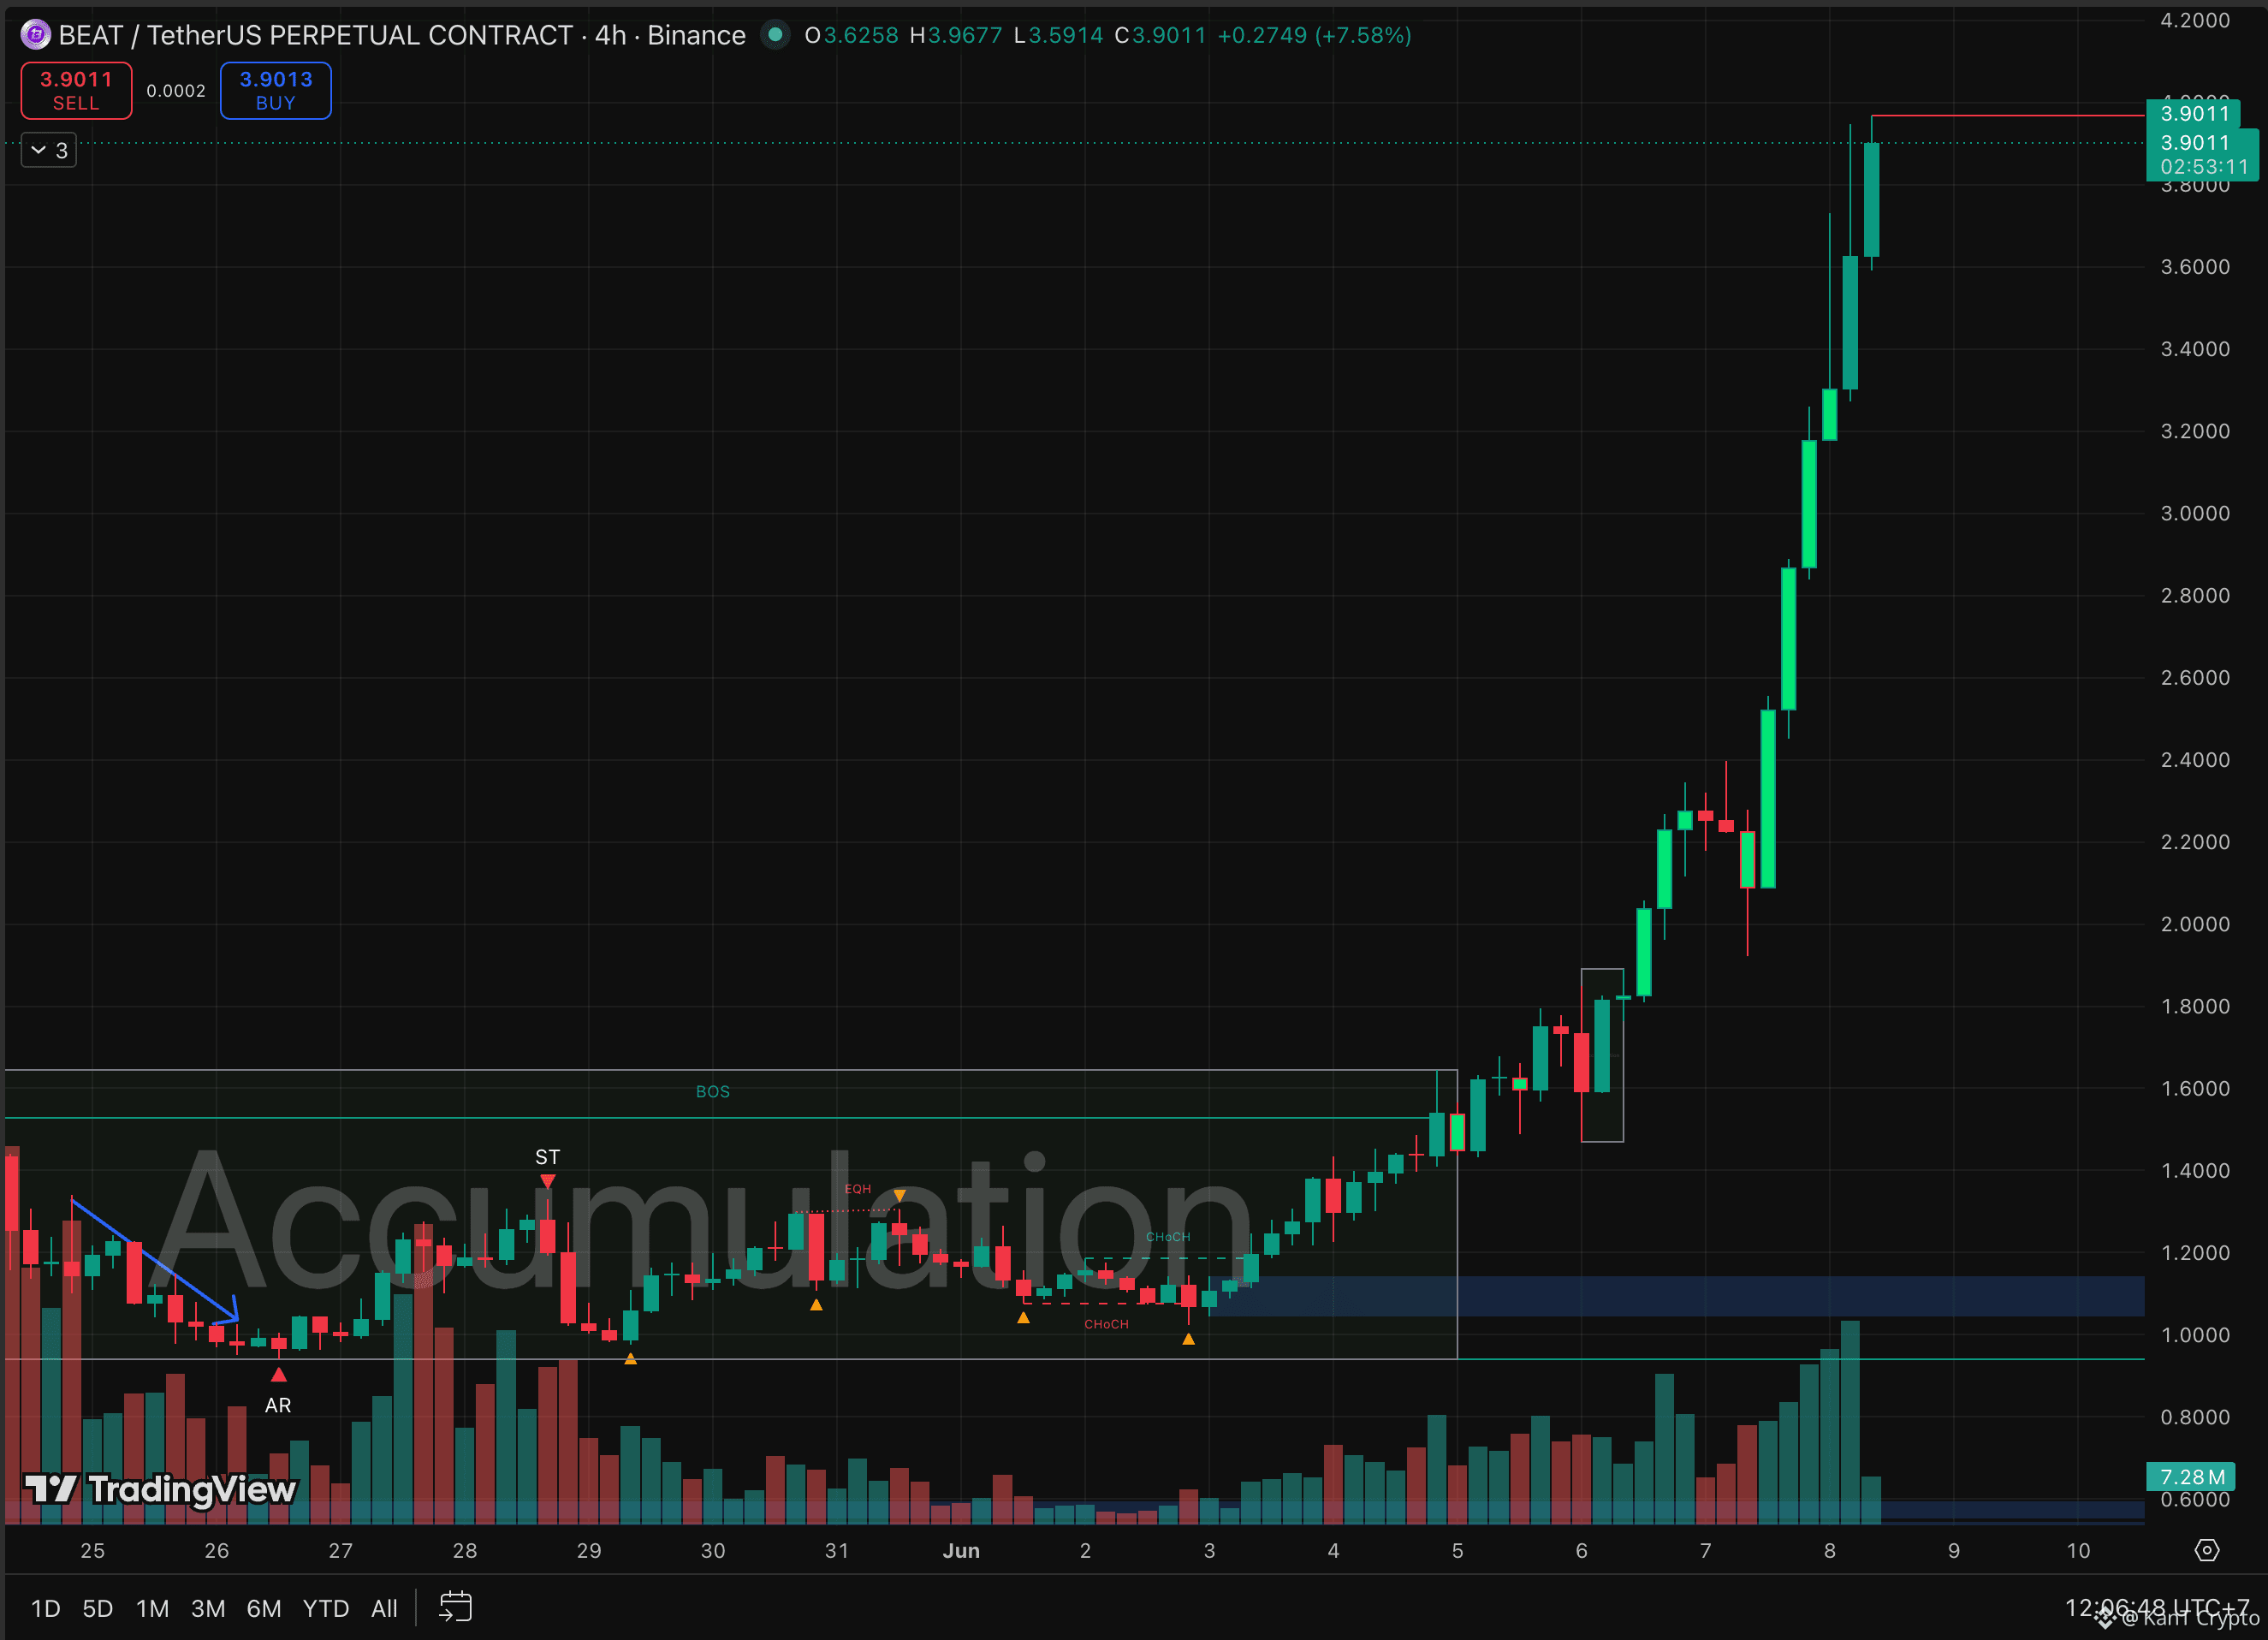
🚀 BEAT/USDT — H4 Signal | Strong Markup
BEAT is on fire — let's break down this clean Wyckoff move. 👇
📊 BEAT spent days building a long accumulation base between ~$1.00 and $1.60. You can see all the Wyckoff footprints — AR and ST testing the lows, then a CHoCH (change of character = trend starting to flip up), and finally a BOS (break of structure = buyers confirmed control) when it pushed above $1.60. That long quiet phase was smart money loading up before the move. 📈
🟢 The result: once it broke out, BEAT exploded — running all the way from $1.60 up to ~$3.90, a massive +140% markup. Strong volume backed every leg up. The trend is firmly bullish. ✅
⚠️ The catch: price is now very extended after that vertical run. Buying right here at the top is risky — when a coin moves this fast, sharp pullbacks happen. The smart play is to wait for a dip, not chase the green candles.
🎯 MY PLAN — buy the pullback, don't chase
👉 LONG setup: Buy zone: $3.20 – $3.45 (pullback to recent support)
Stop-loss (cut if wrong): $2.85
TP1: $4.00 TP2: $4.40 TP3: $4.90
🧭 Simple rule: only buy in the zone while BEAT holds above $2.85. A 4H close below that breaks the structure — step aside. There's solid demand way down at $1.10–1.20 if it dumps harder, but that's a deeper retrace.
Don't chase green candles, take profit at each target, move your stop to breakeven after TP1, and keep leverage low on a coin this volatile. 🙏
💬 Follow me — I'll update the moment BEAT taps the buy zone or breaks higher. Drop a 🔥 if this helped!
Not financial advice — always do your own research.
#beat #smc #wyckoff #Binance
$BEAT
{future}(BEATUSDT)
$LAB
{future}(LABUSDT)
$ZEC
{future}(ZECUSDT)
🚀 BEAT/USDT — H4 Signal | Strong Markup
BEAT is on fire — let's break down this clean Wyckoff move. 👇
📊 BEAT spent days building a long accumulation base between ~$1.00 and $1.60. You can see all the Wyckoff footprints — AR and ST testing the lows, then a CHoCH (change of character = trend starting to flip up), and finally a BOS (break of structure = buyers confirmed control) when it pushed above $1.60. That long quiet phase was smart money loading up before the move. 📈
🟢 The result: once it broke out, BEAT exploded — running all the way from $1.60 up to ~$3.90, a massive +140% markup. Strong volume backed every leg up. The trend is firmly bullish. ✅
⚠️ The catch: price is now very extended after that vertical run. Buying right here at the top is risky — when a coin moves this fast, sharp pullbacks happen. The smart play is to wait for a dip, not chase the green candles.
🎯 MY PLAN — buy the pullback, don't chase
👉 LONG setup: Buy zone: $3.20 – $3.45 (pullback to recent support)
Stop-loss (cut if wrong): $2.85
TP1: $4.00 TP2: $4.40 TP3: $4.90
🧭 Simple rule: only buy in the zone while BEAT holds above $2.85. A 4H close below that breaks the structure — step aside. There's solid demand way down at $1.10–1.20 if it dumps harder, but that's a deeper retrace.
Don't chase green candles, take profit at each target, move your stop to breakeven after TP1, and keep leverage low on a coin this volatile. 🙏
💬 Follow me — I'll update the moment BEAT taps the buy zone or breaks higher. Drop a 🔥 if this helped!
Not financial advice — always do your own research.
#beat #smc #wyckoff #Binance
$BEAT
$LAB
$ZEC
BEAT is on fire — let's break down this clean Wyckoff move. 👇
📊 BEAT spent days building a long accumulation base between ~$1.00 and $1.60. You can see all the Wyckoff footprints — AR and ST testing the lows, then a CHoCH (change of character = trend starting to flip up), and finally a BOS (break of structure = buyers confirmed control) when it pushed above $1.60. That long quiet phase was smart money loading up before the move. 📈
🟢 The result: once it broke out, BEAT exploded — running all the way from $1.60 up to ~$3.90, a massive +140% markup. Strong volume backed every leg up. The trend is firmly bullish. ✅
⚠️ The catch: price is now very extended after that vertical run. Buying right here at the top is risky — when a coin moves this fast, sharp pullbacks happen. The smart play is to wait for a dip, not chase the green candles.
🎯 MY PLAN — buy the pullback, don't chase
👉 LONG setup: Buy zone: $3.20 – $3.45 (pullback to recent support)
Stop-loss (cut if wrong): $2.85
TP1: $4.00 TP2: $4.40 TP3: $4.90
🧭 Simple rule: only buy in the zone while BEAT holds above $2.85. A 4H close below that breaks the structure — step aside. There's solid demand way down at $1.10–1.20 if it dumps harder, but that's a deeper retrace.
Don't chase green candles, take profit at each target, move your stop to breakeven after TP1, and keep leverage low on a coin this volatile. 🙏
💬 Follow me — I'll update the moment BEAT taps the buy zone or breaks higher. Drop a 🔥 if this helped!
Not financial advice — always do your own research.
#beat #smc #wyckoff #Binance
$BEAT
$LAB
$ZEC
1
3
3k
·
--
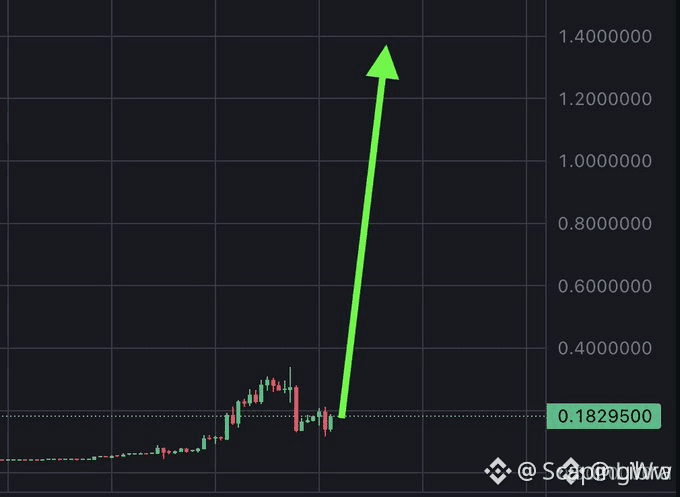
💸 $BANK ISN'T DEAD — ZOOM OUT AND SEE THE LIQUIDITY PLAY 🦈
📌 Price compression on the weekly suggests institutional accumulation is quietly underway. 📊 The macro structure shows a textbook Wyckoff reaccumulation phase, with volume drying up on selloffs and spike bars on bids.
💡 Retail is panicking at micro moves while smart money builds positions in the shadows. 🔍 This is the phase where patience separates the winners from the noise. The question isn't *if* this breaks — it's *when* you decide to position. 💬 Are you watching the daily candles or the weekly story? 👇
⚠️ Not financial advice. Always manage your risk. 🛡️
🏷️ $BANK #Accumulation #Wyckoff #Crypto #SmartMoney
🔍 🦈
💸 $BANK ISN'T DEAD — ZOOM OUT AND SEE THE LIQUIDITY PLAY 🦈
📌 Price compression on the weekly suggests institutional accumulation is quietly underway. 📊 The macro structure shows a textbook Wyckoff reaccumulation phase, with volume drying up on selloffs and spike bars on bids.
💡 Retail is panicking at micro moves while smart money builds positions in the shadows. 🔍 This is the phase where patience separates the winners from the noise. The question isn't *if* this breaks — it's *when* you decide to position. 💬 Are you watching the daily candles or the weekly story? 👇
⚠️ Not financial advice. Always manage your risk. 🛡️
🏷️ $BANK #Accumulation #Wyckoff #Crypto #SmartMoney
🔍 🦈
📌 Price compression on the weekly suggests institutional accumulation is quietly underway. 📊 The macro structure shows a textbook Wyckoff reaccumulation phase, with volume drying up on selloffs and spike bars on bids.
💡 Retail is panicking at micro moves while smart money builds positions in the shadows. 🔍 This is the phase where patience separates the winners from the noise. The question isn't *if* this breaks — it's *when* you decide to position. 💬 Are you watching the daily candles or the weekly story? 👇
⚠️ Not financial advice. Always manage your risk. 🛡️
🏷️ $BANK #Accumulation #Wyckoff #Crypto #SmartMoney
🔍 🦈
110

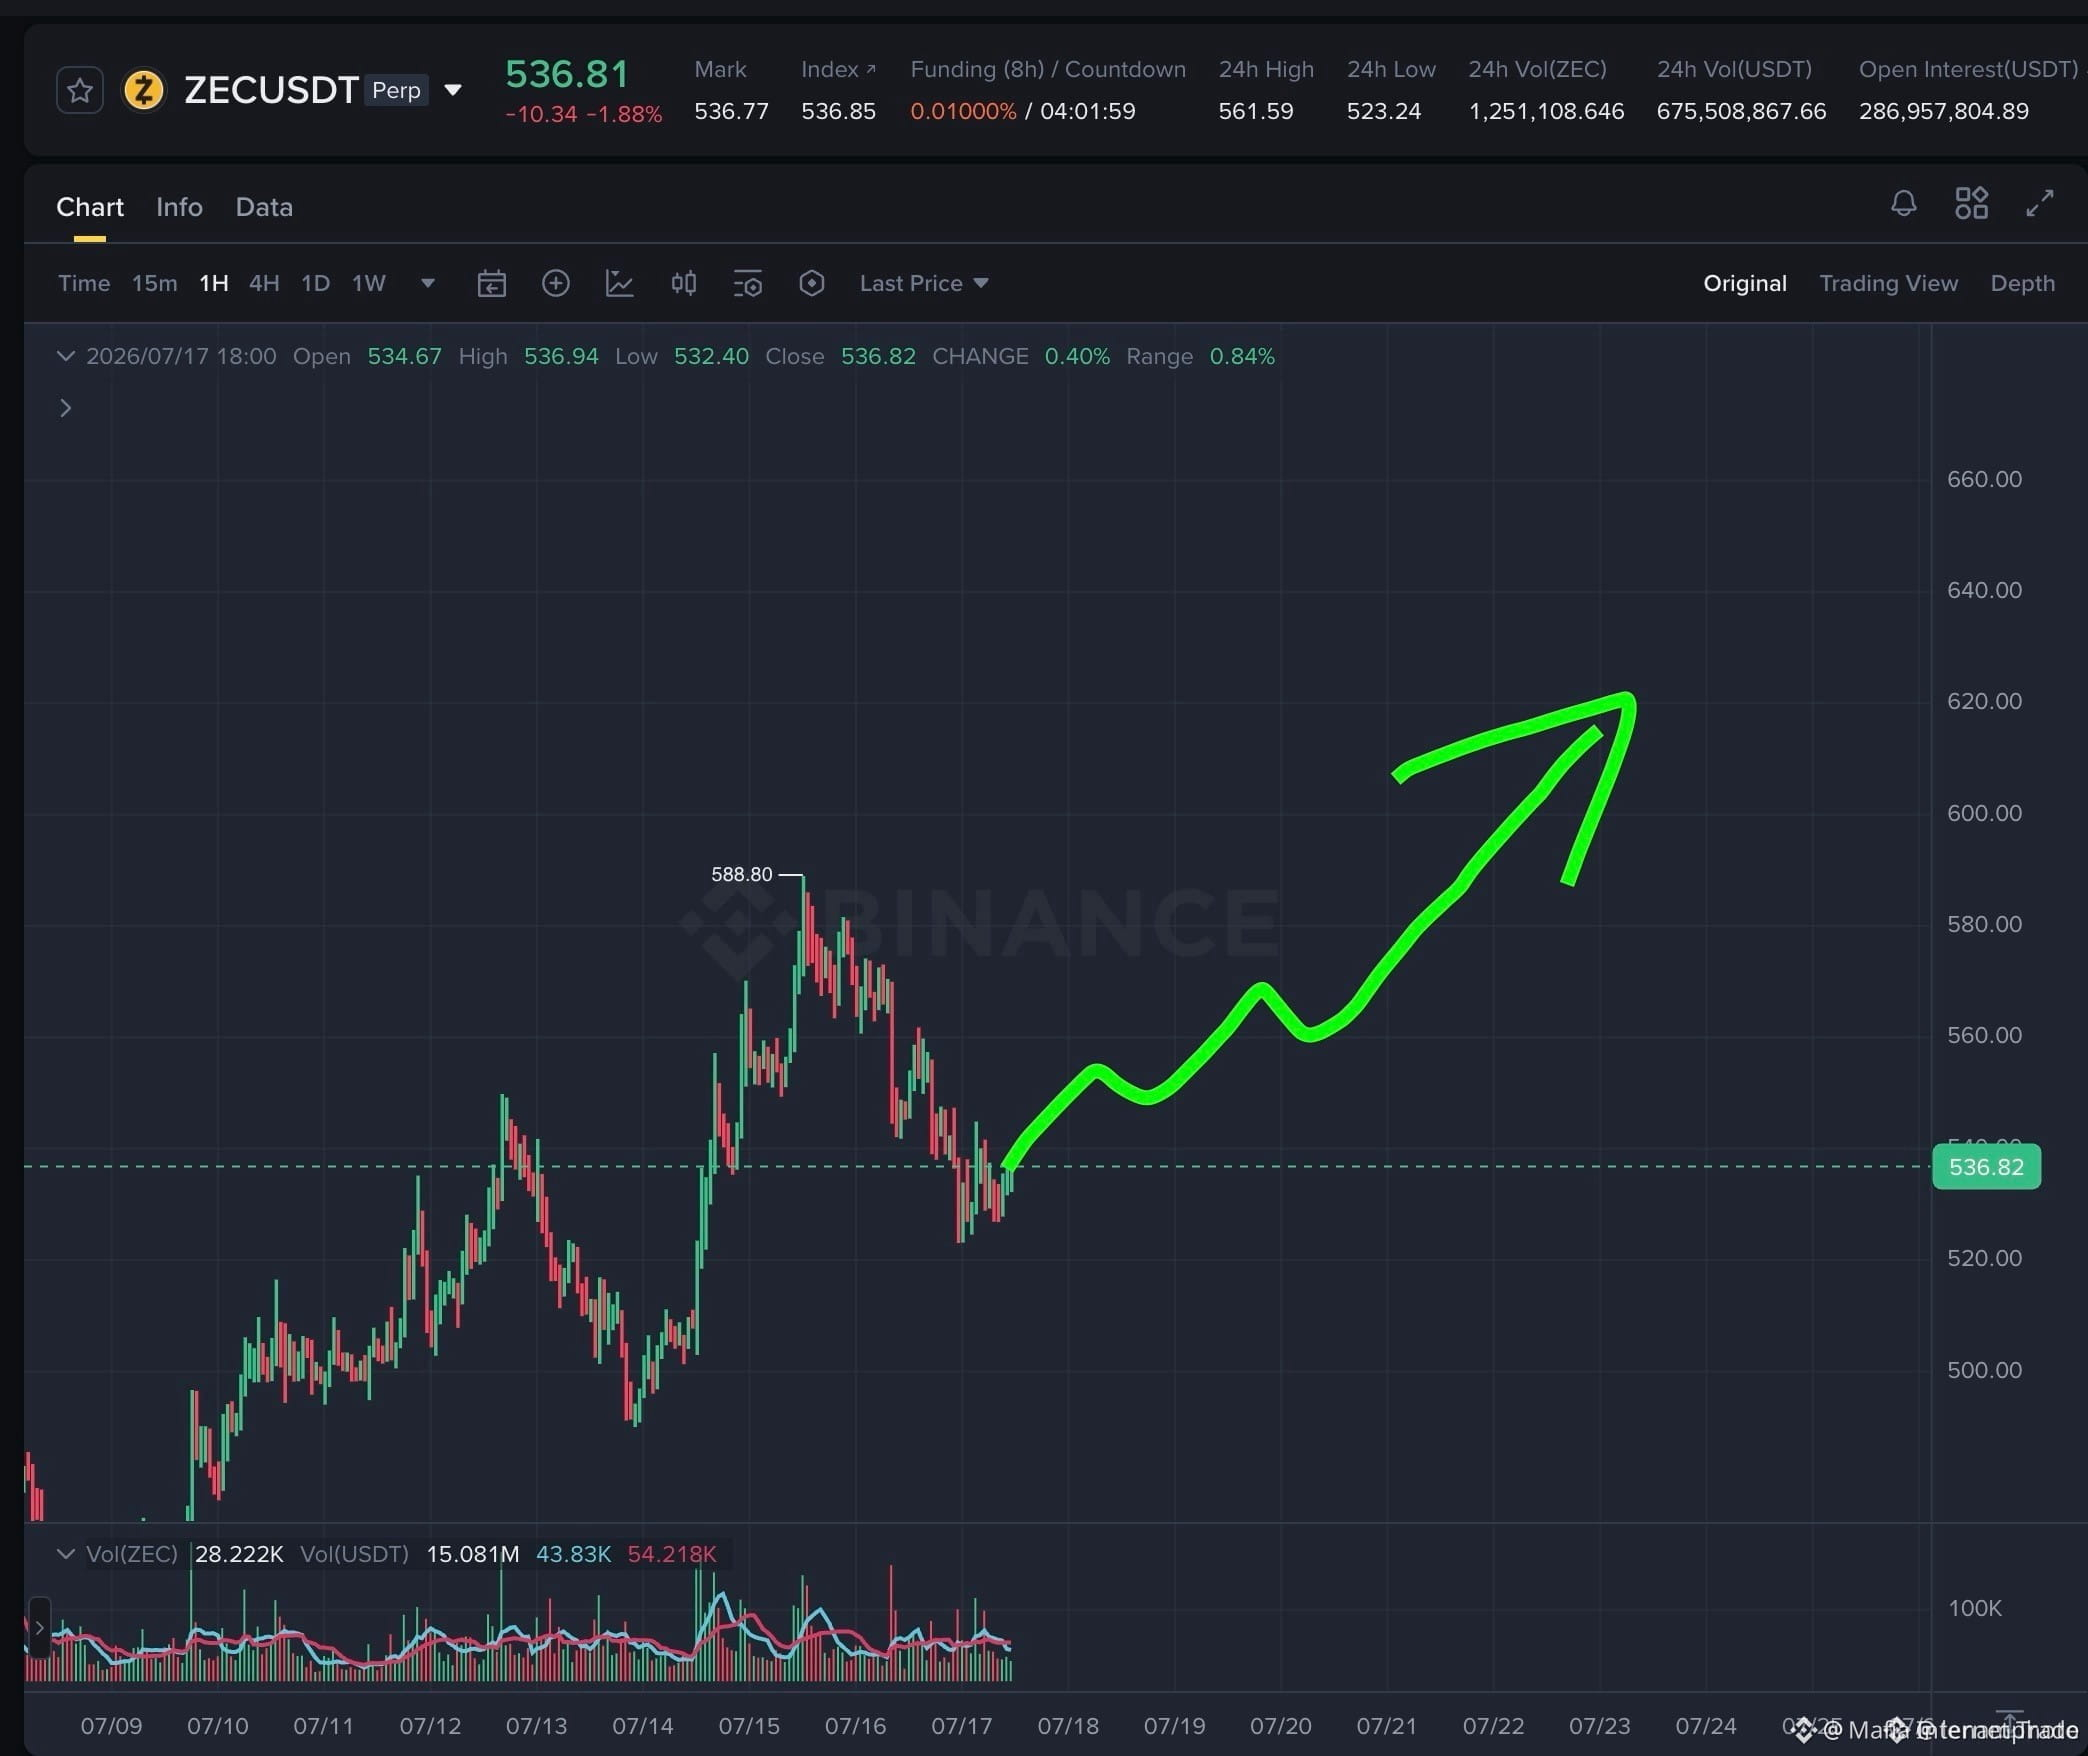
$ZEC WYCKOFF RE-ACCUMULATION ZONE – DIP BUYING ZONE 🔥
Entry: $525 - $537 🔥
Target: $565 🚀
Stop Loss: $505 ⚠️
ZEC just completed a textbook Wyckoff markup from $350 and ran to $588.80. Now it's pulling back into the re-accum zone on declining volume — that's how healthy corrections look. Open interest sits at $286M with funding at 0.01%, meaning no one's crowded into this yet.
The 4H structure points to $623 as the next target once the consolidation clears. $675M in 24H volume confirms real liquidity behind this move, not a low-cap pop. Are you catching this dip or waiting for a lower entry?
Not financial advice. Always manage your risk.
#ZEC #LongSetup #Wyckoff #Crypto
⚡
$ZEC WYCKOFF RE-ACCUMULATION ZONE – DIP BUYING ZONE 🔥
Entry: $525 - $537 🔥
Target: $565 🚀
Stop Loss: $505 ⚠️
ZEC just completed a textbook Wyckoff markup from $350 and ran to $588.80. Now it's pulling back into the re-accum zone on declining volume — that's how healthy corrections look. Open interest sits at $286M with funding at 0.01%, meaning no one's crowded into this yet.
The 4H structure points to $623 as the next target once the consolidation clears. $675M in 24H volume confirms real liquidity behind this move, not a low-cap pop. Are you catching this dip or waiting for a lower entry?
Not financial advice. Always manage your risk.
#ZEC #LongSetup #Wyckoff #Crypto
⚡
Entry: $525 - $537 🔥
Target: $565 🚀
Stop Loss: $505 ⚠️
ZEC just completed a textbook Wyckoff markup from $350 and ran to $588.80. Now it's pulling back into the re-accum zone on declining volume — that's how healthy corrections look. Open interest sits at $286M with funding at 0.01%, meaning no one's crowded into this yet.
The 4H structure points to $623 as the next target once the consolidation clears. $675M in 24H volume confirms real liquidity behind this move, not a low-cap pop. Are you catching this dip or waiting for a lower entry?
Not financial advice. Always manage your risk.
#ZEC #LongSetup #Wyckoff #Crypto
⚡
68

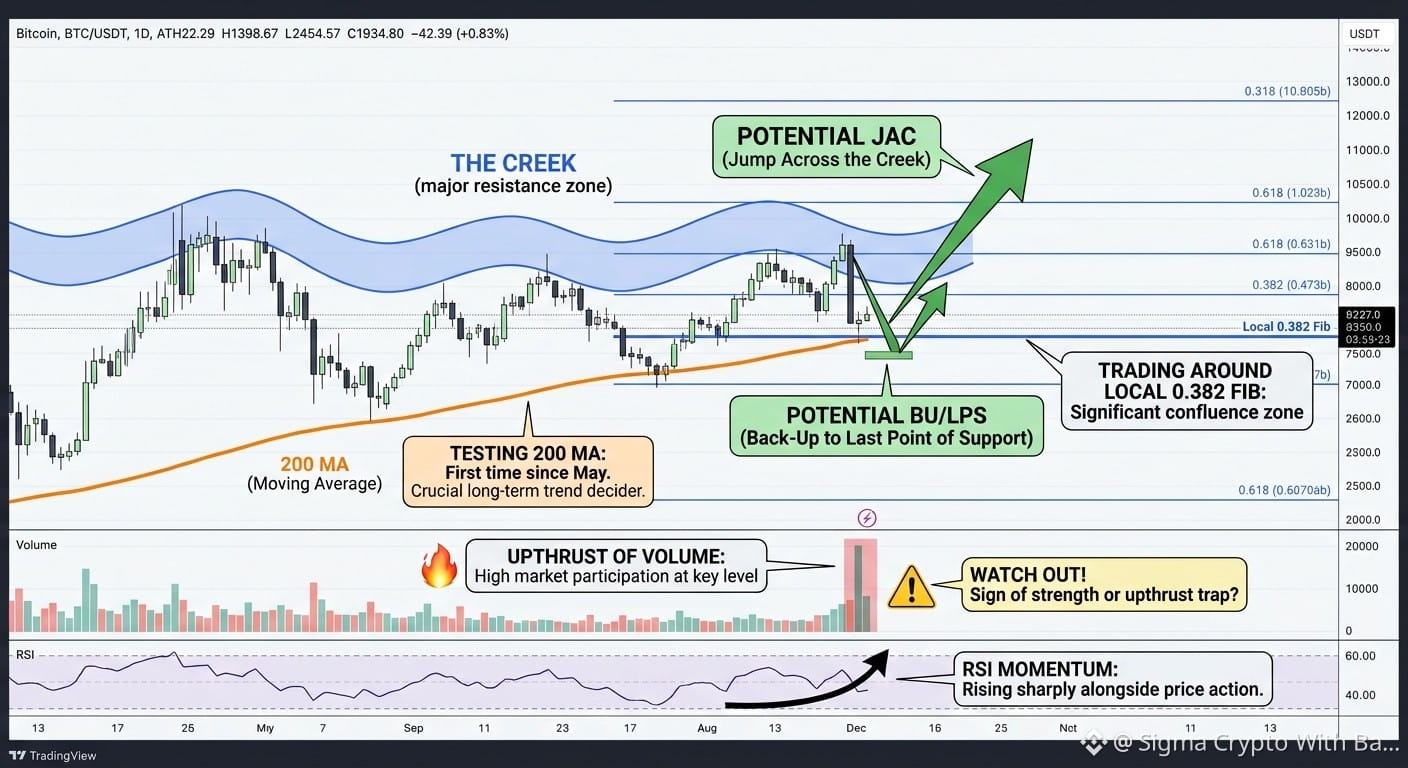
🚀 Bitcoin Testing Major Wyckoff Transition: Jump Across the Creek (JAC)?
#Bitcoin is currently testing key technical inflection points that could decide its next major direction.
💥 Here’s the breakdown:
1. Wyckoff Structure: Seeking a Sign of Strength (SOS)
The Setup: BTC is attempting a potential Jump Across the Creek (JAC). In Wyckoff terms, this represents a decisive breakout above a major resistance zone ("the creek").
What to Watch: If confirmed, we should expect a classic Back-Up (BU) / Last Point of Support (LPS) retest of former resistance to validate the breakout before markup continues.
2. Critical Technical Levels
200 MA Retest: Testing the 200-day Moving Average for the 1st time since May. Reclaiming this long-term trend indicator is vital for institutional macro confirmation.
0.382 Fibonacci Level: Hovering right around the local 0.382 Fib retracement, creating a tight confluence zone between moving average resistance and dynamic Fib levels.
3. Volume & Momentum: Surge vs. Trap
Volume Spike: A major upthrust in volume shows strong market participation, but where it closes matters most.
RSI Momentum: Relative Strength Index is accelerating upward alongside the price action.
👉 The Risk: High volume at resistance can signal institutional absorption (breakout fuel) OR an Upthrust (UT) designed to trap late buyers if the candle fails to hold above the level.
💡 Key Takeaway: We are at a make-or-break pivot. A daily close above the 200 MA and Fib confluence confirms a valid Wyckoff JAC. A sharp rejection on this heavy volume signals an Upthrust liquidity trap.
Are you buying the breakout or waiting for the pullback test? Drop your analysis below! 👇
#BTC #TechnicalAnalysis #wyckoff $BTC
🚀 Bitcoin Testing Major Wyckoff Transition: Jump Across the Creek (JAC)?
#Bitcoin is currently testing key technical inflection points that could decide its next major direction.
💥 Here’s the breakdown:
1. Wyckoff Structure: Seeking a Sign of Strength (SOS)
The Setup: BTC is attempting a potential Jump Across the Creek (JAC). In Wyckoff terms, this represents a decisive breakout above a major resistance zone ("the creek").
What to Watch: If confirmed, we should expect a classic Back-Up (BU) / Last Point of Support (LPS) retest of former resistance to validate the breakout before markup continues.
2. Critical Technical Levels
200 MA Retest: Testing the 200-day Moving Average for the 1st time since May. Reclaiming this long-term trend indicator is vital for institutional macro confirmation.
0.382 Fibonacci Level: Hovering right around the local 0.382 Fib retracement, creating a tight confluence zone between moving average resistance and dynamic Fib levels.
3. Volume & Momentum: Surge vs. Trap
Volume Spike: A major upthrust in volume shows strong market participation, but where it closes matters most.
RSI Momentum: Relative Strength Index is accelerating upward alongside the price action.
👉 The Risk: High volume at resistance can signal institutional absorption (breakout fuel) OR an Upthrust (UT) designed to trap late buyers if the candle fails to hold above the level.
💡 Key Takeaway: We are at a make-or-break pivot. A daily close above the 200 MA and Fib confluence confirms a valid Wyckoff JAC. A sharp rejection on this heavy volume signals an Upthrust liquidity trap.
Are you buying the breakout or waiting for the pullback test? Drop your analysis below! 👇
#BTC #TechnicalAnalysis #wyckoff $BTC
#Bitcoin is currently testing key technical inflection points that could decide its next major direction.
💥 Here’s the breakdown:
1. Wyckoff Structure: Seeking a Sign of Strength (SOS)
The Setup: BTC is attempting a potential Jump Across the Creek (JAC). In Wyckoff terms, this represents a decisive breakout above a major resistance zone ("the creek").
What to Watch: If confirmed, we should expect a classic Back-Up (BU) / Last Point of Support (LPS) retest of former resistance to validate the breakout before markup continues.
2. Critical Technical Levels
200 MA Retest: Testing the 200-day Moving Average for the 1st time since May. Reclaiming this long-term trend indicator is vital for institutional macro confirmation.
0.382 Fibonacci Level: Hovering right around the local 0.382 Fib retracement, creating a tight confluence zone between moving average resistance and dynamic Fib levels.
3. Volume & Momentum: Surge vs. Trap
Volume Spike: A major upthrust in volume shows strong market participation, but where it closes matters most.
RSI Momentum: Relative Strength Index is accelerating upward alongside the price action.
👉 The Risk: High volume at resistance can signal institutional absorption (breakout fuel) OR an Upthrust (UT) designed to trap late buyers if the candle fails to hold above the level.
💡 Key Takeaway: We are at a make-or-break pivot. A daily close above the 200 MA and Fib confluence confirms a valid Wyckoff JAC. A sharp rejection on this heavy volume signals an Upthrust liquidity trap.
Are you buying the breakout or waiting for the pullback test? Drop your analysis below! 👇
#BTC #TechnicalAnalysis #wyckoff $BTC
235
·
--
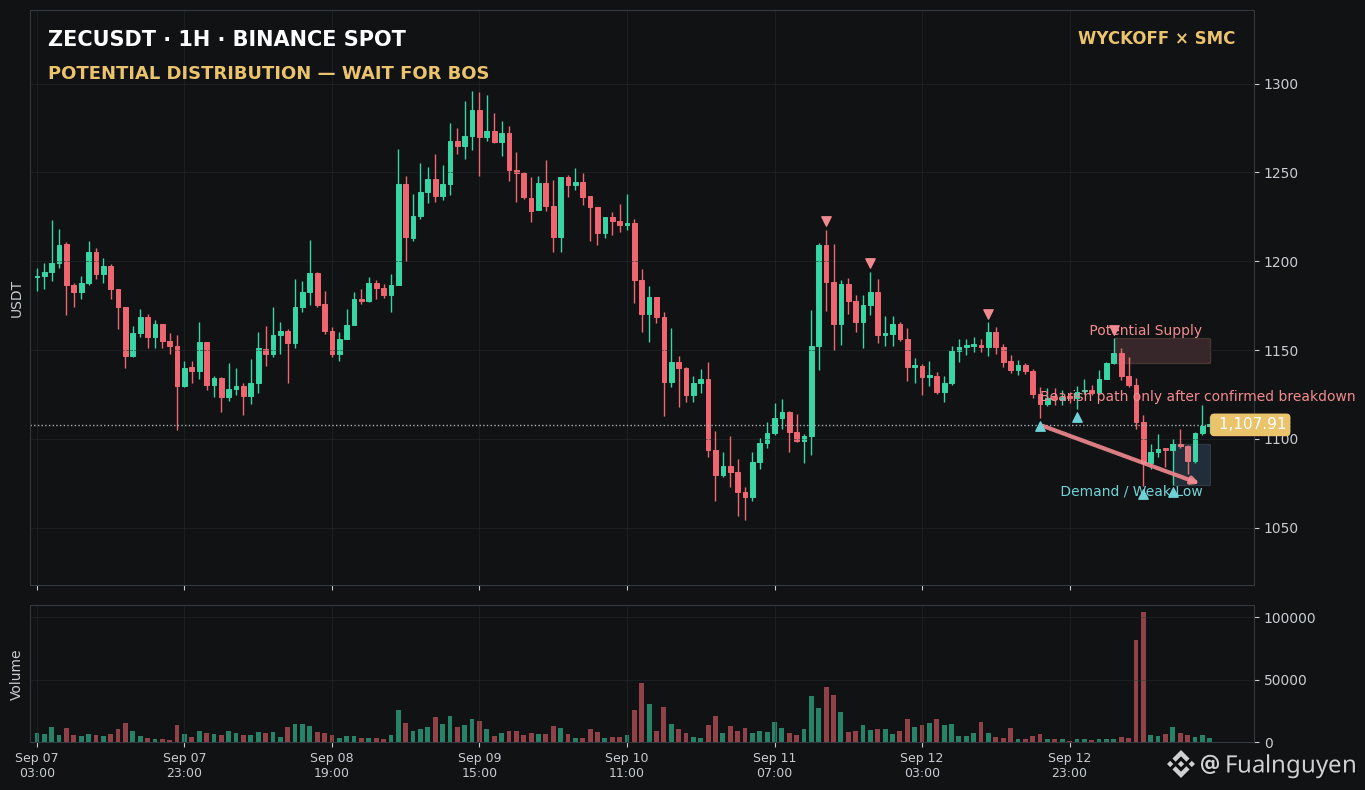
$ZEC is trying to bounce—but the H1 structure still looks like a potential distribution.
After the expansion toward $1,300, price began printing lower highs while every recovery attracted fresh supply. The latest rejection near $1,150–$1,157 strengthens the idea that Smart Money may still be distributing into strength rather than preparing an immediate breakout.
The key level is now $1,074.
As long as ZEC remains above it, the bearish thesis is NOT confirmed. This is still a range, not permission to chase a short.
But an H1 close below $1,074 would create the bearish BOS I am waiting for. That could open the path toward the $1,050 liquidity pocket first, followed by the psychological $1,000 zone if sellers maintain control.
My map:
🔴 Rejection below $1,150–$1,157 + H1 close under $1,074 = distribution confirmation and downside continuation
🟡 Holding $1,074 = no trade; price remains trapped inside the range
🟢 Reclaiming $1,157 with acceptance = bearish thesis invalidated and the market may attack higher liquidity again
I am not predicting a crash before confirmation. I am watching whether the weak low breaks after supply has already shown its hand.
Would you trade the breakdown below $1,074—or wait for a retest before acting? 👀
#ZEC #Wyckoff #SMC
Analysis based on closed Binance Spot H1 candles. Not financial advice.
$ZEC is trying to bounce—but the H1 structure still looks like a potential distribution.
After the expansion toward $1,300, price began printing lower highs while every recovery attracted fresh supply. The latest rejection near $1,150–$1,157 strengthens the idea that Smart Money may still be distributing into strength rather than preparing an immediate breakout.
The key level is now $1,074.
As long as ZEC remains above it, the bearish thesis is NOT confirmed. This is still a range, not permission to chase a short.
But an H1 close below $1,074 would create the bearish BOS I am waiting for. That could open the path toward the $1,050 liquidity pocket first, followed by the psychological $1,000 zone if sellers maintain control.
My map:
🔴 Rejection below $1,150–$1,157 + H1 close under $1,074 = distribution confirmation and downside continuation
🟡 Holding $1,074 = no trade; price remains trapped inside the range
🟢 Reclaiming $1,157 with acceptance = bearish thesis invalidated and the market may attack higher liquidity again
I am not predicting a crash before confirmation. I am watching whether the weak low breaks after supply has already shown its hand.
Would you trade the breakdown below $1,074—or wait for a retest before acting? 👀
#ZEC #Wyckoff #SMC
Analysis based on closed Binance Spot H1 candles. Not financial advice.
After the expansion toward $1,300, price began printing lower highs while every recovery attracted fresh supply. The latest rejection near $1,150–$1,157 strengthens the idea that Smart Money may still be distributing into strength rather than preparing an immediate breakout.
The key level is now $1,074.
As long as ZEC remains above it, the bearish thesis is NOT confirmed. This is still a range, not permission to chase a short.
But an H1 close below $1,074 would create the bearish BOS I am waiting for. That could open the path toward the $1,050 liquidity pocket first, followed by the psychological $1,000 zone if sellers maintain control.
My map:
🔴 Rejection below $1,150–$1,157 + H1 close under $1,074 = distribution confirmation and downside continuation
🟡 Holding $1,074 = no trade; price remains trapped inside the range
🟢 Reclaiming $1,157 with acceptance = bearish thesis invalidated and the market may attack higher liquidity again
I am not predicting a crash before confirmation. I am watching whether the weak low breaks after supply has already shown its hand.
Would you trade the breakdown below $1,074—or wait for a retest before acting? 👀
#ZEC #Wyckoff #SMC
Analysis based on closed Binance Spot H1 candles. Not financial advice.
1
6
2.2k
·
--
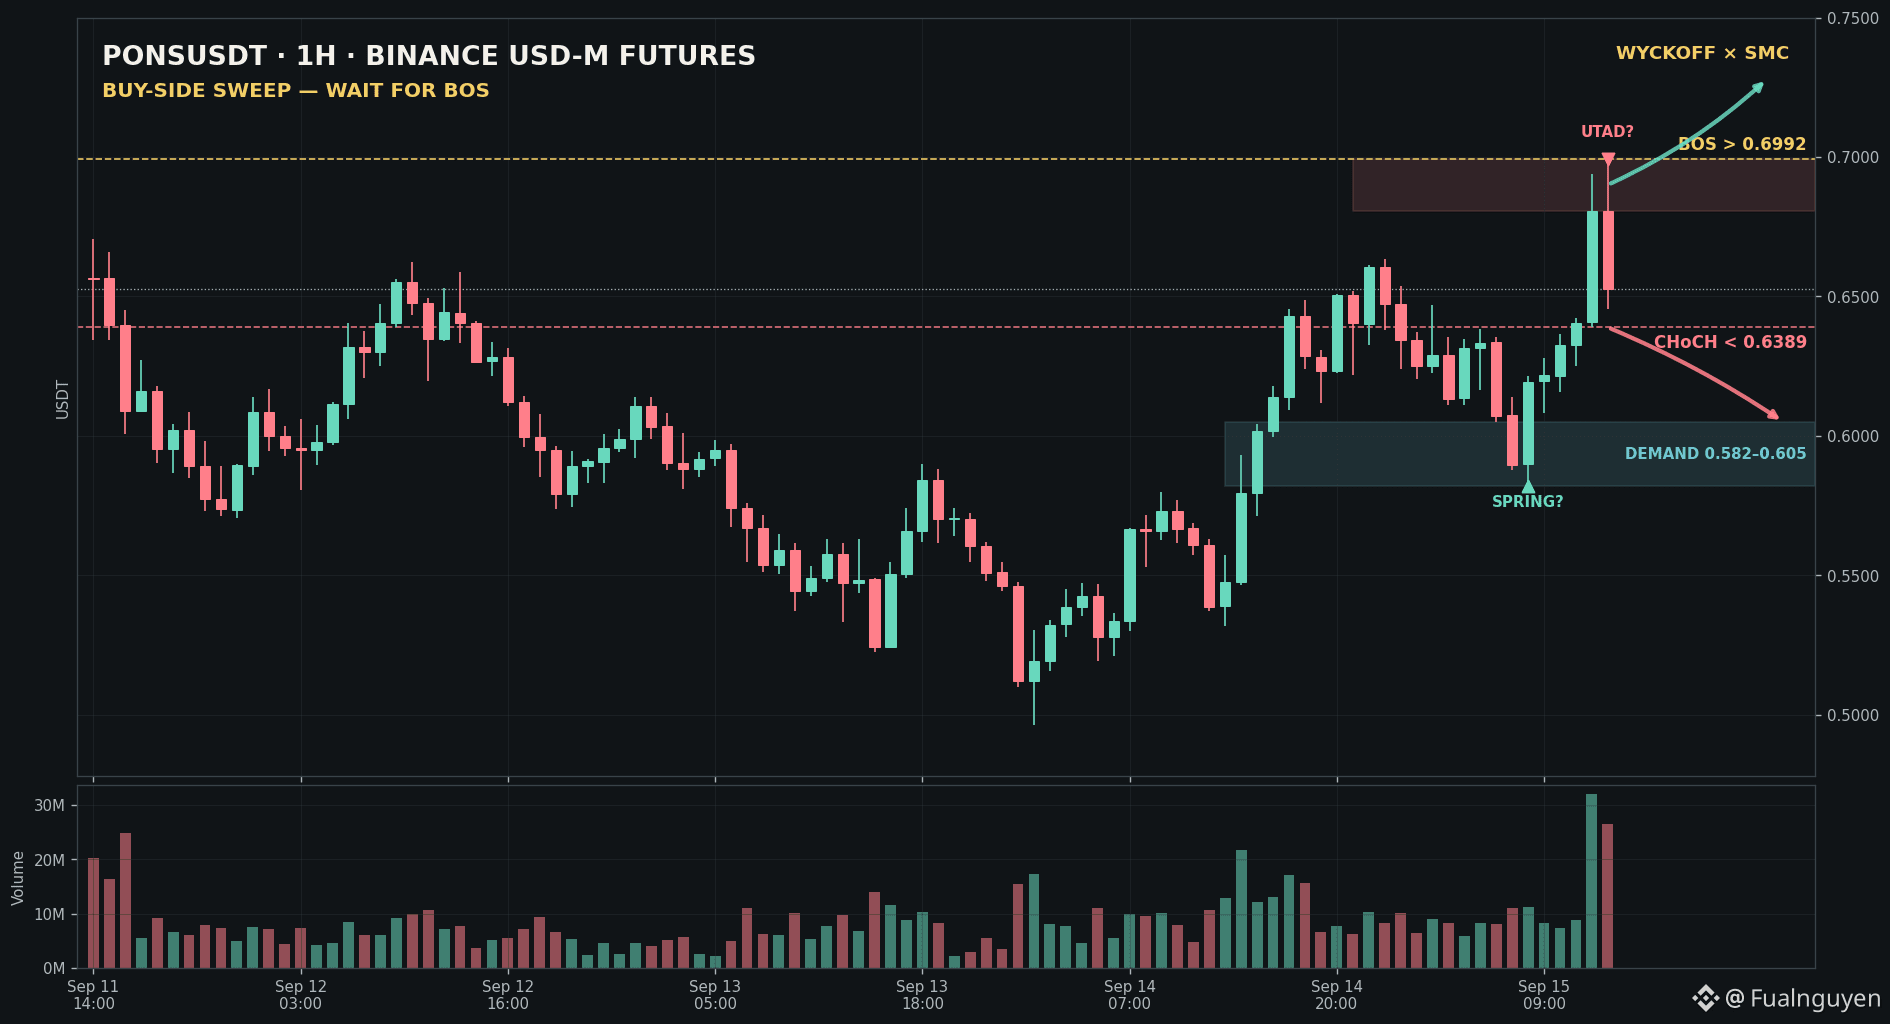
PONS JUST SWEPT BOTH SIDES — AND THIS IS WHERE TRADERS GET TRAPPED.
PONSUSDT H1 Futures first swept sell-side liquidity at $0.5821, reclaimed demand and expanded sharply toward $0.70.
That looked like a Wyckoff Spring moving into SOS.
Then the market changed the question.
The latest closed candle pushed through buy-side liquidity to $0.6992, rejected immediately and closed at $0.6527 on roughly 2.45× the 20-hour average volume.
In Wyckoff terms, this may be an Upthrust/UTAD candidate. In SMC terms, supply reacted—but a bearish structure break is not confirmed yet.
My confirmation map:
🟢 An H1 close above $0.6992, followed by a successful retest, would invalidate the rejection and confirm bullish BOS.
🟡 Holding above $0.6389 keeps the recovery structure alive, but price remains trapped between reclaimed demand and fresh supply.
🔴 An H1 close below $0.6389 would confirm CHoCH and expose $0.605–$0.582. Losing $0.5821 would invalidate the accumulation thesis and reopen $0.532–$0.496.
The trap is buying the expansion candle—or shorting before structure actually breaks.
Smart Money has tested both sides of liquidity. Now I want the next closed candle to reveal which sweep was the real one.
Which happens first: BOS above $0.6992 or CHoCH below $0.6389? 👀
Paper analysis only. Not financial advice.
$PONS #PONS #Wyckoff #SMC
PONS JUST SWEPT BOTH SIDES — AND THIS IS WHERE TRADERS GET TRAPPED.
PONSUSDT H1 Futures first swept sell-side liquidity at $0.5821, reclaimed demand and expanded sharply toward $0.70.
That looked like a Wyckoff Spring moving into SOS.
Then the market changed the question.
The latest closed candle pushed through buy-side liquidity to $0.6992, rejected immediately and closed at $0.6527 on roughly 2.45× the 20-hour average volume.
In Wyckoff terms, this may be an Upthrust/UTAD candidate. In SMC terms, supply reacted—but a bearish structure break is not confirmed yet.
My confirmation map:
🟢 An H1 close above $0.6992, followed by a successful retest, would invalidate the rejection and confirm bullish BOS.
🟡 Holding above $0.6389 keeps the recovery structure alive, but price remains trapped between reclaimed demand and fresh supply.
🔴 An H1 close below $0.6389 would confirm CHoCH and expose $0.605–$0.582. Losing $0.5821 would invalidate the accumulation thesis and reopen $0.532–$0.496.
The trap is buying the expansion candle—or shorting before structure actually breaks.
Smart Money has tested both sides of liquidity. Now I want the next closed candle to reveal which sweep was the real one.
Which happens first: BOS above $0.6992 or CHoCH below $0.6389? 👀
Paper analysis only. Not financial advice.
$PONS #PONS #Wyckoff #SMC
PONSUSDT H1 Futures first swept sell-side liquidity at $0.5821, reclaimed demand and expanded sharply toward $0.70.
That looked like a Wyckoff Spring moving into SOS.
Then the market changed the question.
The latest closed candle pushed through buy-side liquidity to $0.6992, rejected immediately and closed at $0.6527 on roughly 2.45× the 20-hour average volume.
In Wyckoff terms, this may be an Upthrust/UTAD candidate. In SMC terms, supply reacted—but a bearish structure break is not confirmed yet.
My confirmation map:
🟢 An H1 close above $0.6992, followed by a successful retest, would invalidate the rejection and confirm bullish BOS.
🟡 Holding above $0.6389 keeps the recovery structure alive, but price remains trapped between reclaimed demand and fresh supply.
🔴 An H1 close below $0.6389 would confirm CHoCH and expose $0.605–$0.582. Losing $0.5821 would invalidate the accumulation thesis and reopen $0.532–$0.496.
The trap is buying the expansion candle—or shorting before structure actually breaks.
Smart Money has tested both sides of liquidity. Now I want the next closed candle to reveal which sweep was the real one.
Which happens first: BOS above $0.6992 or CHoCH below $0.6389? 👀
Paper analysis only. Not financial advice.
$PONS #PONS #Wyckoff #SMC
6
2
638
·
--
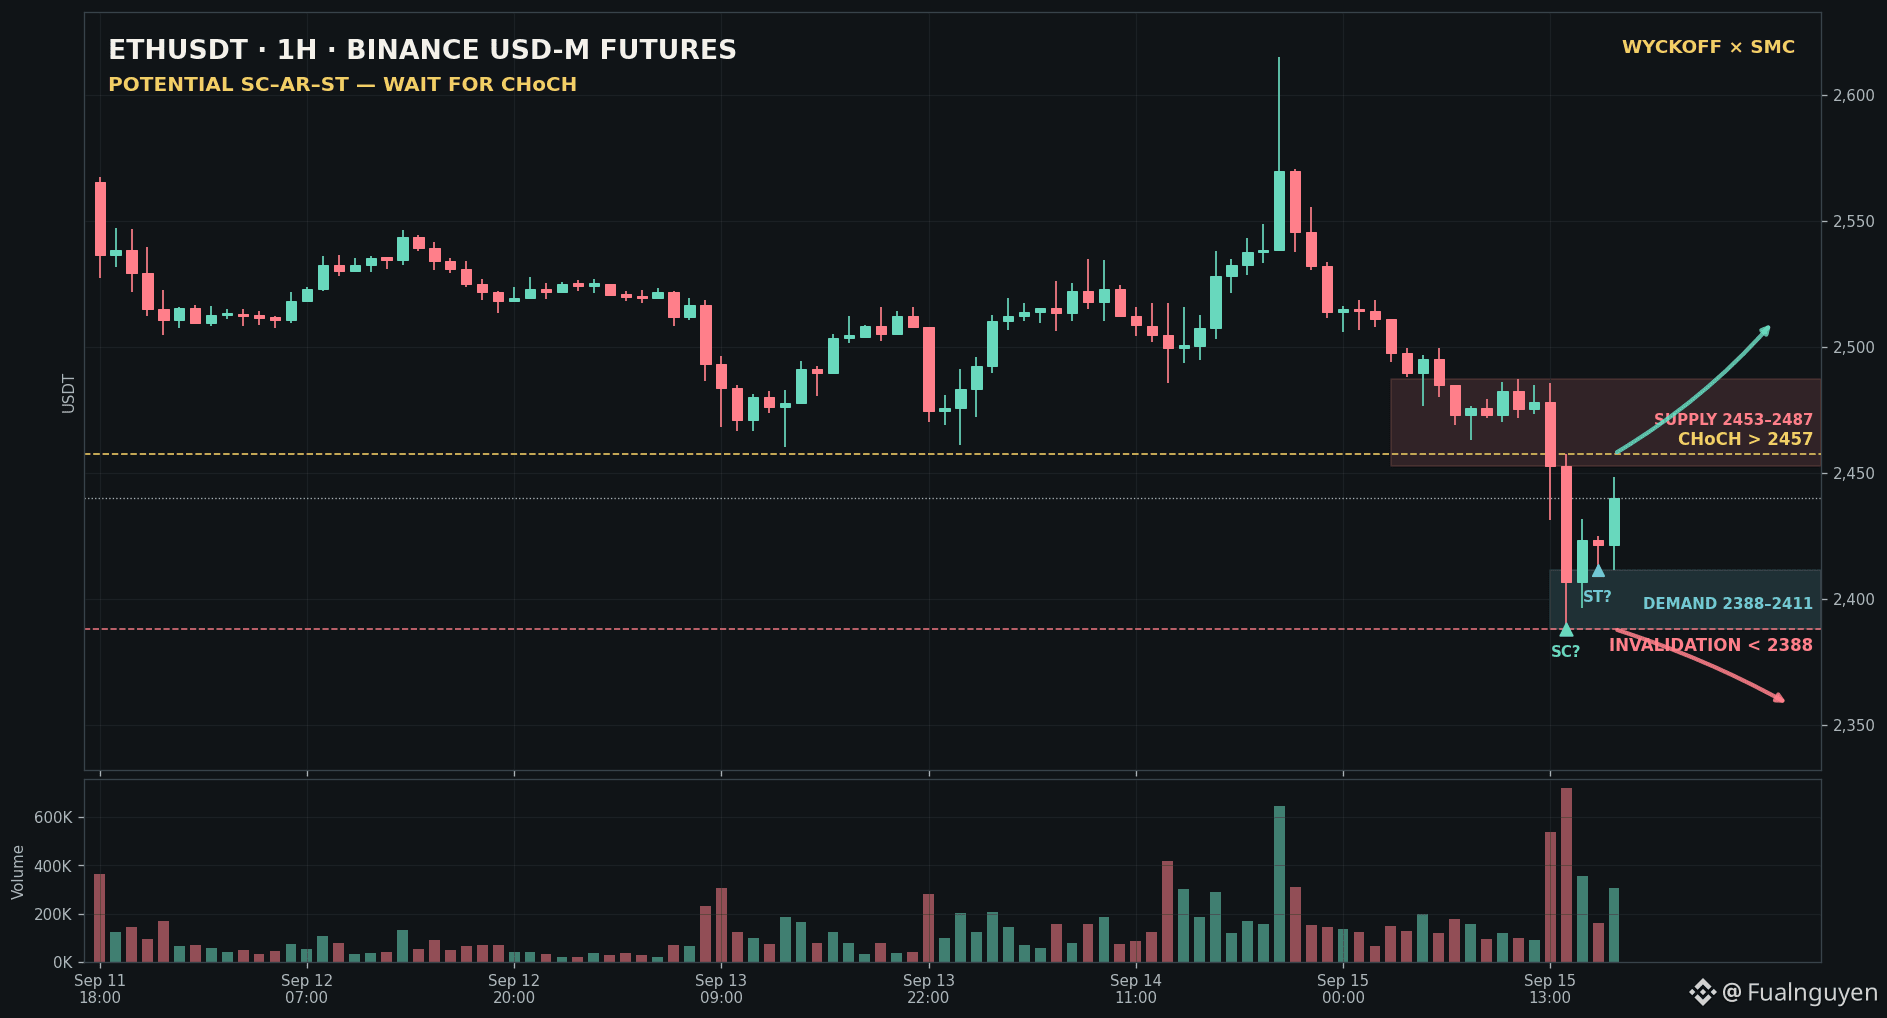
ETH JUST FLUSHED $2,388 — BUT THIS IS NOT A BUY SIGNAL YET.
ETHUSDT H1 Futures broke through local support and printed a sharp reaction from $2,388 on roughly 3.8× the previous 20-hour average volume.
In Wyckoff terms, this may become a Selling Climax. The first rebound to $2,431.57 can be read as an Automatic Rally, while the pullback holding near $2,411 is a possible Secondary Test.
The latest confirmed candle closed at $2,439.91—but the larger H1 structure remains bearish below supply.
My confirmation map:
🟢 An H1 close above $2,457, followed by a successful retest, would confirm the first bullish CHoCH. Reclaiming $2,487 would strengthen the case for BOS toward $2,508–$2,527.
🟡 Holding $2,388–$2,411 keeps the SC–AR–ST accumulation hypothesis alive, but without CHoCH this remains WATCH—not TRADE READY.
🔴 A decisive H1 close below $2,388 invalidates the recovery thesis and signals that markdown is still controlling the auction.
The trap is buying the first green reaction because volume exploded—or shorting directly into a potential Selling Climax.
Smart Money may have tested the sell-side liquidity. Now buyers must prove they can reclaim structure, not merely produce a bounce.
Which happens first: CHoCH above $2,457 or another sweep below $2,388? 👀
Paper analysis only. Not financial advice.
$ETH #Ethereum #Wyckoff #SMC
ETH JUST FLUSHED $2,388 — BUT THIS IS NOT A BUY SIGNAL YET.
ETHUSDT H1 Futures broke through local support and printed a sharp reaction from $2,388 on roughly 3.8× the previous 20-hour average volume.
In Wyckoff terms, this may become a Selling Climax. The first rebound to $2,431.57 can be read as an Automatic Rally, while the pullback holding near $2,411 is a possible Secondary Test.
The latest confirmed candle closed at $2,439.91—but the larger H1 structure remains bearish below supply.
My confirmation map:
🟢 An H1 close above $2,457, followed by a successful retest, would confirm the first bullish CHoCH. Reclaiming $2,487 would strengthen the case for BOS toward $2,508–$2,527.
🟡 Holding $2,388–$2,411 keeps the SC–AR–ST accumulation hypothesis alive, but without CHoCH this remains WATCH—not TRADE READY.
🔴 A decisive H1 close below $2,388 invalidates the recovery thesis and signals that markdown is still controlling the auction.
The trap is buying the first green reaction because volume exploded—or shorting directly into a potential Selling Climax.
Smart Money may have tested the sell-side liquidity. Now buyers must prove they can reclaim structure, not merely produce a bounce.
Which happens first: CHoCH above $2,457 or another sweep below $2,388? 👀
Paper analysis only. Not financial advice.
$ETH #Ethereum #Wyckoff #SMC
ETHUSDT H1 Futures broke through local support and printed a sharp reaction from $2,388 on roughly 3.8× the previous 20-hour average volume.
In Wyckoff terms, this may become a Selling Climax. The first rebound to $2,431.57 can be read as an Automatic Rally, while the pullback holding near $2,411 is a possible Secondary Test.
The latest confirmed candle closed at $2,439.91—but the larger H1 structure remains bearish below supply.
My confirmation map:
🟢 An H1 close above $2,457, followed by a successful retest, would confirm the first bullish CHoCH. Reclaiming $2,487 would strengthen the case for BOS toward $2,508–$2,527.
🟡 Holding $2,388–$2,411 keeps the SC–AR–ST accumulation hypothesis alive, but without CHoCH this remains WATCH—not TRADE READY.
🔴 A decisive H1 close below $2,388 invalidates the recovery thesis and signals that markdown is still controlling the auction.
The trap is buying the first green reaction because volume exploded—or shorting directly into a potential Selling Climax.
Smart Money may have tested the sell-side liquidity. Now buyers must prove they can reclaim structure, not merely produce a bounce.
Which happens first: CHoCH above $2,457 or another sweep below $2,388? 👀
Paper analysis only. Not financial advice.
$ETH #Ethereum #Wyckoff #SMC
2
4
2.9k
Log in to explore more content
Join global crypto users on Binance Square
⚡️ Get latest and useful information about crypto.
💬 Trusted by the world’s largest crypto exchange.
👍 Discover real insights from verified creators.
Email / Phone number
Trending Topics
1
#BinanceReopensWithdrawalsForMoreAssets
1,682 views
138 Discussing
2
#AppleReportsMixedResults
2,703 views
151 Discussing
3
#BinanceWithdrawalScamWarning
78,855 views
957 Discussing
4
#USMidtermElections
664,628 views
3,532 Discussing
5
#USOctoberNFP-AreRateCutsStillPossible
81,509 views
725 Discussing
6
#Verify1to1BinanceReserves
71,449 views
542 Discussing
7
#BinanceRestores28FiatWithdrawals
209,898 views
1,210 Discussing
8
#BitMineAdds8573ETHTotalHoldingsReach6.06M
211 views
7 Discussing
9
#HKSFCEyesTokenizedGoldETFPilot
223 views
8 Discussing
10
#SouthKoreaRulingPartyToRecommendDelayingVirtualAssetTax
0 views
0 Discussing