
#bitcointrading
bitcointrading
509,514 views
1,201 Discussing
Hot
Latest

·
--
Bearish
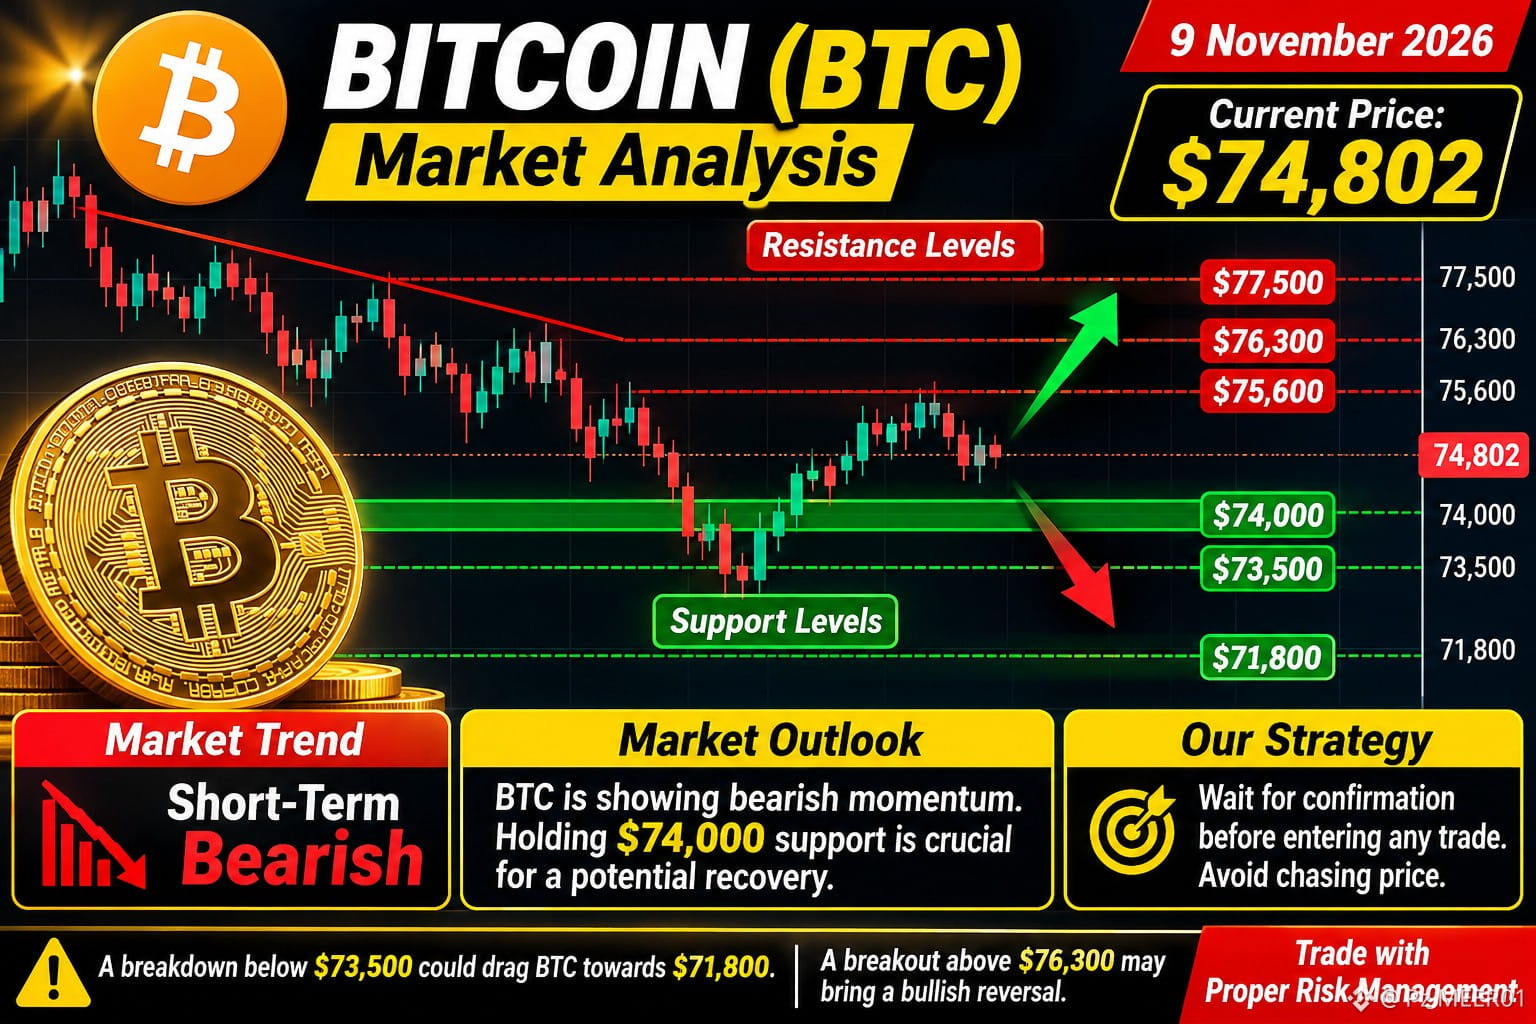
📊 $BTC MARKET ANALYSIS
💰 Current Price: $74,802
🔴 Market Trend: Short-Term Bearish
Key Support Levels:
- $74,000
- $73,500
- $71,800
Key Resistance Levels:
- $75,600
- $76,300
- $77,500
Market Outlook:
$BTC is showing bearish momentum, with sellers still controlling the short-term structure. Holding the $74,000 support zone is crucial for a potential recovery.
A breakdown below $73,500 could open the door for further downside towards $71,800.
On the bullish side, reclaiming $76,300 could signal a potential trend reversal.
🎯 Strategy: Wait for confirmation before entering any trade. Avoid chasing price movements.
⚠️ Trade with proper risk management.
#Bitcoin #BTC #CryptoAnalysis #BitcoinTrading #BİNANCESQUARE
{spot}(BTCUSDT)
📊 $BTC MARKET ANALYSIS
💰 Current Price: $74,802
🔴 Market Trend: Short-Term Bearish
Key Support Levels:
- $74,000
- $73,500
- $71,800
Key Resistance Levels:
- $75,600
- $76,300
- $77,500
Market Outlook:
$BTC is showing bearish momentum, with sellers still controlling the short-term structure. Holding the $74,000 support zone is crucial for a potential recovery.
A breakdown below $73,500 could open the door for further downside towards $71,800.
On the bullish side, reclaiming $76,300 could signal a potential trend reversal.
🎯 Strategy: Wait for confirmation before entering any trade. Avoid chasing price movements.
⚠️ Trade with proper risk management.
#Bitcoin #BTC #CryptoAnalysis #BitcoinTrading #BİNANCESQUARE
💰 Current Price: $74,802
🔴 Market Trend: Short-Term Bearish
Key Support Levels:
- $74,000
- $73,500
- $71,800
Key Resistance Levels:
- $75,600
- $76,300
- $77,500
Market Outlook:
$BTC is showing bearish momentum, with sellers still controlling the short-term structure. Holding the $74,000 support zone is crucial for a potential recovery.
A breakdown below $73,500 could open the door for further downside towards $71,800.
On the bullish side, reclaiming $76,300 could signal a potential trend reversal.
🎯 Strategy: Wait for confirmation before entering any trade. Avoid chasing price movements.
⚠️ Trade with proper risk management.
#Bitcoin #BTC #CryptoAnalysis #BitcoinTrading #BİNANCESQUARE
77

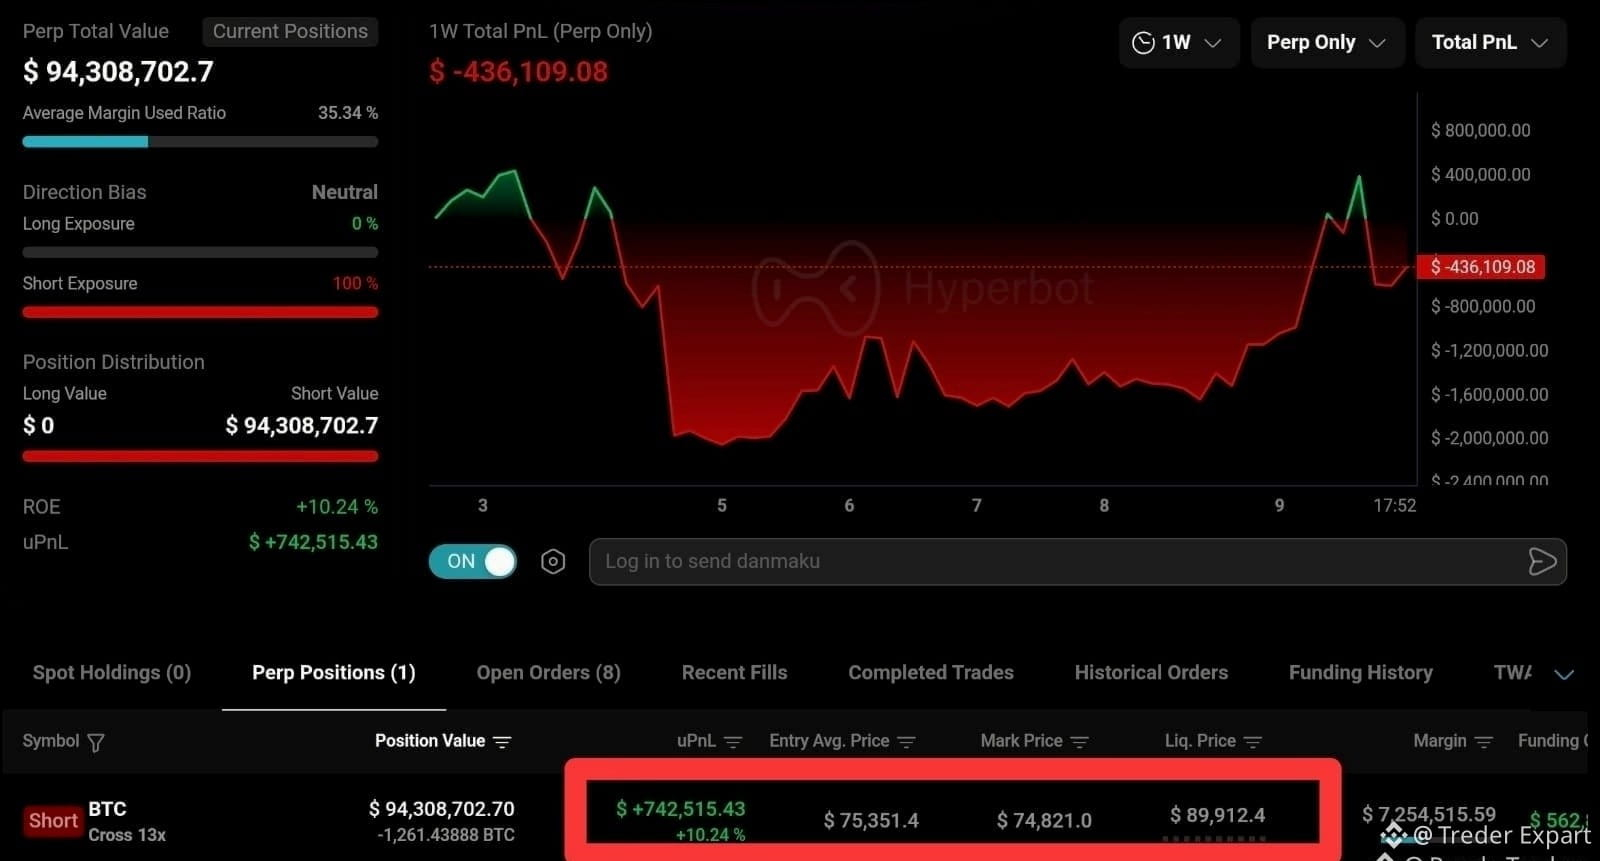
BREAKING: A MASSIVE WHALE IS PLACING A $96.5 MILLION BET AGAINST BITCOIN!
While retail traders are jumping on every $BTC bounce, one major whale is holding a massive 13x leveraged BTC SHORT position!
Entry Price: $75,355
Short Position: $96.5 Million
Unrealized Profit: $709,000+
That's a huge position, and this whale appears to be betting on further downside for Bitcoin.
But here's the big question: Is this whale anticipating another major BTC drop, or could this turn into a massive short squeeze?
BEARISH or BULLISH?
What's your prediction for Bitcoin's next move? Drop your thoughts below!
Bitcoin #BTC #Crypto WhaleAlert #BitcoinTrading #Binance
BREAKING: A MASSIVE WHALE IS PLACING A $96.5 MILLION BET AGAINST BITCOIN!
While retail traders are jumping on every $BTC bounce, one major whale is holding a massive 13x leveraged BTC SHORT position!
Entry Price: $75,355
Short Position: $96.5 Million
Unrealized Profit: $709,000+
That's a huge position, and this whale appears to be betting on further downside for Bitcoin.
But here's the big question: Is this whale anticipating another major BTC drop, or could this turn into a massive short squeeze?
BEARISH or BULLISH?
What's your prediction for Bitcoin's next move? Drop your thoughts below!
Bitcoin #BTC #Crypto WhaleAlert #BitcoinTrading #Binance
While retail traders are jumping on every $BTC bounce, one major whale is holding a massive 13x leveraged BTC SHORT position!
Entry Price: $75,355
Short Position: $96.5 Million
Unrealized Profit: $709,000+
That's a huge position, and this whale appears to be betting on further downside for Bitcoin.
But here's the big question: Is this whale anticipating another major BTC drop, or could this turn into a massive short squeeze?
BEARISH or BULLISH?
What's your prediction for Bitcoin's next move? Drop your thoughts below!
Bitcoin #BTC #Crypto WhaleAlert #BitcoinTrading #Binance
17

Holding $BTC 5.2 USDT
$BTC — Bitcoin's weekly decline shows that the recent recovery has struggled to hold; traders should watch whether buyers reclaim important resistance or whether another support test develops.
{spot}(BTCUSDT)
$ETH — Ethereum's weaker weekly performance highlights continued pressure across the broader market; network activity and a convincing reclaim of resistance will matter more than short-lived green candles.
{spot}(ETHUSDT)
$BNB — BNB has held up comparatively better than some major assets during the recent correction; watch whether buyers defend support and restore momentum across the Binance ecosystem.
{spot}(BNBUSDT)
#BTC #ETH #BNB #BitcoinTrading #CryptoMarket
$BTC — Bitcoin's weekly decline shows that the recent recovery has struggled to hold; traders should watch whether buyers reclaim important resistance or whether another support test develops.
$ETH — Ethereum's weaker weekly performance highlights continued pressure across the broader market; network activity and a convincing reclaim of resistance will matter more than short-lived green candles.
$BNB — BNB has held up comparatively better than some major assets during the recent correction; watch whether buyers defend support and restore momentum across the Binance ecosystem.
#BTC #ETH #BNB #BitcoinTrading #CryptoMarket
$ETH — Ethereum's weaker weekly performance highlights continued pressure across the broader market; network activity and a convincing reclaim of resistance will matter more than short-lived green candles.
$BNB — BNB has held up comparatively better than some major assets during the recent correction; watch whether buyers defend support and restore momentum across the Binance ecosystem.
#BTC #ETH #BNB #BitcoinTrading #CryptoMarket


·
--
Bullish
$BTC
{spot}(BTCUSDT)
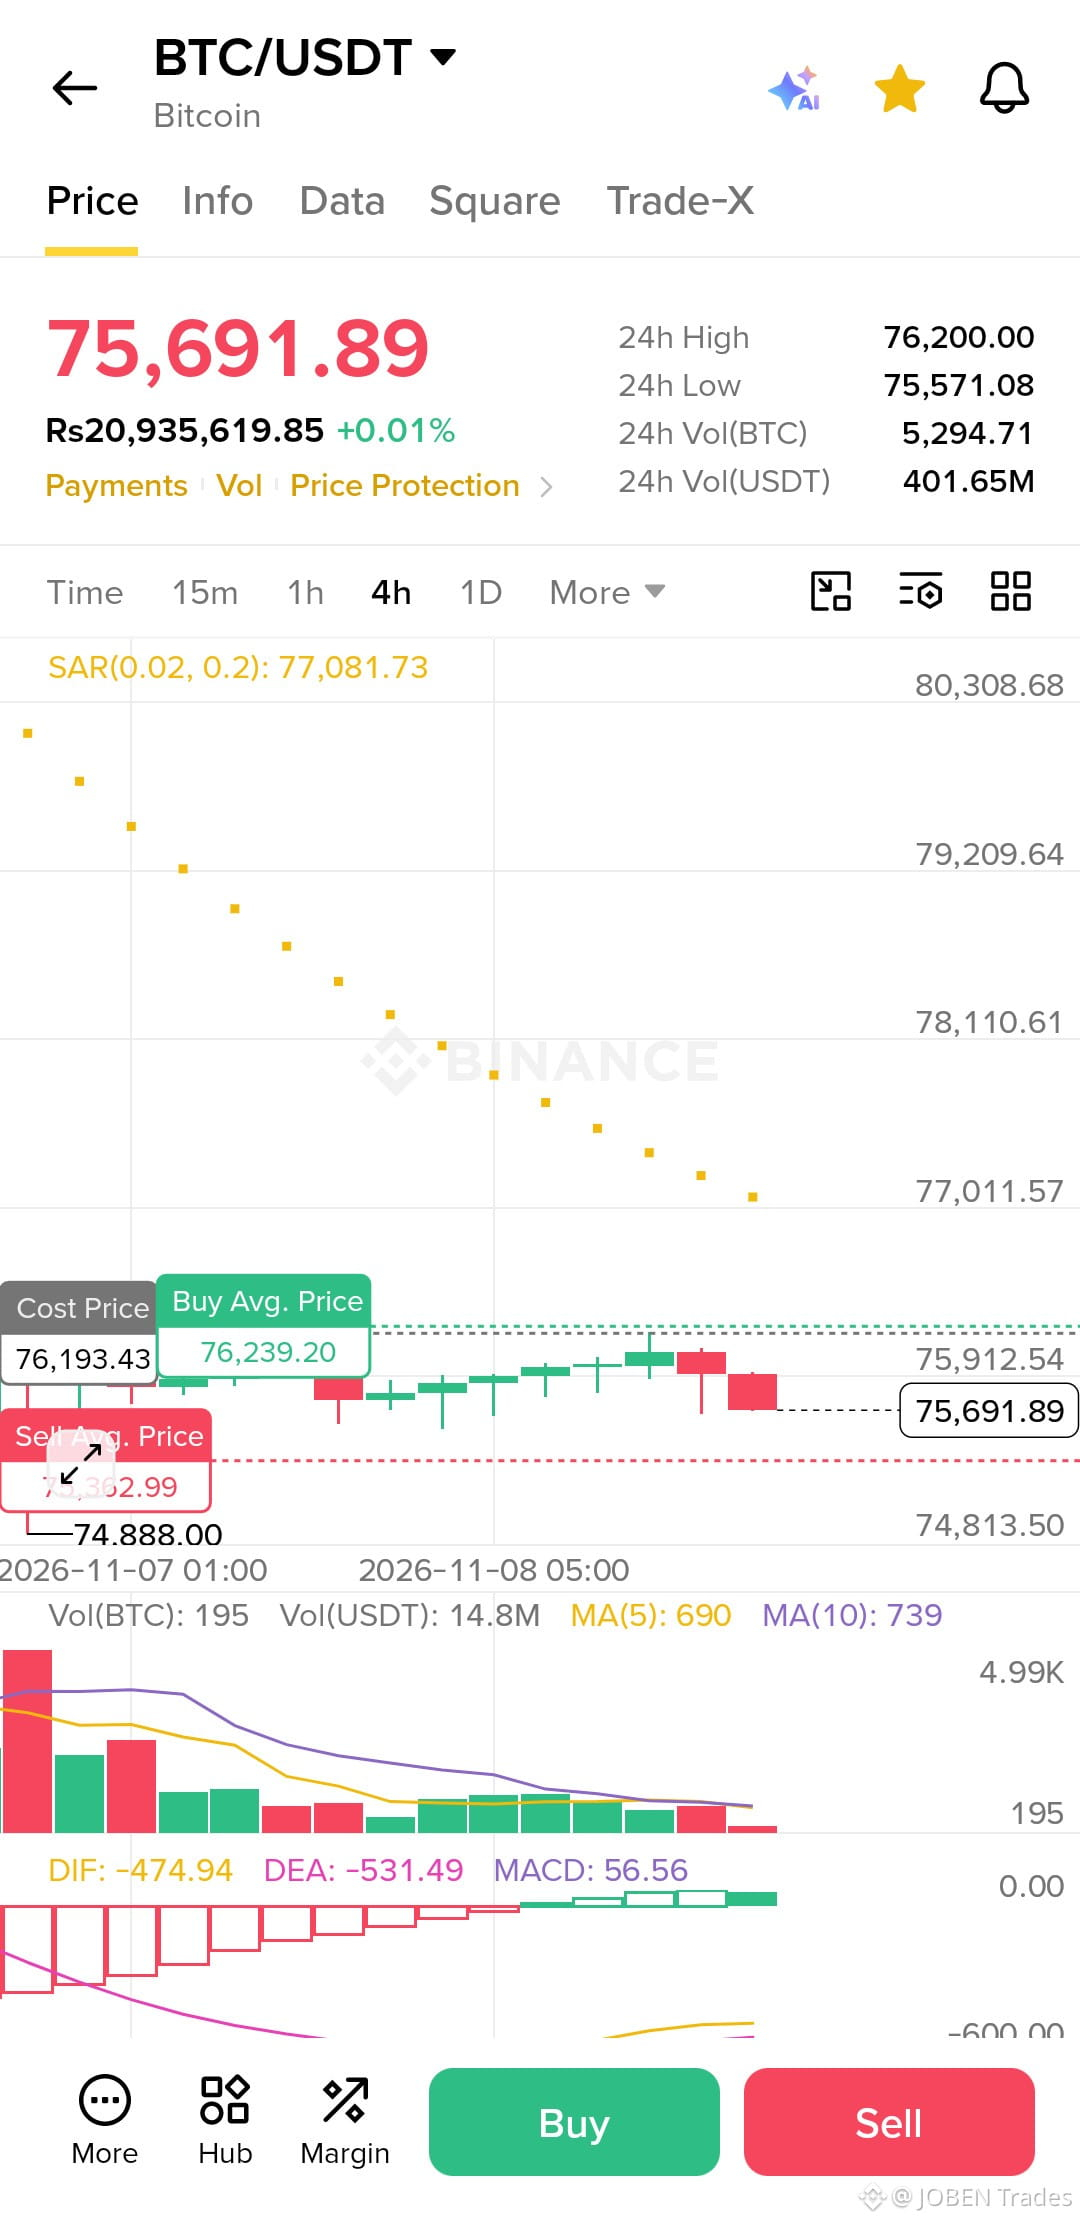
🚨 BITCOIN ALERT: BTC AT A CRITICAL 4H LEVEL!
Bitcoin is trading around $75,691, and the next move could be important.
📊 4H Chart Analysis:
🔴 Resistance: $75,912 – $76,200
🟢 Immediate Support: $75,570
🎯 Lower Support: $74,888
What does the chart tell us?
Parabolic SAR remains above price, indicating bearish pressure.
MACD histogram has turned positive, showing a possible short-term recovery attempt.
Trading volume is declining, so buyers still need confirmation.
Two Possible Scenarios:
🐂 Bullish: A strong 4H candle above $76,200 could open the door for further recovery.
🐻 Bearish: A breakdown below $75,570 could bring $74,888 into focus.
💬 Your Opinion Matters!
Will BTC break above $76,200 or fall below $75,570?
Are you BUYING, SELLING, or WAITING?
Share your analysis below! 👇
#Bitcoin #BTC #CryptoAnalysis #BitcoinTrading #BinanceSquare
$BTC
🚨 BITCOIN ALERT: BTC AT A CRITICAL 4H LEVEL!
Bitcoin is trading around $75,691, and the next move could be important.
📊 4H Chart Analysis:
🔴 Resistance: $75,912 – $76,200
🟢 Immediate Support: $75,570
🎯 Lower Support: $74,888
What does the chart tell us?
Parabolic SAR remains above price, indicating bearish pressure.
MACD histogram has turned positive, showing a possible short-term recovery attempt.
Trading volume is declining, so buyers still need confirmation.
Two Possible Scenarios:
🐂 Bullish: A strong 4H candle above $76,200 could open the door for further recovery.
🐻 Bearish: A breakdown below $75,570 could bring $74,888 into focus.
💬 Your Opinion Matters!
Will BTC break above $76,200 or fall below $75,570?
Are you BUYING, SELLING, or WAITING?
Share your analysis below! 👇
#Bitcoin #BTC #CryptoAnalysis #BitcoinTrading #BinanceSquare
🚨 BITCOIN ALERT: BTC AT A CRITICAL 4H LEVEL!
Bitcoin is trading around $75,691, and the next move could be important.
📊 4H Chart Analysis:
🔴 Resistance: $75,912 – $76,200
🟢 Immediate Support: $75,570
🎯 Lower Support: $74,888
What does the chart tell us?
Parabolic SAR remains above price, indicating bearish pressure.
MACD histogram has turned positive, showing a possible short-term recovery attempt.
Trading volume is declining, so buyers still need confirmation.
Two Possible Scenarios:
🐂 Bullish: A strong 4H candle above $76,200 could open the door for further recovery.
🐻 Bearish: A breakdown below $75,570 could bring $74,888 into focus.
💬 Your Opinion Matters!
Will BTC break above $76,200 or fall below $75,570?
Are you BUYING, SELLING, or WAITING?
Share your analysis below! 👇
#Bitcoin #BTC #CryptoAnalysis #BitcoinTrading #BinanceSquare
2
87
·
--
Bearish
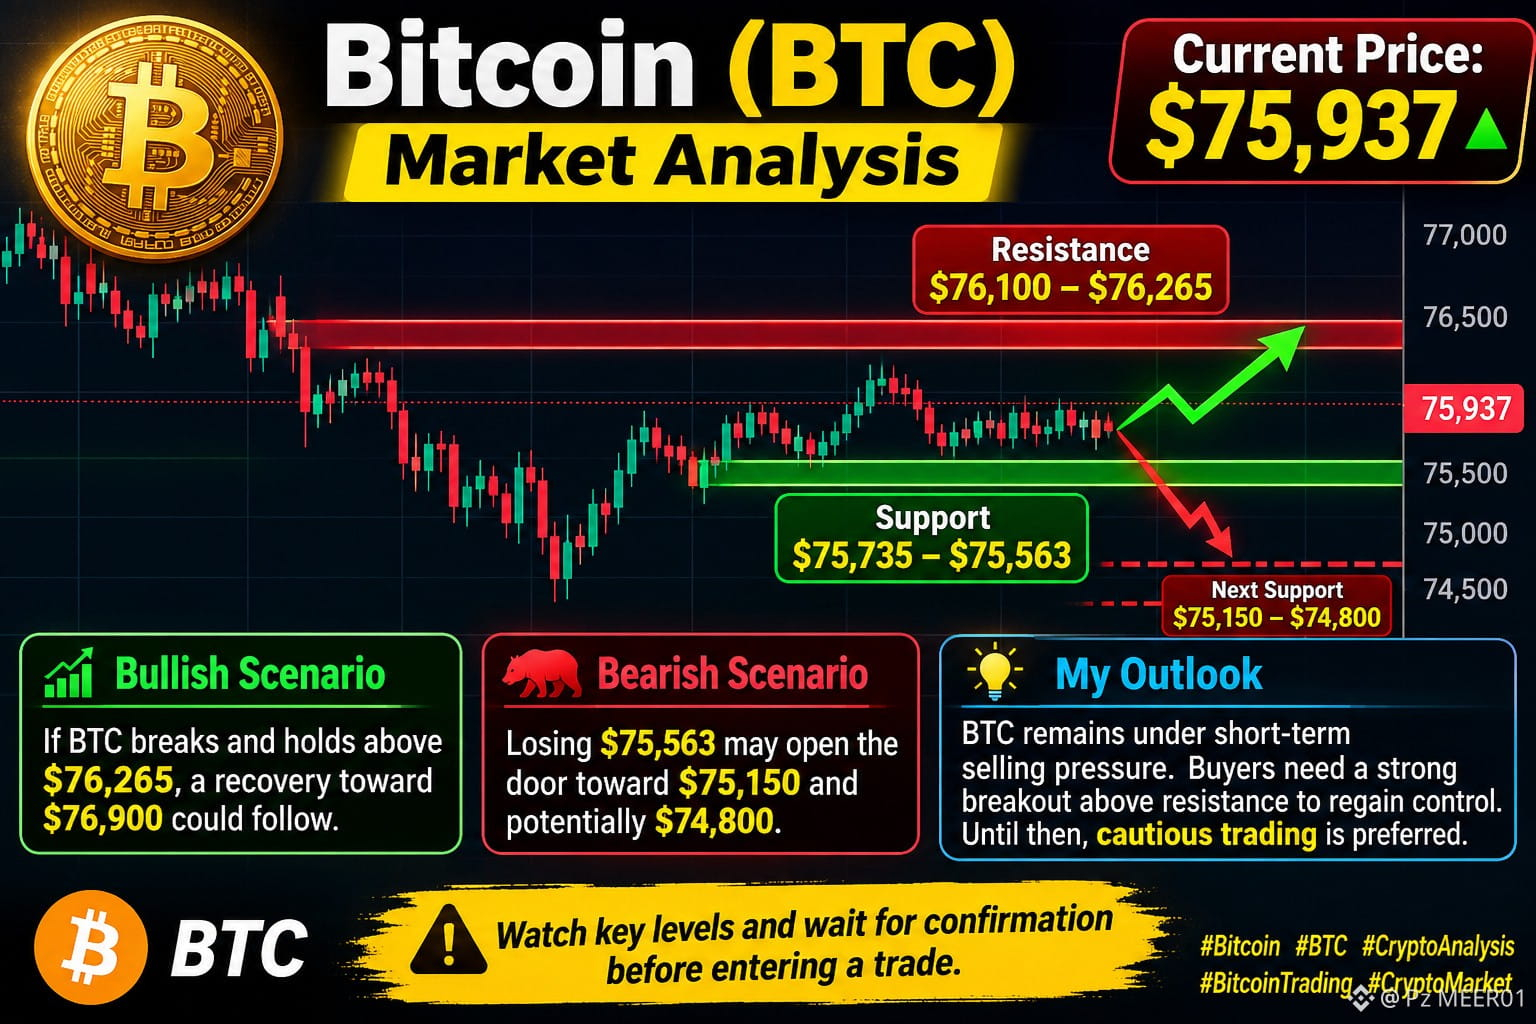
📊 $BTC MARKET ANALYSIS
💰 Current Price: $75,937
Market Structure: Short-term bearish / Consolidation
🔴 Resistance: $76,100 – $76,265
🟢 Support: $75,735 – $75,563
Bullish Scenario: If $BTC breaks and holds above $76,265, a recovery toward $76,900 could follow.
Bearish Scenario: Losing $75,563 may open the door toward $75,150 and potentially $74,800.
My Outlook: $BTC remains under short-term selling pressure. Buyers need a strong breakout above resistance to regain control. Until then, cautious trading is preferred.
⚠️ Watch key levels and wait for confirmation before entering a trade.
#Bitcoin #BTC #CryptoAnalysis #BitcoinTrading #CryptoMarket
{spot}(BTCUSDT)
📊 $BTC MARKET ANALYSIS
💰 Current Price: $75,937
Market Structure: Short-term bearish / Consolidation
🔴 Resistance: $76,100 – $76,265
🟢 Support: $75,735 – $75,563
Bullish Scenario: If $BTC breaks and holds above $76,265, a recovery toward $76,900 could follow.
Bearish Scenario: Losing $75,563 may open the door toward $75,150 and potentially $74,800.
My Outlook: $BTC remains under short-term selling pressure. Buyers need a strong breakout above resistance to regain control. Until then, cautious trading is preferred.
⚠️ Watch key levels and wait for confirmation before entering a trade.
#Bitcoin #BTC #CryptoAnalysis #BitcoinTrading #CryptoMarket
💰 Current Price: $75,937
Market Structure: Short-term bearish / Consolidation
🔴 Resistance: $76,100 – $76,265
🟢 Support: $75,735 – $75,563
Bullish Scenario: If $BTC breaks and holds above $76,265, a recovery toward $76,900 could follow.
Bearish Scenario: Losing $75,563 may open the door toward $75,150 and potentially $74,800.
My Outlook: $BTC remains under short-term selling pressure. Buyers need a strong breakout above resistance to regain control. Until then, cautious trading is preferred.
⚠️ Watch key levels and wait for confirmation before entering a trade.
#Bitcoin #BTC #CryptoAnalysis #BitcoinTrading #CryptoMarket
75


·
--
Article
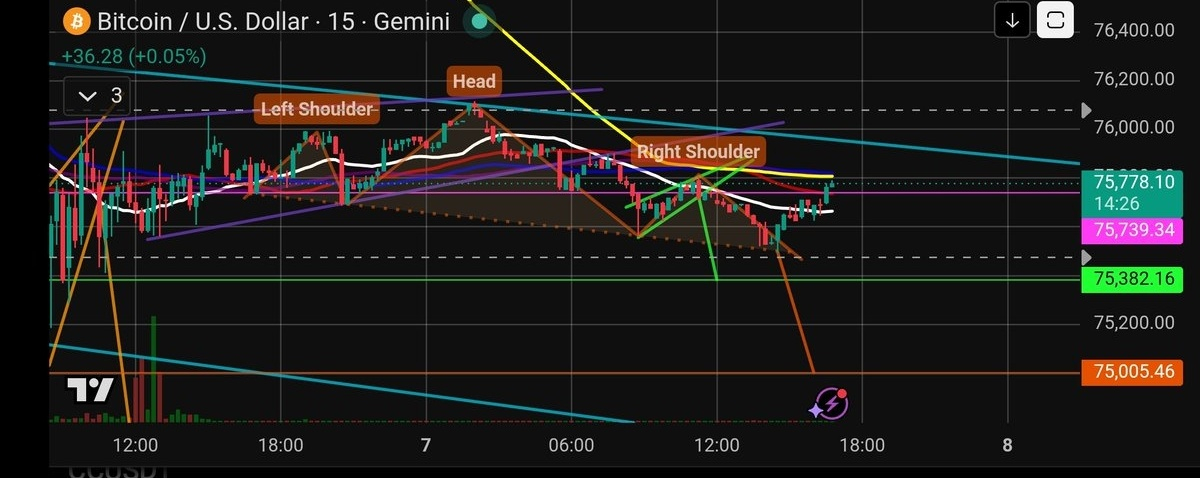
Bitcoin (BTC) Faces a Crucial Retest of the 15-Minute 200 MA – Will Sellers Push Price Lower?Bitcoin (BTC) Faces a Crucial Retest of the 15-Minute 200 MA – Will Sellers Push Price Lower?
As anticipated in my earlier market analysis today, Bitcoin has now returned to retest the 200 Moving Average (200 MA) on the 15-minute timeframe. This was an important level to watch, and price has now reached the area where the next short-term direction could become clearer.
The current market structure makes this retest particularly important. The 200 MA is acting as a key technical reference, and how BTC reacts around this level could determine whether the market continues its downward movement or attempts to recover.
What I'm Watching Now:
The main focus is on whether Bitcoin can successfully reclaim the 15-minute 200 MA or face another rejection from this level.
If sellers defend this moving average and price fails to establish acceptance above it, bearish pressure could increase. Such a rejection may open the door for another move toward the lower support zones and downside targets identified in my previous analysis.
On the other hand, if buyers manage to reclaim the 200 MA and maintain price above it, the bearish scenario could weaken. A sustained move above this level would suggest that buyers are attempting to regain short-term control.
Why This Retest Matters
Moving averages can provide useful insight into short-term momentum, but the reaction around them is more important than simply touching the indicator. Volume, candle closes, and the overall market structure should also be considered before drawing conclusions.
For now, I'm watching the 15-minute structure closely and waiting for clear confirmation. There is no need to rush into a position while the market is testing an important technical area.
My earlier projection brought this level into focus, and now the actual price reaction will determine the next opportunity.
For the complete analysis, previously identified downside targets, and important technical levels, check my timeline.
Let's see how BTC reacts from here. Stay patient, stay disciplined, and always manage your risk.
#BTC #BitcoinTrading #CryptoMarketAlert $BTC
{future}(BTCUSDT)
Bitcoin (BTC) Faces a Crucial Retest of the 15-Minute 200 MA – Will Sellers Push Price Lower?
Bitcoin (BTC) Faces a Crucial Retest of the 15-Minute 200 MA – Will Sellers Push Price Lower?
As anticipated in my earlier market analysis today, Bitcoin has now returned to retest the 200 Moving Average (200 MA) on the 15-minute timeframe. This was an important level to watch, and price has now reached the area where the next short-term direction could become clearer.
The current market structure makes this retest particularly important. The 200 MA is acting as a key technical reference, and how BTC reacts around this level could determine whether the market continues its downward movement or attempts to recover.
What I'm Watching Now:
The main focus is on whether Bitcoin can successfully reclaim the 15-minute 200 MA or face another rejection from this level.
If sellers defend this moving average and price fails to establish acceptance above it, bearish pressure could increase. Such a rejection may open the door for another move toward the lower support zones and downside targets identified in my previous analysis.
On the other hand, if buyers manage to reclaim the 200 MA and maintain price above it, the bearish scenario could weaken. A sustained move above this level would suggest that buyers are attempting to regain short-term control.
Why This Retest Matters
Moving averages can provide useful insight into short-term momentum, but the reaction around them is more important than simply touching the indicator. Volume, candle closes, and the overall market structure should also be considered before drawing conclusions.
For now, I'm watching the 15-minute structure closely and waiting for clear confirmation. There is no need to rush into a position while the market is testing an important technical area.
My earlier projection brought this level into focus, and now the actual price reaction will determine the next opportunity.
For the complete analysis, previously identified downside targets, and important technical levels, check my timeline.
Let's see how BTC reacts from here. Stay patient, stay disciplined, and always manage your risk.
#BTC #BitcoinTrading #CryptoMarketAlert $BTC
As anticipated in my earlier market analysis today, Bitcoin has now returned to retest the 200 Moving Average (200 MA) on the 15-minute timeframe. This was an important level to watch, and price has now reached the area where the next short-term direction could become clearer.
The current market structure makes this retest particularly important. The 200 MA is acting as a key technical reference, and how BTC reacts around this level could determine whether the market continues its downward movement or attempts to recover.
What I'm Watching Now:
The main focus is on whether Bitcoin can successfully reclaim the 15-minute 200 MA or face another rejection from this level.
If sellers defend this moving average and price fails to establish acceptance above it, bearish pressure could increase. Such a rejection may open the door for another move toward the lower support zones and downside targets identified in my previous analysis.
On the other hand, if buyers manage to reclaim the 200 MA and maintain price above it, the bearish scenario could weaken. A sustained move above this level would suggest that buyers are attempting to regain short-term control.
Why This Retest Matters
Moving averages can provide useful insight into short-term momentum, but the reaction around them is more important than simply touching the indicator. Volume, candle closes, and the overall market structure should also be considered before drawing conclusions.
For now, I'm watching the 15-minute structure closely and waiting for clear confirmation. There is no need to rush into a position while the market is testing an important technical area.
My earlier projection brought this level into focus, and now the actual price reaction will determine the next opportunity.
For the complete analysis, previously identified downside targets, and important technical levels, check my timeline.
Let's see how BTC reacts from here. Stay patient, stay disciplined, and always manage your risk.
#BTC #BitcoinTrading #CryptoMarketAlert $BTC
4
809

·
--
₿ Bitcoin ($BTC ) Latest Analysis
Bitcoin is showing a recovery attempt after recent selling pressure. Buyers are trying to regain momentum, but the market remains volatile
.
Support: $75,000–$76,500
Resistance: $81,300–$84,800
Bullish target: $87,000
Bearish signal: Break below $75,000 could bring more downside
.
My View: BTC needs a strong breakout above $81,300 to strengthen bullish momentum.
Watch support carefully before entering a trade.
#Bitcoin #CryptoAnalysis📈📉🐋📅🚀 #BitcoinTrading #CryptoMarket #BTCUSD
{spot}(BTCUSDT)
₿ Bitcoin ($BTC ) Latest Analysis
Bitcoin is showing a recovery attempt after recent selling pressure. Buyers are trying to regain momentum, but the market remains volatile
.
Support: $75,000–$76,500
Resistance: $81,300–$84,800
Bullish target: $87,000
Bearish signal: Break below $75,000 could bring more downside
.
My View: BTC needs a strong breakout above $81,300 to strengthen bullish momentum.
Watch support carefully before entering a trade.
#Bitcoin #CryptoAnalysis📈📉🐋📅🚀 #BitcoinTrading #CryptoMarket #BTCUSD
Bitcoin is showing a recovery attempt after recent selling pressure. Buyers are trying to regain momentum, but the market remains volatile
.
Support: $75,000–$76,500
Resistance: $81,300–$84,800
Bullish target: $87,000
Bearish signal: Break below $75,000 could bring more downside
.
My View: BTC needs a strong breakout above $81,300 to strengthen bullish momentum.
Watch support carefully before entering a trade.
#Bitcoin #CryptoAnalysis📈📉🐋📅🚀 #BitcoinTrading #CryptoMarket #BTCUSD

55

·
--
$BTC $BTC $BTC 🚀 BITCOIN BIG NEWS TODAY! 🔥
Bitcoin is fighting to recover near $78,000!
📉 ETF outflows: $643M ⚠️ Binance security incident creates market uncertainty. 🇺🇸 US Midterm Elections bring fresh market attention.
🎯 Key Levels: Support: $77,000 Resistance: $80,000
🐂 Can Bitcoin break $80K and start a powerful comeback?
💎 Stay alert. Watch the charts. Trade smart!
#Bitcoin #BTC #CryptoNewss #BİNANCESQUARE #CryptoMarketMoves #BTCUpdate #BitcoinTrading
{spot}(BTCUSDT)
$BTC $BTC $BTC 🚀 BITCOIN BIG NEWS TODAY! 🔥
Bitcoin is fighting to recover near $78,000!
📉 ETF outflows: $643M ⚠️ Binance security incident creates market uncertainty. 🇺🇸 US Midterm Elections bring fresh market attention.
🎯 Key Levels: Support: $77,000 Resistance: $80,000
🐂 Can Bitcoin break $80K and start a powerful comeback?
💎 Stay alert. Watch the charts. Trade smart!
#Bitcoin #BTC #CryptoNewss #BİNANCESQUARE #CryptoMarketMoves #BTCUpdate #BitcoinTrading
Bitcoin is fighting to recover near $78,000!
📉 ETF outflows: $643M ⚠️ Binance security incident creates market uncertainty. 🇺🇸 US Midterm Elections bring fresh market attention.
🎯 Key Levels: Support: $77,000 Resistance: $80,000
🐂 Can Bitcoin break $80K and start a powerful comeback?
💎 Stay alert. Watch the charts. Trade smart!
#Bitcoin #BTC #CryptoNewss #BİNANCESQUARE #CryptoMarketMoves #BTCUpdate #BitcoinTrading

1
74

·
--
🚀🔥 BITCOIN IS FIGHTING BACK!
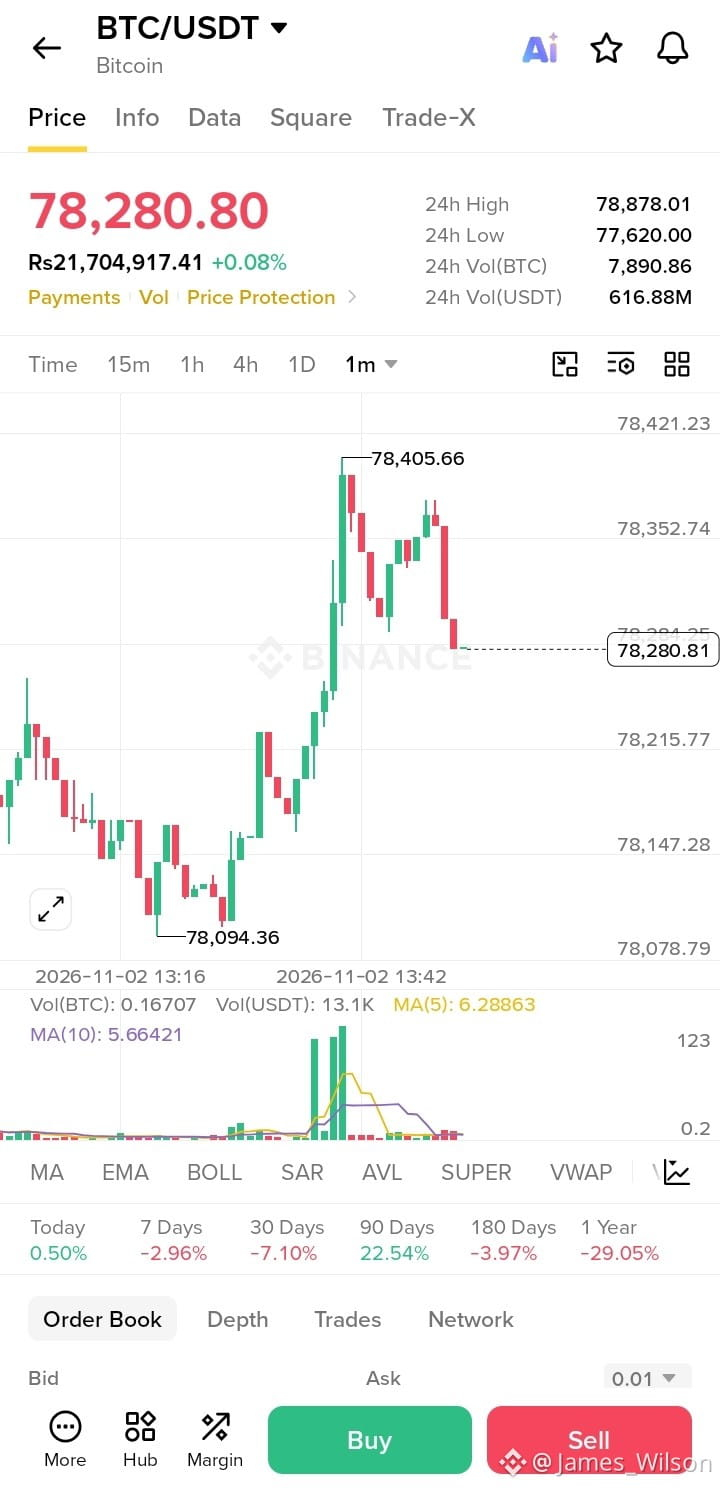
$BTC is showing signs of recovery, trading around $78,280.80 (+0.08%). Bulls are trying to regain momentum, with $78,878 acting as the key resistance and $77,620 as important support. 👀
A breakout above resistance could open the door for another bullish move, while losing support may bring fresh selling pressure. The big question is: Are the Bitcoin bulls preparing for a comeback? 🔥
#Bitcoin #Binance #CryptoMarket #BitcoinTrading #Crypto
{spot}(BTCUSDT)
🚀🔥 BITCOIN IS FIGHTING BACK!
$BTC is showing signs of recovery, trading around $78,280.80 (+0.08%). Bulls are trying to regain momentum, with $78,878 acting as the key resistance and $77,620 as important support. 👀
A breakout above resistance could open the door for another bullish move, while losing support may bring fresh selling pressure. The big question is: Are the Bitcoin bulls preparing for a comeback? 🔥
#Bitcoin #Binance #CryptoMarket #BitcoinTrading #Crypto
$BTC is showing signs of recovery, trading around $78,280.80 (+0.08%). Bulls are trying to regain momentum, with $78,878 acting as the key resistance and $77,620 as important support. 👀
A breakout above resistance could open the door for another bullish move, while losing support may bring fresh selling pressure. The big question is: Are the Bitcoin bulls preparing for a comeback? 🔥
#Bitcoin #Binance #CryptoMarket #BitcoinTrading #Crypto
173

·
--
📊 #BTC
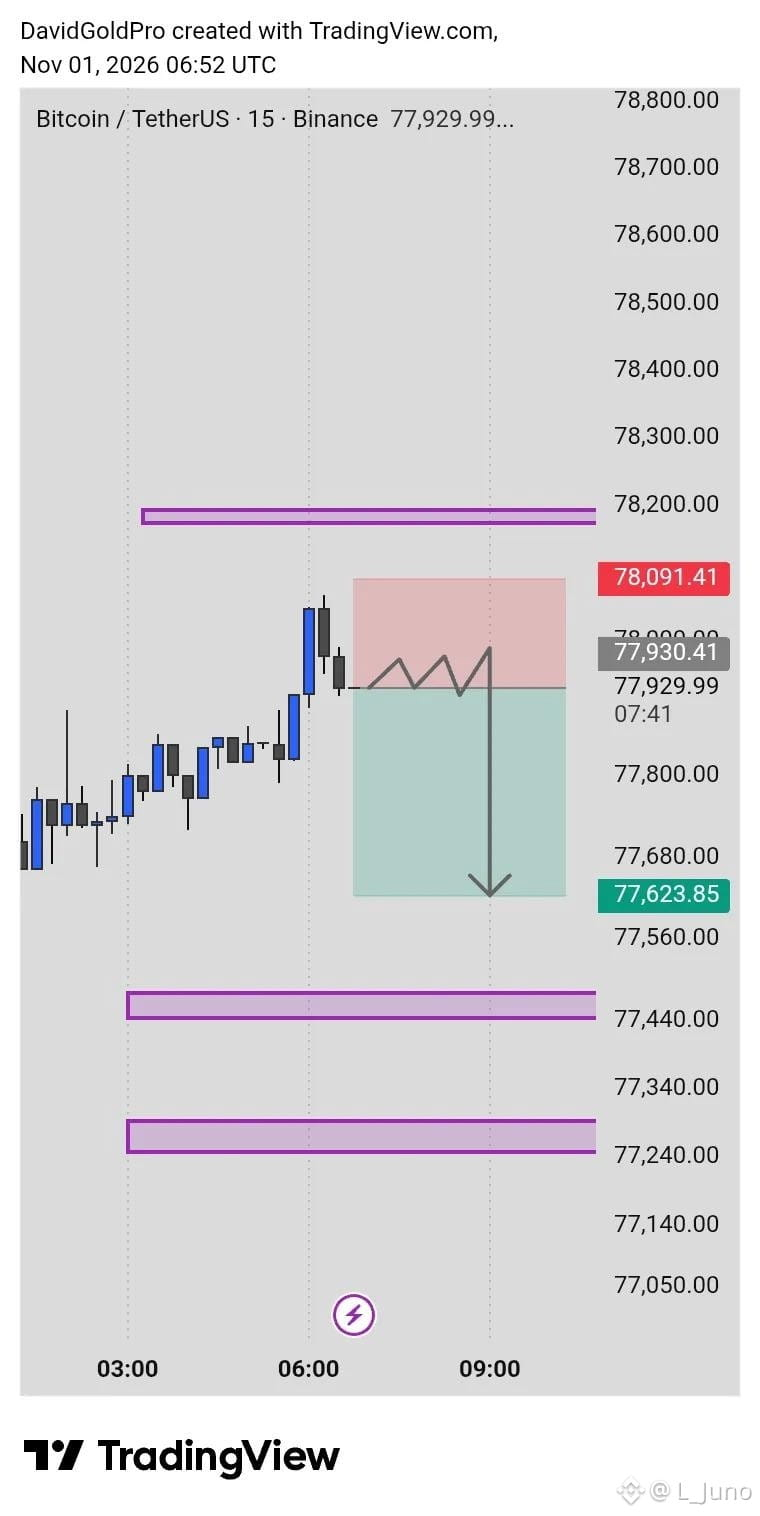
🔴 SIGNAL SELL: 77930
🎯 TP1 → 77680
🎯 TP2 → 77500
🎯 FINAL TP → 77623
🛑 SL → 78091
⚠️ Educational analysis only. Trading involves risk.
#BTCUSDT #BitcoinTrading
📊 #BTC
🔴 SIGNAL SELL: 77930
🎯 TP1 → 77680
🎯 TP2 → 77500
🎯 FINAL TP → 77623
🛑 SL → 78091
⚠️ Educational analysis only. Trading involves risk.
#BTCUSDT #BitcoinTrading
🔴 SIGNAL SELL: 77930
🎯 TP1 → 77680
🎯 TP2 → 77500
🎯 FINAL TP → 77623
🛑 SL → 78091
⚠️ Educational analysis only. Trading involves risk.
#BTCUSDT #BitcoinTrading
91

🚀 BITCOIN (BTC) – $60,000 TARGET!
The next big move in Bitcoin could create an exciting opportunity!
🎯 My BTC Price Prediction: $60,000
Bitcoin has always been one of the most powerful assets in the crypto market. I believe BTC could reach the $60K level in a future market move.
📈 Are you bullish on Bitcoin?
🔥 Let's see what the future holds!
What is your BTC price target?
#Bitcoin #BTC #Crypto_Jobs🎯 #BinanceHerYerde #CryptoPredictions" #BitcoinTrading
🚀 BITCOIN (BTC) – $60,000 TARGET!
The next big move in Bitcoin could create an exciting opportunity!
🎯 My BTC Price Prediction: $60,000
Bitcoin has always been one of the most powerful assets in the crypto market. I believe BTC could reach the $60K level in a future market move.
📈 Are you bullish on Bitcoin?
🔥 Let's see what the future holds!
What is your BTC price target?
#Bitcoin #BTC #Crypto_Jobs🎯 #BinanceHerYerde #CryptoPredictions" #BitcoinTrading
The next big move in Bitcoin could create an exciting opportunity!
🎯 My BTC Price Prediction: $60,000
Bitcoin has always been one of the most powerful assets in the crypto market. I believe BTC could reach the $60K level in a future market move.
📈 Are you bullish on Bitcoin?
🔥 Let's see what the future holds!
What is your BTC price target?
#Bitcoin #BTC #Crypto_Jobs🎯 #BinanceHerYerde #CryptoPredictions" #BitcoinTrading

28

·
--
Why Can a Crypto CFD Profit When Bitcoin Falls and Spot Can't?$BTC | A reader asked me why a crypto CFD can make money when Bitcoin falls, when just owning the coin never can. The short answer: a CFD is a contract to exchange the price difference, so it never needs you to hold the coin, and that is exactly what makes going short possible.
## How does a CFD let you profit when price falls?
Owning Bitcoin or Ethereum on an exchange is simple. You buy the coin, you hold it, and you profit only if the price rises later. There is no mechanism inside that trade to profit from a fall, because you actually hold the asset.
A crypto CFD works differently. You are not buying the coin at all. You are entering a contract with a broker to exchange the difference between the opening and closing price, settled in cash. Because nothing changes hands except that price difference, the direction you choose does not change the mechanics. Go long and you profit if price rises. Go short and you profit if price falls. Owning the coin only ever gives you the first of those two outcomes.
On the desk, we always described this as a product difference, not a prediction. A CFD and a coin are different instruments built for different jobs, and conflating them is how people end up surprised by a tax bill or a margin call.
## What does Australia's 2:1 cap actually limit?
This is where the two routes diverge again. Spot crypto trades through AUSTRAC-registered exchanges with no leverage at all; you put up the full value and own the asset outright. Crypto CFDs trade through ASIC-regulated brokers, and ASIC caps retail leverage on them at 2:1, the lowest of any asset class SatoshiMacro covers. Forex majors get 30:1 under the same regime. That gap is not an accident. Crypto is volatile enough that a higher cap would wipe out margin accounts routinely, so the regulator deliberately throttles the one variable that decides how fast a loss compounds.
Even at 2:1, the guide is blunt about the outcome: most retail investor accounts lose money when trading CFDs. That is the honest limitation underneath all of this, and it does not disappear just because the leverage cap here is lower than anywhere else.
## Does the tax treatment change which route makes sense?
Yes, and it follows directly from ownership. Hold the coin and you sit inside the capital gains tax system, with the 50 percent discount available once you have held past 12 months. Trade a CFD and there is no asset to hold, so the profit is ordinary income from day one, taxed at your marginal rate regardless of how long the position stayed open.
That difference alone should decide the route before leverage or direction even enters the conversation. A long-term holder chasing the 12-month discount has no reason to touch a CFD. An active trader running short-dated positions in both directions has no CGT discount to protect anyway, so ordinary-income treatment is simply the cost of the tool.
## Who does each route actually suit?
I would split this by what you are trying to do with your time, not by how much capital you have. An investor who checks a position once a week and wants exposure to Bitcoin over years gets nothing extra from a CFD; leverage and two-way exposure are wasted on a thesis measured in years, and the ordinary-income tax treatment throws away the 12-month CGT discount for no benefit. An active trader who wants to express a view over days or weeks, in either direction, gets nothing extra from spot ownership; there is no way to go short, no leverage to size conviction, and a wallet to secure for a position you may close within the day.
Where people get it wrong is picking the route based on which platform they already have an account with, rather than which description above actually matches what they are doing. A spot holder who starts shorting through the same exchange is really describing a CFD trade, just without ASIC's 2:1 cap or negative balance protection sitting underneath it. That gap is worth closing before the next drawdown, not after it.
## What would I actually do with this?
My read is that most beginners pick the CFD route for the wrong reason, usually because leverage sounds like free money rather than a dial that makes losses move faster too. The guide's own sequence is the right order: learn what a CFD, margin and a stop loss actually are, practise on a demo account, then size real positions. The FAQ puts it plainly: sizing sensibly at 1 to 2 percent risk per trade is why most beginners want at least a few hundred dollars before starting, rather than the smallest amount an app will accept.
If the goal is holding Bitcoin for years, skip CFDs entirely and buy the coin on an AUSTRAC-registered exchange. If the goal is trading price moves in both directions, the 2:1 cap and negative balance protection exist specifically because ASIC assumes you will eventually be wrong. You need the structure to survive being wrong before you can be right often enough to matter.
SatoshiMacro's guide to trading crypto in Australia walks through both routes, the long and short mechanics, the leverage cap and the tax split in full, with the demo-first sequence for anyone starting from zero.
https://satoshimacro.com/guides/forex/how-to-trade-crypto/?utm_source=binance_square&utm_medium=social&utm_campaign=autopilot_article
#SatoshiMacro #CryptoCFD #BitcoinTrading #ASIC
Why Can a Crypto CFD Profit When Bitcoin Falls and Spot Can't?
$BTC | A reader asked me why a crypto CFD can make money when Bitcoin falls, when just owning the coin never can. The short answer: a CFD is a contract to exchange the price difference, so it never needs you to hold the coin, and that is exactly what makes going short possible.
## How does a CFD let you profit when price falls?
Owning Bitcoin or Ethereum on an exchange is simple. You buy the coin, you hold it, and you profit only if the price rises later. There is no mechanism inside that trade to profit from a fall, because you actually hold the asset.
A crypto CFD works differently. You are not buying the coin at all. You are entering a contract with a broker to exchange the difference between the opening and closing price, settled in cash. Because nothing changes hands except that price difference, the direction you choose does not change the mechanics. Go long and you profit if price rises. Go short and you profit if price falls. Owning the coin only ever gives you the first of those two outcomes.
On the desk, we always described this as a product difference, not a prediction. A CFD and a coin are different instruments built for different jobs, and conflating them is how people end up surprised by a tax bill or a margin call.
## What does Australia's 2:1 cap actually limit?
This is where the two routes diverge again. Spot crypto trades through AUSTRAC-registered exchanges with no leverage at all; you put up the full value and own the asset outright. Crypto CFDs trade through ASIC-regulated brokers, and ASIC caps retail leverage on them at 2:1, the lowest of any asset class SatoshiMacro covers. Forex majors get 30:1 under the same regime. That gap is not an accident. Crypto is volatile enough that a higher cap would wipe out margin accounts routinely, so the regulator deliberately throttles the one variable that decides how fast a loss compounds.
Even at 2:1, the guide is blunt about the outcome: most retail investor accounts lose money when trading CFDs. That is the honest limitation underneath all of this, and it does not disappear just because the leverage cap here is lower than anywhere else.
## Does the tax treatment change which route makes sense?
Yes, and it follows directly from ownership. Hold the coin and you sit inside the capital gains tax system, with the 50 percent discount available once you have held past 12 months. Trade a CFD and there is no asset to hold, so the profit is ordinary income from day one, taxed at your marginal rate regardless of how long the position stayed open.
That difference alone should decide the route before leverage or direction even enters the conversation. A long-term holder chasing the 12-month discount has no reason to touch a CFD. An active trader running short-dated positions in both directions has no CGT discount to protect anyway, so ordinary-income treatment is simply the cost of the tool.
## Who does each route actually suit?
I would split this by what you are trying to do with your time, not by how much capital you have. An investor who checks a position once a week and wants exposure to Bitcoin over years gets nothing extra from a CFD; leverage and two-way exposure are wasted on a thesis measured in years, and the ordinary-income tax treatment throws away the 12-month CGT discount for no benefit. An active trader who wants to express a view over days or weeks, in either direction, gets nothing extra from spot ownership; there is no way to go short, no leverage to size conviction, and a wallet to secure for a position you may close within the day.
Where people get it wrong is picking the route based on which platform they already have an account with, rather than which description above actually matches what they are doing. A spot holder who starts shorting through the same exchange is really describing a CFD trade, just without ASIC's 2:1 cap or negative balance protection sitting underneath it. That gap is worth closing before the next drawdown, not after it.
## What would I actually do with this?
My read is that most beginners pick the CFD route for the wrong reason, usually because leverage sounds like free money rather than a dial that makes losses move faster too. The guide's own sequence is the right order: learn what a CFD, margin and a stop loss actually are, practise on a demo account, then size real positions. The FAQ puts it plainly: sizing sensibly at 1 to 2 percent risk per trade is why most beginners want at least a few hundred dollars before starting, rather than the smallest amount an app will accept.
If the goal is holding Bitcoin for years, skip CFDs entirely and buy the coin on an AUSTRAC-registered exchange. If the goal is trading price moves in both directions, the 2:1 cap and negative balance protection exist specifically because ASIC assumes you will eventually be wrong. You need the structure to survive being wrong before you can be right often enough to matter.
SatoshiMacro's guide to trading crypto in Australia walks through both routes, the long and short mechanics, the leverage cap and the tax split in full, with the demo-first sequence for anyone starting from zero.
https://satoshimacro.com/guides/forex/how-to-trade-crypto/?utm_source=binance_square&utm_medium=social&utm_campaign=autopilot_article
#SatoshiMacro #CryptoCFD #BitcoinTrading #ASIC
## How does a CFD let you profit when price falls?
Owning Bitcoin or Ethereum on an exchange is simple. You buy the coin, you hold it, and you profit only if the price rises later. There is no mechanism inside that trade to profit from a fall, because you actually hold the asset.
A crypto CFD works differently. You are not buying the coin at all. You are entering a contract with a broker to exchange the difference between the opening and closing price, settled in cash. Because nothing changes hands except that price difference, the direction you choose does not change the mechanics. Go long and you profit if price rises. Go short and you profit if price falls. Owning the coin only ever gives you the first of those two outcomes.
On the desk, we always described this as a product difference, not a prediction. A CFD and a coin are different instruments built for different jobs, and conflating them is how people end up surprised by a tax bill or a margin call.
## What does Australia's 2:1 cap actually limit?
This is where the two routes diverge again. Spot crypto trades through AUSTRAC-registered exchanges with no leverage at all; you put up the full value and own the asset outright. Crypto CFDs trade through ASIC-regulated brokers, and ASIC caps retail leverage on them at 2:1, the lowest of any asset class SatoshiMacro covers. Forex majors get 30:1 under the same regime. That gap is not an accident. Crypto is volatile enough that a higher cap would wipe out margin accounts routinely, so the regulator deliberately throttles the one variable that decides how fast a loss compounds.
Even at 2:1, the guide is blunt about the outcome: most retail investor accounts lose money when trading CFDs. That is the honest limitation underneath all of this, and it does not disappear just because the leverage cap here is lower than anywhere else.
## Does the tax treatment change which route makes sense?
Yes, and it follows directly from ownership. Hold the coin and you sit inside the capital gains tax system, with the 50 percent discount available once you have held past 12 months. Trade a CFD and there is no asset to hold, so the profit is ordinary income from day one, taxed at your marginal rate regardless of how long the position stayed open.
That difference alone should decide the route before leverage or direction even enters the conversation. A long-term holder chasing the 12-month discount has no reason to touch a CFD. An active trader running short-dated positions in both directions has no CGT discount to protect anyway, so ordinary-income treatment is simply the cost of the tool.
## Who does each route actually suit?
I would split this by what you are trying to do with your time, not by how much capital you have. An investor who checks a position once a week and wants exposure to Bitcoin over years gets nothing extra from a CFD; leverage and two-way exposure are wasted on a thesis measured in years, and the ordinary-income tax treatment throws away the 12-month CGT discount for no benefit. An active trader who wants to express a view over days or weeks, in either direction, gets nothing extra from spot ownership; there is no way to go short, no leverage to size conviction, and a wallet to secure for a position you may close within the day.
Where people get it wrong is picking the route based on which platform they already have an account with, rather than which description above actually matches what they are doing. A spot holder who starts shorting through the same exchange is really describing a CFD trade, just without ASIC's 2:1 cap or negative balance protection sitting underneath it. That gap is worth closing before the next drawdown, not after it.
## What would I actually do with this?
My read is that most beginners pick the CFD route for the wrong reason, usually because leverage sounds like free money rather than a dial that makes losses move faster too. The guide's own sequence is the right order: learn what a CFD, margin and a stop loss actually are, practise on a demo account, then size real positions. The FAQ puts it plainly: sizing sensibly at 1 to 2 percent risk per trade is why most beginners want at least a few hundred dollars before starting, rather than the smallest amount an app will accept.
If the goal is holding Bitcoin for years, skip CFDs entirely and buy the coin on an AUSTRAC-registered exchange. If the goal is trading price moves in both directions, the 2:1 cap and negative balance protection exist specifically because ASIC assumes you will eventually be wrong. You need the structure to survive being wrong before you can be right often enough to matter.
SatoshiMacro's guide to trading crypto in Australia walks through both routes, the long and short mechanics, the leverage cap and the tax split in full, with the demo-first sequence for anyone starting from zero.
https://satoshimacro.com/guides/forex/how-to-trade-crypto/?utm_source=binance_square&utm_medium=social&utm_campaign=autopilot_article
#SatoshiMacro #CryptoCFD #BitcoinTrading #ASIC
73

·
--
Bearish
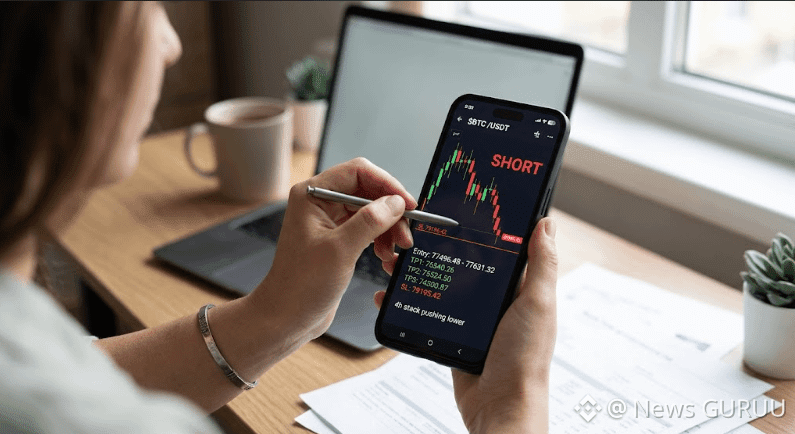
🔴 $BTC/USDT — SHORT SETUP!
📉 Bias: Strong Bearish
🎯 Entry: $77,496–$77,631
TP1: $76,340 (-1.6%)
TP2: $75,524 (-2.6%)
TP3: $74,300 (-4.2%)
🛑 Stop Loss: $79,195 (+2.1%)
Why Bearish?
4H and 1H trends below EMA50 & EMA200.
Sellers remain in control.
6/12 technical signals support downside.
⚠️ Watch the entry zone and invalidation level carefully.
👀 Will BTC continue dropping or reverse from here?."CLICK ON THE BELOW YELLOW COIN TAG TO GO TO DESIRED TRADING PAGE TO GET BENEFIT TRADE"$BTC
{spot}(BTCUSDT)
#btcshort #BitcoinTrading
🔴 $BTC /USDT — SHORT SETUP!
📉 Bias: Strong Bearish
🎯 Entry: $77,496–$77,631
TP1: $76,340 (-1.6%)
TP2: $75,524 (-2.6%)
TP3: $74,300 (-4.2%)
🛑 Stop Loss: $79,195 (+2.1%)
Why Bearish?
4H and 1H trends below EMA50 & EMA200.
Sellers remain in control.
6/12 technical signals support downside.
⚠️ Watch the entry zone and invalidation level carefully.
👀 Will BTC continue dropping or reverse from here?."CLICK ON THE BELOW YELLOW COIN TAG TO GO TO DESIRED TRADING PAGE TO GET BENEFIT TRADE"$BTC
#btcshort #BitcoinTrading
📉 Bias: Strong Bearish
🎯 Entry: $77,496–$77,631
TP1: $76,340 (-1.6%)
TP2: $75,524 (-2.6%)
TP3: $74,300 (-4.2%)
🛑 Stop Loss: $79,195 (+2.1%)
Why Bearish?
4H and 1H trends below EMA50 & EMA200.
Sellers remain in control.
6/12 technical signals support downside.
⚠️ Watch the entry zone and invalidation level carefully.
👀 Will BTC continue dropping or reverse from here?."CLICK ON THE BELOW YELLOW COIN TAG TO GO TO DESIRED TRADING PAGE TO GET BENEFIT TRADE"$BTC
#btcshort #BitcoinTrading
1
52
·
--
Bearish
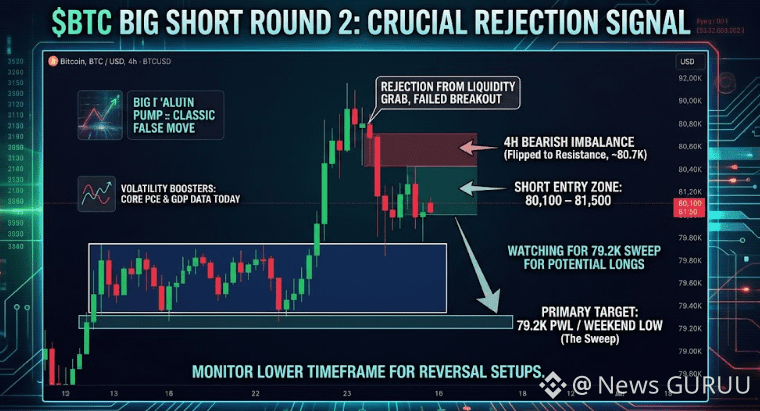
🔴 $BTC — SHORT SETUP ROUND 2
📍 Entry: $80,100–$81,500
BTC pumped after FOMC but fell back into consolidation. 📉
👀 Key Levels to Watch:
🎯 Target: $79,200 liquidity sweep
⚠️ Resistance: $80,700–$82,000
📊 Core PCE and GDP could bring volatility.
Will BTC sweep $79.2K before a potential rebound toward $82K? 👀."CLICK ON THE BELOW YELLOW COIN TAG TO GO TO DESIRED TRADING PAGE TO GET BENEFIT TRADE"$BTC
{spot}(BTCUSDT)
#BTC #BitcoinTrading
🔴 $BTC — SHORT SETUP ROUND 2
📍 Entry: $80,100–$81,500
BTC pumped after FOMC but fell back into consolidation. 📉
👀 Key Levels to Watch:
🎯 Target: $79,200 liquidity sweep
⚠️ Resistance: $80,700–$82,000
📊 Core PCE and GDP could bring volatility.
Will BTC sweep $79.2K before a potential rebound toward $82K? 👀."CLICK ON THE BELOW YELLOW COIN TAG TO GO TO DESIRED TRADING PAGE TO GET BENEFIT TRADE"$BTC
#BTC #BitcoinTrading
📍 Entry: $80,100–$81,500
BTC pumped after FOMC but fell back into consolidation. 📉
👀 Key Levels to Watch:
🎯 Target: $79,200 liquidity sweep
⚠️ Resistance: $80,700–$82,000
📊 Core PCE and GDP could bring volatility.
Will BTC sweep $79.2K before a potential rebound toward $82K? 👀."CLICK ON THE BELOW YELLOW COIN TAG TO GO TO DESIRED TRADING PAGE TO GET BENEFIT TRADE"$BTC
#BTC #BitcoinTrading
1
64

·
--
Bullish
🚀 BTC/USDC Market Update 📈
Bitcoin is showing a nice recovery on the 1H chart, currently trading around $80,900. 🔥
📊 Key Levels to Watch: 🟢 Support: $80,300 – $80,600 🔴 Resistance: $81,300 – $81,700
BTC has bounced from the lower support area and is trying to regain bullish momentum. 👀
If buyers maintain strength above $80.8K, the next test could be around $81.3K+.
What do you think — $82K next or another pullback? 👇
#BTC #Bitcoin #Crypto #BTCUSDC #Binance #CryptoTrading #MarketUpdate #BitcoinTrading
$BTC
{future}(BTCUSDT)
🚀 BTC/USDC Market Update 📈
Bitcoin is showing a nice recovery on the 1H chart, currently trading around $80,900. 🔥
📊 Key Levels to Watch: 🟢 Support: $80,300 – $80,600 🔴 Resistance: $81,300 – $81,700
BTC has bounced from the lower support area and is trying to regain bullish momentum. 👀
If buyers maintain strength above $80.8K, the next test could be around $81.3K+.
What do you think — $82K next or another pullback? 👇
#BTC #Bitcoin #Crypto #BTCUSDC #Binance #CryptoTrading #MarketUpdate #BitcoinTrading
$BTC
Bitcoin is showing a nice recovery on the 1H chart, currently trading around $80,900. 🔥
📊 Key Levels to Watch: 🟢 Support: $80,300 – $80,600 🔴 Resistance: $81,300 – $81,700
BTC has bounced from the lower support area and is trying to regain bullish momentum. 👀
If buyers maintain strength above $80.8K, the next test could be around $81.3K+.
What do you think — $82K next or another pullback? 👇
#BTC #Bitcoin #Crypto #BTCUSDC #Binance #CryptoTrading #MarketUpdate #BitcoinTrading
$BTC

4
91

·
--
₿ BITCOIN 4H ANALYSIS | BTC/USDT 📊
Bitcoin is showing short-term selling pressure, and traders should watch the support zone closely.
📉 If support breaks, further downside is possible.
📈 If support holds, a bullish bounce could happen.
🎯 Wait for confirmation before entering a trade.
🔥 WHAT'S NEXT FOR BITCOIN?
🚀 BULLISH or 🔻 BEARISH?
{future}(BTCUSDT)
Comment your prediction below! 👇
#bitcoin #BinanceSquareFamily #CryptoAnalysis" #BitcoinTrading #CryptoCommunity
₿ BITCOIN 4H ANALYSIS | BTC/USDT 📊
Bitcoin is showing short-term selling pressure, and traders should watch the support zone closely.
📉 If support breaks, further downside is possible.
📈 If support holds, a bullish bounce could happen.
🎯 Wait for confirmation before entering a trade.
🔥 WHAT'S NEXT FOR BITCOIN?
🚀 BULLISH or 🔻 BEARISH?
Comment your prediction below! 👇
#bitcoin #BinanceSquareFamily #CryptoAnalysis" #BitcoinTrading #CryptoCommunity
Bitcoin is showing short-term selling pressure, and traders should watch the support zone closely.
📉 If support breaks, further downside is possible.
📈 If support holds, a bullish bounce could happen.
🎯 Wait for confirmation before entering a trade.
🔥 WHAT'S NEXT FOR BITCOIN?
🚀 BULLISH or 🔻 BEARISH?
Comment your prediction below! 👇
#bitcoin #BinanceSquareFamily #CryptoAnalysis" #BitcoinTrading #CryptoCommunity

1
182

·
--
📊 BTC MARKET ANALYSIS | OCTOBER 24, 2026 🟠
$BTC
{future}(BTCUSDT)
Bitcoin is trading around $80,600, with the market showing mixed signals across timeframes. The next move depends on whether buyers can reclaim resistance or sellers push price below support. 👀
🟢 Key Support Levels
🔹 $80,400
🔹 $79,550
🔹 $78,200
🔴 Key Resistance Levels
🔸 $81,700
🔸 $82,700
🔸 $84,200
🚀 Bullish Scenario: A confirmed breakout above $81,700 could open the way toward $82,700 and potentially $84,200.
⚠️ Bearish Scenario: A breakdown below $80,400 may expose BTC to further downside toward $79,550 and $78,200.
🎯 My Strategy: Watch volume, candle closes, and reactions at key levels. No confirmation, no rush!
What’s your view — BTC to $84K or a retest of $79K first? 👇
#BinanceSquareFamily #BitcoinTrading
Note: Price and technical levels are approximate as of October 24, 2026, and may change quickly. This is market commentary, not financial advice.
📊 BTC MARKET ANALYSIS | OCTOBER 24, 2026 🟠
$BTC
Bitcoin is trading around $80,600, with the market showing mixed signals across timeframes. The next move depends on whether buyers can reclaim resistance or sellers push price below support. 👀
🟢 Key Support Levels
🔹 $80,400
🔹 $79,550
🔹 $78,200
🔴 Key Resistance Levels
🔸 $81,700
🔸 $82,700
🔸 $84,200
🚀 Bullish Scenario: A confirmed breakout above $81,700 could open the way toward $82,700 and potentially $84,200.
⚠️ Bearish Scenario: A breakdown below $80,400 may expose BTC to further downside toward $79,550 and $78,200.
🎯 My Strategy: Watch volume, candle closes, and reactions at key levels. No confirmation, no rush!
What’s your view — BTC to $84K or a retest of $79K first? 👇
#BinanceSquareFamily #BitcoinTrading
Note: Price and technical levels are approximate as of October 24, 2026, and may change quickly. This is market commentary, not financial advice.
$BTC
Bitcoin is trading around $80,600, with the market showing mixed signals across timeframes. The next move depends on whether buyers can reclaim resistance or sellers push price below support. 👀
🟢 Key Support Levels
🔹 $80,400
🔹 $79,550
🔹 $78,200
🔴 Key Resistance Levels
🔸 $81,700
🔸 $82,700
🔸 $84,200
🚀 Bullish Scenario: A confirmed breakout above $81,700 could open the way toward $82,700 and potentially $84,200.
⚠️ Bearish Scenario: A breakdown below $80,400 may expose BTC to further downside toward $79,550 and $78,200.
🎯 My Strategy: Watch volume, candle closes, and reactions at key levels. No confirmation, no rush!
What’s your view — BTC to $84K or a retest of $79K first? 👇
#BinanceSquareFamily #BitcoinTrading
Note: Price and technical levels are approximate as of October 24, 2026, and may change quickly. This is market commentary, not financial advice.
33

🚨 $BTC
{spot}(BTCUSDT)
SELL SETUP 🚨
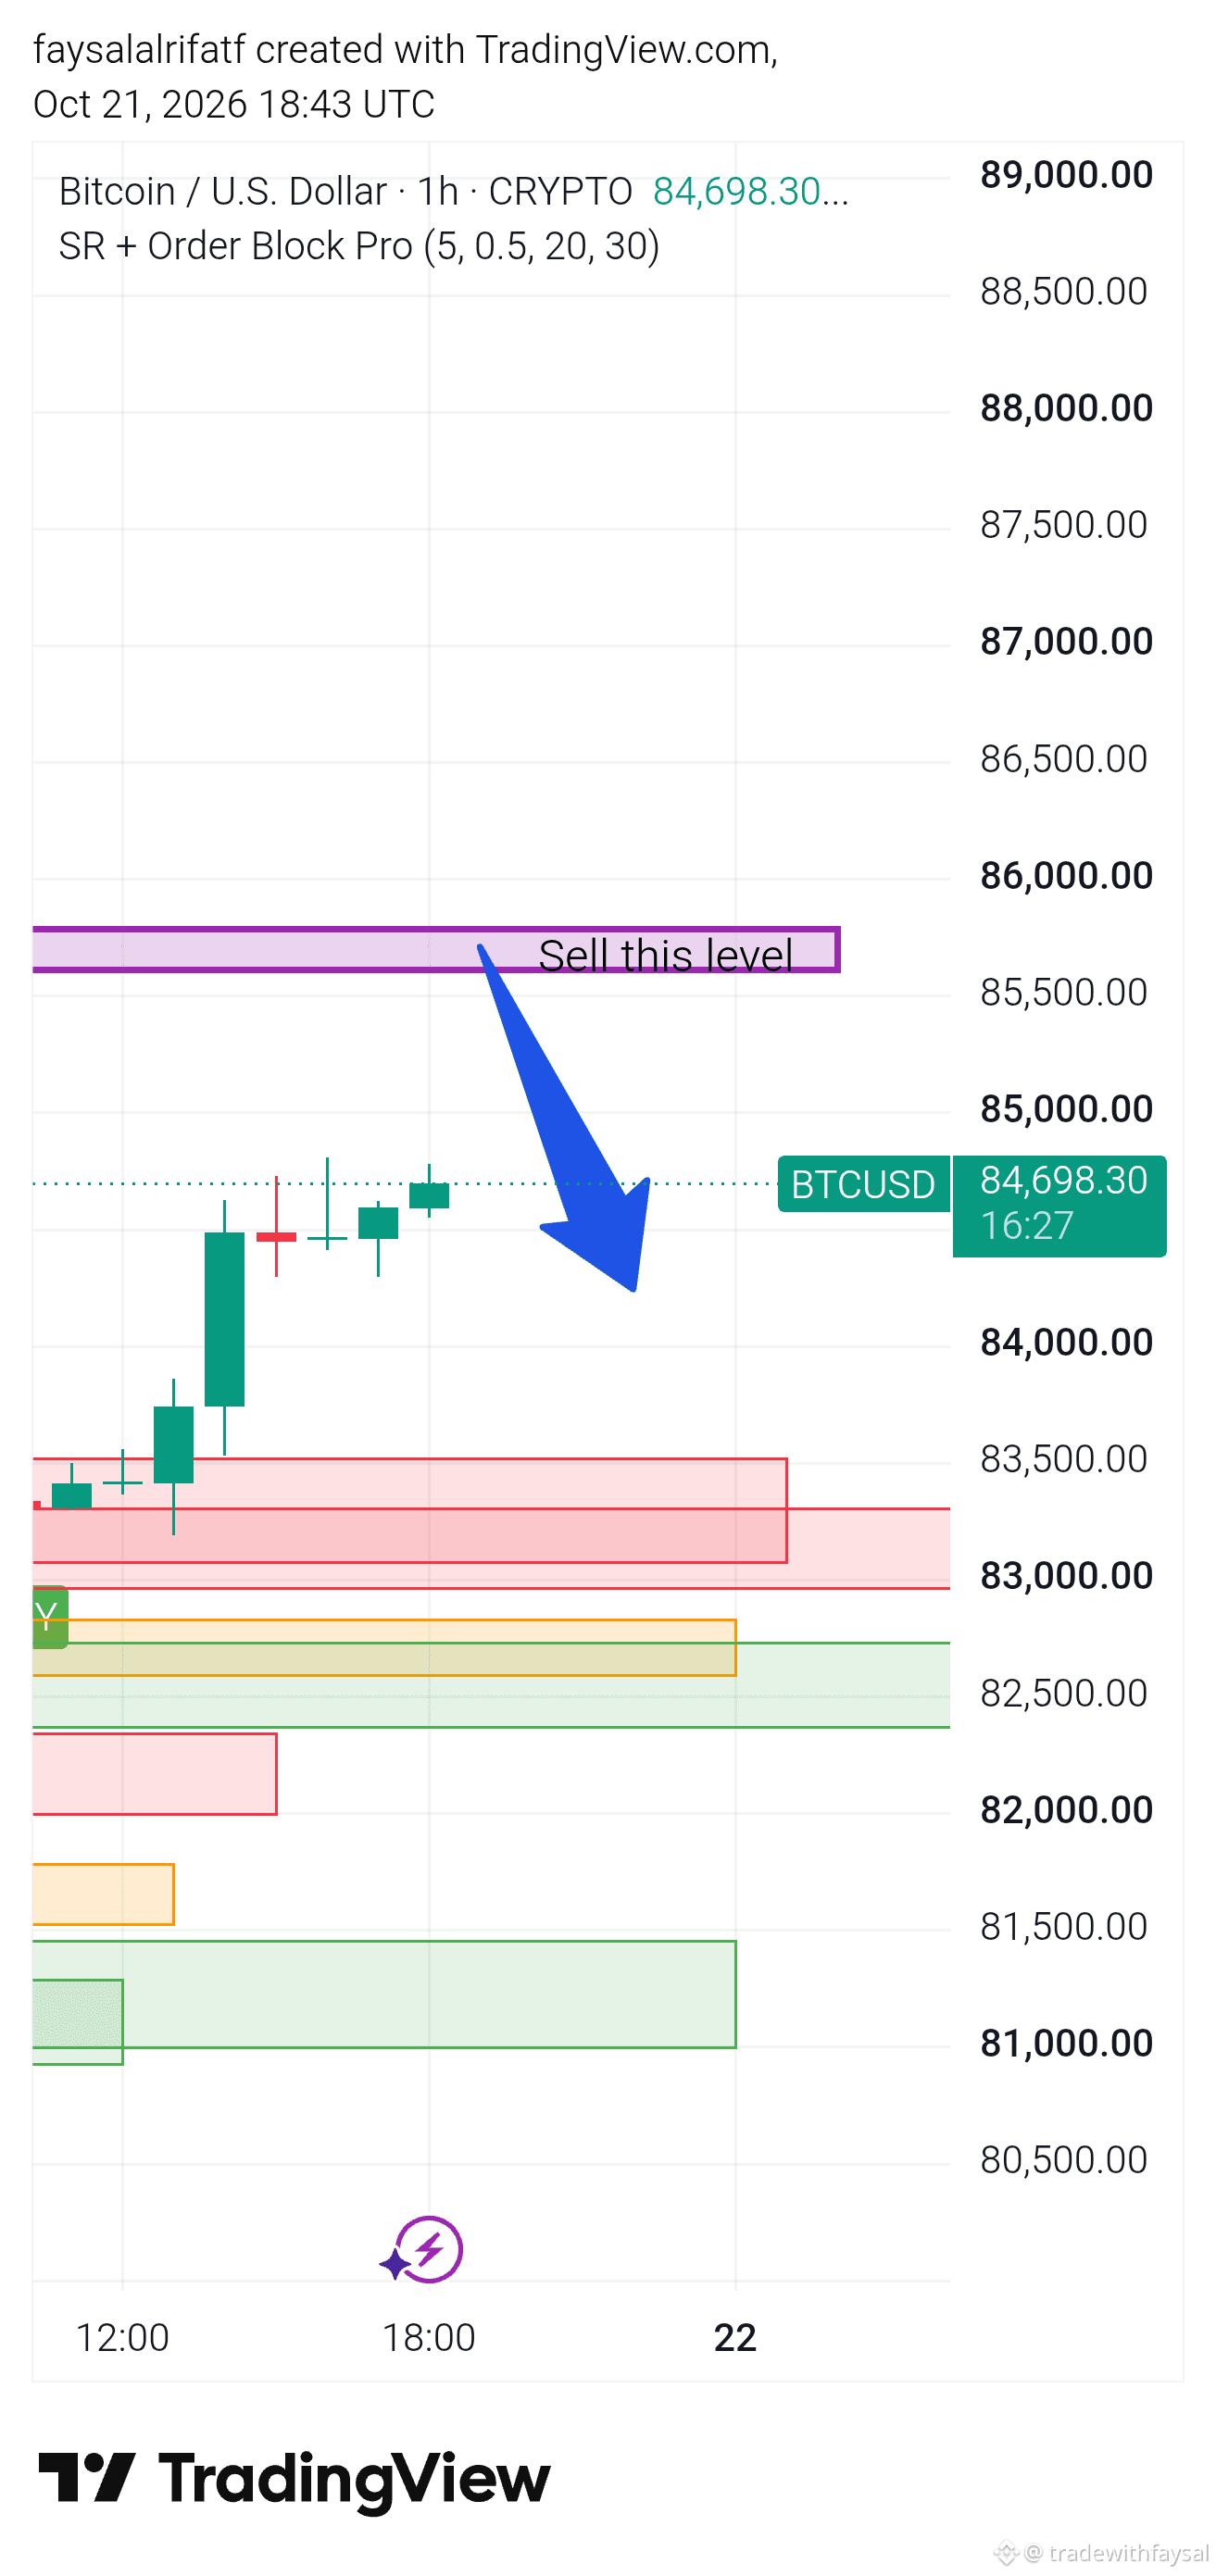
Bitcoin is currently trading around 84,698 and approaching a major resistance / supply zone around 85,550–85,750.
📌 SELL ZONE: 85,550–85,750
🎯 TP1: 84,500
🎯 TP2: 83,500
🎯 TP3: 82,500
🛑 SL: Above 86,000
I’m watching this area for a bearish rejection and confirmation before entering a short position. If $BTC breaks and closes strongly above the resistance zone, the bearish setup becomes invalid.
⚠️ Wait for confirmation before entering. Always manage your risk and never risk more than you can afford to lose.
#BTC #Bitcoin #BTCUSD #CryptoTrading #BitcoinTrading #TradingView #TechnicalAnalysis #PriceAction #SupplyAndDemand #OrderBlock #ShortSetup #Crypto
🚨 $BTC
SELL SETUP 🚨
Bitcoin is currently trading around 84,698 and approaching a major resistance / supply zone around 85,550–85,750.
📌 SELL ZONE: 85,550–85,750
🎯 TP1: 84,500
🎯 TP2: 83,500
🎯 TP3: 82,500
🛑 SL: Above 86,000
I’m watching this area for a bearish rejection and confirmation before entering a short position. If $BTC breaks and closes strongly above the resistance zone, the bearish setup becomes invalid.
⚠️ Wait for confirmation before entering. Always manage your risk and never risk more than you can afford to lose.
#BTC #Bitcoin #BTCUSD #CryptoTrading #BitcoinTrading #TradingView #TechnicalAnalysis #PriceAction #SupplyAndDemand #OrderBlock #ShortSetup #Crypto
SELL SETUP 🚨
Bitcoin is currently trading around 84,698 and approaching a major resistance / supply zone around 85,550–85,750.
📌 SELL ZONE: 85,550–85,750
🎯 TP1: 84,500
🎯 TP2: 83,500
🎯 TP3: 82,500
🛑 SL: Above 86,000
I’m watching this area for a bearish rejection and confirmation before entering a short position. If $BTC breaks and closes strongly above the resistance zone, the bearish setup becomes invalid.
⚠️ Wait for confirmation before entering. Always manage your risk and never risk more than you can afford to lose.
#BTC #Bitcoin #BTCUSD #CryptoTrading #BitcoinTrading #TradingView #TechnicalAnalysis #PriceAction #SupplyAndDemand #OrderBlock #ShortSetup #Crypto
116

·
--
🦈 $BTC DEFENDS CRITICAL MULTI-WEEK STRUCTURE AS EXPANSION TOWARD 87.5K APPROACHES ⚡
Entry: 84,000 ⚡
Target: 87,500 🎯
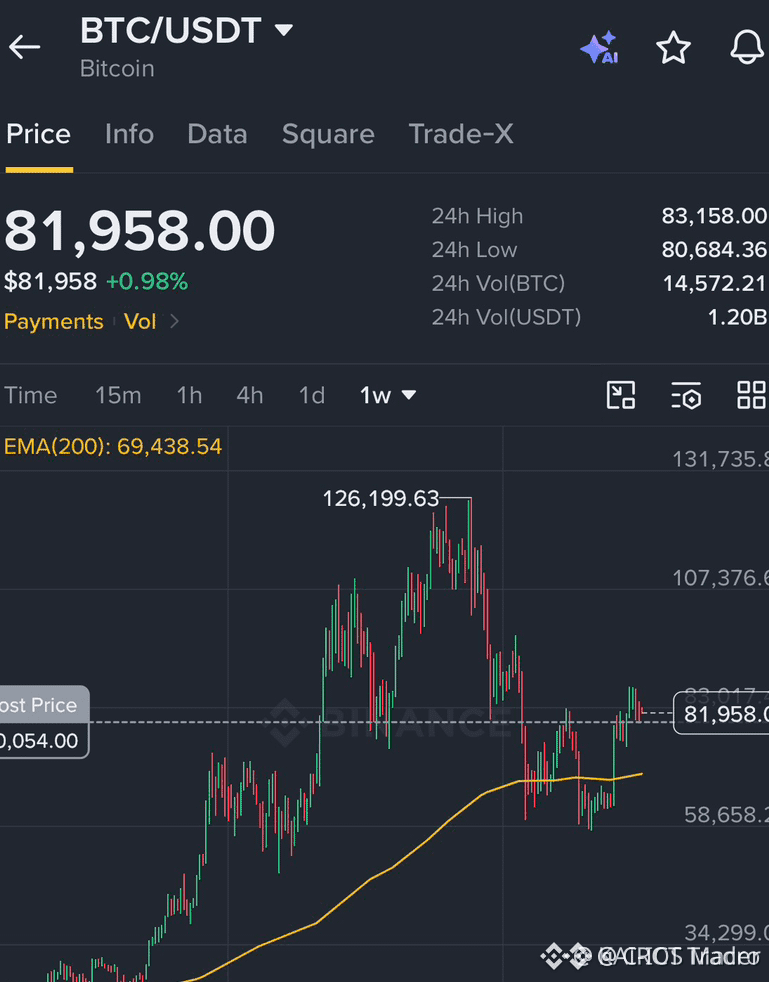
📌 Institutional demand continues to anchor $BTC , with five consecutive weekly candle closes firmly above the 50 MA confirming market structure integrity. The lower liquidity shelf between 80,000 and 76,100 remains an aggressive absorption zone against counter-trend short positioning.
📊 A clean structural expansion above the 84,000 pivot unlocks immediate upside momentum toward major buy-side liquidity resting at 87,500. 💬 Are you bidding within the structural support zone, or waiting for confirmed acceptance above 84,000? 👇
⚠️ Not financial advice. Always manage your risk. 🛡️
🏷️ #BTC #MarketStructure #OrderFlow #BitcoinTrading
🎯 🦈
🦈 $BTC DEFENDS CRITICAL MULTI-WEEK STRUCTURE AS EXPANSION TOWARD 87.5K APPROACHES ⚡
Entry: 84,000 ⚡
Target: 87,500 🎯
📌 Institutional demand continues to anchor $BTC , with five consecutive weekly candle closes firmly above the 50 MA confirming market structure integrity. The lower liquidity shelf between 80,000 and 76,100 remains an aggressive absorption zone against counter-trend short positioning.
📊 A clean structural expansion above the 84,000 pivot unlocks immediate upside momentum toward major buy-side liquidity resting at 87,500. 💬 Are you bidding within the structural support zone, or waiting for confirmed acceptance above 84,000? 👇
⚠️ Not financial advice. Always manage your risk. 🛡️
🏷️ #BTC #MarketStructure #OrderFlow #BitcoinTrading
🎯 🦈
Entry: 84,000 ⚡
Target: 87,500 🎯
📌 Institutional demand continues to anchor $BTC , with five consecutive weekly candle closes firmly above the 50 MA confirming market structure integrity. The lower liquidity shelf between 80,000 and 76,100 remains an aggressive absorption zone against counter-trend short positioning.
📊 A clean structural expansion above the 84,000 pivot unlocks immediate upside momentum toward major buy-side liquidity resting at 87,500. 💬 Are you bidding within the structural support zone, or waiting for confirmed acceptance above 84,000? 👇
⚠️ Not financial advice. Always manage your risk. 🛡️
🏷️ #BTC #MarketStructure #OrderFlow #BitcoinTrading
🎯 🦈
67

📊 Today’s Crypto Snapshot
Market sentiment is turning favorable this afternoon as Bitcoin reclaims key resistance zones, currently trading above $82,000. Despite broader stock market pullbacks, crypto resilience is holding up, led by strong BTC dominance.
Key Highlights: • BTC price bouncing back toward $83K mark • Altcoins following with steady gains across major pairs • Trader leverage easing up, setting up a healthier market structure
What's your strategy for the week ahead? Accumulating or holding cash? 🤔
#CryptoNews #BinanceSquare #BitcoinTrading #CryptoMarkets #CryptocurrencyWealth $BTC
{spot}(BTCUSDT)
📊 Today’s Crypto Snapshot
Market sentiment is turning favorable this afternoon as Bitcoin reclaims key resistance zones, currently trading above $82,000. Despite broader stock market pullbacks, crypto resilience is holding up, led by strong BTC dominance.
Key Highlights: • BTC price bouncing back toward $83K mark • Altcoins following with steady gains across major pairs • Trader leverage easing up, setting up a healthier market structure
What's your strategy for the week ahead? Accumulating or holding cash? 🤔
#CryptoNews #BinanceSquare #BitcoinTrading #CryptoMarkets #CryptocurrencyWealth $BTC
Market sentiment is turning favorable this afternoon as Bitcoin reclaims key resistance zones, currently trading above $82,000. Despite broader stock market pullbacks, crypto resilience is holding up, led by strong BTC dominance.
Key Highlights: • BTC price bouncing back toward $83K mark • Altcoins following with steady gains across major pairs • Trader leverage easing up, setting up a healthier market structure
What's your strategy for the week ahead? Accumulating or holding cash? 🤔
#CryptoNews #BinanceSquare #BitcoinTrading #CryptoMarkets #CryptocurrencyWealth $BTC
1
97
Log in to explore more content
Join global crypto users on Binance Square
⚡️ Get latest and useful information about crypto.
💬 Trusted by the world’s largest crypto exchange.
👍 Discover real insights from verified creators.
Email / Phone number
Trending Topics
1
#NvidiaInvestigatesAfterHuang’sAffairApology
172,641 views
1,594 Discussing
2
#BitcoinFiveWeeklyLosses
200,106 views
2,048 Discussing
3
#AIChipSlumpNasdaq
107,356 views
1,276 Discussing
4
#CPITestsDecemberRateOutlook
625,413 views
2,732 Discussing
5
#AnthropicRejectsIPODelayValuationinQuestion
29,042 views
373 Discussing
6
#CryptoLiquidationsReach$1.16BIn24Hours
6,736 views
36 Discussing
7
#BrentCrudeDrops3.8%To$94.56
6,909 views
20 Discussing
8
#EUInstitutionsInviteIndustryToSetTokenizedSecuritiesStandards
1,542 views
15 Discussing
9
#ChinaCACListsFiveIssuesAffectingBlockchainFilings
11,787 views
143 Discussing
10
#UKBanksCanNowApplyToConductCryptoAssetBusiness
10,452 views
100 Discussing