
#zhongji
zhongji
30,657 views
321 Discussing
Hot
Latest

·
--
🔻 $ZHONGJI SHORT 🔻
Entry: 69.3812 – 69.7988
SL: 70.7910
TP1: 68.5606
TP2: 67.8743
TP3: 67.0164
📈 Technical Outlook:
$ZHONGJI is showing bearish pressure after losing strength near a key technical zone. The setup is supported by EMA trend is bearish, price is breaking below recent support, RSI supports bearish momentum. As long as price stays below the entry area, sellers may continue pushing toward the listed downside targets.
#ZHONGJI #Crypto #BinanceSquare #Trading
🔻 $ZHONGJI SHORT 🔻
Entry: 69.3812 – 69.7988
SL: 70.7910
TP1: 68.5606
TP2: 67.8743
TP3: 67.0164
📈 Technical Outlook:
$ZHONGJI is showing bearish pressure after losing strength near a key technical zone. The setup is supported by EMA trend is bearish, price is breaking below recent support, RSI supports bearish momentum. As long as price stays below the entry area, sellers may continue pushing toward the listed downside targets.
#ZHONGJI #Crypto #BinanceSquare #Trading
Entry: 69.3812 – 69.7988
SL: 70.7910
TP1: 68.5606
TP2: 67.8743
TP3: 67.0164
📈 Technical Outlook:
$ZHONGJI is showing bearish pressure after losing strength near a key technical zone. The setup is supported by EMA trend is bearish, price is breaking below recent support, RSI supports bearish momentum. As long as price stays below the entry area, sellers may continue pushing toward the listed downside targets.
#ZHONGJI #Crypto #BinanceSquare #Trading

1

·
--
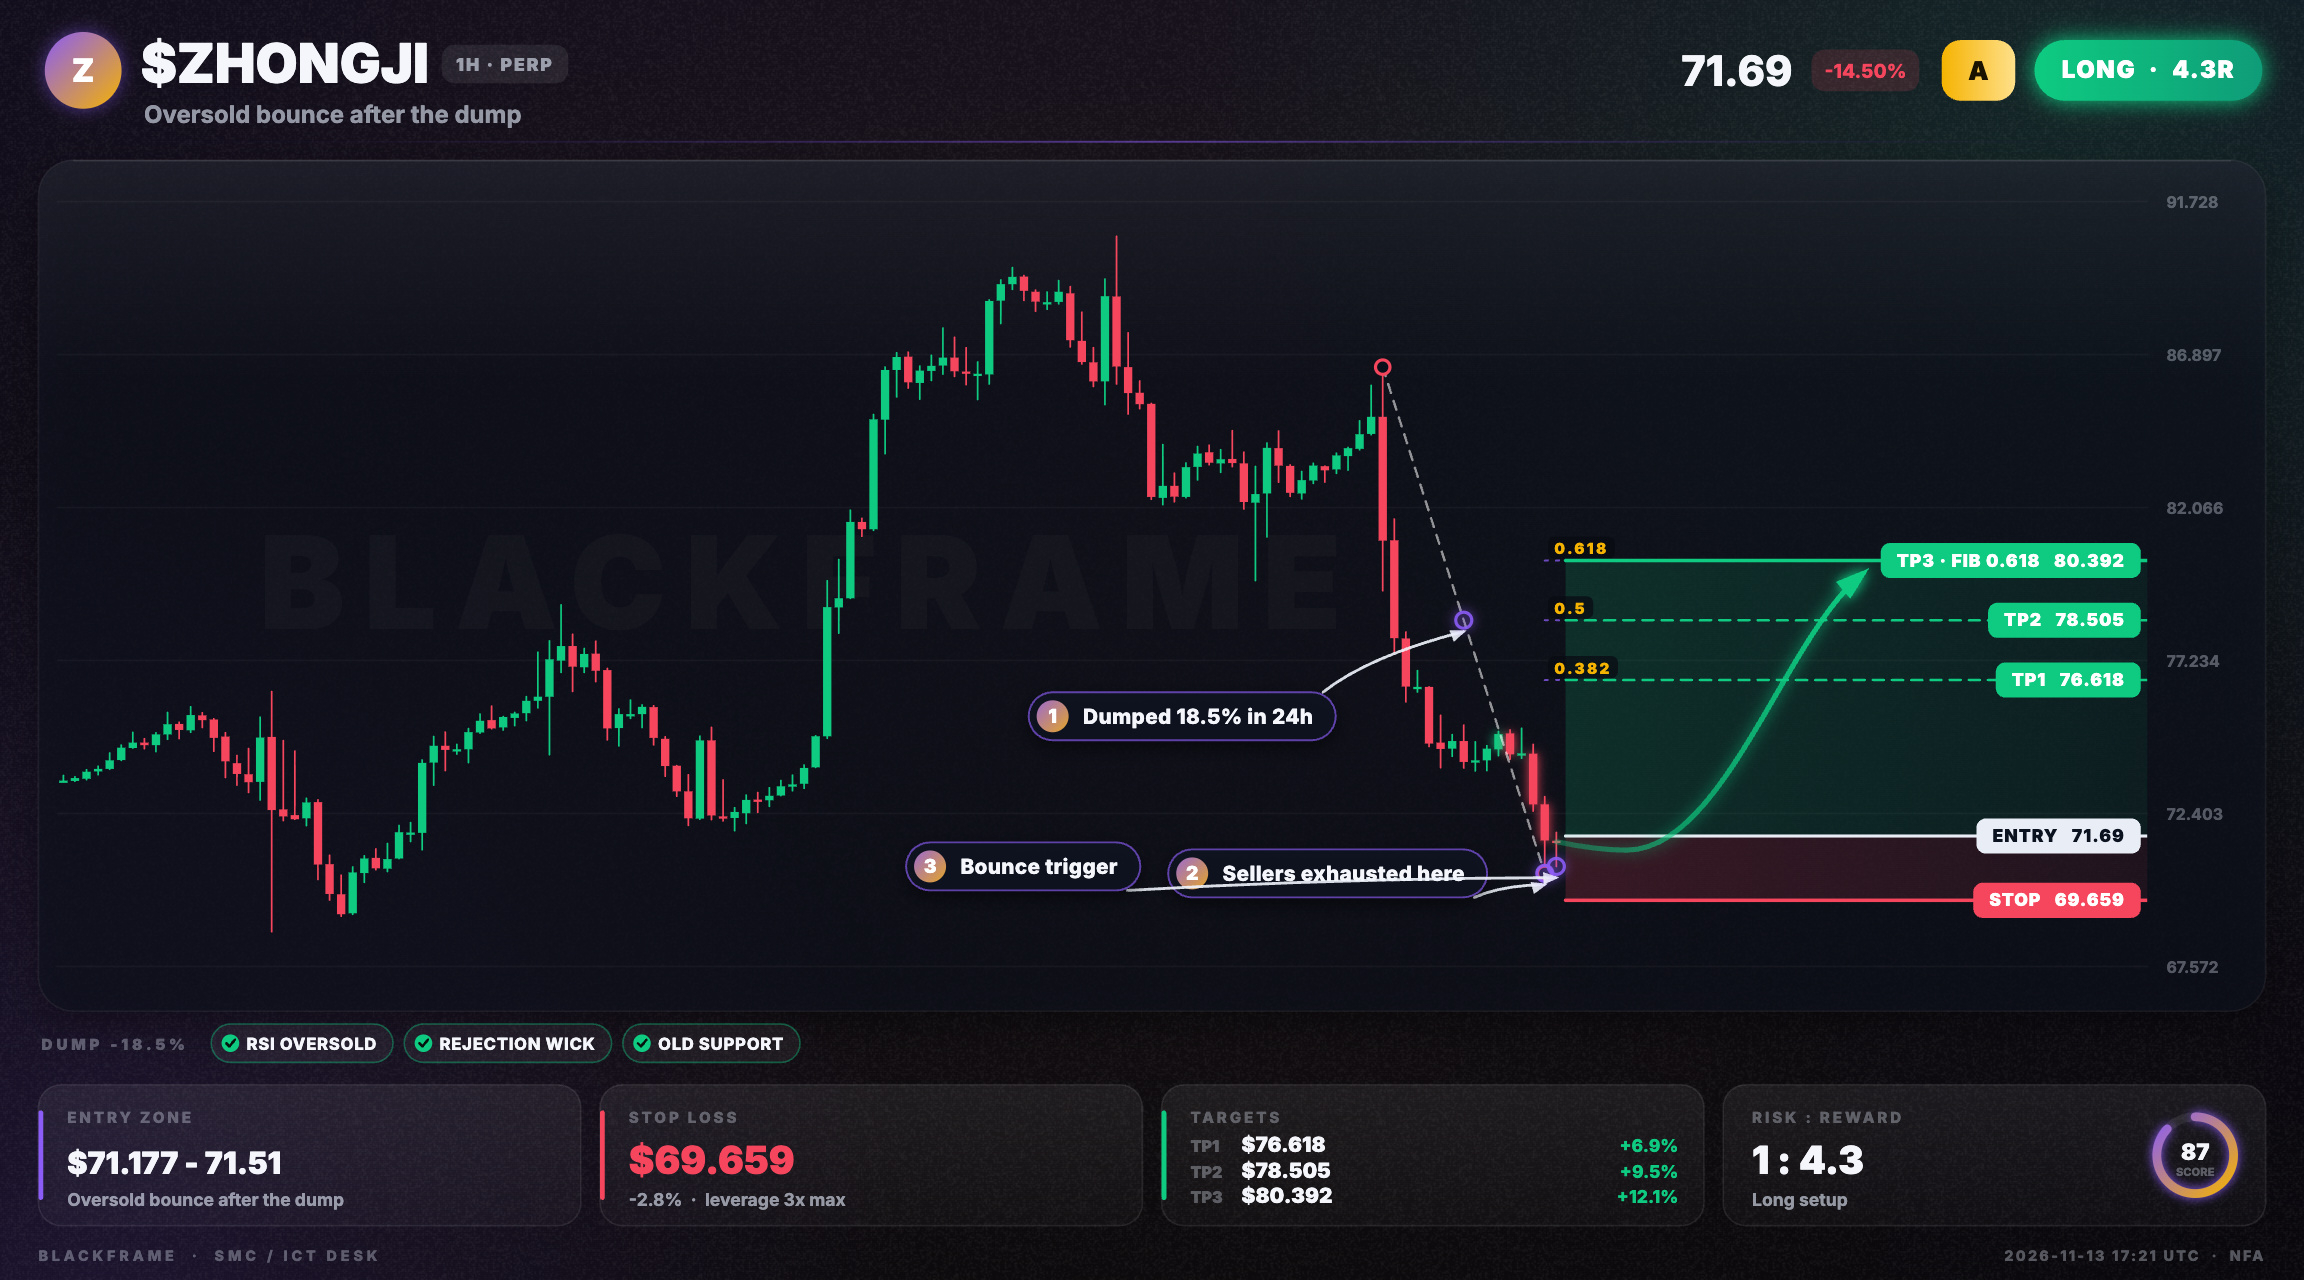
🧲 $ZHONGJI capitulation printed, bounce loading
LONG · 1H
Entry: $71.177 - $71.51
TP1: $76.618
TP2: $78.505
TP3: $80.392
SL: $69.659
$ZHONGJI dumped -18.5% in the last 24 hours. RSI is deeply oversold on the 1H, a strong rejection wick formed at the lows and price is sitting on old support. Entry is on the first 15M strength, targets are the 0.382, 0.5 and 0.618 retracements of the dump.
#ZHONGJI #Crypto · NFA
🧲 $ZHONGJI capitulation printed, bounce loading
LONG · 1H
Entry: $71.177 - $71.51
TP1: $76.618
TP2: $78.505
TP3: $80.392
SL: $69.659
$ZHONGJI dumped -18.5% in the last 24 hours. RSI is deeply oversold on the 1H, a strong rejection wick formed at the lows and price is sitting on old support. Entry is on the first 15M strength, targets are the 0.382, 0.5 and 0.618 retracements of the dump.
#ZHONGJI #Crypto · NFA
LONG · 1H
Entry: $71.177 - $71.51
TP1: $76.618
TP2: $78.505
TP3: $80.392
SL: $69.659
$ZHONGJI dumped -18.5% in the last 24 hours. RSI is deeply oversold on the 1H, a strong rejection wick formed at the lows and price is sitting on old support. Entry is on the first 15M strength, targets are the 0.382, 0.5 and 0.618 retracements of the dump.
#ZHONGJI #Crypto · NFA
66

·
--
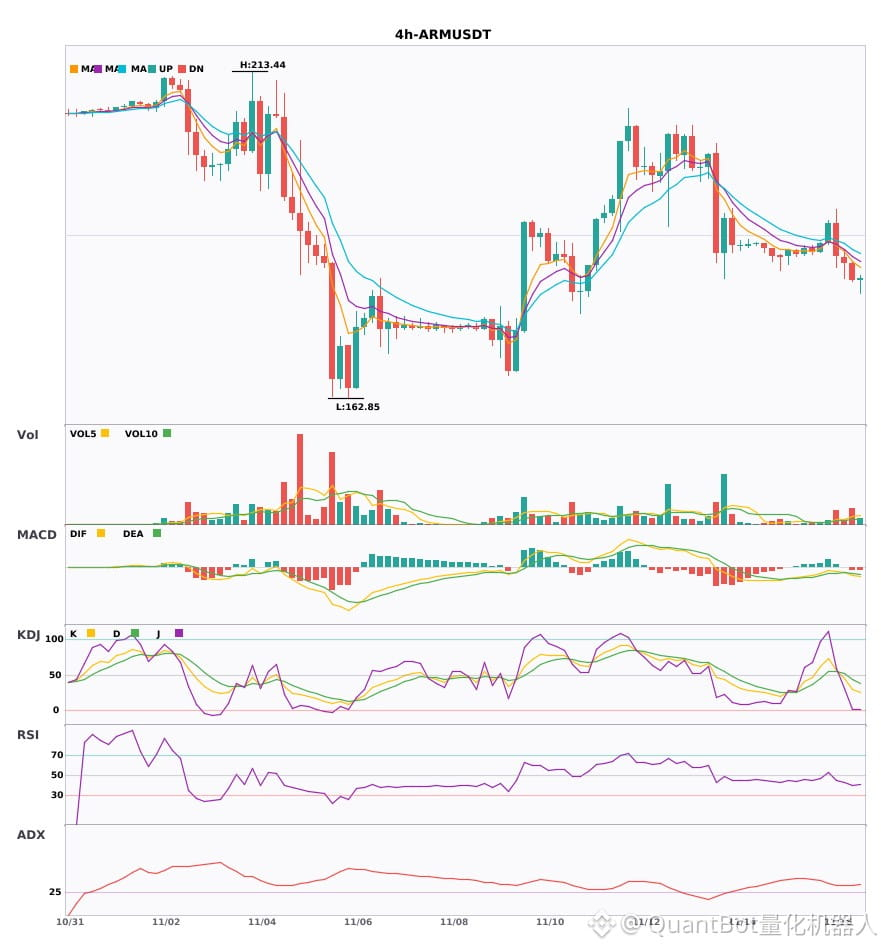
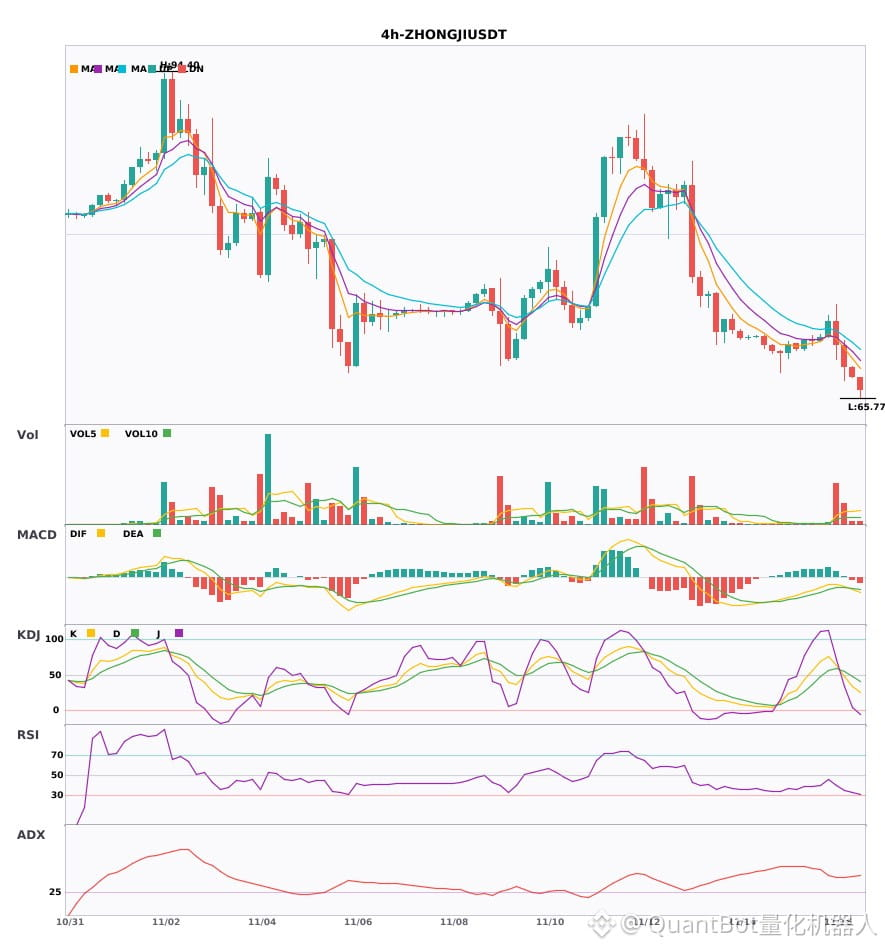
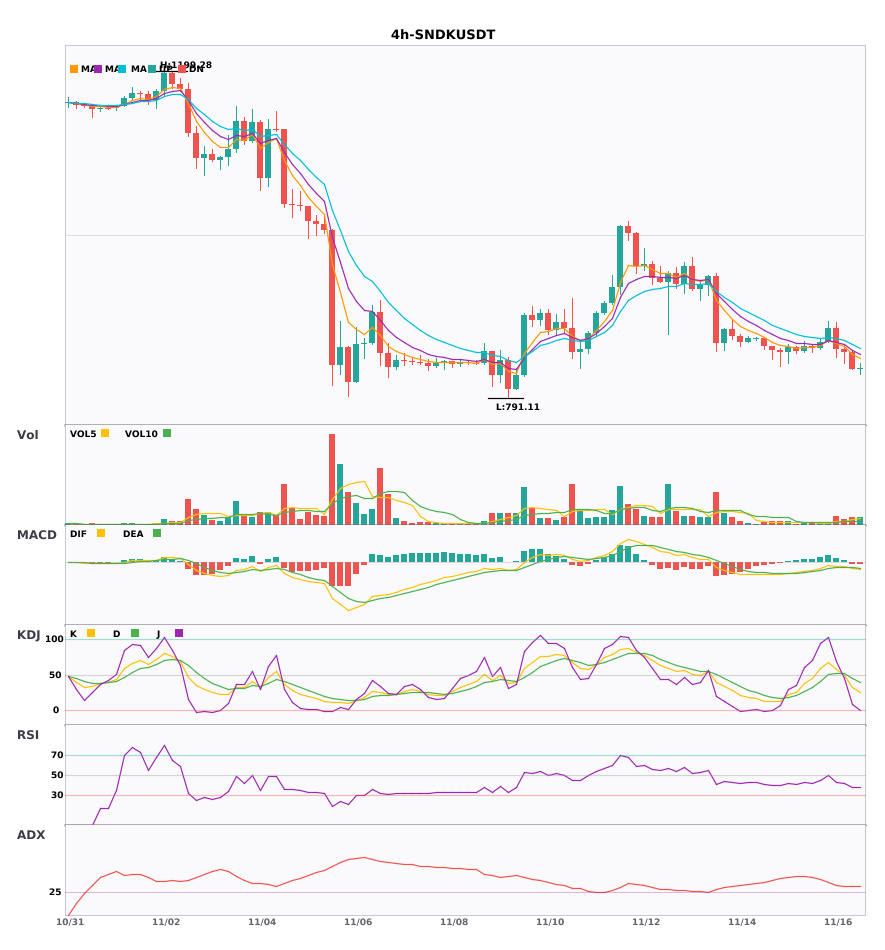
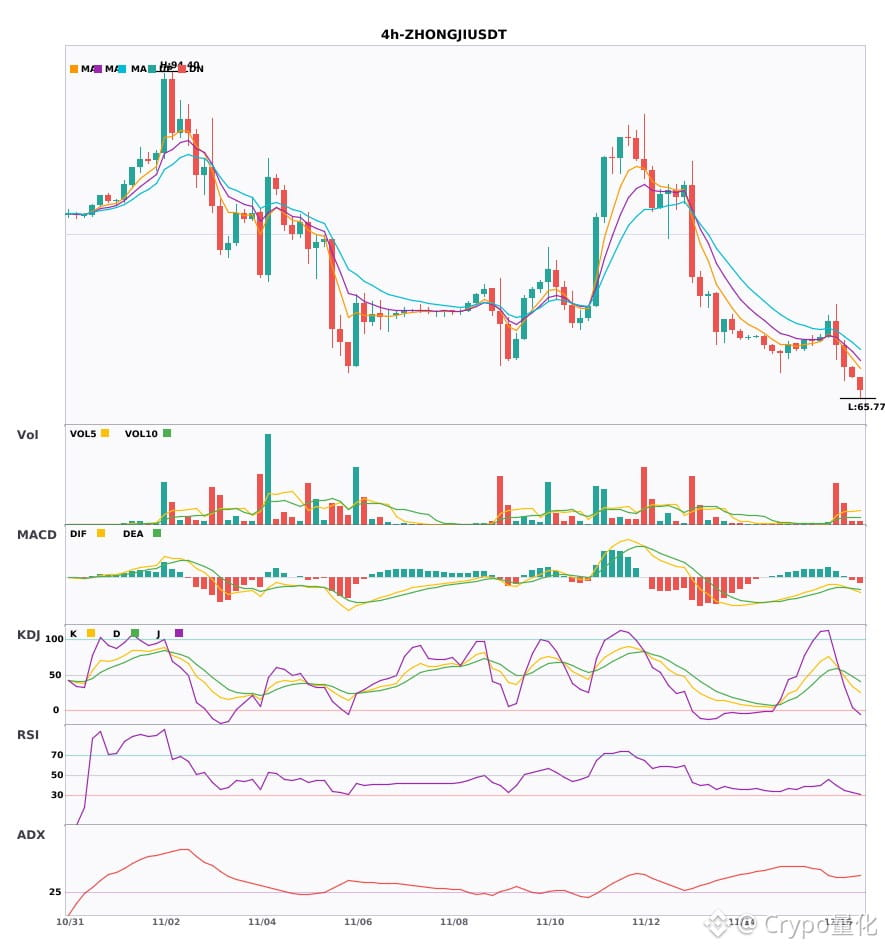
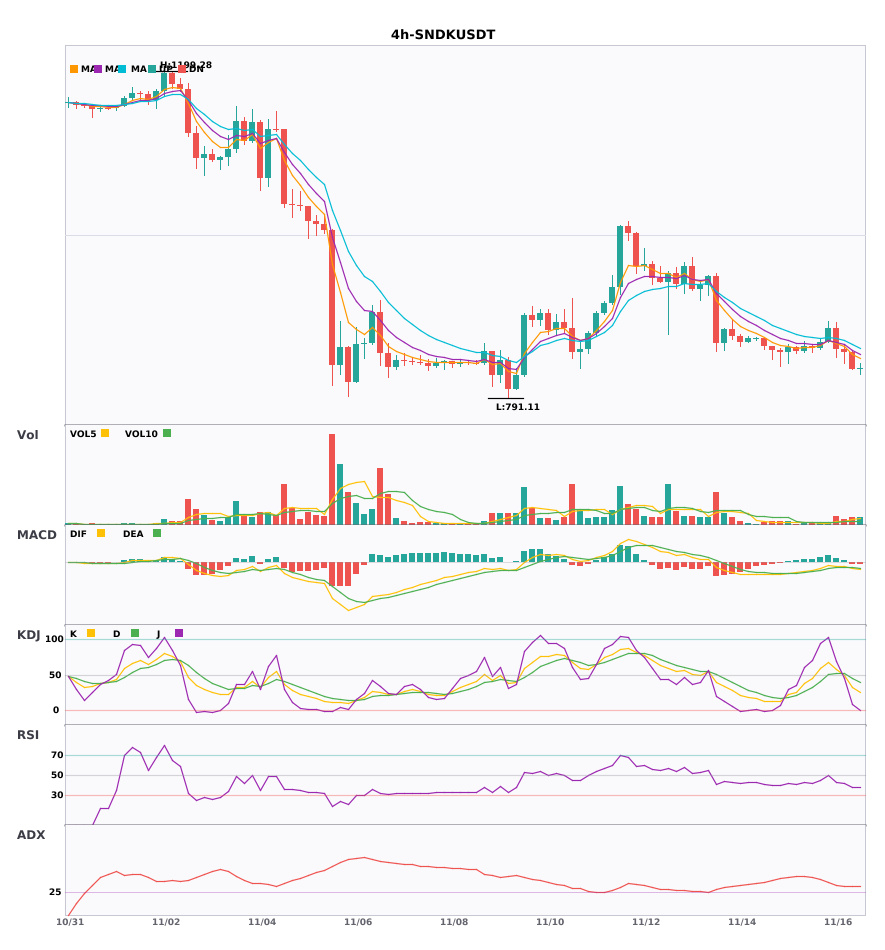
$ARM $ZHONGJI $SNDK 4-hour daily-chart confluence short 🔥
════════════════════
🟢 $ARM 4-hour bearish signal
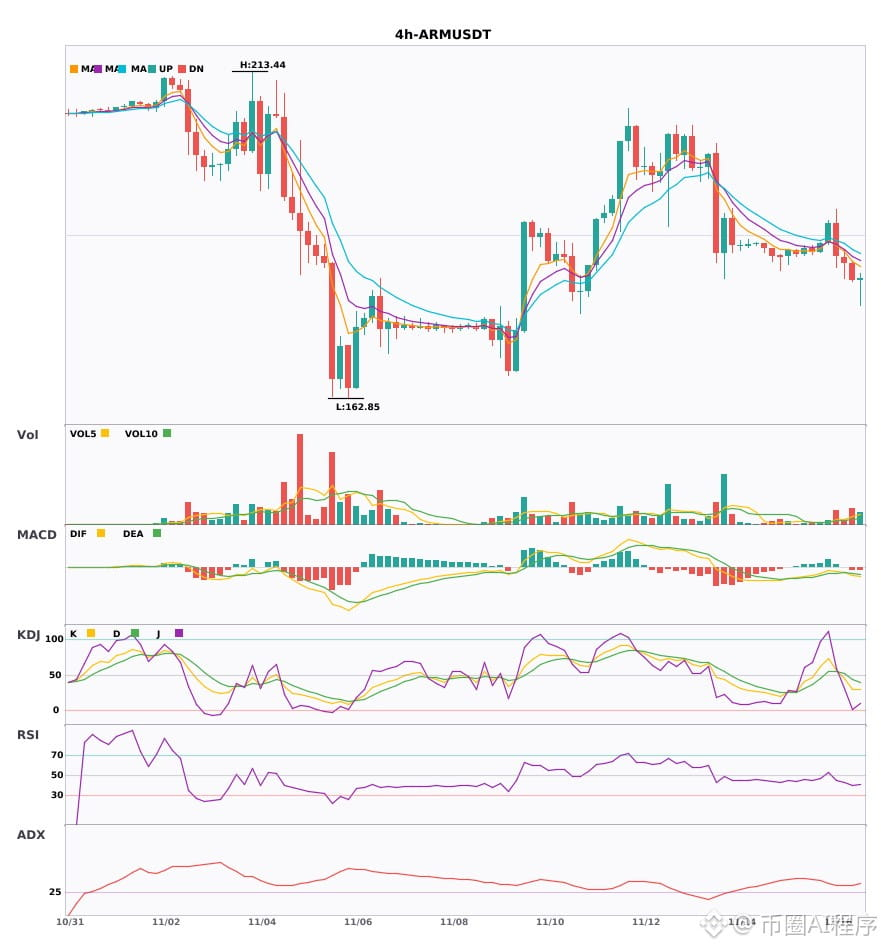
⚠️Technical analysis: Daily and 4-hour bearish confluence confirmed. MACD formed a bearish crossover below zero, with the green bars expanding; moving averages are bearishly aligned and diverging downward; KDJ K crossed below D, indicating weakness; trading volume surged to 2.9x. Bears have the upper hand.
════════════════════
🟢 $ZHONGJI 4-hour bearish signal
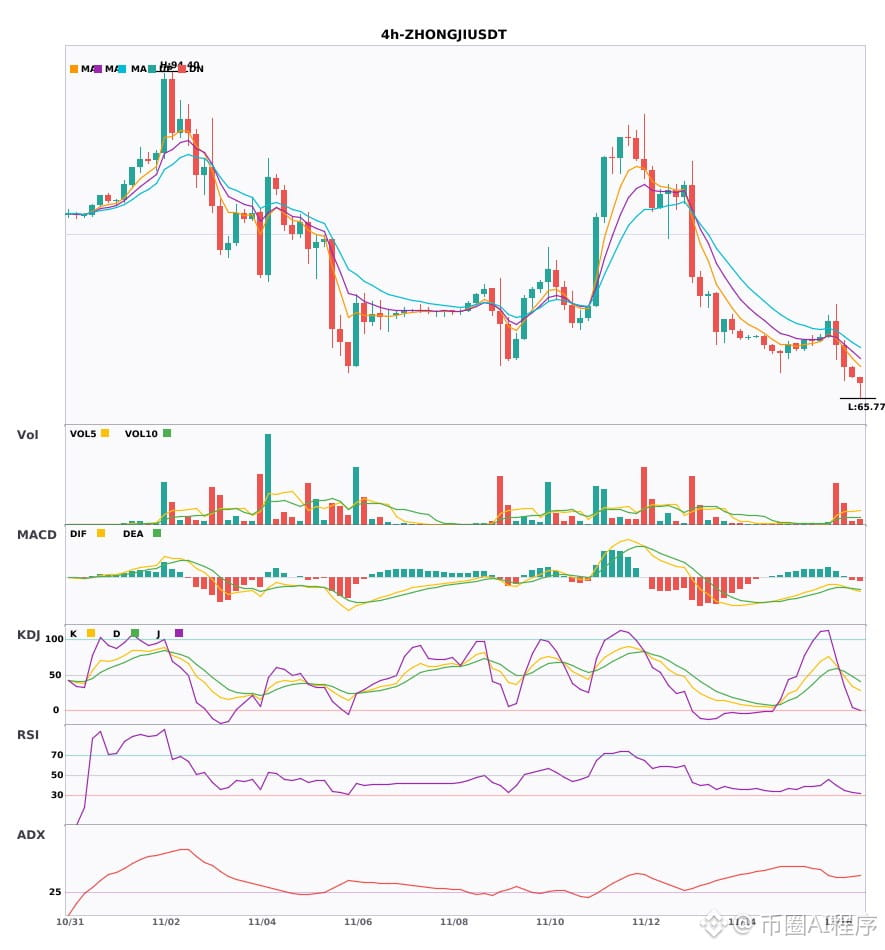
⚠️Technical analysis: Multi-timeframe confluence short: daily and 4-hour bearish confluence confirmed. The 4-hour MACD formed a bearish crossover below zero on rising volume, accelerating bearish momentum; moving averages are bearishly aligned and trending down; KDJ is weak; volume increased 2.9x.
════════════════════
🟢 $SNDK 4-hour bearish signal
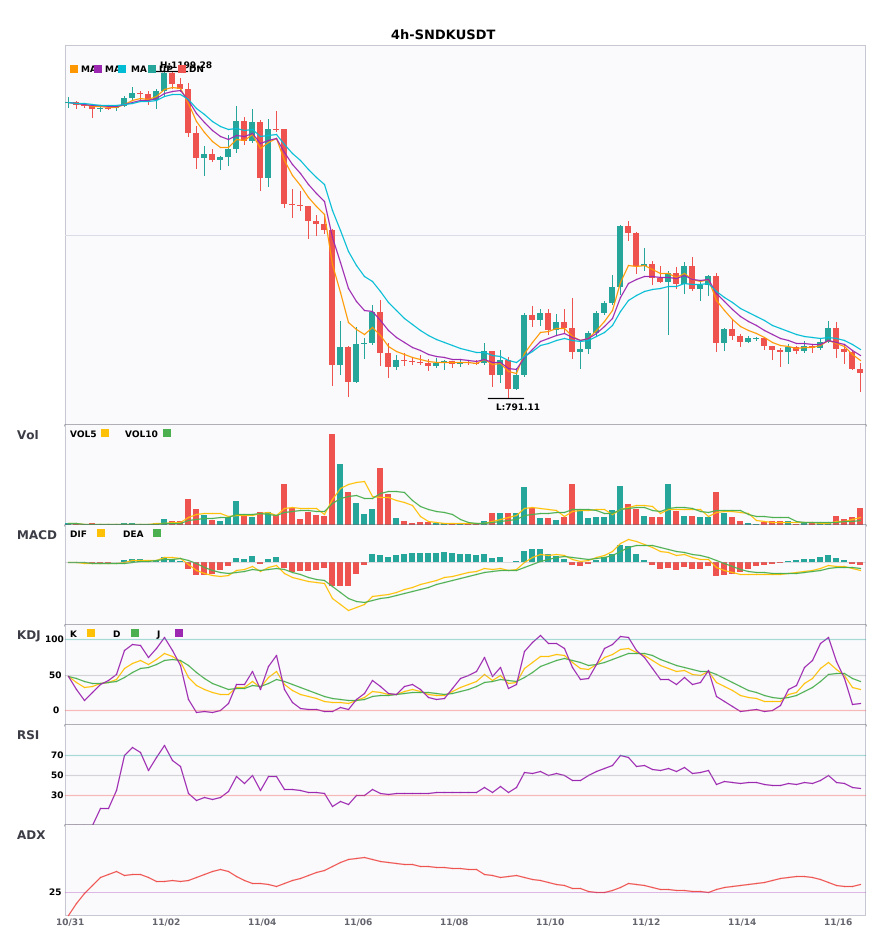
⚠️Technical analysis: 4-hour entry + daily bearish confluence confirmed! MACD formed a bearish crossover below zero, moving averages are bearishly aligned, KDJ K crossed below D but is not yet oversold, and volume increased 2x. Bearish momentum is accelerating.
════════════════════
🔔 Follow for first-hand market updates 🔔
#多周期共振 #ARM #ZHONGJI #SNDK
📌 When trading, watch for whether the candlestick pattern confirms
$ARM $ZHONGJI $SNDK 4-hour daily-chart confluence short 🔥
════════════════════
🟢 $ARM 4-hour bearish signal
⚠️Technical analysis: Daily and 4-hour bearish confluence confirmed. MACD formed a bearish crossover below zero, with the green bars expanding; moving averages are bearishly aligned and diverging downward; KDJ K crossed below D, indicating weakness; trading volume surged to 2.9x. Bears have the upper hand.
════════════════════
🟢 $ZHONGJI 4-hour bearish signal
⚠️Technical analysis: Multi-timeframe confluence short: daily and 4-hour bearish confluence confirmed. The 4-hour MACD formed a bearish crossover below zero on rising volume, accelerating bearish momentum; moving averages are bearishly aligned and trending down; KDJ is weak; volume increased 2.9x.
════════════════════
🟢 $SNDK 4-hour bearish signal
⚠️Technical analysis: 4-hour entry + daily bearish confluence confirmed! MACD formed a bearish crossover below zero, moving averages are bearishly aligned, KDJ K crossed below D but is not yet oversold, and volume increased 2x. Bearish momentum is accelerating.
════════════════════
🔔 Follow for first-hand market updates 🔔
#多周期共振 #ARM #ZHONGJI #SNDK
📌 When trading, watch for whether the candlestick pattern confirms
════════════════════
🟢 $ARM 4-hour bearish signal
⚠️Technical analysis: Daily and 4-hour bearish confluence confirmed. MACD formed a bearish crossover below zero, with the green bars expanding; moving averages are bearishly aligned and diverging downward; KDJ K crossed below D, indicating weakness; trading volume surged to 2.9x. Bears have the upper hand.
════════════════════
🟢 $ZHONGJI 4-hour bearish signal
⚠️Technical analysis: Multi-timeframe confluence short: daily and 4-hour bearish confluence confirmed. The 4-hour MACD formed a bearish crossover below zero on rising volume, accelerating bearish momentum; moving averages are bearishly aligned and trending down; KDJ is weak; volume increased 2.9x.
════════════════════
🟢 $SNDK 4-hour bearish signal
⚠️Technical analysis: 4-hour entry + daily bearish confluence confirmed! MACD formed a bearish crossover below zero, moving averages are bearishly aligned, KDJ K crossed below D but is not yet oversold, and volume increased 2x. Bearish momentum is accelerating.
════════════════════
🔔 Follow for first-hand market updates 🔔
#多周期共振 #ARM #ZHONGJI #SNDK
📌 When trading, watch for whether the candlestick pattern confirms
1

$ARM / $ZHONGJI / $SNDK 4 4-hour confluence turns bearish, with bearish signals appearing simultaneously
📉 $ARM | 4-hour bearish signal
━━━━━━━━━━━━━━━━━━
Technical analysis: ADX(34) confirms the trend; MACD forms a bearish crossover below the zero line; EMAs are bearishly aligned; KDJ is weak (K30.0/D44.3); volume increases 2.9-fold.
Price change: -1.4400%
📉 $ZHONGJI | 4-hour bearish signal
━━━━━━━━━━━━━━━━━━
Technical analysis: ADX43 indicates a pronounced trend; MACD forms a bearish crossover below the zero line; EMA5/8/13 are bearishly aligned; KDJ is weak (K33.4, D48.0); volume increases 2.9-fold.
Price change: -1.3000%
📉 $SNDK | 4-hour bearish signal
━━━━━━━━━━━━━━━━━━
Technical analysis: The ADX reading is 32, indicating a pronounced trending market. MACD forms a bearish crossover below the zero line, and bearish momentum is accelerating. Short-term moving averages are bearishly aligned (EMA5<EMA8<EMA13). KDJ is in the weak zone, with bears in control; K is 33.0 and D is 45.4. Volume has increased significantly, reaching 2.0 times its previous level.
Price change: -2.5200%
━━━━━━━━━━━━━━━━━━
#技术分析 #ARM #ZHONGJI #SNDK
📌 The above content is for reference only and does not constitute investment advice
$ARM / $ZHONGJI / $SNDK 4 4-hour confluence turns bearish, with bearish signals appearing simultaneously
📉 $ARM | 4-hour bearish signal
━━━━━━━━━━━━━━━━━━
Technical analysis: ADX(34) confirms the trend; MACD forms a bearish crossover below the zero line; EMAs are bearishly aligned; KDJ is weak (K30.0/D44.3); volume increases 2.9-fold.
Price change: -1.4400%
📉 $ZHONGJI | 4-hour bearish signal
━━━━━━━━━━━━━━━━━━
Technical analysis: ADX43 indicates a pronounced trend; MACD forms a bearish crossover below the zero line; EMA5/8/13 are bearishly aligned; KDJ is weak (K33.4, D48.0); volume increases 2.9-fold.
Price change: -1.3000%
📉 $SNDK | 4-hour bearish signal
━━━━━━━━━━━━━━━━━━
Technical analysis: The ADX reading is 32, indicating a pronounced trending market. MACD forms a bearish crossover below the zero line, and bearish momentum is accelerating. Short-term moving averages are bearishly aligned (EMA5<EMA8<EMA13). KDJ is in the weak zone, with bears in control; K is 33.0 and D is 45.4. Volume has increased significantly, reaching 2.0 times its previous level.
Price change: -2.5200%
━━━━━━━━━━━━━━━━━━
#技术分析 #ARM #ZHONGJI #SNDK
📌 The above content is for reference only and does not constitute investment advice
📉 $ARM | 4-hour bearish signal
━━━━━━━━━━━━━━━━━━
Technical analysis: ADX(34) confirms the trend; MACD forms a bearish crossover below the zero line; EMAs are bearishly aligned; KDJ is weak (K30.0/D44.3); volume increases 2.9-fold.
Price change: -1.4400%
📉 $ZHONGJI | 4-hour bearish signal
━━━━━━━━━━━━━━━━━━
Technical analysis: ADX43 indicates a pronounced trend; MACD forms a bearish crossover below the zero line; EMA5/8/13 are bearishly aligned; KDJ is weak (K33.4, D48.0); volume increases 2.9-fold.
Price change: -1.3000%
📉 $SNDK | 4-hour bearish signal
━━━━━━━━━━━━━━━━━━
Technical analysis: The ADX reading is 32, indicating a pronounced trending market. MACD forms a bearish crossover below the zero line, and bearish momentum is accelerating. Short-term moving averages are bearishly aligned (EMA5<EMA8<EMA13). KDJ is in the weak zone, with bears in control; K is 33.0 and D is 45.4. Volume has increased significantly, reaching 2.0 times its previous level.
Price change: -2.5200%
━━━━━━━━━━━━━━━━━━
#技术分析 #ARM #ZHONGJI #SNDK
📌 The above content is for reference only and does not constitute investment advice
11

·
--
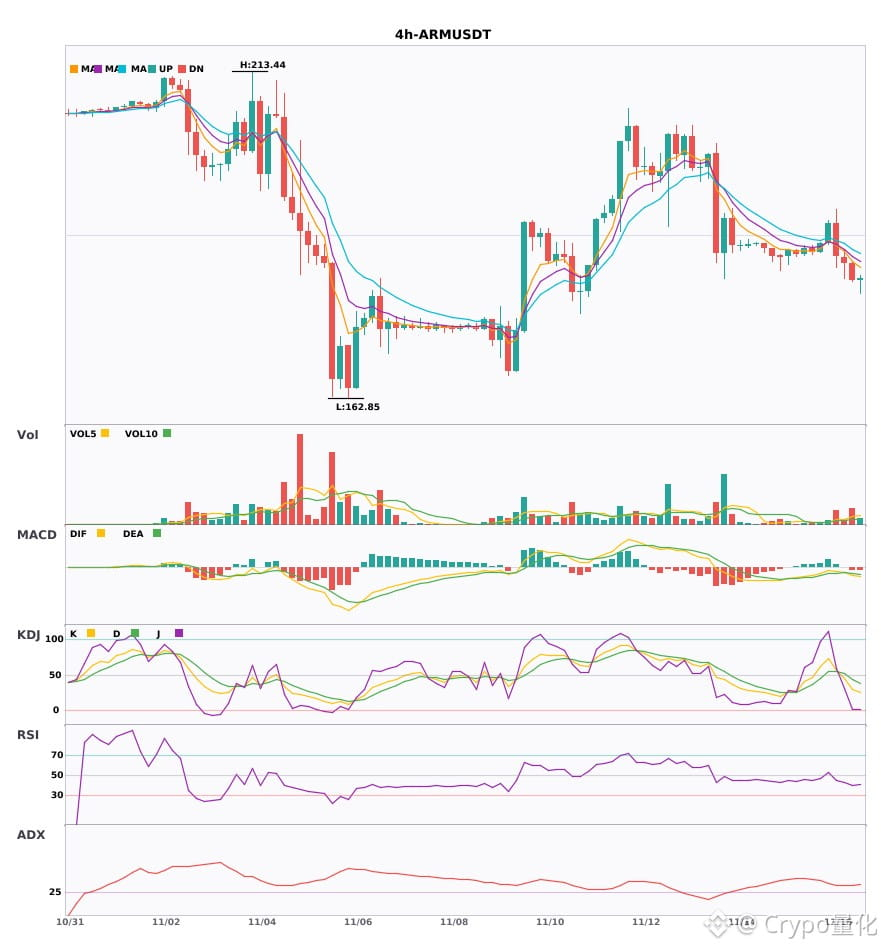
$ARM $ZHONGJI $SNDK 4 hours bearish—don't rush to buy the dip 🔥
════════════════════
🟢 $ARM 4-hour short signal
⚠️ Technical analysis: ADX shows a clear trend. MACD has formed a death cross below zero, with expanding green bars, indicating accelerating bearish momentum. Moving averages are bearishly aligned and diverging downward. KDJ is weak, with K crossing below D. Bears are in control, and trading volume is 2.9 times higher.
════════════════════
🟢 $ZHONGJI 4-hour short signal
⚠️ Technical analysis: ADX at 43 shows a very clear trend. The MACD death cross signals accelerating bearish momentum. Moving averages are bearishly aligned and diverging downward. KDJ is weak, with K crossing below D. Volume is up 2.9 times.
════════════════════
🟢 $SNDK 4-hour short signal
⚠️ Technical analysis: ADX at 32 indicates a strong trend. MACD has formed a death cross below zero. Moving averages are bearishly aligned and diverging downward. KDJ is weak, with K crossing below D. Trading volume is up 2 times.
════════════════════
🔔 Follow for first-hand updates on unusual market movements 🔔
#技术分析 #ARM #ZHONGJI #SNDK
📌 When trading, pay attention to whether the candlestick pattern matches
$ARM $ZHONGJI $SNDK 4 hours bearish—don't rush to buy the dip 🔥
════════════════════
🟢 $ARM 4-hour short signal
⚠️ Technical analysis: ADX shows a clear trend. MACD has formed a death cross below zero, with expanding green bars, indicating accelerating bearish momentum. Moving averages are bearishly aligned and diverging downward. KDJ is weak, with K crossing below D. Bears are in control, and trading volume is 2.9 times higher.
════════════════════
🟢 $ZHONGJI 4-hour short signal
⚠️ Technical analysis: ADX at 43 shows a very clear trend. The MACD death cross signals accelerating bearish momentum. Moving averages are bearishly aligned and diverging downward. KDJ is weak, with K crossing below D. Volume is up 2.9 times.
════════════════════
🟢 $SNDK 4-hour short signal
⚠️ Technical analysis: ADX at 32 indicates a strong trend. MACD has formed a death cross below zero. Moving averages are bearishly aligned and diverging downward. KDJ is weak, with K crossing below D. Trading volume is up 2 times.
════════════════════
🔔 Follow for first-hand updates on unusual market movements 🔔
#技术分析 #ARM #ZHONGJI #SNDK
📌 When trading, pay attention to whether the candlestick pattern matches
════════════════════
🟢 $ARM 4-hour short signal
⚠️ Technical analysis: ADX shows a clear trend. MACD has formed a death cross below zero, with expanding green bars, indicating accelerating bearish momentum. Moving averages are bearishly aligned and diverging downward. KDJ is weak, with K crossing below D. Bears are in control, and trading volume is 2.9 times higher.
════════════════════
🟢 $ZHONGJI 4-hour short signal
⚠️ Technical analysis: ADX at 43 shows a very clear trend. The MACD death cross signals accelerating bearish momentum. Moving averages are bearishly aligned and diverging downward. KDJ is weak, with K crossing below D. Volume is up 2.9 times.
════════════════════
🟢 $SNDK 4-hour short signal
⚠️ Technical analysis: ADX at 32 indicates a strong trend. MACD has formed a death cross below zero. Moving averages are bearishly aligned and diverging downward. KDJ is weak, with K crossing below D. Trading volume is up 2 times.
════════════════════
🔔 Follow for first-hand updates on unusual market movements 🔔
#技术分析 #ARM #ZHONGJI #SNDK
📌 When trading, pay attention to whether the candlestick pattern matches
5
·
--
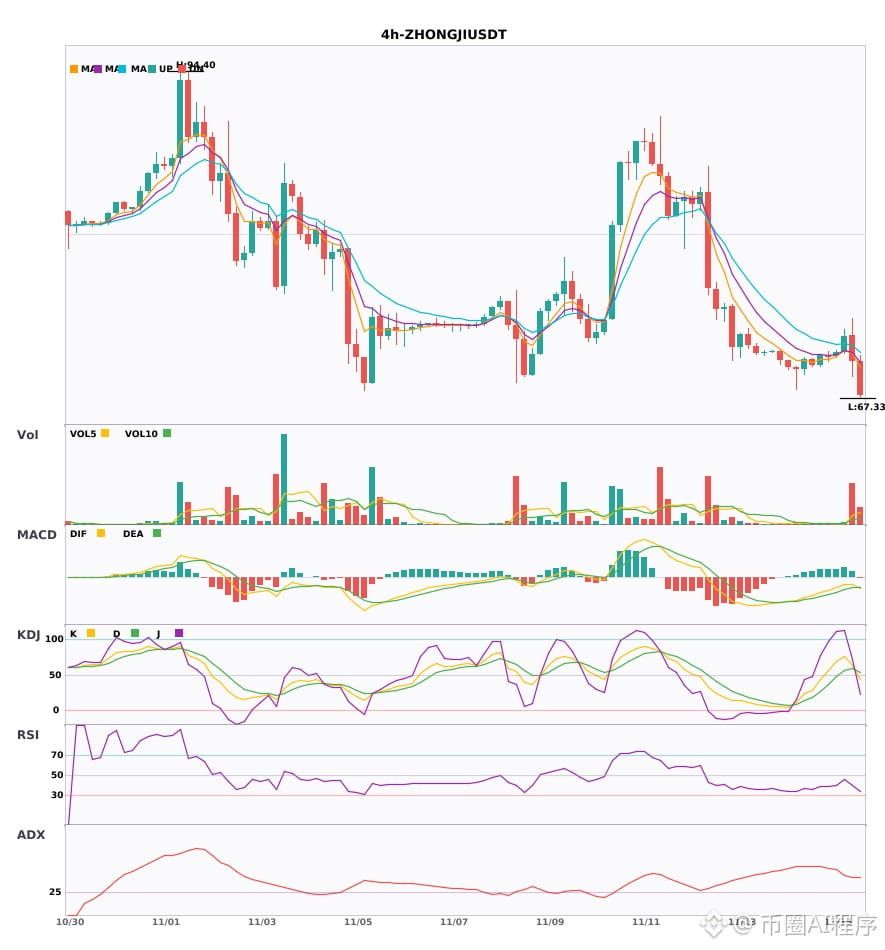
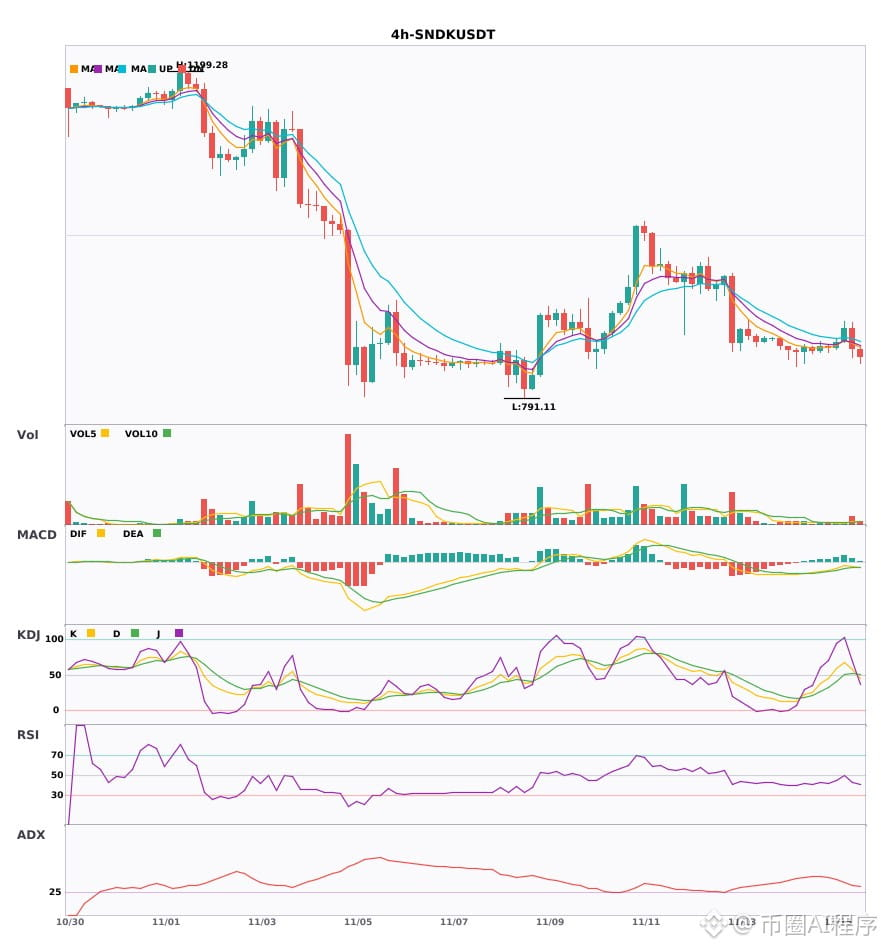
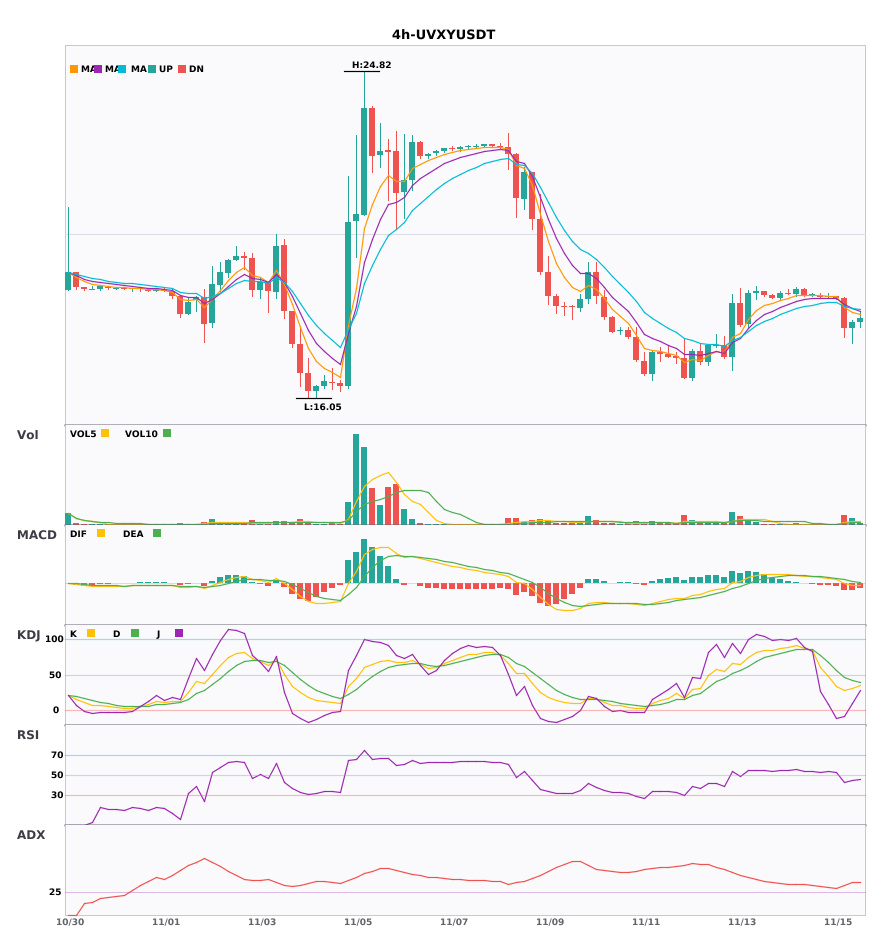
$ZHONGJI $SNDK $UVXY 4-hour and daily charts both weakening; the bearish trend is confirmed 🔥
════════════════════
🟢 $ZHONGJI 4-hour bearish signal
⚠️Technical analysis: 4-hour short entry; EMA5 crosses below EMA8, turning bearish in the short term. Daily + 4-hour bearish confluence confirmed. KDJ K crosses above D but is not overbought; volume surges 7.7x.
════════════════════
🟢 $SNDK 4-hour bearish signal
⚠️Technical analysis: Daily bearish + 4-hour bearish confluence confirmed! On the 4-hour chart, EMA5 crosses below EMA8, with a bearish death cross just forming; KDJ K at 58.1 crosses above D but is not overbought, so short-term consolidation may continue; volume surges 2.9x, with increased volume on the bearish move.
════════════════════
🟢 $UVXY 4-hour bearish signal
⚠️Technical analysis: Multi-timeframe confluence short signal: 4-hour entry + daily bearish confluence confirmed. After the MACD death cross, the green histogram bars continue to expand; moving averages are bearishly aligned and diverging downward. KDJ K crosses below D without entering the oversold zone. Volume is up 6.6x, with ample bearish momentum.
════════════════════
🔔 Follow for first-hand market updates 🔔
#多周期共振 #ZHONGJI #SNDK #UVXY
📌 When trading, pay attention to whether the candlestick pattern meets the criteria
$ZHONGJI $SNDK $UVXY 4-hour and daily charts both weakening; the bearish trend is confirmed 🔥
════════════════════
🟢 $ZHONGJI 4-hour bearish signal
⚠️Technical analysis: 4-hour short entry; EMA5 crosses below EMA8, turning bearish in the short term. Daily + 4-hour bearish confluence confirmed. KDJ K crosses above D but is not overbought; volume surges 7.7x.
════════════════════
🟢 $SNDK 4-hour bearish signal
⚠️Technical analysis: Daily bearish + 4-hour bearish confluence confirmed! On the 4-hour chart, EMA5 crosses below EMA8, with a bearish death cross just forming; KDJ K at 58.1 crosses above D but is not overbought, so short-term consolidation may continue; volume surges 2.9x, with increased volume on the bearish move.
════════════════════
🟢 $UVXY 4-hour bearish signal
⚠️Technical analysis: Multi-timeframe confluence short signal: 4-hour entry + daily bearish confluence confirmed. After the MACD death cross, the green histogram bars continue to expand; moving averages are bearishly aligned and diverging downward. KDJ K crosses below D without entering the oversold zone. Volume is up 6.6x, with ample bearish momentum.
════════════════════
🔔 Follow for first-hand market updates 🔔
#多周期共振 #ZHONGJI #SNDK #UVXY
📌 When trading, pay attention to whether the candlestick pattern meets the criteria
════════════════════
🟢 $ZHONGJI 4-hour bearish signal
⚠️Technical analysis: 4-hour short entry; EMA5 crosses below EMA8, turning bearish in the short term. Daily + 4-hour bearish confluence confirmed. KDJ K crosses above D but is not overbought; volume surges 7.7x.
════════════════════
🟢 $SNDK 4-hour bearish signal
⚠️Technical analysis: Daily bearish + 4-hour bearish confluence confirmed! On the 4-hour chart, EMA5 crosses below EMA8, with a bearish death cross just forming; KDJ K at 58.1 crosses above D but is not overbought, so short-term consolidation may continue; volume surges 2.9x, with increased volume on the bearish move.
════════════════════
🟢 $UVXY 4-hour bearish signal
⚠️Technical analysis: Multi-timeframe confluence short signal: 4-hour entry + daily bearish confluence confirmed. After the MACD death cross, the green histogram bars continue to expand; moving averages are bearishly aligned and diverging downward. KDJ K crosses below D without entering the oversold zone. Volume is up 6.6x, with ample bearish momentum.
════════════════════
🔔 Follow for first-hand market updates 🔔
#多周期共振 #ZHONGJI #SNDK #UVXY
📌 When trading, pay attention to whether the candlestick pattern meets the criteria
28

·
--
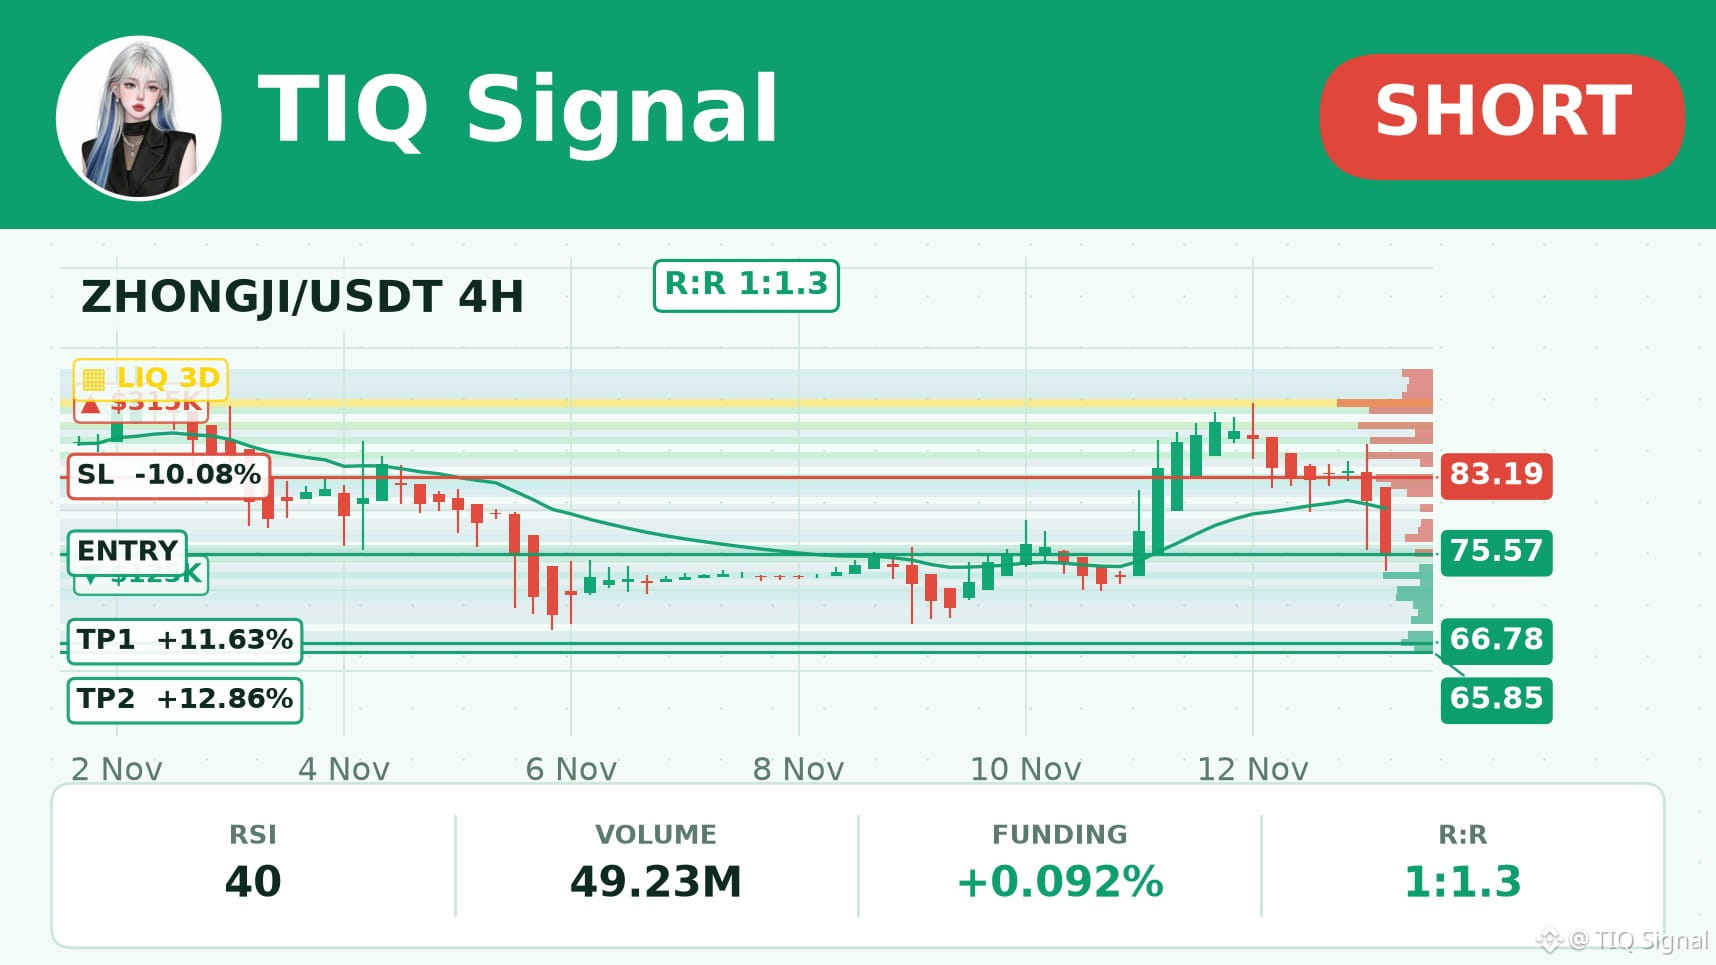
Coffee in one hand, $ZHONGJI chart in the other ☕📊
Momentum leaning bearish on the 4H. Funding +0.092%, 68% of accounts long (L/S 2.09), OI -34.2% (1d).
Short: 76.44 - 74.69
TP: 66.78 - 65.85 - 60.33
SL: 83.19 (risk ~10.1%)
#ZHONGJI
⚠️ This signal is based on technical indicators and is not investment advice. Always set a stop-loss and manage your own risk.
Coffee in one hand, $ZHONGJI chart in the other ☕📊
Momentum leaning bearish on the 4H. Funding +0.092%, 68% of accounts long (L/S 2.09), OI -34.2% (1d).
Short: 76.44 - 74.69
TP: 66.78 - 65.85 - 60.33
SL: 83.19 (risk ~10.1%)
#ZHONGJI
⚠️ This signal is based on technical indicators and is not investment advice. Always set a stop-loss and manage your own risk.
Momentum leaning bearish on the 4H. Funding +0.092%, 68% of accounts long (L/S 2.09), OI -34.2% (1d).
Short: 76.44 - 74.69
TP: 66.78 - 65.85 - 60.33
SL: 83.19 (risk ~10.1%)
#ZHONGJI
⚠️ This signal is based on technical indicators and is not investment advice. Always set a stop-loss and manage your own risk.
7

·
--
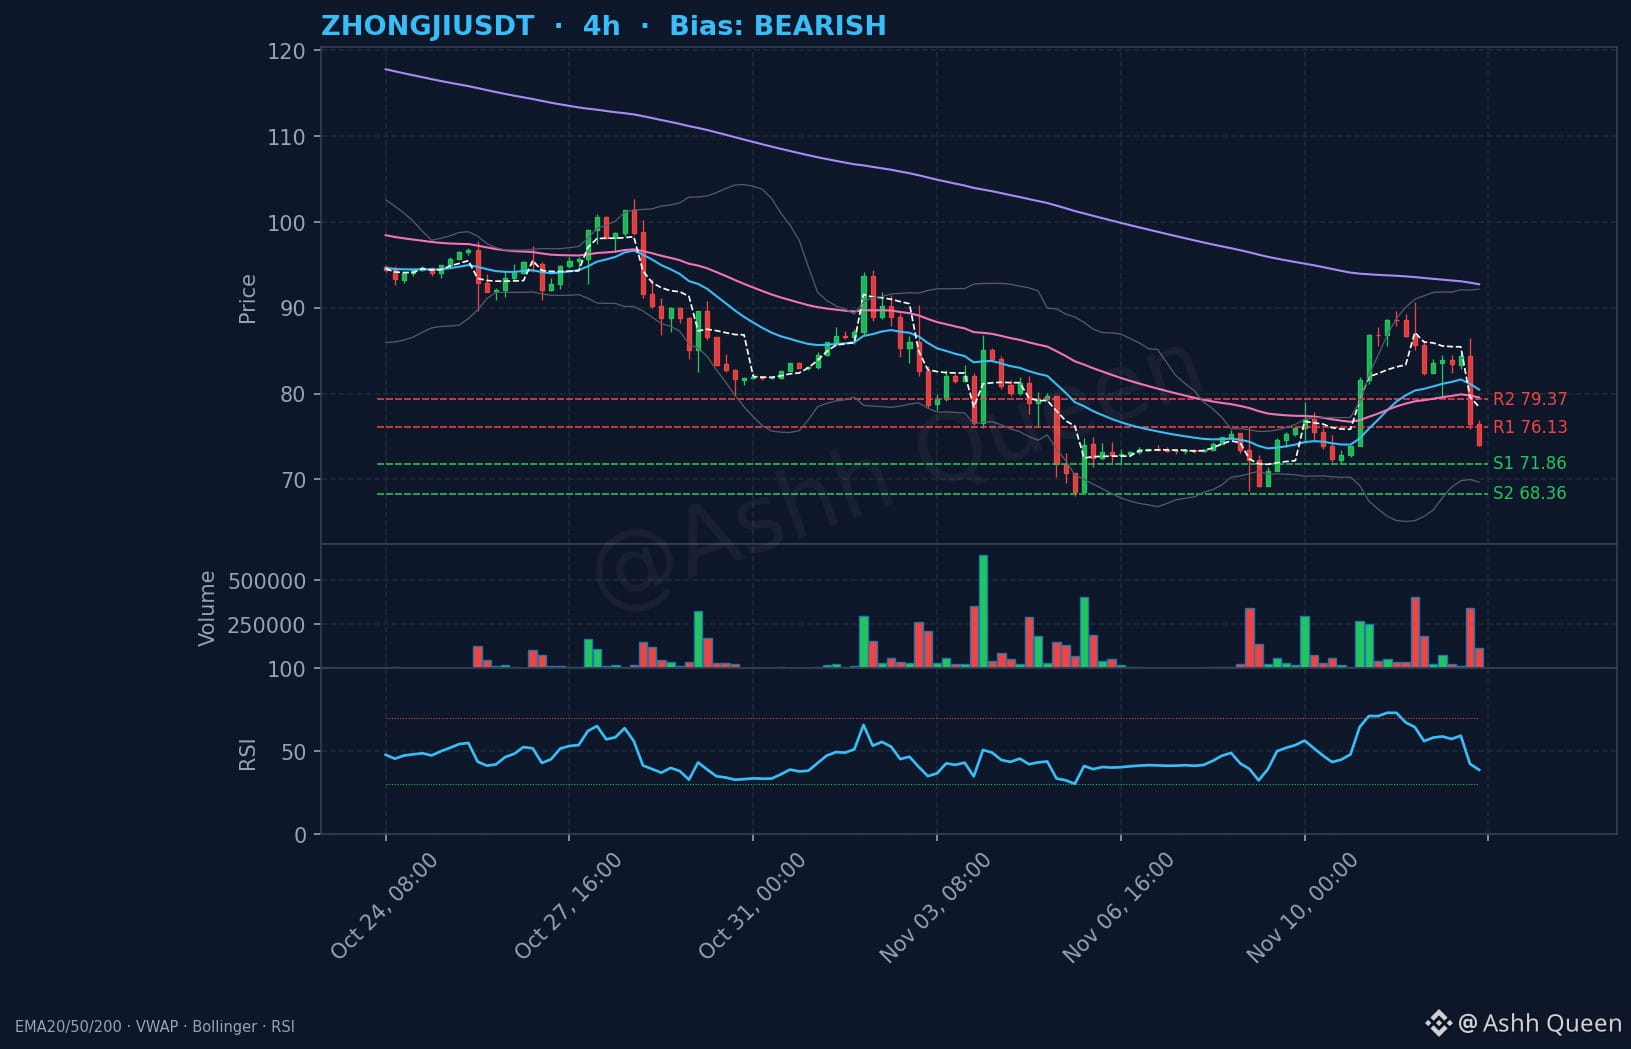
⚠️ Watch this critical level on $ZHONGJI closely.
The ZHONGJIUSDT perpetual contract is currently trading at 74.01, well below the VWAP at 78.44 and the EMA50 at 79.54. 📉
If resistance at 76.13 fails to hold as a floor, support at 71.86 becomes the next target for the bears. If momentum stays weak with the RSI at 38.76, the lower Bollinger Band at 69.69 might attract attention. ⚠️
Always prioritize capital protection over potential gains. 🎯
Do you believe this trend is exhaustion or the start of a deeper slide?
#ZHONGJI #BinanceSquare #MarketUpdate #Trading
⚠️ Perpetual contracts are leveraged derivatives, not the stock or commodity itself.
Security tip: only log in through the official Binance app or website, and ignore DMs offering 'support'.
⚠️ Watch this critical level on $ZHONGJI closely.
The ZHONGJIUSDT perpetual contract is currently trading at 74.01, well below the VWAP at 78.44 and the EMA50 at 79.54. 📉
If resistance at 76.13 fails to hold as a floor, support at 71.86 becomes the next target for the bears. If momentum stays weak with the RSI at 38.76, the lower Bollinger Band at 69.69 might attract attention. ⚠️
Always prioritize capital protection over potential gains. 🎯
Do you believe this trend is exhaustion or the start of a deeper slide?
#ZHONGJI #BinanceSquare #MarketUpdate #Trading
⚠️ Perpetual contracts are leveraged derivatives, not the stock or commodity itself.
Security tip: only log in through the official Binance app or website, and ignore DMs offering 'support'.
The ZHONGJIUSDT perpetual contract is currently trading at 74.01, well below the VWAP at 78.44 and the EMA50 at 79.54. 📉
If resistance at 76.13 fails to hold as a floor, support at 71.86 becomes the next target for the bears. If momentum stays weak with the RSI at 38.76, the lower Bollinger Band at 69.69 might attract attention. ⚠️
Always prioritize capital protection over potential gains. 🎯
Do you believe this trend is exhaustion or the start of a deeper slide?
#ZHONGJI #BinanceSquare #MarketUpdate #Trading
⚠️ Perpetual contracts are leveraged derivatives, not the stock or commodity itself.
Security tip: only log in through the official Binance app or website, and ignore DMs offering 'support'.
1
555

·
--
Bearish
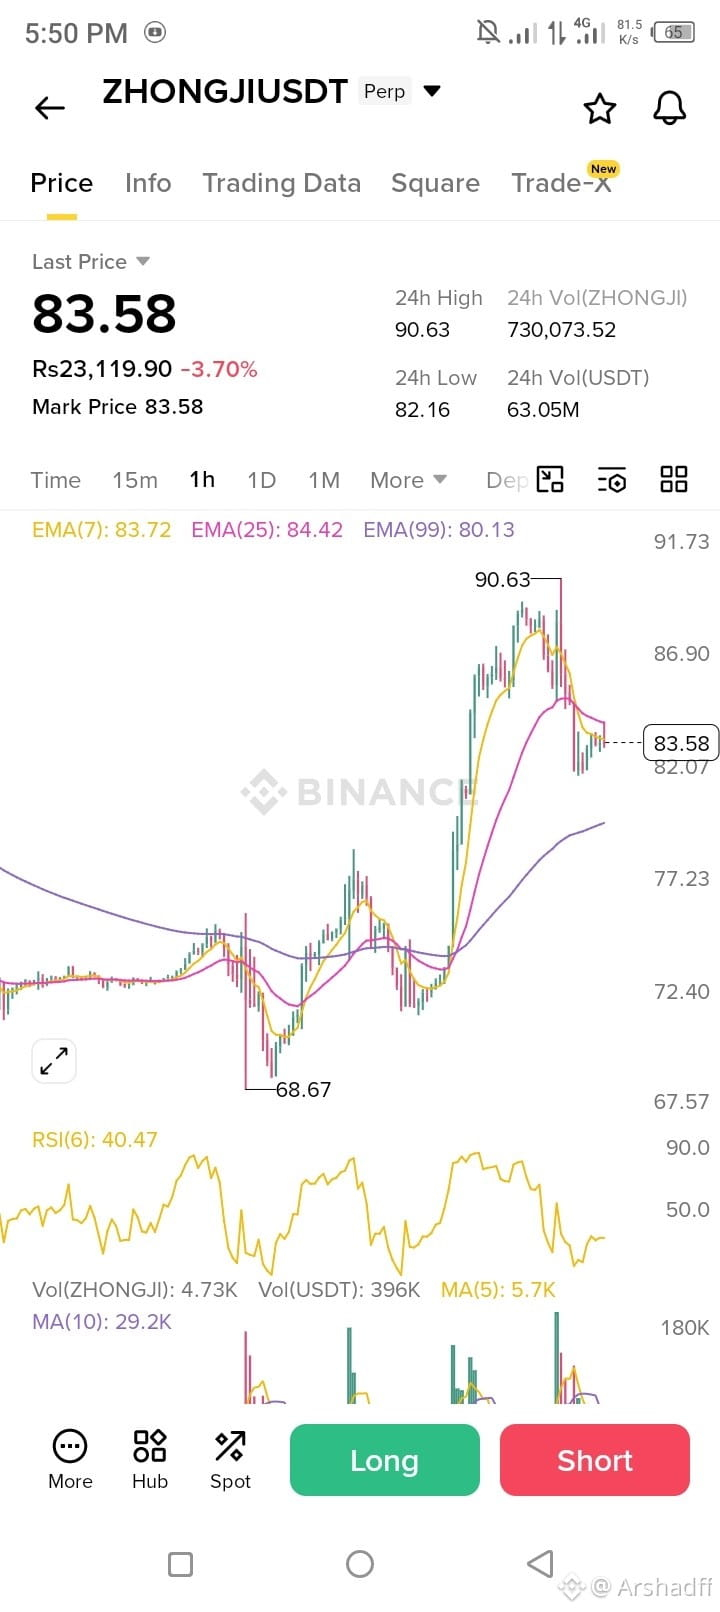
⚠️ $ZHONGJI Short trade signal
$ZHONGJI After +31% PUMP — Now CORRECTION to $83.58 -3.70%
From $68.67 to $90.63 — Now dumping!
Price $83.58 — Below EMA7 $83.72 — Bearish
RSI 40.47 — Falling from 42 — More downside
24h Low $82.16 — Next support $80.13 EMA99
Plan:
SHORT $83.58 — SL $84.60
TP1 $82.16 Low — TP2 $80.13 EMA99 — RR 4:1
LONG only at $80.13 EMA99 — Bounce +4.5% to $83.75
High risk — Low cap — Trade safe!
$ZHONGJI
#Zhongji
{future}(ZHONGJIUSDT)
⚠️ $ZHONGJI Short trade signal
$ZHONGJI After +31% PUMP — Now CORRECTION to $83.58 -3.70%
From $68.67 to $90.63 — Now dumping!
Price $83.58 — Below EMA7 $83.72 — Bearish
RSI 40.47 — Falling from 42 — More downside
24h Low $82.16 — Next support $80.13 EMA99
Plan:
SHORT $83.58 — SL $84.60
TP1 $82.16 Low — TP2 $80.13 EMA99 — RR 4:1
LONG only at $80.13 EMA99 — Bounce +4.5% to $83.75
High risk — Low cap — Trade safe!
$ZHONGJI
#Zhongji
$ZHONGJI After +31% PUMP — Now CORRECTION to $83.58 -3.70%
From $68.67 to $90.63 — Now dumping!
Price $83.58 — Below EMA7 $83.72 — Bearish
RSI 40.47 — Falling from 42 — More downside
24h Low $82.16 — Next support $80.13 EMA99
Plan:
SHORT $83.58 — SL $84.60
TP1 $82.16 Low — TP2 $80.13 EMA99 — RR 4:1
LONG only at $80.13 EMA99 — Bounce +4.5% to $83.75
High risk — Low cap — Trade safe!
$ZHONGJI
#Zhongji
1
907
·
--
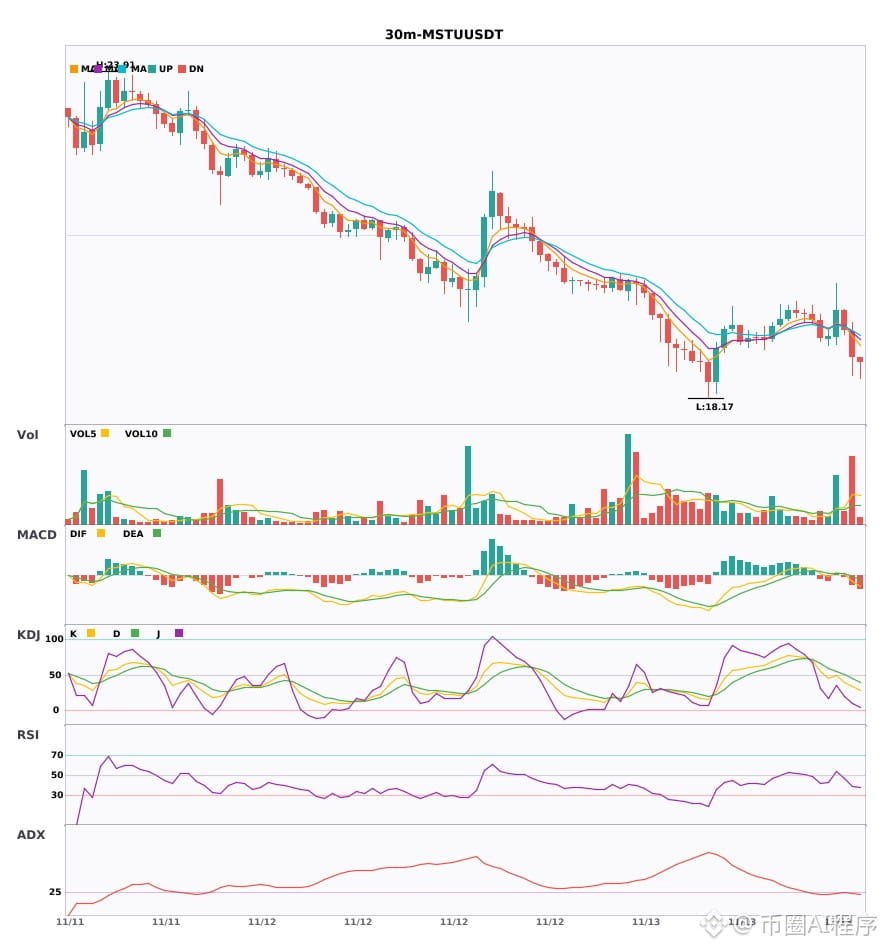
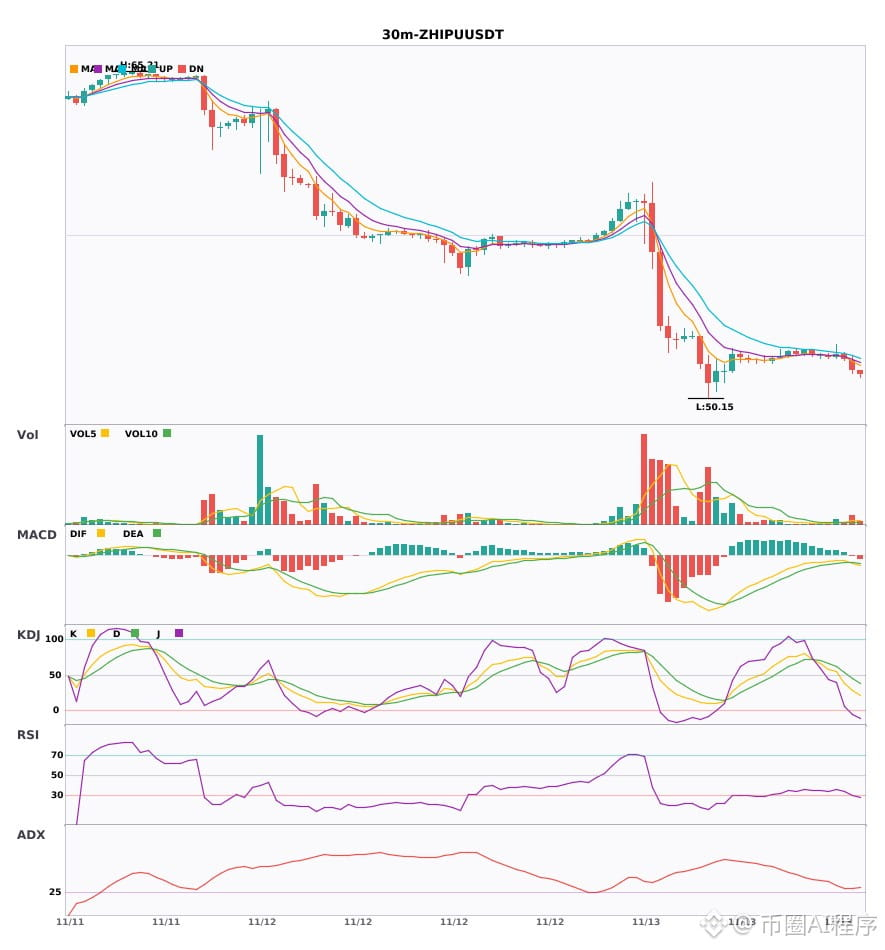
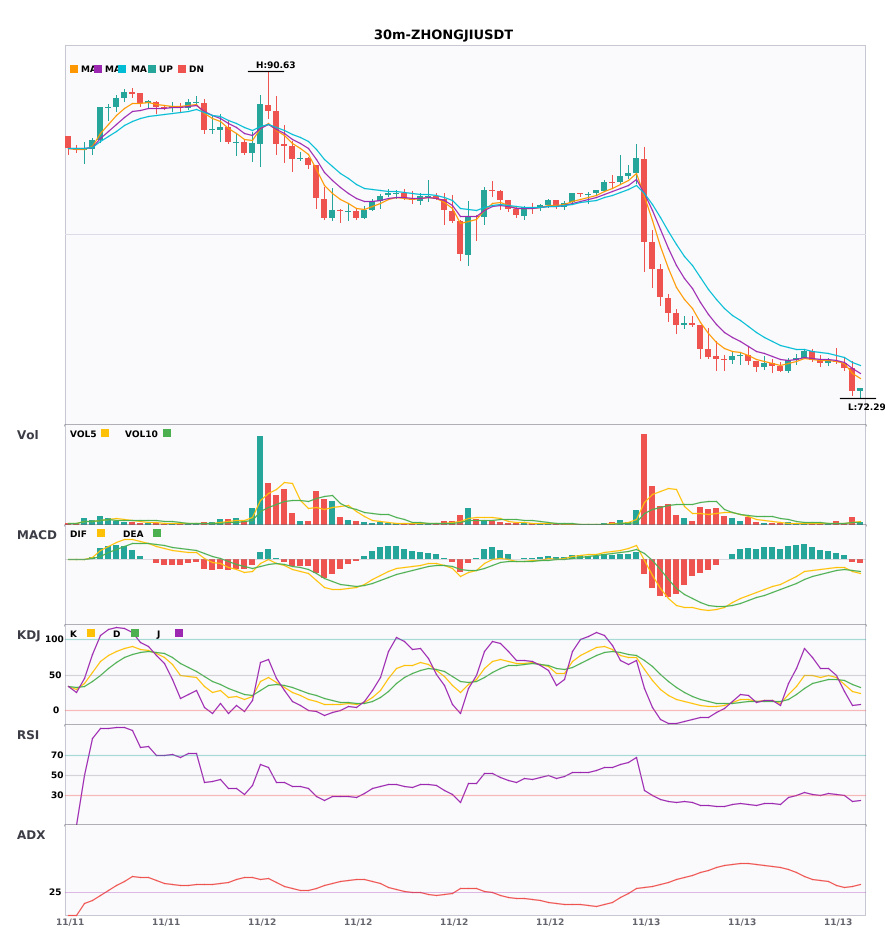
$MSTU / $ZHIPU / $ZHONGJI 30-minute short signals are here, 4-hour bearish confirmation 🔥
════════════════════
🟢 $MSTU 30-minute short signal
⚠️Technical analysis: Bearish multi-timeframe confluence! 4-hour bearish confluence confirmed; on the 30-minute chart, MACD has fallen below the zero line, moving averages have made a bearish crossover, KDJ is trending weakly, and selling volume is 3.4x higher.
════════════════════
🟢 $ZHIPU 30-minute short signal
⚠️Technical analysis: 4-hour + 30-minute bearish confluence confirmed: MACD bearish crossover, with green bars continuing to expand; moving averages are bearishly aligned and diverging downward; KDJ is weak, with K below D; trading volume is 3.2x higher. Bears are in control.
════════════════════
🟢 $ZHONGJI 30-minute short signal
⚠️Technical analysis: 4-hour bearish trend + 30-minute confluence confirmed; MACD bearish crossover, with green bars expanding on increased volume; moving averages are bearishly aligned and diverging downward; KDJ is weak, with K crossing below D and not yet oversold; trading volume has surged 3x.
════════════════════
🔔 Follow for the latest market movements 🔔
#多周期共振 #MSTU #ZHIPU #ZHONGJI
📌 When trading, watch for whether the candlestick pattern confirms the signal
$MSTU / $ZHIPU / $ZHONGJI 30-minute short signals are here, 4-hour bearish confirmation 🔥
════════════════════
🟢 $MSTU 30-minute short signal
⚠️Technical analysis: Bearish multi-timeframe confluence! 4-hour bearish confluence confirmed; on the 30-minute chart, MACD has fallen below the zero line, moving averages have made a bearish crossover, KDJ is trending weakly, and selling volume is 3.4x higher.
════════════════════
🟢 $ZHIPU 30-minute short signal
⚠️Technical analysis: 4-hour + 30-minute bearish confluence confirmed: MACD bearish crossover, with green bars continuing to expand; moving averages are bearishly aligned and diverging downward; KDJ is weak, with K below D; trading volume is 3.2x higher. Bears are in control.
════════════════════
🟢 $ZHONGJI 30-minute short signal
⚠️Technical analysis: 4-hour bearish trend + 30-minute confluence confirmed; MACD bearish crossover, with green bars expanding on increased volume; moving averages are bearishly aligned and diverging downward; KDJ is weak, with K crossing below D and not yet oversold; trading volume has surged 3x.
════════════════════
🔔 Follow for the latest market movements 🔔
#多周期共振 #MSTU #ZHIPU #ZHONGJI
📌 When trading, watch for whether the candlestick pattern confirms the signal
════════════════════
🟢 $MSTU 30-minute short signal
⚠️Technical analysis: Bearish multi-timeframe confluence! 4-hour bearish confluence confirmed; on the 30-minute chart, MACD has fallen below the zero line, moving averages have made a bearish crossover, KDJ is trending weakly, and selling volume is 3.4x higher.
════════════════════
🟢 $ZHIPU 30-minute short signal
⚠️Technical analysis: 4-hour + 30-minute bearish confluence confirmed: MACD bearish crossover, with green bars continuing to expand; moving averages are bearishly aligned and diverging downward; KDJ is weak, with K below D; trading volume is 3.2x higher. Bears are in control.
════════════════════
🟢 $ZHONGJI 30-minute short signal
⚠️Technical analysis: 4-hour bearish trend + 30-minute confluence confirmed; MACD bearish crossover, with green bars expanding on increased volume; moving averages are bearishly aligned and diverging downward; KDJ is weak, with K crossing below D and not yet oversold; trading volume has surged 3x.
════════════════════
🔔 Follow for the latest market movements 🔔
#多周期共振 #MSTU #ZHIPU #ZHONGJI
📌 When trading, watch for whether the candlestick pattern confirms the signal
47
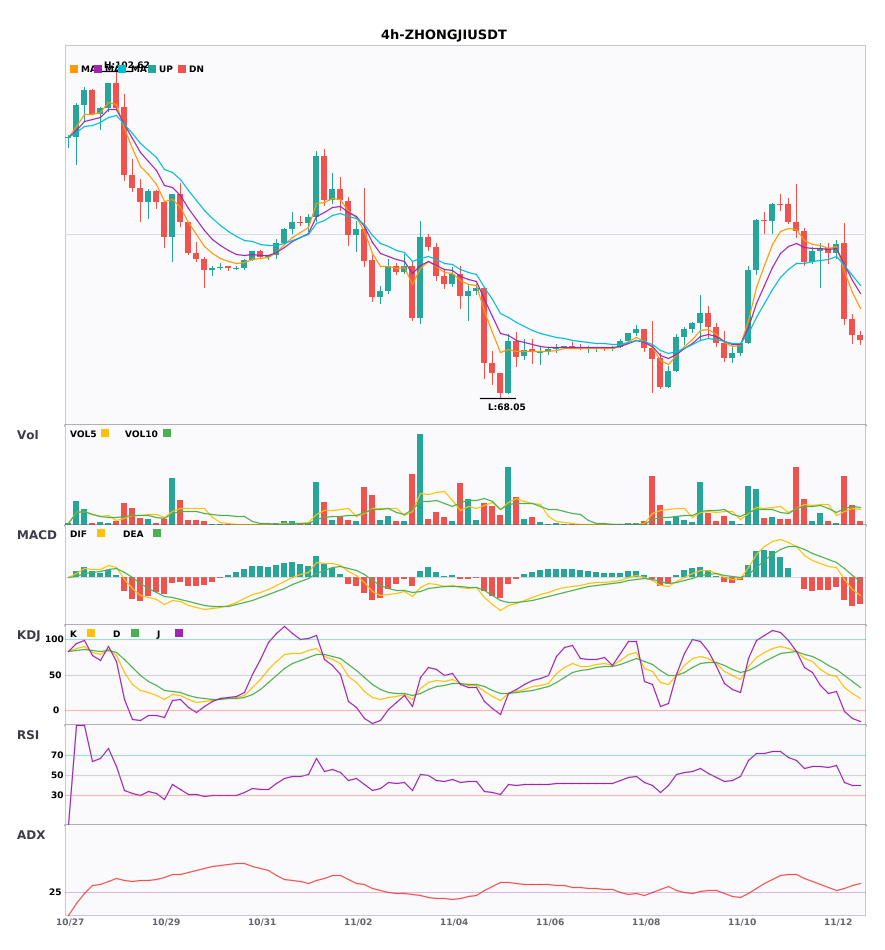
$ZHONGJI 4-hour momentum fading; technical indicators weakening, risk alert
📉 $ZHONGJI | 4-hour bearish signal
━━━━━━━━━━━━━━━━━━
Technical analysis: ADX(35) indicates a pronounced trend; MACD remains bearish, with strengthening momentum; EMA5<EMA8<EMA13 are in bearish alignment; KDJ is weak, with K at 23.5 and D at 40.9, favoring the bears; trading volume increased 2.9-fold.
Price change: -2.2500%
━━━━━━━━━━━━━━━━━━
#技术分析 #ZHONGJI
📌 The above content is for reference only and does not constitute investment advice
$ZHONGJI 4-hour momentum fading; technical indicators weakening, risk alert
📉 $ZHONGJI | 4-hour bearish signal
━━━━━━━━━━━━━━━━━━
Technical analysis: ADX(35) indicates a pronounced trend; MACD remains bearish, with strengthening momentum; EMA5<EMA8<EMA13 are in bearish alignment; KDJ is weak, with K at 23.5 and D at 40.9, favoring the bears; trading volume increased 2.9-fold.
Price change: -2.2500%
━━━━━━━━━━━━━━━━━━
#技术分析 #ZHONGJI
📌 The above content is for reference only and does not constitute investment advice
📉 $ZHONGJI | 4-hour bearish signal
━━━━━━━━━━━━━━━━━━
Technical analysis: ADX(35) indicates a pronounced trend; MACD remains bearish, with strengthening momentum; EMA5<EMA8<EMA13 are in bearish alignment; KDJ is weak, with K at 23.5 and D at 40.9, favoring the bears; trading volume increased 2.9-fold.
Price change: -2.2500%
━━━━━━━━━━━━━━━━━━
#技术分析 #ZHONGJI
📌 The above content is for reference only and does not constitute investment advice
17
·
--
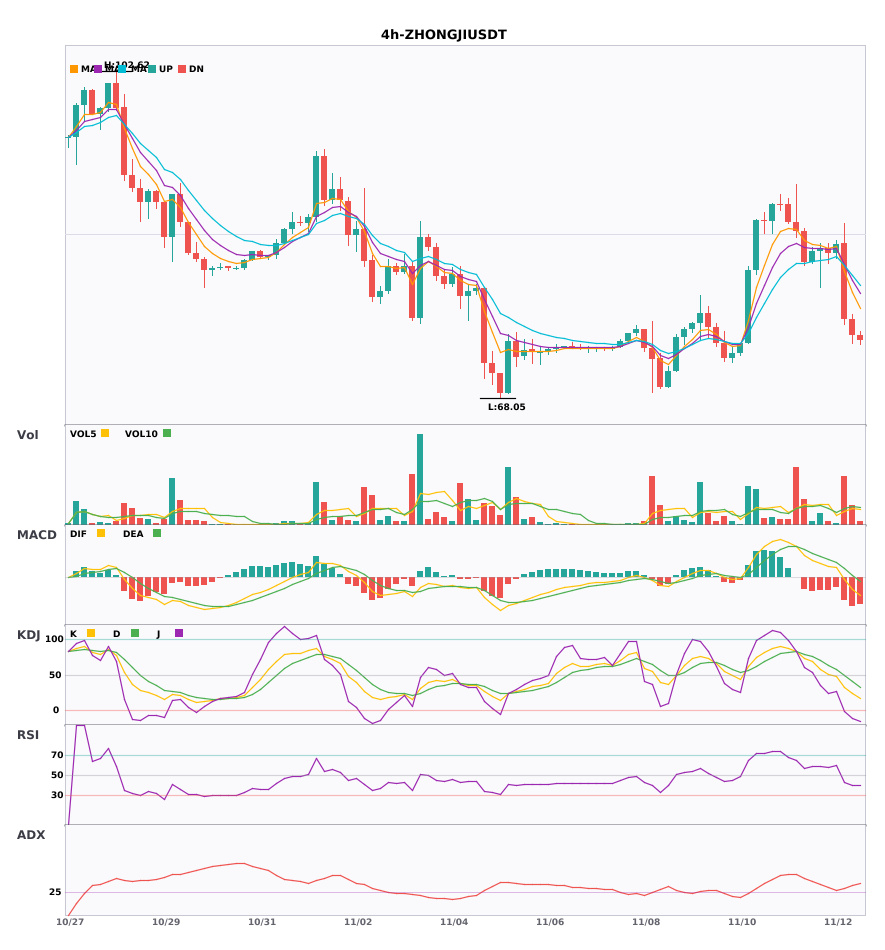
The $ZHONGJI 4-hour indicator is weakening; beware of pullback risk 🔥
════════════════════
🟢 $ZHONGJI 4-hour bearish signal
⚠️ Technical analysis: The trend is clear, with MACD showing bearish momentum. The green bars are still lengthening, and the moving averages have just formed a bearish alignment and are heading down. K has not crossed above D on the KDJ, so bears have the advantage. Trading volume is up 2.9 times.
════════════════════
🔔 Follow us for the latest market movements 🔔
#技术分析 #ZHONGJI
📌 When trading, pay attention to whether the candlestick pattern is consistent
The $ZHONGJI 4-hour indicator is weakening; beware of pullback risk 🔥
════════════════════
🟢 $ZHONGJI 4-hour bearish signal
⚠️ Technical analysis: The trend is clear, with MACD showing bearish momentum. The green bars are still lengthening, and the moving averages have just formed a bearish alignment and are heading down. K has not crossed above D on the KDJ, so bears have the advantage. Trading volume is up 2.9 times.
════════════════════
🔔 Follow us for the latest market movements 🔔
#技术分析 #ZHONGJI
📌 When trading, pay attention to whether the candlestick pattern is consistent
════════════════════
🟢 $ZHONGJI 4-hour bearish signal
⚠️ Technical analysis: The trend is clear, with MACD showing bearish momentum. The green bars are still lengthening, and the moving averages have just formed a bearish alignment and are heading down. K has not crossed above D on the KDJ, so bears have the advantage. Trading volume is up 2.9 times.
════════════════════
🔔 Follow us for the latest market movements 🔔
#技术分析 #ZHONGJI
📌 When trading, pay attention to whether the candlestick pattern is consistent
15
·
--
🚀 $ZHONGJI LONG 🚀
Entry: 88.5834 – 89.1165
SL: 86.7580
TP1: 90.6431
TP2: 91.8386
TP3: 93.3329
📈 Technical Outlook:
$ZHONGJI is showing strong bullish momentum after confirming strength near a key technical zone. The setup is supported by EMA trend is bullish, RSI supports bullish momentum, volume is expanding. As long as price holds above the entry area, buyers may continue pushing toward the listed targets.
#ZHONGJI #Crypto #BinanceSquare #Trading
🚀 $ZHONGJI LONG 🚀
Entry: 88.5834 – 89.1165
SL: 86.7580
TP1: 90.6431
TP2: 91.8386
TP3: 93.3329
📈 Technical Outlook:
$ZHONGJI is showing strong bullish momentum after confirming strength near a key technical zone. The setup is supported by EMA trend is bullish, RSI supports bullish momentum, volume is expanding. As long as price holds above the entry area, buyers may continue pushing toward the listed targets.
#ZHONGJI #Crypto #BinanceSquare #Trading
Entry: 88.5834 – 89.1165
SL: 86.7580
TP1: 90.6431
TP2: 91.8386
TP3: 93.3329
📈 Technical Outlook:
$ZHONGJI is showing strong bullish momentum after confirming strength near a key technical zone. The setup is supported by EMA trend is bullish, RSI supports bullish momentum, volume is expanding. As long as price holds above the entry area, buyers may continue pushing toward the listed targets.
#ZHONGJI #Crypto #BinanceSquare #Trading

3
·
--
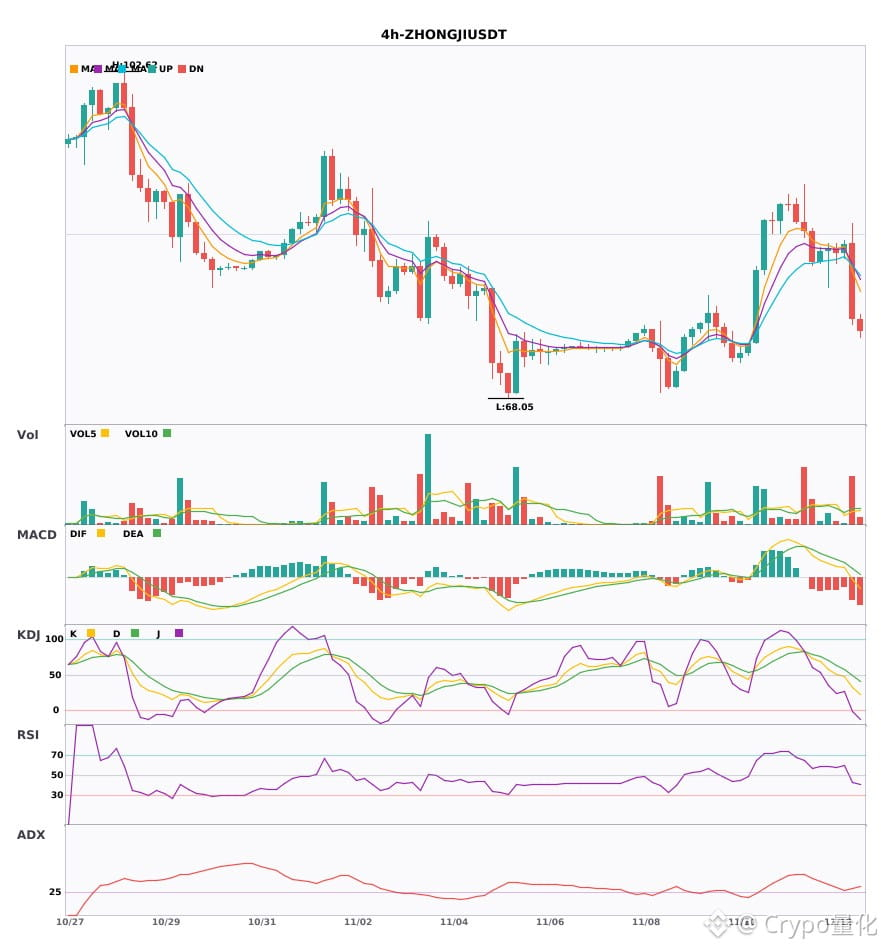
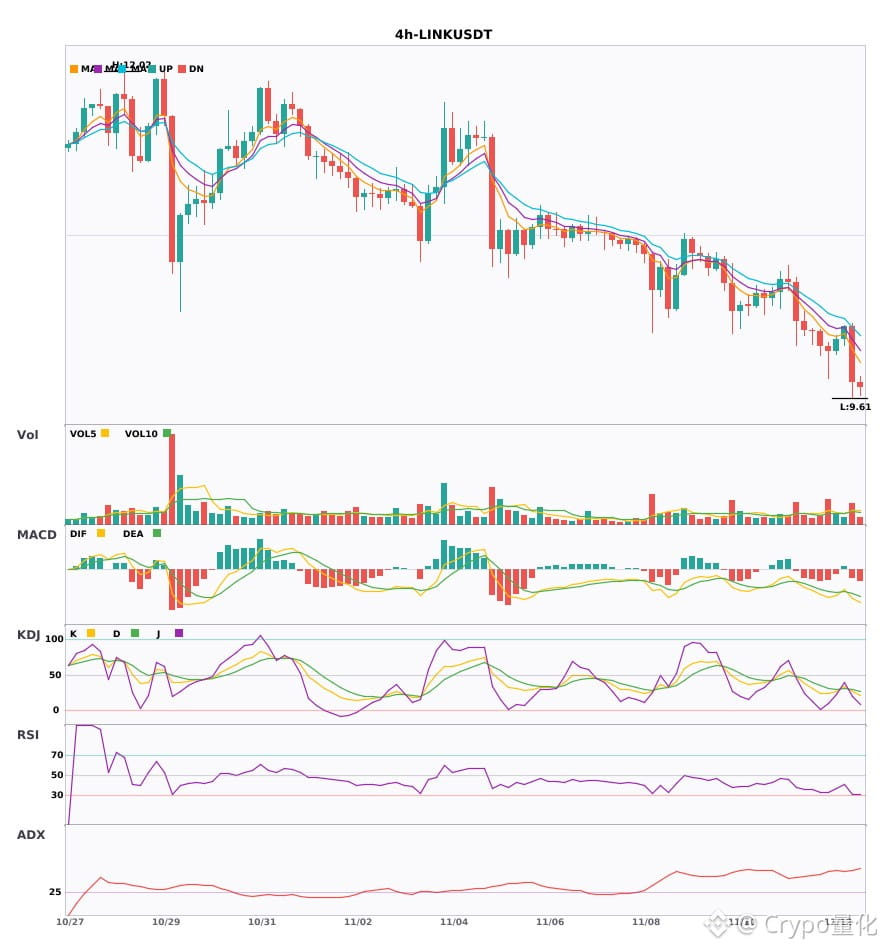
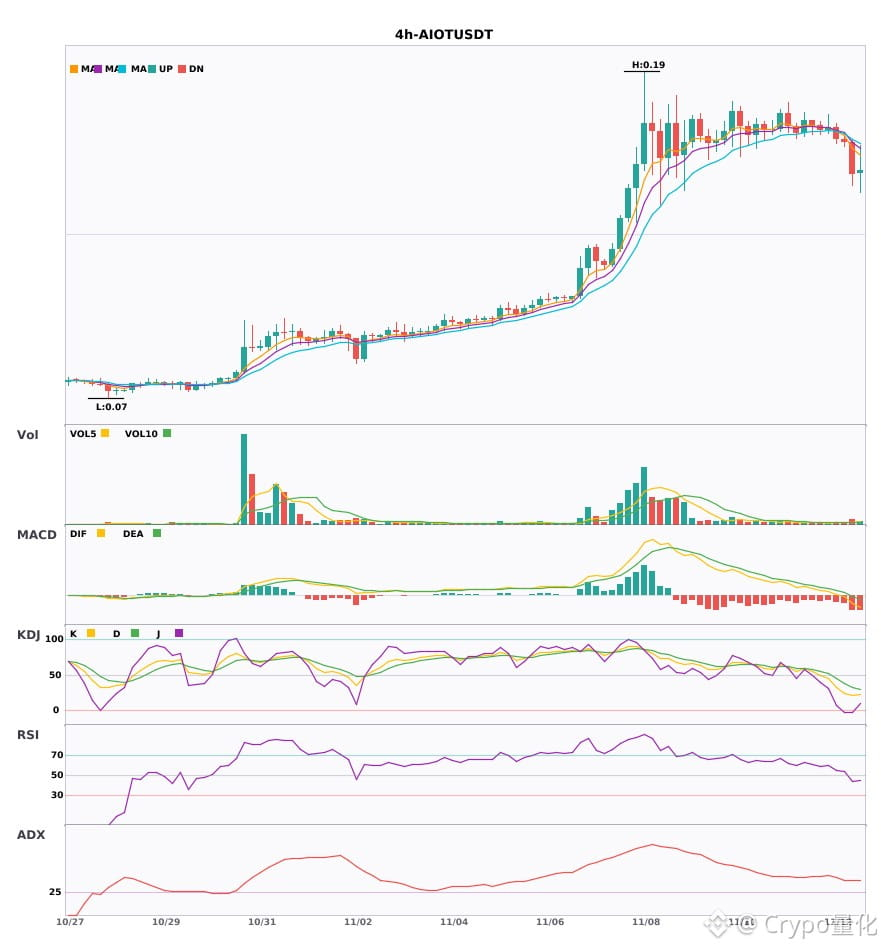
$ZHONGJI/$LINK/$AIOT 4 hours have all turned bearish🔥
════════════════════
🟢 $ZHONGJI 4-hour bearish signal
⚠️Technical analysis: ADX is at 32, indicating a fairly clear trend. MACD has formed a death cross below the zero line, and EMA5 has just crossed below EMA8, signaling short-term weakness. KDJ also shows K below D, with bears in control. Trading volume has surged to nearly 3 times its usual level.
════════════════════
🟢 $LINK 4-hour bearish signal
⚠️Technical analysis: ADX (50) indicates a very strong trend, but beware of a pullback | MACD death cross below zero, bearish momentum accelerating | Moving averages aligned bearishly | KDJ death cross signals bearishness (K26.6 D29.7) | Trading volume up 1.6x
════════════════════
🟢 $AIOT 4-hour bearish signal
⚠️Technical analysis: Clear ADX trend; after the MACD death cross, the green bars are growing. Moving averages are bearishly aligned and diverging. KDJ is weak, with K below D. Trading volume up 2.1x
════════════════════
🔔 Follow for real-time market alerts 🔔
#技术分析 #ZHONGJI #LINK #AIOT
📌 When trading, pay attention to whether the candlestick patterns confirm the signal
$ZHONGJI /$LINK /$AIOT 4 hours have all turned bearish🔥
════════════════════
🟢 $ZHONGJI 4-hour bearish signal
⚠️Technical analysis: ADX is at 32, indicating a fairly clear trend. MACD has formed a death cross below the zero line, and EMA5 has just crossed below EMA8, signaling short-term weakness. KDJ also shows K below D, with bears in control. Trading volume has surged to nearly 3 times its usual level.
════════════════════
🟢 $LINK 4-hour bearish signal
⚠️Technical analysis: ADX (50) indicates a very strong trend, but beware of a pullback | MACD death cross below zero, bearish momentum accelerating | Moving averages aligned bearishly | KDJ death cross signals bearishness (K26.6 D29.7) | Trading volume up 1.6x
════════════════════
🟢 $AIOT 4-hour bearish signal
⚠️Technical analysis: Clear ADX trend; after the MACD death cross, the green bars are growing. Moving averages are bearishly aligned and diverging. KDJ is weak, with K below D. Trading volume up 2.1x
════════════════════
🔔 Follow for real-time market alerts 🔔
#技术分析 #ZHONGJI #LINK #AIOT
📌 When trading, pay attention to whether the candlestick patterns confirm the signal
════════════════════
🟢 $ZHONGJI 4-hour bearish signal
⚠️Technical analysis: ADX is at 32, indicating a fairly clear trend. MACD has formed a death cross below the zero line, and EMA5 has just crossed below EMA8, signaling short-term weakness. KDJ also shows K below D, with bears in control. Trading volume has surged to nearly 3 times its usual level.
════════════════════
🟢 $LINK 4-hour bearish signal
⚠️Technical analysis: ADX (50) indicates a very strong trend, but beware of a pullback | MACD death cross below zero, bearish momentum accelerating | Moving averages aligned bearishly | KDJ death cross signals bearishness (K26.6 D29.7) | Trading volume up 1.6x
════════════════════
🟢 $AIOT 4-hour bearish signal
⚠️Technical analysis: Clear ADX trend; after the MACD death cross, the green bars are growing. Moving averages are bearishly aligned and diverging. KDJ is weak, with K below D. Trading volume up 2.1x
════════════════════
🔔 Follow for real-time market alerts 🔔
#技术分析 #ZHONGJI #LINK #AIOT
📌 When trading, pay attention to whether the candlestick patterns confirm the signal
19
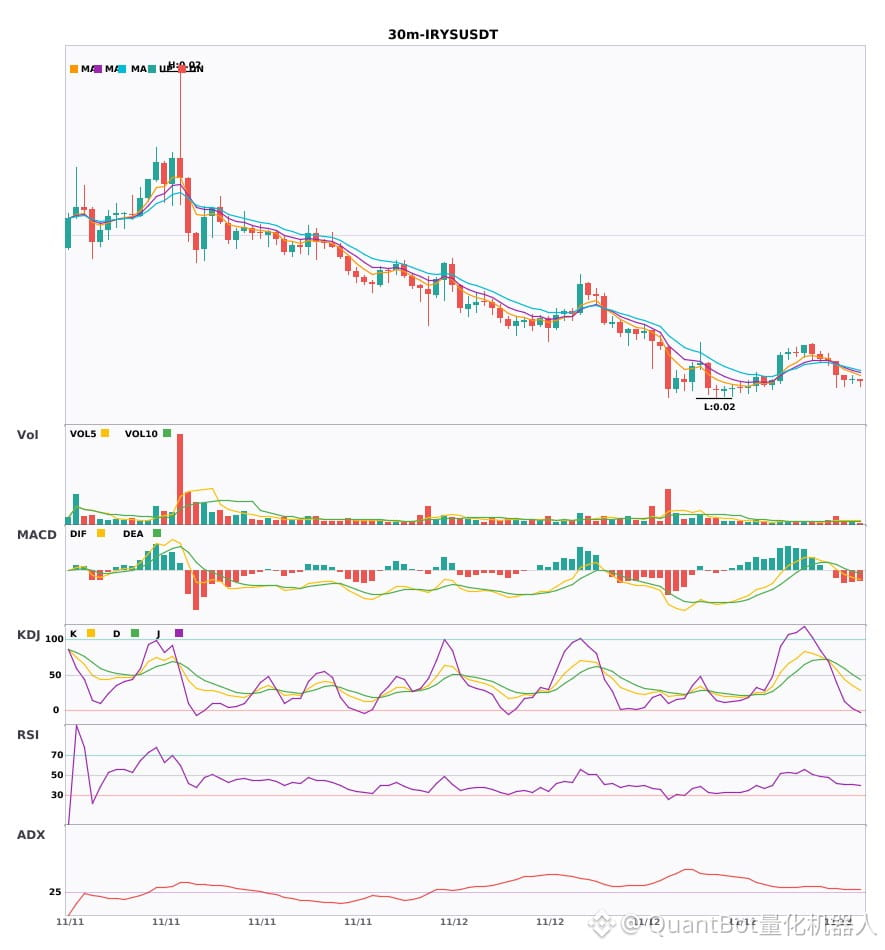
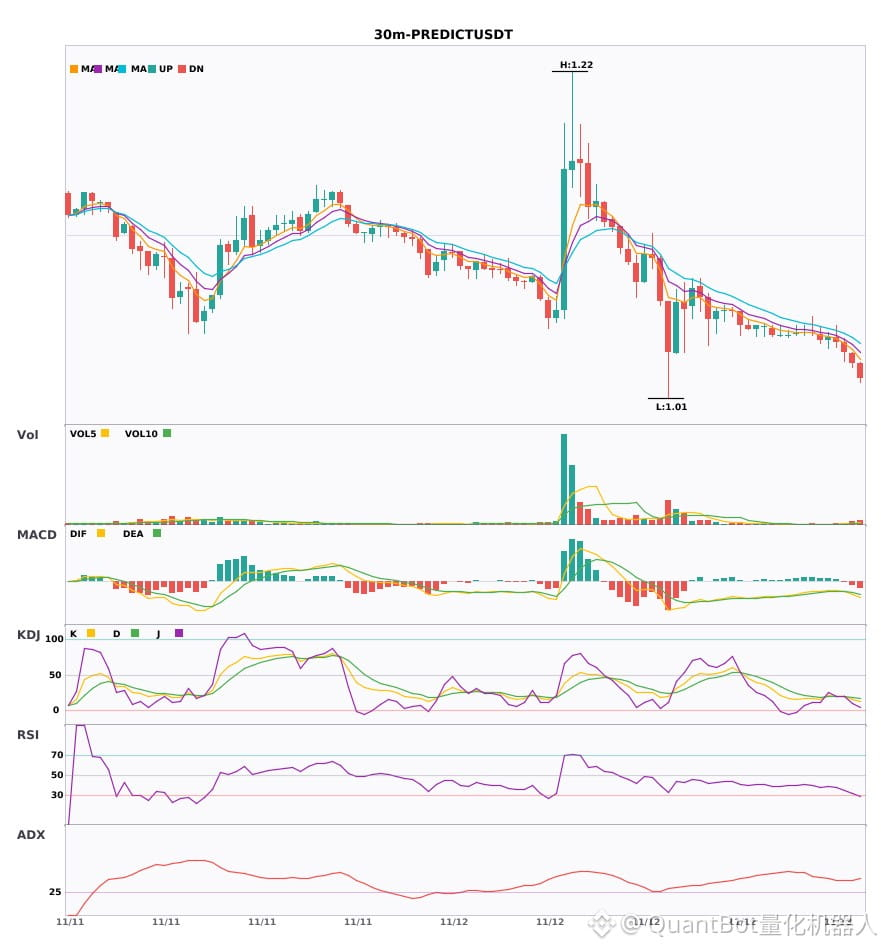
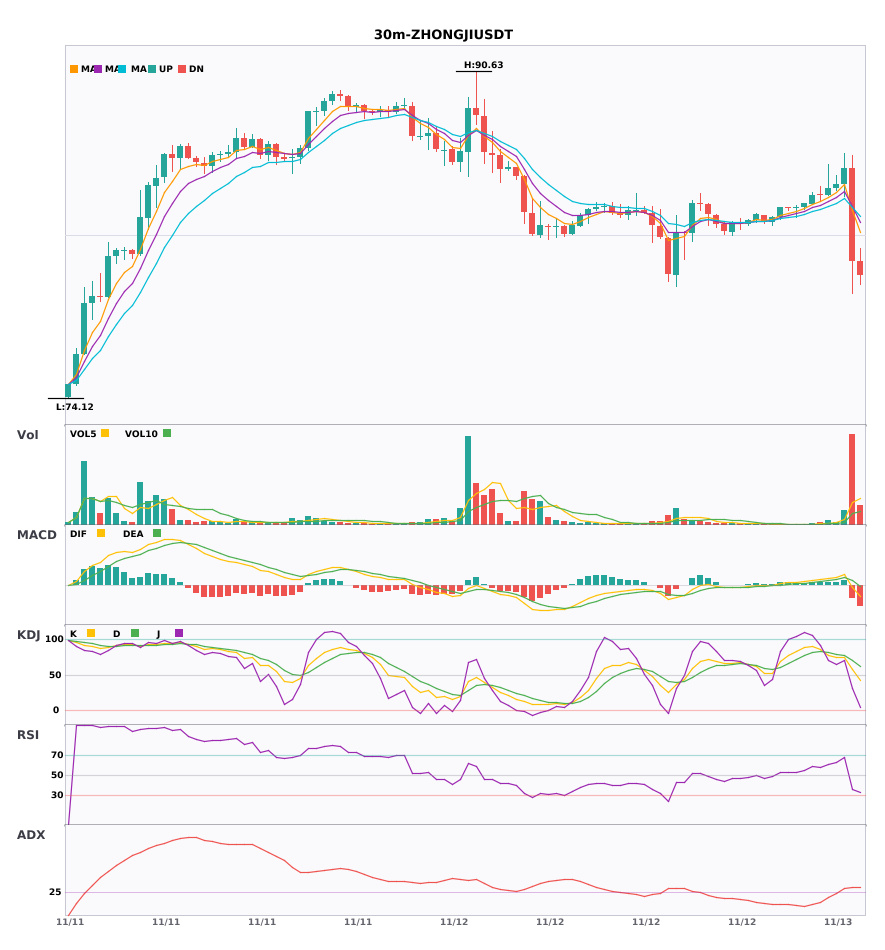
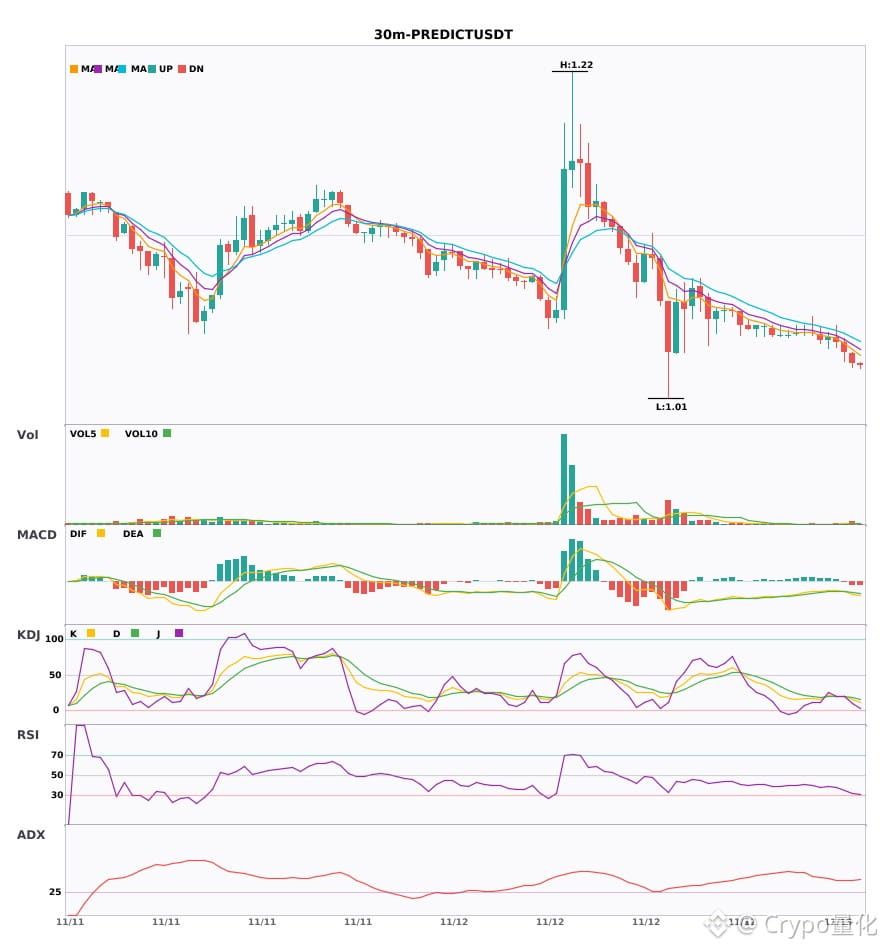
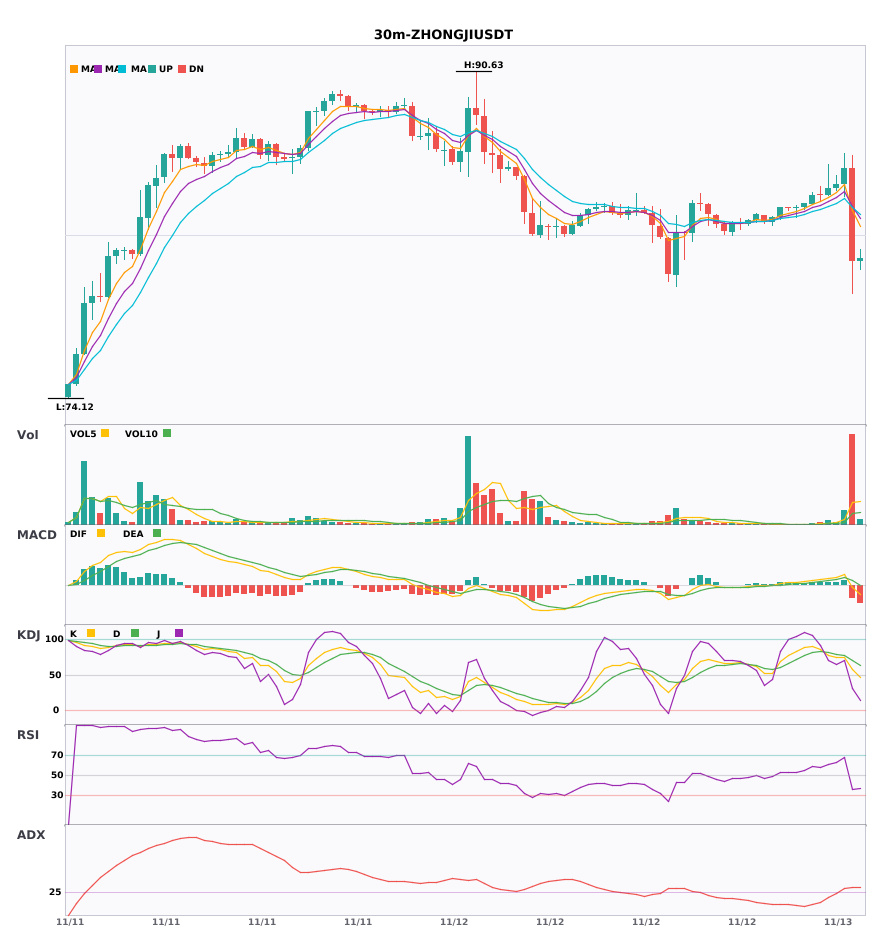
$IRYS / $PREDICT / $ZHONGJI 30-minute timeframe resonance to the downside, with bearish signals confirmed simultaneously
📉 $IRYS | 30-minute bearish signal
━━━━━━━━━━━━━━━━━━
Technical analysis: ADX(32) indicates a strong trend; MACD DIF has fallen below the zero line, confirming the bearish signal; EMA5<EMA8<EMA13 are bearishly aligned; trading volume surged to 2.3 times its previous level, confirming downward pressure.
Price change: -0.3200%
📉 $PREDICT | 30-minute bearish signal
━━━━━━━━━━━━━━━━━━
Technical analysis: ADX(37) indicates a pronounced trend; MACD formed a death cross below zero, accelerating the bearish momentum; EMA5<8<13 are bearishly aligned; KDJ death cross (K19.7/D19.8); trading volume surged to 2.1 times its previous level.
Price change: -0.5800%
📌 Market update: Binance will list Predict (PREDICT) and label it with a "Seed" tag.
📉 $ZHONGJI | 30-minute bearish signal
━━━━━━━━━━━━━━━━━━
Technical analysis: ADX(35) indicates a pronounced trend; MACD formed a death cross below zero, accelerating the bearish momentum; EMA5 crossed below EMA8, turning bearish in the short term; bullish momentum dominates KDJ (K57.4/D70.7); volume surged 7.7 times.
Price change: -5.4800%
━━━━━━━━━━━━━━━━━━
#技术分析 #IRYS #PREDICT #ZHONGJI
📌 The above content is for reference only and does not constitute investment advice
$IRYS / $PREDICT / $ZHONGJI 30-minute timeframe resonance to the downside, with bearish signals confirmed simultaneously
📉 $IRYS | 30-minute bearish signal
━━━━━━━━━━━━━━━━━━
Technical analysis: ADX(32) indicates a strong trend; MACD DIF has fallen below the zero line, confirming the bearish signal; EMA5<EMA8<EMA13 are bearishly aligned; trading volume surged to 2.3 times its previous level, confirming downward pressure.
Price change: -0.3200%
📉 $PREDICT | 30-minute bearish signal
━━━━━━━━━━━━━━━━━━
Technical analysis: ADX(37) indicates a pronounced trend; MACD formed a death cross below zero, accelerating the bearish momentum; EMA5<8<13 are bearishly aligned; KDJ death cross (K19.7/D19.8); trading volume surged to 2.1 times its previous level.
Price change: -0.5800%
📌 Market update: Binance will list Predict (PREDICT) and label it with a "Seed" tag.
📉 $ZHONGJI | 30-minute bearish signal
━━━━━━━━━━━━━━━━━━
Technical analysis: ADX(35) indicates a pronounced trend; MACD formed a death cross below zero, accelerating the bearish momentum; EMA5 crossed below EMA8, turning bearish in the short term; bullish momentum dominates KDJ (K57.4/D70.7); volume surged 7.7 times.
Price change: -5.4800%
━━━━━━━━━━━━━━━━━━
#技术分析 #IRYS #PREDICT #ZHONGJI
📌 The above content is for reference only and does not constitute investment advice
📉 $IRYS | 30-minute bearish signal
━━━━━━━━━━━━━━━━━━
Technical analysis: ADX(32) indicates a strong trend; MACD DIF has fallen below the zero line, confirming the bearish signal; EMA5<EMA8<EMA13 are bearishly aligned; trading volume surged to 2.3 times its previous level, confirming downward pressure.
Price change: -0.3200%
📉 $PREDICT | 30-minute bearish signal
━━━━━━━━━━━━━━━━━━
Technical analysis: ADX(37) indicates a pronounced trend; MACD formed a death cross below zero, accelerating the bearish momentum; EMA5<8<13 are bearishly aligned; KDJ death cross (K19.7/D19.8); trading volume surged to 2.1 times its previous level.
Price change: -0.5800%
📌 Market update: Binance will list Predict (PREDICT) and label it with a "Seed" tag.
📉 $ZHONGJI | 30-minute bearish signal
━━━━━━━━━━━━━━━━━━
Technical analysis: ADX(35) indicates a pronounced trend; MACD formed a death cross below zero, accelerating the bearish momentum; EMA5 crossed below EMA8, turning bearish in the short term; bullish momentum dominates KDJ (K57.4/D70.7); volume surged 7.7 times.
Price change: -5.4800%
━━━━━━━━━━━━━━━━━━
#技术分析 #IRYS #PREDICT #ZHONGJI
📌 The above content is for reference only and does not constitute investment advice
28
·
--
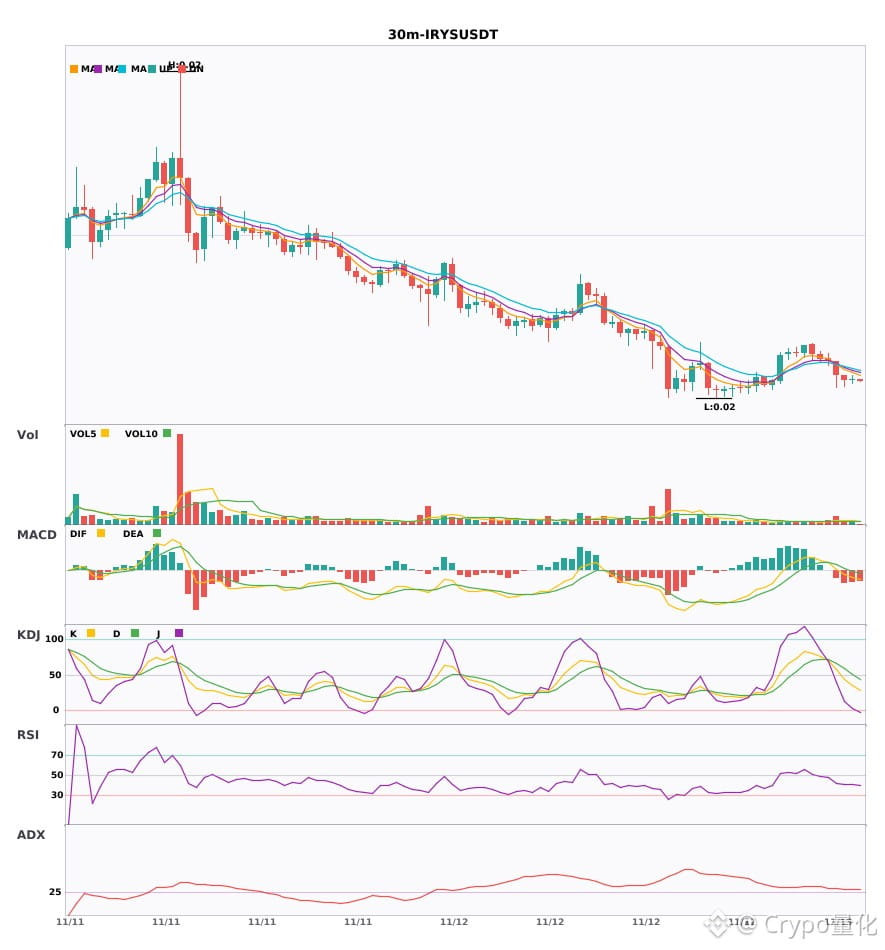
30-minute short signals on three coins at once. Beware of risk: $IRYS / $PREDICT / $ZHONGJI🔥
════════════════════
🟢 $IRYS 30-minute short signal
⚠️Technical analysis: ADX as high as 32, clear trend | MACD fell below zero, turning bearish | Moving averages aligned bearishly and pointing down | Volume increased 2.3x
════════════════════
🟢 $PREDICT 30-minute short signal
⚠️Technical analysis: ADX (37) indicates a strong trend; MACD formed a bearish cross below zero, with bears gaining strength; moving averages aligned bearishly and pointing down; KDJ bearish cross, K 19.7 and D 19.8, leaning bearish; volume increased 2.1x
📢Market update: Binance will list Predict (PREDICT) and mark it with a "Seed" tag.
════════════════════
🟢 $ZHONGJI 30-minute short signal
⚠️Technical analysis: Clear ADX trend, MACD bearish cross accelerating the downturn, moving averages just turned bearish, KDJ showing strong bullish momentum, volume surged 7.7x.
════════════════════
🔔 Follow for real-time market movements 🔔
#技术分析 #IRYS #PREDICT #ZHONGJI
📌 When trading, check whether the candlestick pattern confirms the signal.
30-minute short signals on three coins at once. Beware of risk: $IRYS / $PREDICT / $ZHONGJI 🔥
════════════════════
🟢 $IRYS 30-minute short signal
⚠️Technical analysis: ADX as high as 32, clear trend | MACD fell below zero, turning bearish | Moving averages aligned bearishly and pointing down | Volume increased 2.3x
════════════════════
🟢 $PREDICT 30-minute short signal
⚠️Technical analysis: ADX (37) indicates a strong trend; MACD formed a bearish cross below zero, with bears gaining strength; moving averages aligned bearishly and pointing down; KDJ bearish cross, K 19.7 and D 19.8, leaning bearish; volume increased 2.1x
📢Market update: Binance will list Predict (PREDICT) and mark it with a "Seed" tag.
════════════════════
🟢 $ZHONGJI 30-minute short signal
⚠️Technical analysis: Clear ADX trend, MACD bearish cross accelerating the downturn, moving averages just turned bearish, KDJ showing strong bullish momentum, volume surged 7.7x.
════════════════════
🔔 Follow for real-time market movements 🔔
#技术分析 #IRYS #PREDICT #ZHONGJI
📌 When trading, check whether the candlestick pattern confirms the signal.
════════════════════
🟢 $IRYS 30-minute short signal
⚠️Technical analysis: ADX as high as 32, clear trend | MACD fell below zero, turning bearish | Moving averages aligned bearishly and pointing down | Volume increased 2.3x
════════════════════
🟢 $PREDICT 30-minute short signal
⚠️Technical analysis: ADX (37) indicates a strong trend; MACD formed a bearish cross below zero, with bears gaining strength; moving averages aligned bearishly and pointing down; KDJ bearish cross, K 19.7 and D 19.8, leaning bearish; volume increased 2.1x
📢Market update: Binance will list Predict (PREDICT) and mark it with a "Seed" tag.
════════════════════
🟢 $ZHONGJI 30-minute short signal
⚠️Technical analysis: Clear ADX trend, MACD bearish cross accelerating the downturn, moving averages just turned bearish, KDJ showing strong bullish momentum, volume surged 7.7x.
════════════════════
🔔 Follow for real-time market movements 🔔
#技术分析 #IRYS #PREDICT #ZHONGJI
📌 When trading, check whether the candlestick pattern confirms the signal.
16

·
--
ZHONGJI Binance TradFi Perpetuals (traditional finance), 5-minute candle closed at -5.36% at 2026-11-13 09:35 Beijing time. At 2026-11-13 09:35:02 Beijing time, the observed price was 81.42, 24h turnover was 61.1671 million, price was below VWAP 83.7404, and volume was 13.2x. At first glance, it’s easy to get distracted by the drop. What matters more now is this: if panic selling doesn’t continue, it could quickly turn into a weak bounce.
Can the rebound get back above VWAP 83.7404, and will volume quickly contract after expanding to 13.2x? Don’t focus on the first impression; the quality of the rebound is more telling.
Note: These are traditional finance perpetuals, with higher liquidity and gap risks outside trading hours.
#ZHONGJI #Unusual Movement Alert
ZHONGJI Binance TradFi Perpetuals (traditional finance), 5-minute candle closed at -5.36% at 2026-11-13 09:35 Beijing time. At 2026-11-13 09:35:02 Beijing time, the observed price was 81.42, 24h turnover was 61.1671 million, price was below VWAP 83.7404, and volume was 13.2x. At first glance, it’s easy to get distracted by the drop. What matters more now is this: if panic selling doesn’t continue, it could quickly turn into a weak bounce.
Can the rebound get back above VWAP 83.7404, and will volume quickly contract after expanding to 13.2x? Don’t focus on the first impression; the quality of the rebound is more telling.
Note: These are traditional finance perpetuals, with higher liquidity and gap risks outside trading hours.
#ZHONGJI #Unusual Movement Alert
Can the rebound get back above VWAP 83.7404, and will volume quickly contract after expanding to 13.2x? Don’t focus on the first impression; the quality of the rebound is more telling.
Note: These are traditional finance perpetuals, with higher liquidity and gap risks outside trading hours.
#ZHONGJI #Unusual Movement Alert
72
·
--
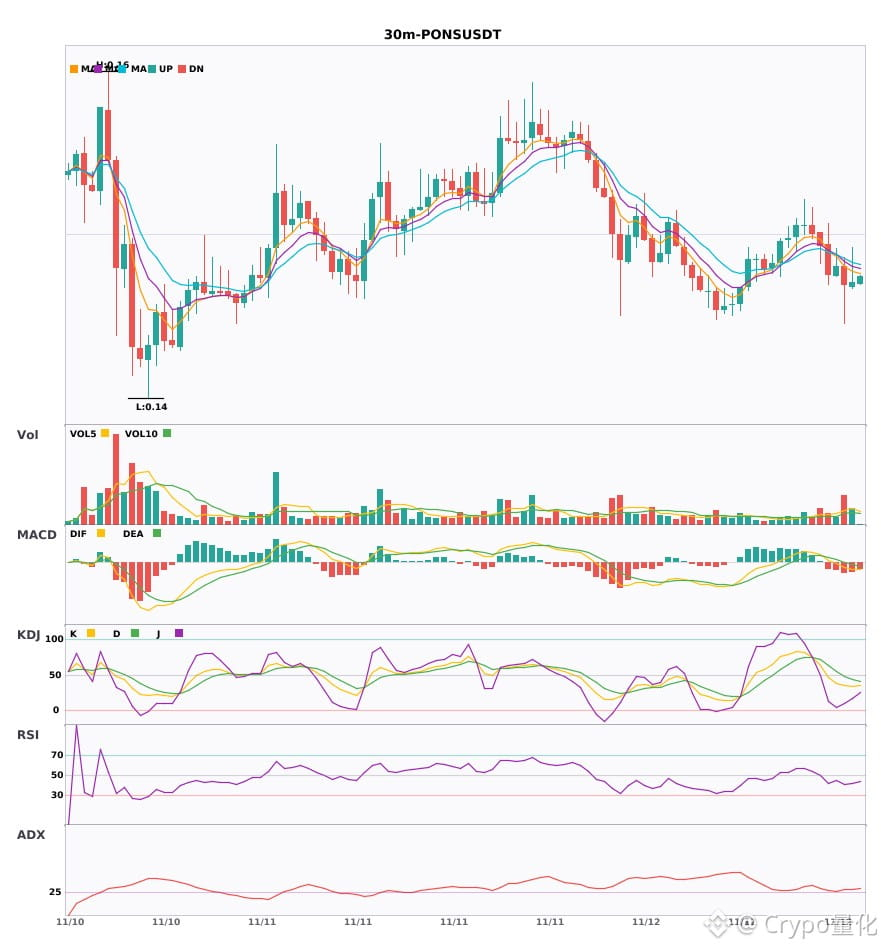
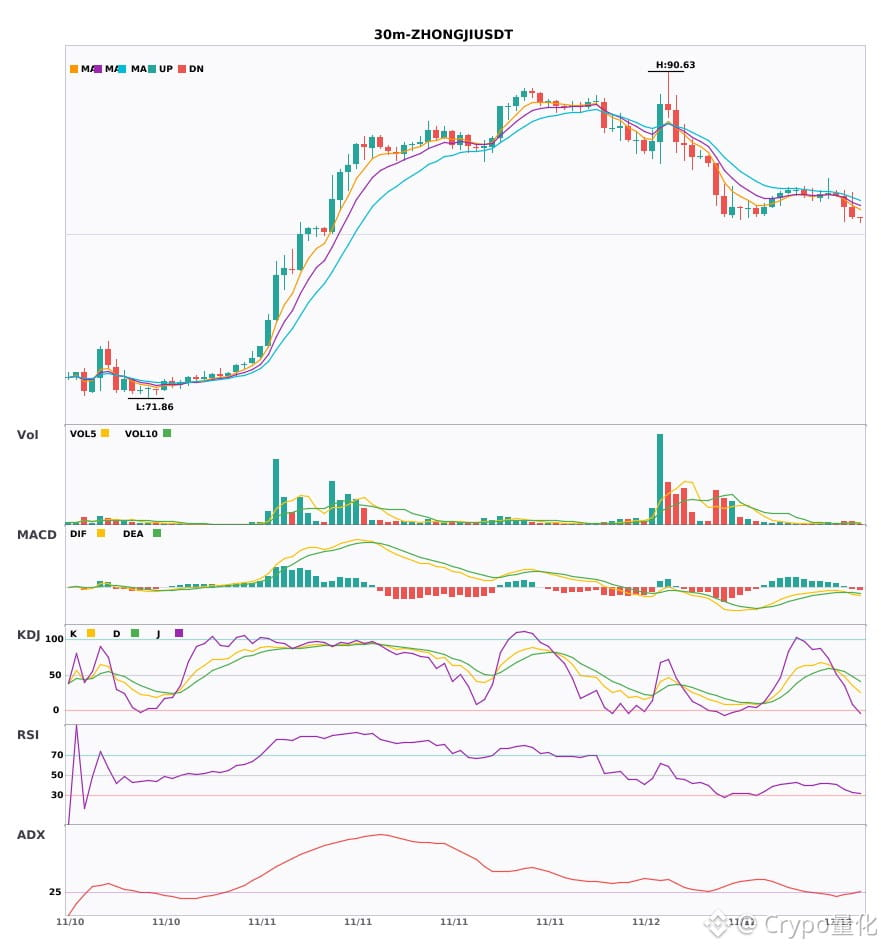
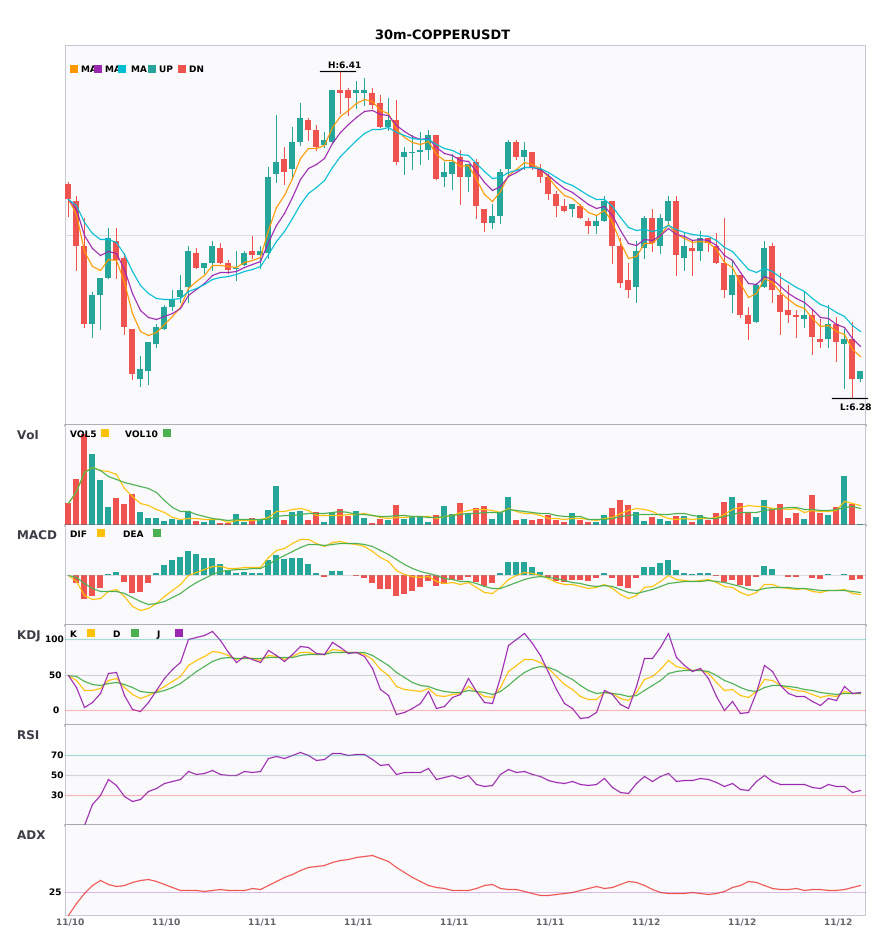
3 30-minute bearish alerts: $PONS / $ZHONGJI / $COPPER🔥
════════════════════
🟢 $PONS 30-minute bearish signal
⚠️Technical analysis: ADX(32) clear trending market | MACD bearish, trend is weak, momentum strengthening | EMA5 < EMA8 < EMA13 bearish alignment | KDJ in weak territory, bears have the advantage (K: 35.3, D: 48.0) | Volume surge (2.6x)
════════════════════
🟢 $ZHONGJI 30-minute bearish signal
⚠️Technical analysis: ADX(25) trend is forming, entry may be considered | MACD bearish crossover below zero, bearish momentum accelerating | EMA5 < EMA8 < EMA13 bearish alignment | KDJ in weak territory, bears have the advantage (K: 35.0, D: 48.2) | Volume increase (2.1x)
════════════════════
🟢 $COPPER 30-minute bearish signal
⚠️Technical analysis: ADX(31) clear trending market | MACD bearish crossover below zero, bearish momentum accelerating | EMA5 < EMA8 < EMA13 bearish alignment | KDJ bearish crossover, short-term outlook is bearish (K: 24.0, D: 24.1) | Volume surge (2.7x)
════════════════════
🔔 Follow for real-time market alerts 🔔
#技术分析 #PONS #ZHONGJI #COPPER
📌 When trading, check whether the candlestick pattern confirms the signal
3 30-minute bearish alerts: $PONS / $ZHONGJI / $COPPER 🔥
════════════════════
🟢 $PONS 30-minute bearish signal
⚠️Technical analysis: ADX(32) clear trending market | MACD bearish, trend is weak, momentum strengthening | EMA5 < EMA8 < EMA13 bearish alignment | KDJ in weak territory, bears have the advantage (K: 35.3, D: 48.0) | Volume surge (2.6x)
════════════════════
🟢 $ZHONGJI 30-minute bearish signal
⚠️Technical analysis: ADX(25) trend is forming, entry may be considered | MACD bearish crossover below zero, bearish momentum accelerating | EMA5 < EMA8 < EMA13 bearish alignment | KDJ in weak territory, bears have the advantage (K: 35.0, D: 48.2) | Volume increase (2.1x)
════════════════════
🟢 $COPPER 30-minute bearish signal
⚠️Technical analysis: ADX(31) clear trending market | MACD bearish crossover below zero, bearish momentum accelerating | EMA5 < EMA8 < EMA13 bearish alignment | KDJ bearish crossover, short-term outlook is bearish (K: 24.0, D: 24.1) | Volume surge (2.7x)
════════════════════
🔔 Follow for real-time market alerts 🔔
#技术分析 #PONS #ZHONGJI #COPPER
📌 When trading, check whether the candlestick pattern confirms the signal
════════════════════
🟢 $PONS 30-minute bearish signal
⚠️Technical analysis: ADX(32) clear trending market | MACD bearish, trend is weak, momentum strengthening | EMA5 < EMA8 < EMA13 bearish alignment | KDJ in weak territory, bears have the advantage (K: 35.3, D: 48.0) | Volume surge (2.6x)
════════════════════
🟢 $ZHONGJI 30-minute bearish signal
⚠️Technical analysis: ADX(25) trend is forming, entry may be considered | MACD bearish crossover below zero, bearish momentum accelerating | EMA5 < EMA8 < EMA13 bearish alignment | KDJ in weak territory, bears have the advantage (K: 35.0, D: 48.2) | Volume increase (2.1x)
════════════════════
🟢 $COPPER 30-minute bearish signal
⚠️Technical analysis: ADX(31) clear trending market | MACD bearish crossover below zero, bearish momentum accelerating | EMA5 < EMA8 < EMA13 bearish alignment | KDJ bearish crossover, short-term outlook is bearish (K: 24.0, D: 24.1) | Volume surge (2.7x)
════════════════════
🔔 Follow for real-time market alerts 🔔
#技术分析 #PONS #ZHONGJI #COPPER
📌 When trading, check whether the candlestick pattern confirms the signal
66

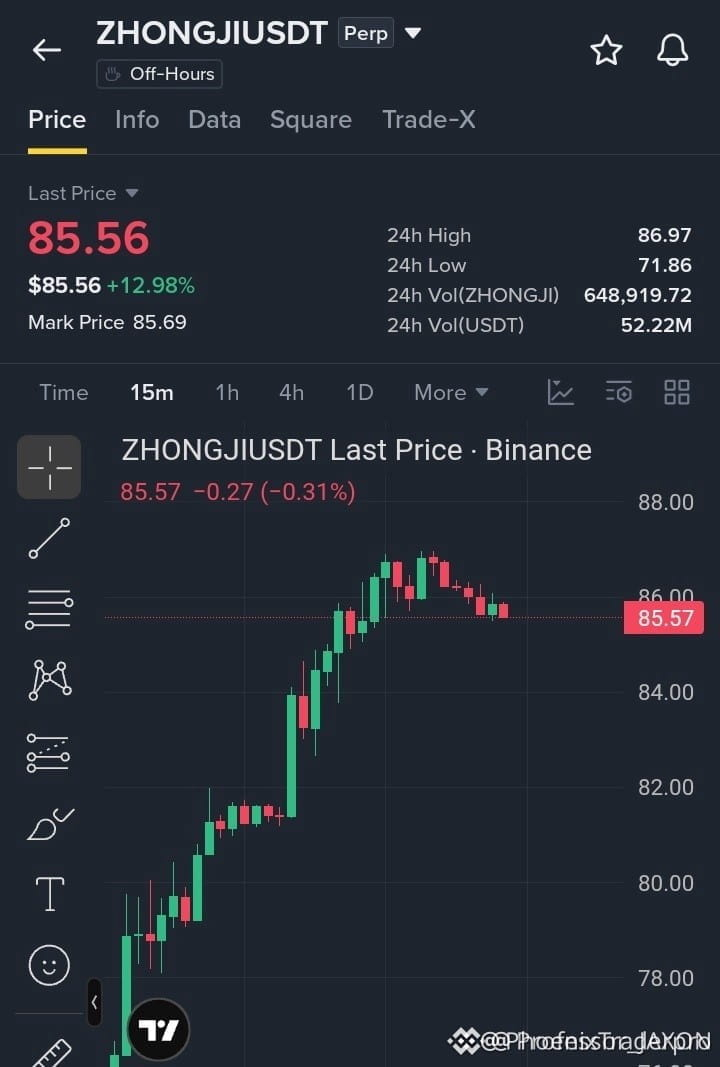
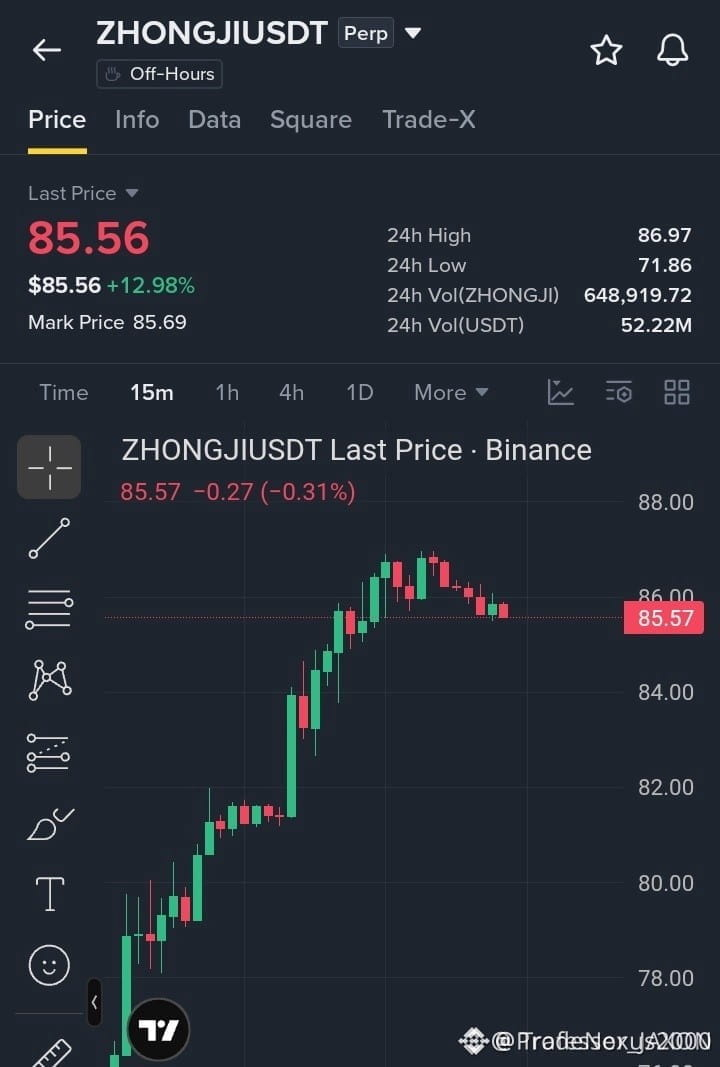
🔴 $ZHONGJI HITS MAJOR RESISTANCE AS BULL MOMENTUM FADES AND SELLERS STEP IN 📉
Entry: 85.50–86.00 ⚡
Target: 83.20-84.80 🚀
Stop Loss: 87.10 ⚠️
Buyers punched hard during the recent rally, but supply is choking out the advance right at the 86.50 to 87.00 resistance barrier. 📊 Order flow shows aggressive selling pressure absorbing every bid as momentum indicators roll over on lower timeframes. ⚡
A clean breakdown below the 85.50 pivot will likely trigger a swift liquidity sweep down toward deeper support levels. 🔍
Are you waiting for a confirmed retest to enter this short, or fading the initial rejection right at the highs? 🤔
⚠️ Not financial advice. Always manage your risk. 🛡️
🏷️ #ZHONGJI #ShortSetup #Bearish #Crypto
🔴 🔻
🔴 $ZHONGJI HITS MAJOR RESISTANCE AS BULL MOMENTUM FADES AND SELLERS STEP IN 📉
Entry: 85.50–86.00 ⚡
Target: 83.20-84.80 🚀
Stop Loss: 87.10 ⚠️
Buyers punched hard during the recent rally, but supply is choking out the advance right at the 86.50 to 87.00 resistance barrier. 📊 Order flow shows aggressive selling pressure absorbing every bid as momentum indicators roll over on lower timeframes. ⚡
A clean breakdown below the 85.50 pivot will likely trigger a swift liquidity sweep down toward deeper support levels. 🔍
Are you waiting for a confirmed retest to enter this short, or fading the initial rejection right at the highs? 🤔
⚠️ Not financial advice. Always manage your risk. 🛡️
🏷️ #ZHONGJI #ShortSetup #Bearish #Crypto
🔴 🔻
Entry: 85.50–86.00 ⚡
Target: 83.20-84.80 🚀
Stop Loss: 87.10 ⚠️
Buyers punched hard during the recent rally, but supply is choking out the advance right at the 86.50 to 87.00 resistance barrier. 📊 Order flow shows aggressive selling pressure absorbing every bid as momentum indicators roll over on lower timeframes. ⚡
A clean breakdown below the 85.50 pivot will likely trigger a swift liquidity sweep down toward deeper support levels. 🔍
Are you waiting for a confirmed retest to enter this short, or fading the initial rejection right at the highs? 🤔
⚠️ Not financial advice. Always manage your risk. 🛡️
🏷️ #ZHONGJI #ShortSetup #Bearish #Crypto
🔴 🔻
6

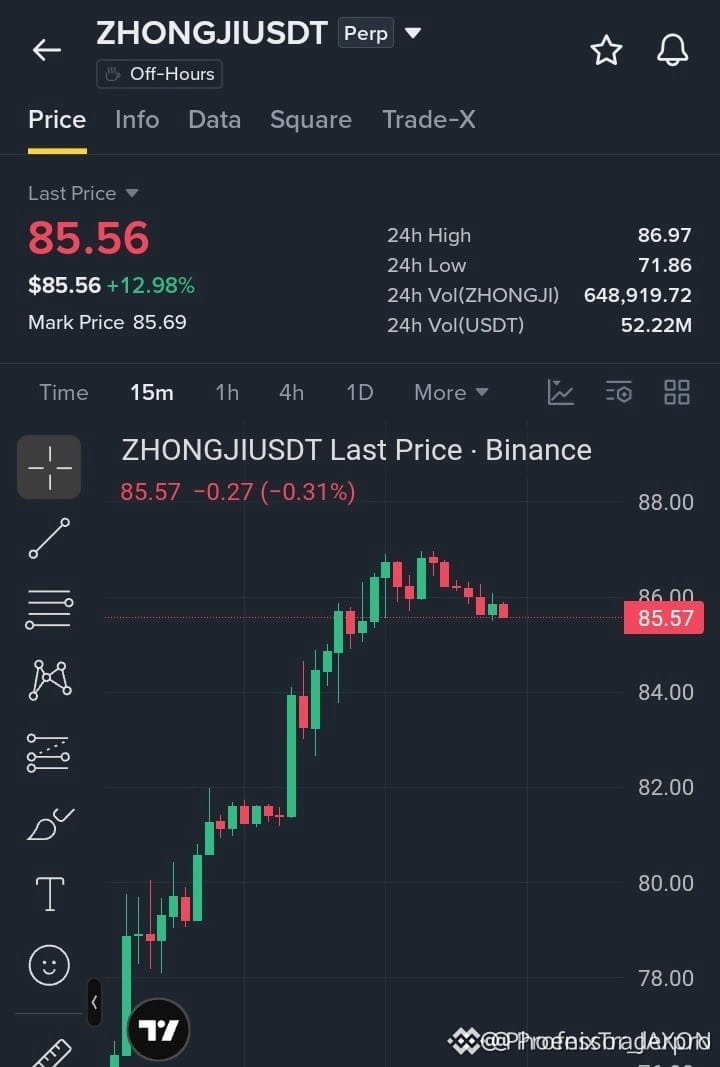
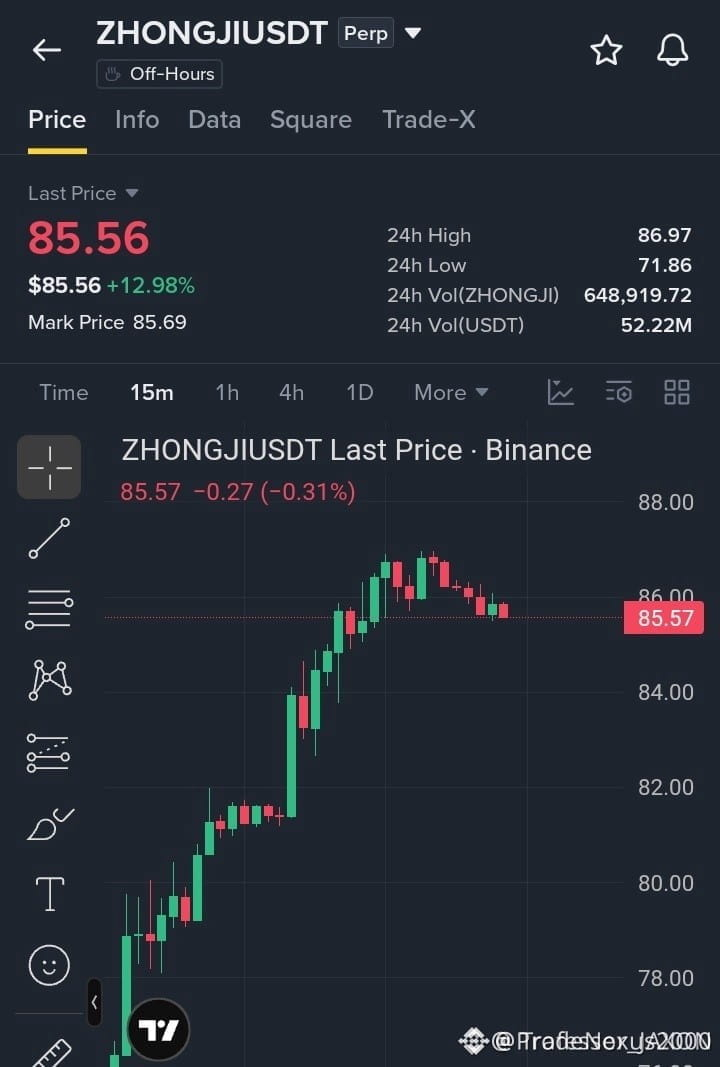
🚨 $ZHONGJI REJECTING KEY RESISTANCE AS SMART MONEY PREPARES FOR A SHARP PULLBACK! 📉
Entry: 85.50-86.00 ⚡
Target: 83.20 🚀
Stop Loss: 87.10 ⚠️
Price action is stalling right beneath the 86.50-87.00 overhead supply zone, flashing textbook exhaustion candles on the higher timeframes. 📊 Momentum indicators show institutional buyers stepping back as supply floods the order book. ⚡
A confirmed break under 85.50 opens the structural pathway toward lower liquidity pools near the 83.20 handle. 🔍 Patient execution is key here while waiting for structural confirmation before committing capital. 💬
Are you positioning for this downside continuation or waiting for a deeper sweep? 👇
⚠️ Not financial advice. Always manage your risk. 🛡️
🏷️ #ZHONGJI #ShortSetup #MarketStructure #PriceAction #Crypto
🦈 📉
🚨 $ZHONGJI REJECTING KEY RESISTANCE AS SMART MONEY PREPARES FOR A SHARP PULLBACK! 📉
Entry: 85.50-86.00 ⚡
Target: 83.20 🚀
Stop Loss: 87.10 ⚠️
Price action is stalling right beneath the 86.50-87.00 overhead supply zone, flashing textbook exhaustion candles on the higher timeframes. 📊 Momentum indicators show institutional buyers stepping back as supply floods the order book. ⚡
A confirmed break under 85.50 opens the structural pathway toward lower liquidity pools near the 83.20 handle. 🔍 Patient execution is key here while waiting for structural confirmation before committing capital. 💬
Are you positioning for this downside continuation or waiting for a deeper sweep? 👇
⚠️ Not financial advice. Always manage your risk. 🛡️
🏷️ #ZHONGJI #ShortSetup #MarketStructure #PriceAction #Crypto
🦈 📉
Entry: 85.50-86.00 ⚡
Target: 83.20 🚀
Stop Loss: 87.10 ⚠️
Price action is stalling right beneath the 86.50-87.00 overhead supply zone, flashing textbook exhaustion candles on the higher timeframes. 📊 Momentum indicators show institutional buyers stepping back as supply floods the order book. ⚡
A confirmed break under 85.50 opens the structural pathway toward lower liquidity pools near the 83.20 handle. 🔍 Patient execution is key here while waiting for structural confirmation before committing capital. 💬
Are you positioning for this downside continuation or waiting for a deeper sweep? 👇
⚠️ Not financial advice. Always manage your risk. 🛡️
🏷️ #ZHONGJI #ShortSetup #MarketStructure #PriceAction #Crypto
🦈 📉
11
Log in to explore more content
Join global crypto users on Binance Square
⚡️ Get latest and useful information about crypto.
💬 Trusted by the world’s largest crypto exchange.
👍 Discover real insights from verified creators.
Email / Phone number
Trending Topics
1
#A Packed Week of Earnings and Data Tests Markets
42,936 views
303 Discussing
2
#AnthropicIPOTestsInvestorAppetiteForAI
58,574 views
986 Discussing
3
#BitcoinExtendsLosingStreakToSixWeeks
18,973 views
349 Discussing
4
#XRPFallsTo$0.89LowestSinceNovember2024
5,061 views
38 Discussing
5
#HuangReportedlyConsidersReturnToNvidia
80,451 views
992 Discussing
6
#SP500AndNasdaqFuturesHitQuarterlyLows
5,304 views
101 Discussing
7
#CaliforniaVotersBackProp42BarringNewCryptoTaxes
4,875 views
109 Discussing
8
#HKPlansDigitalAssetRegulatoryBillByYearEnd
4,435 views
88 Discussing
9
#MUFGSMFGMizuhoPlanYenBackedStablecoin
15,989 views
200 Discussing
10
#HKMAAndSwiftExploreTokenizedDepositInteroperability
780 views
14 Discussing