

#link
link
19.8M views
45,588 Discussing
Hot
Latest

Many predict $LINK at $30, $50 or even $100 in 2027. 👀
Smart investors look beyond price targets. 👇
🔹 1B max supply
🔹 Token unlocks & circulating supply
🔹 LINK staking & network utility
🔹 Demand vs. actual adoption
The key investor question: Will Chainlink's growing adoption translate into enough demand for LINK?
Because a growing ecosystem doesn't automatically mean a rising token price.
💎 Track the tokenomics. Not just the hype.
#LINK #Chainlink #crypto

MrKien_Pi:
LINK sẽ ko bgio có giá quá cao. vì nó là để trả phí. ko ai muốn nó quá cao cả
1
3
1.3k

·
--
Bullish
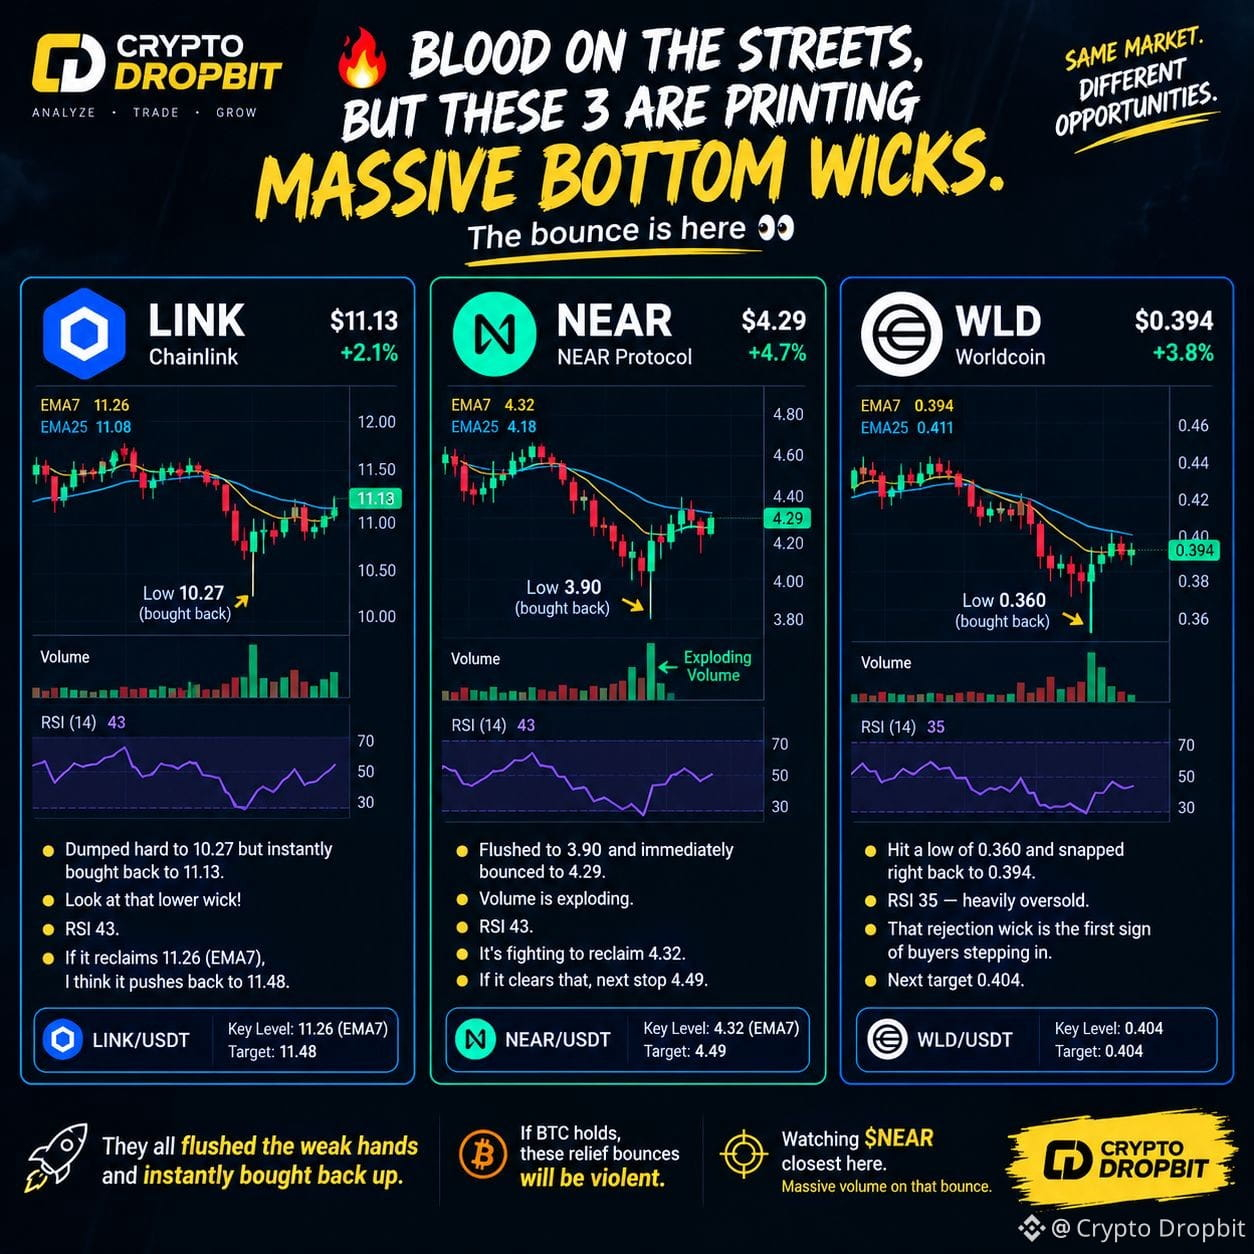
🔥 Blood on the streets, but these 3 are printing massive bottom wicks. The bounce is here 👀 #LINK #NEAR #WLD
$LINK — Dumped hard to 10.27 but instantly bought back to 11.13. Look at that lower wick! RSI 43. If it reclaims 11.26 (EMA7), I think it pushes back to 11.48.
{future}(LINKUSDT)
$NEAR — Flushed to 3.90 and immediately bounced to 4.29. Volume is exploding. RSI 43. It’s fighting to reclaim 4.32. If it clears that, next stop 4.49.
{future}(NEARUSDT)
$WLD — Hit a low of 0.360 and snapped right back to 0.394. RSI 35 — heavily oversold. That rejection wick is the first sign of buyers stepping in. Next target 0.404.
{future}(WLDUSDT)
They all flushed the weak hands and instantly bought back up. If BTC holds, these relief bounces will be violent.
Watching #NEAR closest here. Massive volume on that bounce.
#CryptoDropbit
🔥 Blood on the streets, but these 3 are printing massive bottom wicks. The bounce is here 👀 #LINK #NEAR #WLD
$LINK — Dumped hard to 10.27 but instantly bought back to 11.13. Look at that lower wick! RSI 43. If it reclaims 11.26 (EMA7), I think it pushes back to 11.48.
$NEAR — Flushed to 3.90 and immediately bounced to 4.29. Volume is exploding. RSI 43. It’s fighting to reclaim 4.32. If it clears that, next stop 4.49.
$WLD — Hit a low of 0.360 and snapped right back to 0.394. RSI 35 — heavily oversold. That rejection wick is the first sign of buyers stepping in. Next target 0.404.
They all flushed the weak hands and instantly bought back up. If BTC holds, these relief bounces will be violent.
Watching #NEAR closest here. Massive volume on that bounce.
#CryptoDropbit
Ghoststroke:
A lower wick on a flush candle is short covering, not a confirmed regime change. Both tokens ran straight into overhead dynamic resistance: LINK is stalling under its 11.26 50 EMA, and NEAR capped out at 4.29 beneath its 4.37 moving average. With 62% of LINK open interest leaning long, calling for violent expansion before establishing a structural base is how secondary selloffs trap late buyers.
5
7
5.4k

$LINK has seen better days, but one difficult phase doesn't define its future.
I'm watching the $10.20 support closely. A recovery above $10.83–$11.06 could bring fresh hope.
No need to rush. Sometimes patience is the strongest position in the market.
#LINK #Chainlink #Crypto
{spot}(LINKUSDT)
$LINK has seen better days, but one difficult phase doesn't define its future.
I'm watching the $10.20 support closely. A recovery above $10.83–$11.06 could bring fresh hope.
No need to rush. Sometimes patience is the strongest position in the market.
#LINK #Chainlink #Crypto
I'm watching the $10.20 support closely. A recovery above $10.83–$11.06 could bring fresh hope.
No need to rush. Sometimes patience is the strongest position in the market.
#LINK #Chainlink #Crypto

2
620

·
--
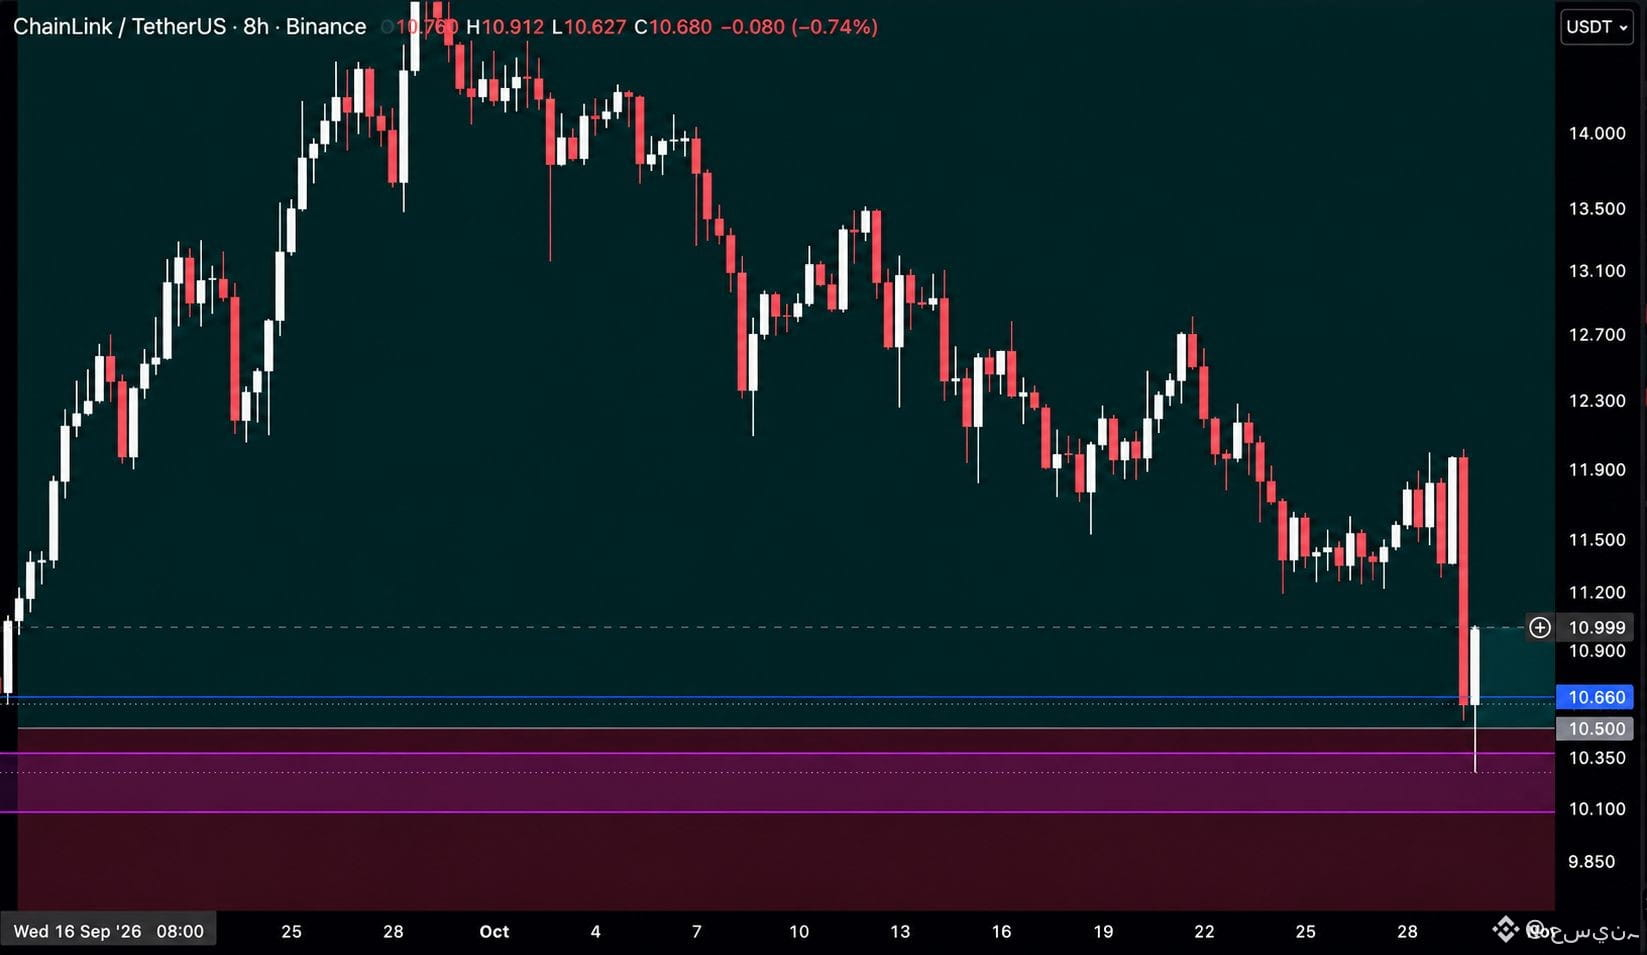
$LINK /USDT (2-5x)
Direction: LONG
ENTRY: 10.450 - 10.500
TARGETS:
11.000 - 11.500 - 12.100 - 12.700 -
13.500 - 14.500 - 15.750 - 17.000
STOP LOSS: 9.500
Trendline breakout confluent with a 4H FVG below acting as the retest zone. Price reclaiming structure after a clean downtrend. #LINK
{future}(LINKUSDT)
$LINK /USDT (2-5x)
Direction: LONG
ENTRY: 10.450 - 10.500
TARGETS:
11.000 - 11.500 - 12.100 - 12.700 -
13.500 - 14.500 - 15.750 - 17.000
STOP LOSS: 9.500
Trendline breakout confluent with a 4H FVG below acting as the retest zone. Price reclaiming structure after a clean downtrend. #LINK
Direction: LONG
ENTRY: 10.450 - 10.500
TARGETS:
11.000 - 11.500 - 12.100 - 12.700 -
13.500 - 14.500 - 15.750 - 17.000
STOP LOSS: 9.500
Trendline breakout confluent with a 4H FVG below acting as the retest zone. Price reclaiming structure after a clean downtrend. #LINK
1
243




·
--
$LINK
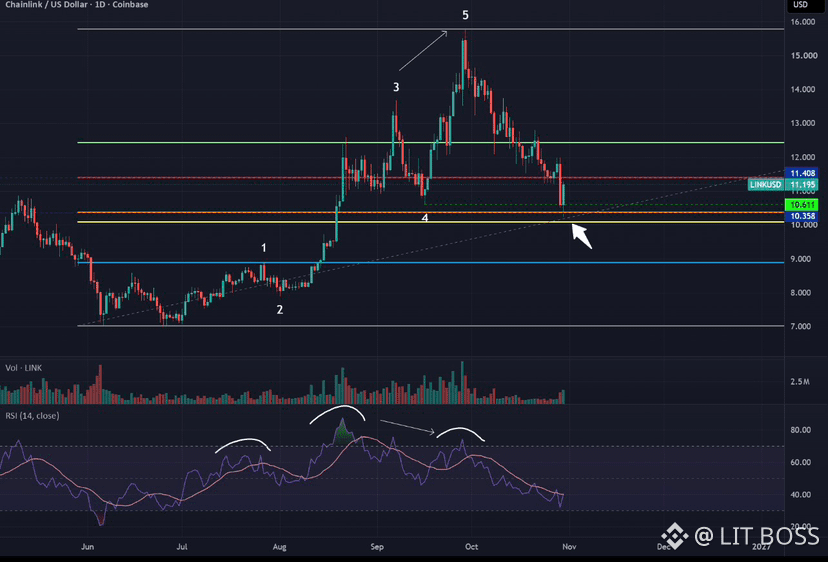
While momentum chasers buy into local support tests, this 1-day chart on $LINK is testing structural diagonal support and key horizontal floors around $10.358 following an impulsive corrective wave.
After peaking near the significant wave 5 high around $15.50 and printing bearish RSI divergence, price has retraced sharply to trade around $11.195. The daily chart shows price pressing toward the ascending support trendline and horizontal demand zone near $10.358 and $10.611, with RSI sliding toward neutral levels.
The projected path outlines a test of this major support confluence before staging a structural reversal toward overhead resistance at $11.408 and $12.00.
Holding above the diagonal support and the $10.00 psychological floor keeps the broader bullish market structure intact. A decisive daily close below $10.00 invalidates the support defense thesis and opens downside risk toward deeper weekly demand zones.
Don't short into structural diagonal supports and key horizontal demand confluence zones—wait for confirmed reversal patterns to position alongside the recovery leg.
#LINK
832

·
--
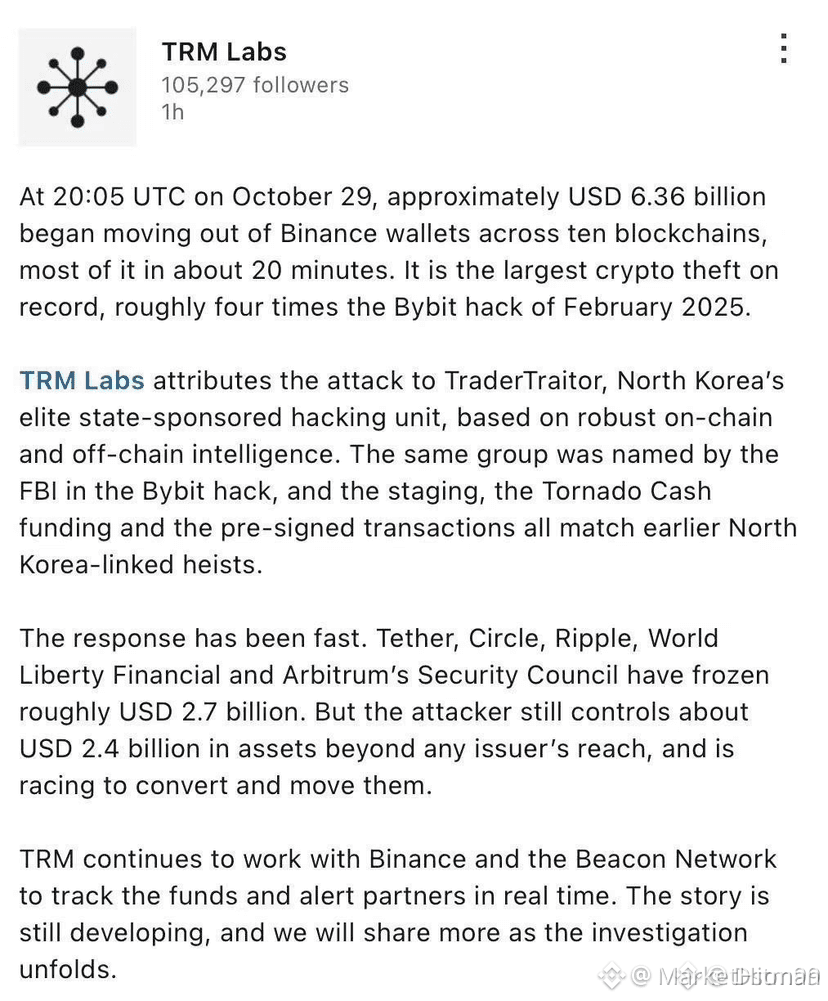
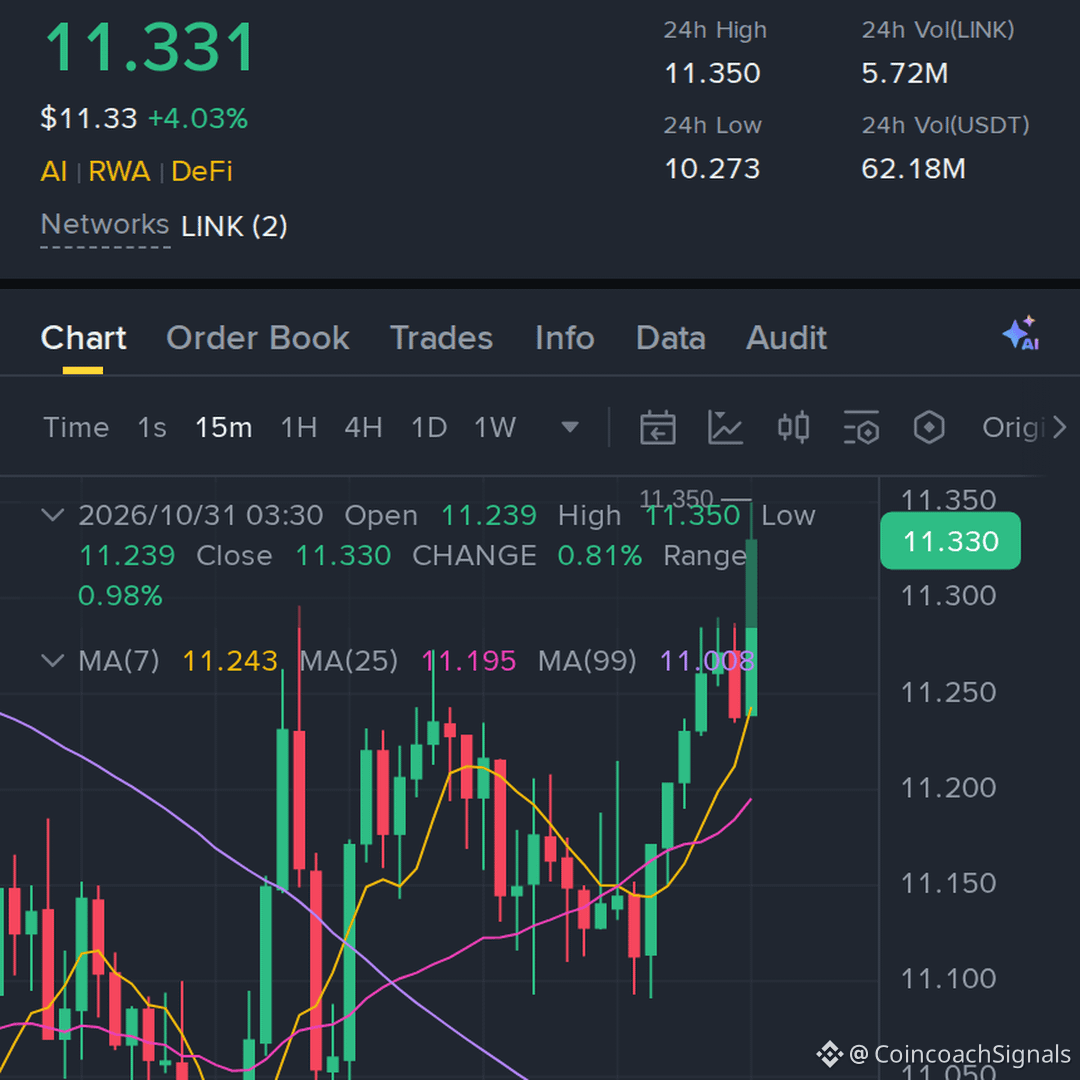
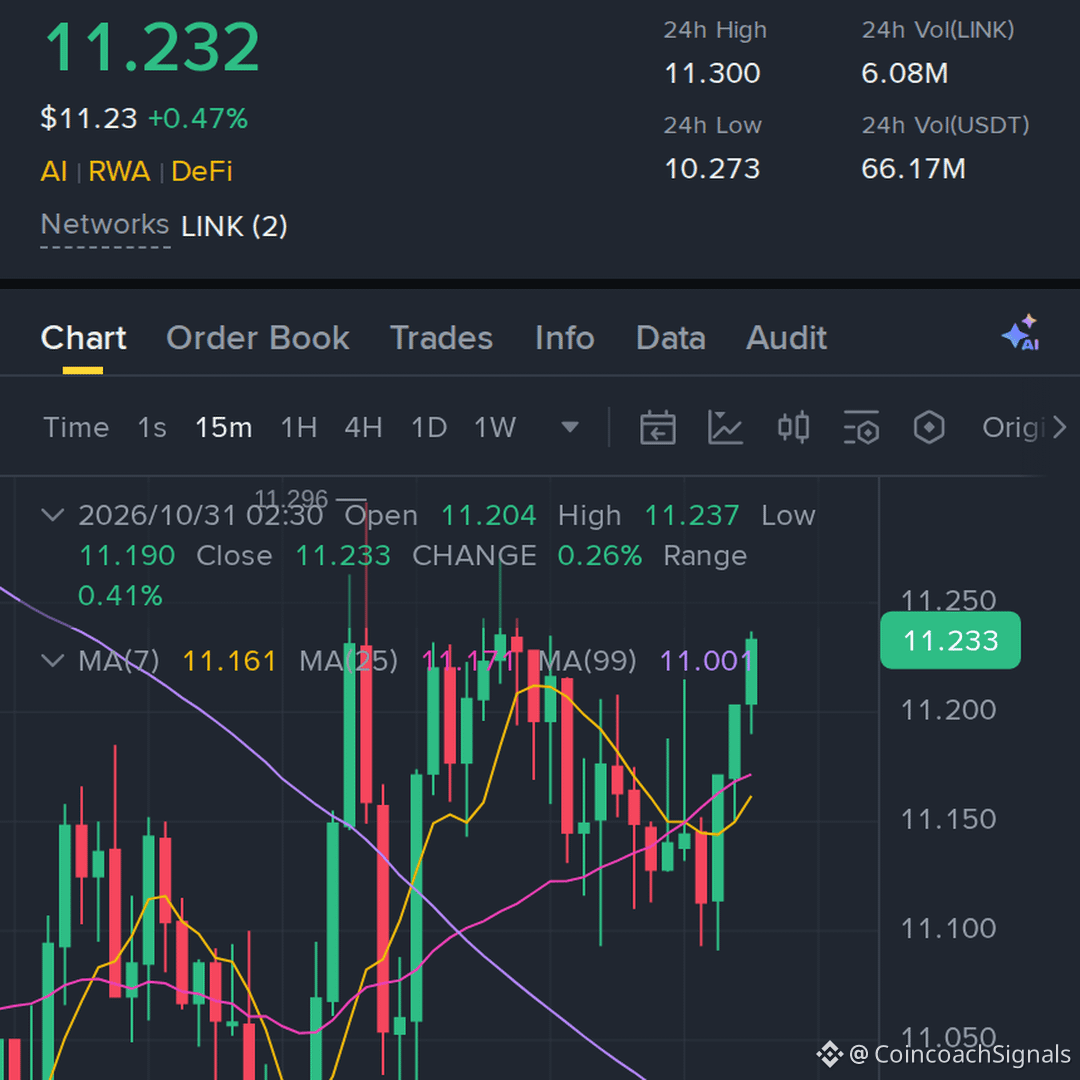
🚨 $LINK WEATHERING THE STORM AS OVER THREE BILLION IN OUTFLOWS GETS FROZEN! 🛡️
🌊 When unexpected headlines trigger emotional market dumping, smart money steps in to scoop the discount. Over three billion dollars from the security breach has already been contained, balance sheets stand bulletproof, and not a single user balance was compromised.
📊 Threat actors are stuck scattering fragments across chains without dumping on spot books, meaning this flush was pure psychological exhaustion. Once order flow absorbs the forced selling, the market is primed for a decisive liquidity reclaim.
🤔 Are you panic selling the fear or bidding the deepest liquidity sweep of the month? 👇
⚠️ Not financial advice. Always manage your risk. 🛡️
🏷️ #LINK #CryptoMarket #Liquidity #SAFU #Rebound
🔥 💎
7


·
--
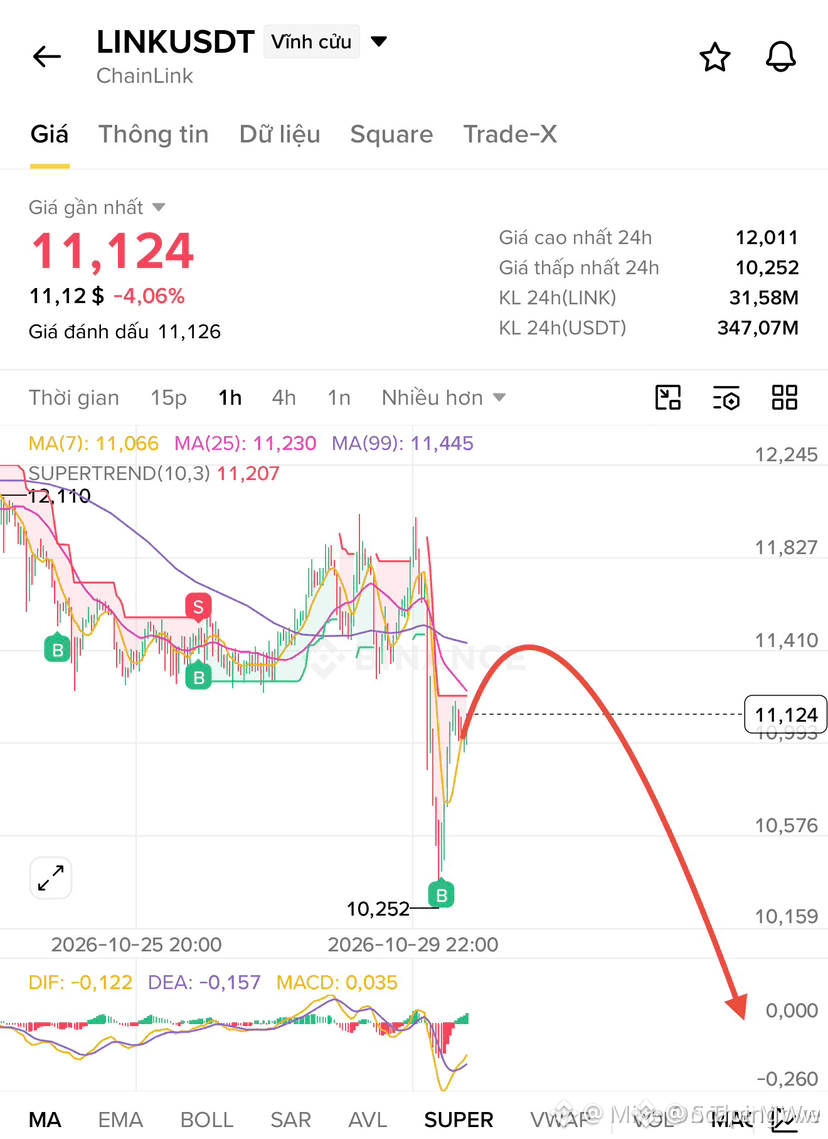
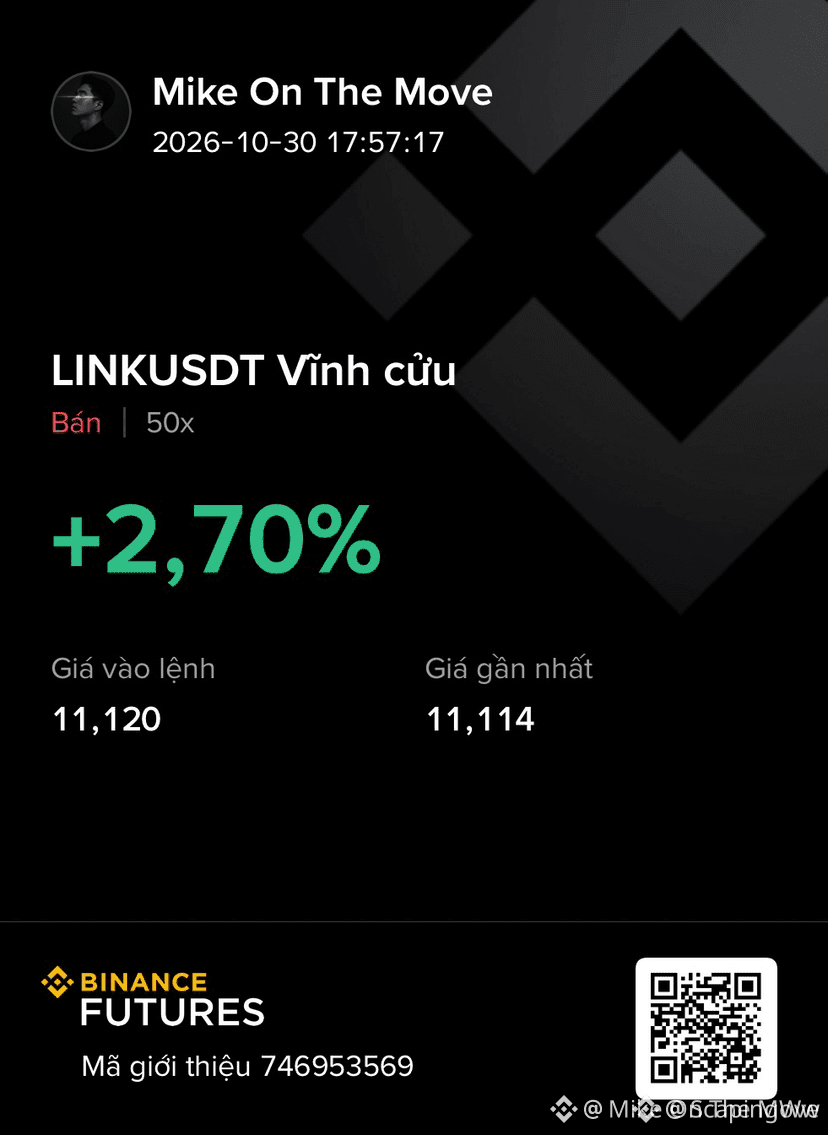
🚨 $LINK CRACKS UNDER OVERHEAD SUPPLY AS SELLERS PREPARE TO FLIP THE RANGE! 📉
Entry: 10.93 - 11.27 ⚡
Target: 10.77, 10.43, 10.21 🎯
Stop Loss: 12.10 🛑
📌 Buyers are running out of steam at this distribution zone, failing to secure acceptance above recent range highs. 📊 Every tap into the 11.27 level is meeting aggressive sell-side absorption, signaling that institutional inventory is leaning heavily short.
⚡ Once bids thin out beneath the 10.93 pivot, momentum should accelerate swiftly into the liquidity resting down toward 10.21. 💬 Are you taking the short from resistance or waiting for support to catch the bounce? 👇
⚠️ Not financial advice. Always manage your risk. 🛡️
🏷️ #LINK #ShortSetup #Altcoins #CryptoTrading
🎯 📉
30

Chainlink Recovers Toward $11.20 After Sharp Sell-Off: Can LINK Reclaim Its Range? 📊$LINK | LINK/USDT
💰 Price: 11.167
📉 24H Change: -0.12%
📊 24H High: 11.300
📉 24H Low: 10.273
💵 24H Volume (USDT): 75.07M
⚠️ Market Breakdown (4H Timeframe):
Chainlink has gone through a sharp sell-off followed by a steady rebound, and the 4H chart shows exactly where buyers stepped back in 🔍
🔻 Price was rejected near the 12.016 high and dropped hard from there
🔻 One large red candle broke through the range and pushed price down to the 10.273 low in a single move
🟢 A long lower wick near 10.273 shows strong demand, and a series of green candles followed 🧲
🟢 Price has recovered most of the drop and is now consolidating near 11.17
📉 Moving Averages Tell the Story:
📌 MA(7): 11.013
📌 MA(25): 11.427
📌 MA(99): 11.879
✅ Price is trading above MA(7), which is a short-term positive
❌ Price is still below MA(25) and MA(99)
❌ MA(25) and MA(99) are sloping downward and sit above price as resistance
⚠️ The broader structure is recovering, but not yet reversed 🐻
📊 Volume Insight:
🔴 Volume spiked heavily on the breakdown candle
💥 This points to forced liquidations and aggressive selling rather than a slow decline
🟢 Buying volume picked up during the rebound, which shows real demand stepping in
⚠️ Volume has cooled off on the latest candles, so watch for a pickup on the next move
🧠 What This Means:
This looks like a leverage flush followed by a solid recovery attempt. Weak longs were shaken out, and LINK has now reclaimed a large part of the drop ⚖️
🔹 Short-term trend: Recovering
🔹 Momentum: Improving but capped by overhead resistance
🔹 Market emotion: Cautiously optimistic 😌
🎯 Key Levels to Watch:
🟢 Support: 10.64 – 11.01 zone
🔴 Resistance: 11.43 – 11.88 zone
📌 A clean break above 11.43 (MA25) would strengthen the recovery
📌 A drop back below 10.64 could put the 10.273 low in play again ⬇️
💡 Final Take:
LINK is in a high-volatility phase where emotional decisions are the costliest mistakes 🧘 Wait for confirmation, manage your risk carefully, and stay patient. The market rewards discipline, not prediction 💎
#LINK #Chainlink #LINKUSDT #CryptoMarket #Binance
Trade here 👇 👇 👇
$LINK
{spot}(LINKUSDT)
Chainlink Recovers Toward $11.20 After Sharp Sell-Off: Can LINK Reclaim Its Range? 📊
$LINK | LINK/USDT
💰 Price: 11.167
📉 24H Change: -0.12%
📊 24H High: 11.300
📉 24H Low: 10.273
💵 24H Volume (USDT): 75.07M
⚠️ Market Breakdown (4H Timeframe):
Chainlink has gone through a sharp sell-off followed by a steady rebound, and the 4H chart shows exactly where buyers stepped back in 🔍
🔻 Price was rejected near the 12.016 high and dropped hard from there
🔻 One large red candle broke through the range and pushed price down to the 10.273 low in a single move
🟢 A long lower wick near 10.273 shows strong demand, and a series of green candles followed 🧲
🟢 Price has recovered most of the drop and is now consolidating near 11.17
📉 Moving Averages Tell the Story:
📌 MA(7): 11.013
📌 MA(25): 11.427
📌 MA(99): 11.879
✅ Price is trading above MA(7), which is a short-term positive
❌ Price is still below MA(25) and MA(99)
❌ MA(25) and MA(99) are sloping downward and sit above price as resistance
⚠️ The broader structure is recovering, but not yet reversed 🐻
📊 Volume Insight:
🔴 Volume spiked heavily on the breakdown candle
💥 This points to forced liquidations and aggressive selling rather than a slow decline
🟢 Buying volume picked up during the rebound, which shows real demand stepping in
⚠️ Volume has cooled off on the latest candles, so watch for a pickup on the next move
🧠 What This Means:
This looks like a leverage flush followed by a solid recovery attempt. Weak longs were shaken out, and LINK has now reclaimed a large part of the drop ⚖️
🔹 Short-term trend: Recovering
🔹 Momentum: Improving but capped by overhead resistance
🔹 Market emotion: Cautiously optimistic 😌
🎯 Key Levels to Watch:
🟢 Support: 10.64 – 11.01 zone
🔴 Resistance: 11.43 – 11.88 zone
📌 A clean break above 11.43 (MA25) would strengthen the recovery
📌 A drop back below 10.64 could put the 10.273 low in play again ⬇️
💡 Final Take:
LINK is in a high-volatility phase where emotional decisions are the costliest mistakes 🧘 Wait for confirmation, manage your risk carefully, and stay patient. The market rewards discipline, not prediction 💎
#LINK #Chainlink #LINKUSDT #CryptoMarket #Binance
Trade here 👇 👇 👇
$LINK
5

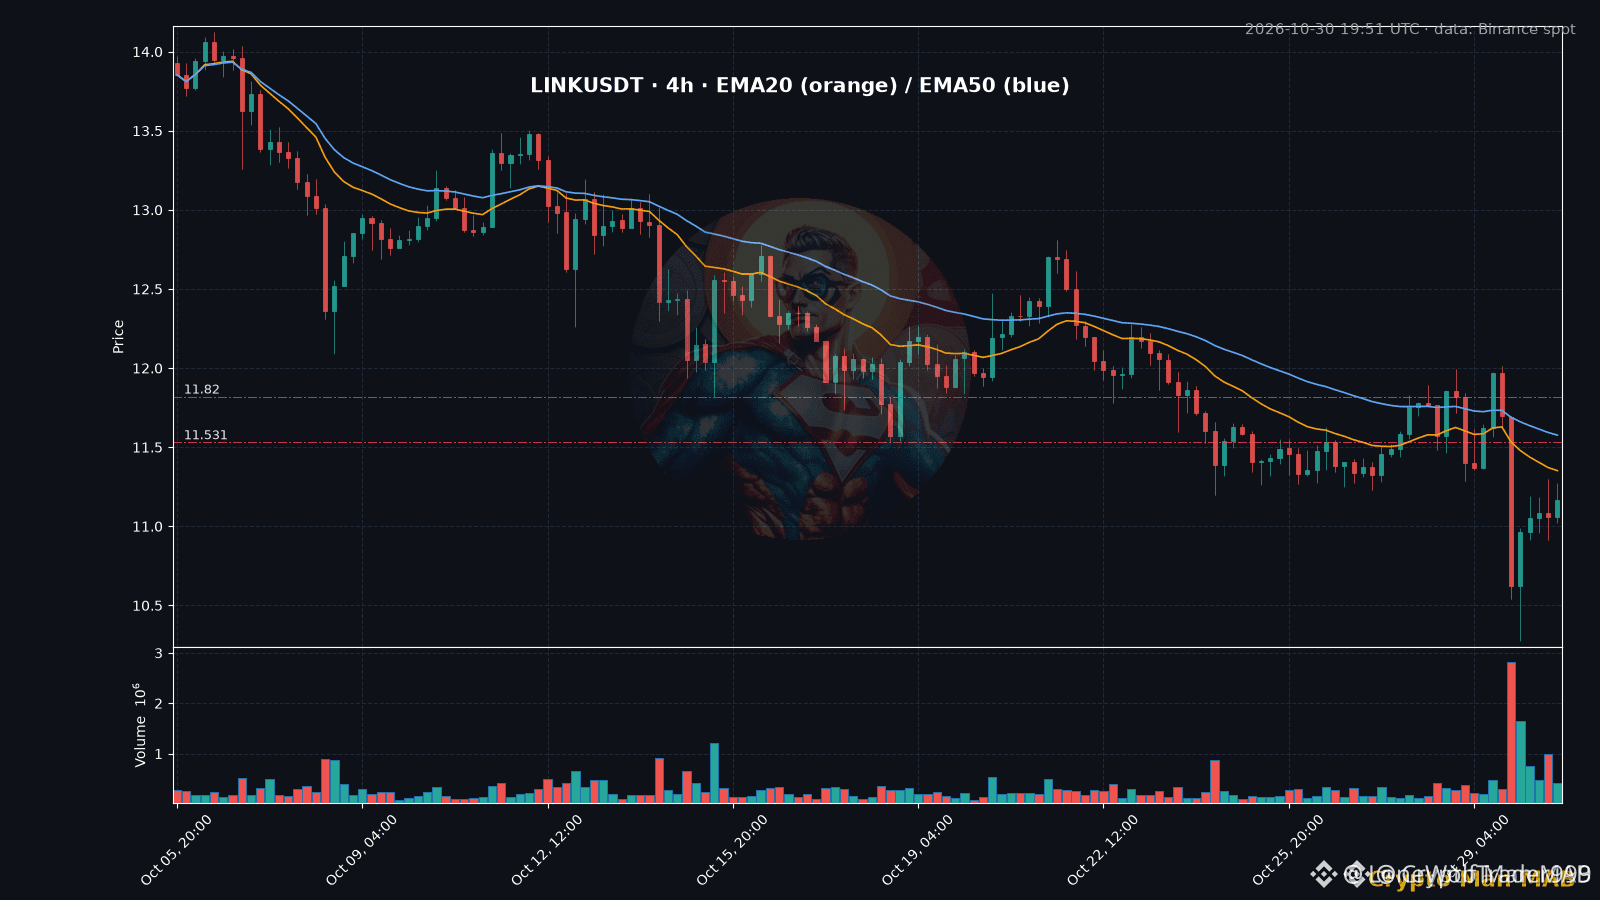
🚨 $LINK CRACKS KEY RANGE SUPPORT AS WEAK RELIEF BOUNCE RISKS DEEPER FLUSH! 📉
Entry: 10.90 ⚡
Target: 10.27 🎯
Stop Loss: 11.53 🛑
📌 The consolidation box between 11.25 and 12 finally cracked yesterday on the heaviest four-hour seller volume seen in weeks, sliding from 11.70 to 10.54 before wicking 10.27.
📊 This relief bounce looks exhausted, pinned under the previous floor around 11 to 11.30 with both EMAs pointing down. 💡 The 11.30 to 11.50 zone decides the trend: a close over 11.53 invalidates the breakdown, but losing 10.90 targets that 10.27 wick again.
💬 Are you shorting the loss of 10.90, or waiting for buyers to reclaim 11.53? 👇
⚠️ Not financial advice. Always manage your risk. 🛡️
🏷️ #LINK #ShortSetup #Chainlink #Breakdown #Crypto
🎯 📉
1

·
--
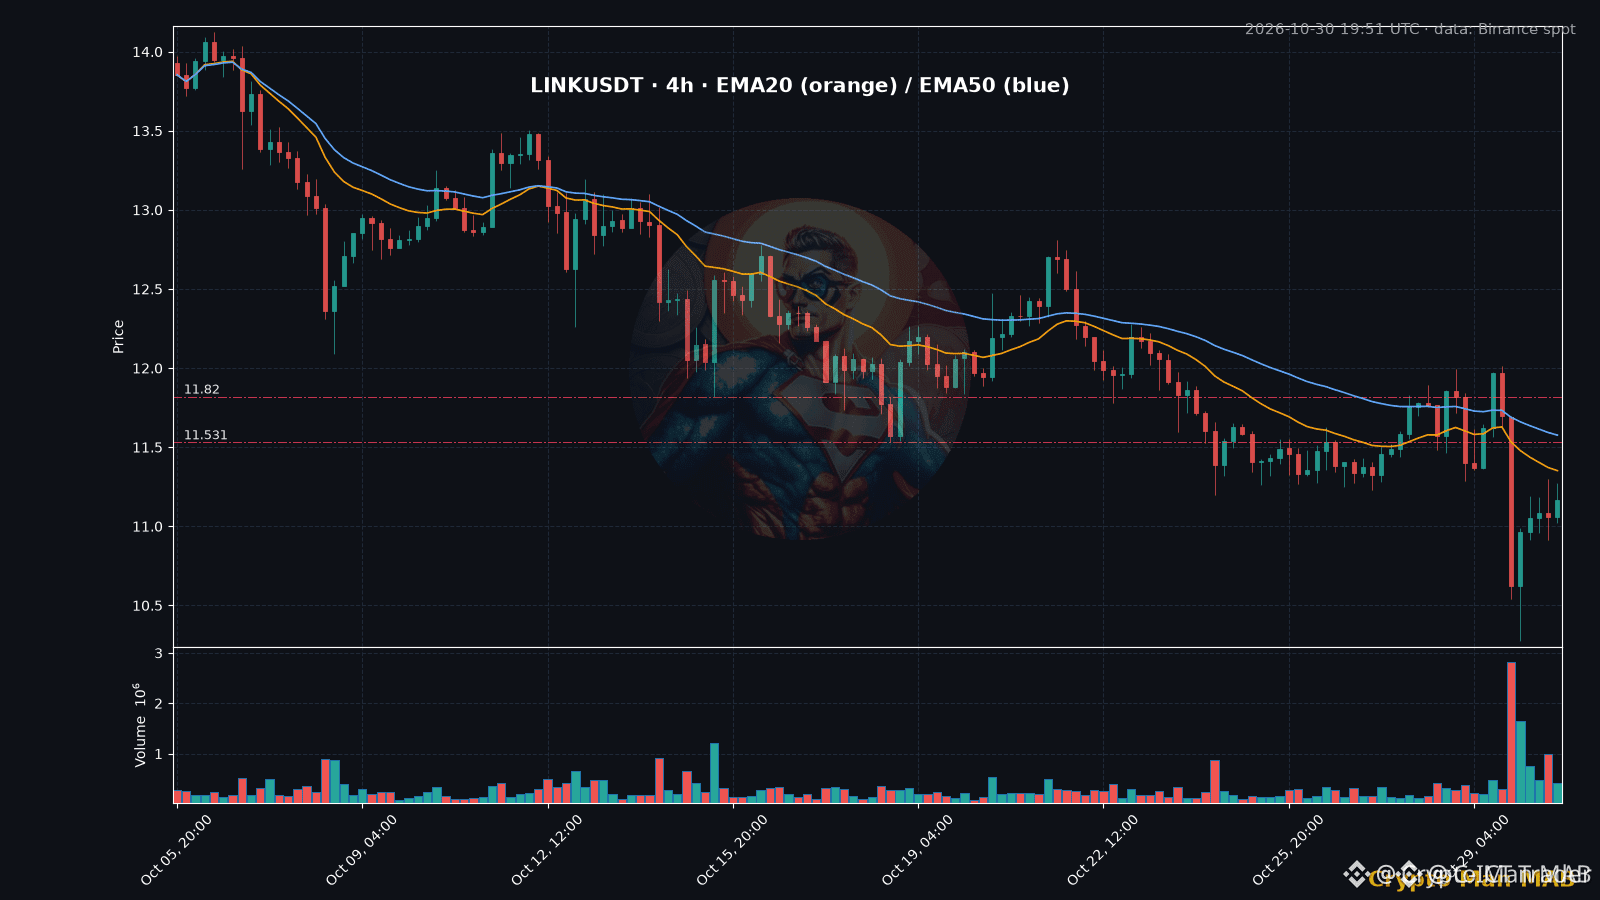
🚨 $LINK BREAKS STRUCTURAL RANGE AS EXHAUSTED BOUNCE THREATENS 10.90 BREAKDOWN 📉
Entry: 10.90 ⚡
Target: 10.27 🎯
Stop Loss: 11.53 ⚠️
📌 The 11.25 to 12.00 distribution box finally gave way on heavy institutional volume, driving price from 11.70 down to 10.54 before an initial sweep at 10.27. However, the subsequent bounce is stalling directly beneath the prior support floor at 11.00 to 11.30, with downward-sloping 4H EMAs capping recovery momentum.
🔍 The structural pivot sits at 11.30 to 11.50, where only a sustained 4H close over 11.53 confirms a fakeout. Otherwise, losing 10.90 on a close opens the door for order flow to revisit the 10.27 wick low. 💬 Are you positioning for a structural reclaim above 11.53, or do you see sellers sweeping that 10.27 liquidity pool? 👇
⚠️ Not financial advice. Always manage your risk. 🛡️
🏷️ #LINK #ShortSetup #PriceAction #MarketStructure #Crypto
🎯 🦈
4

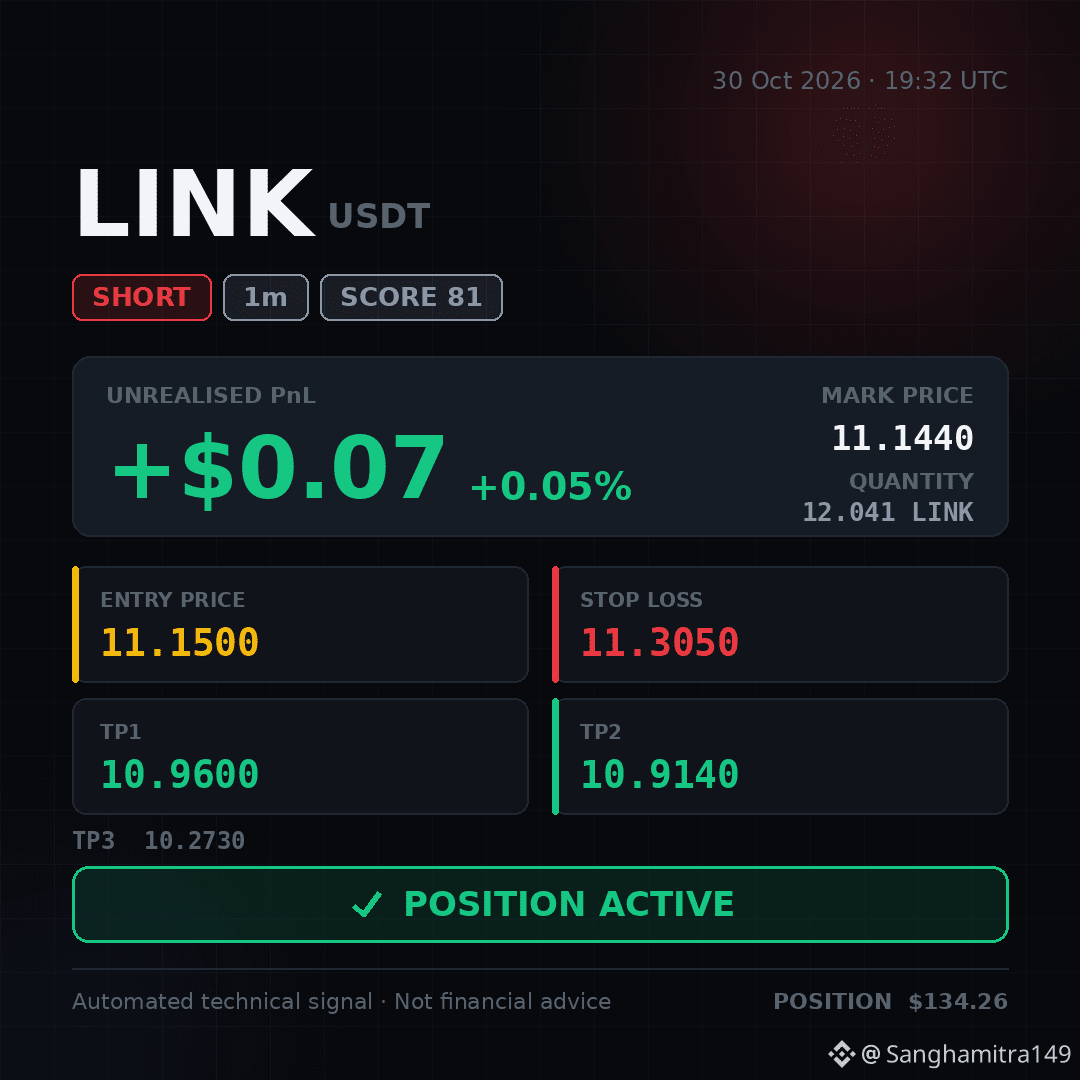
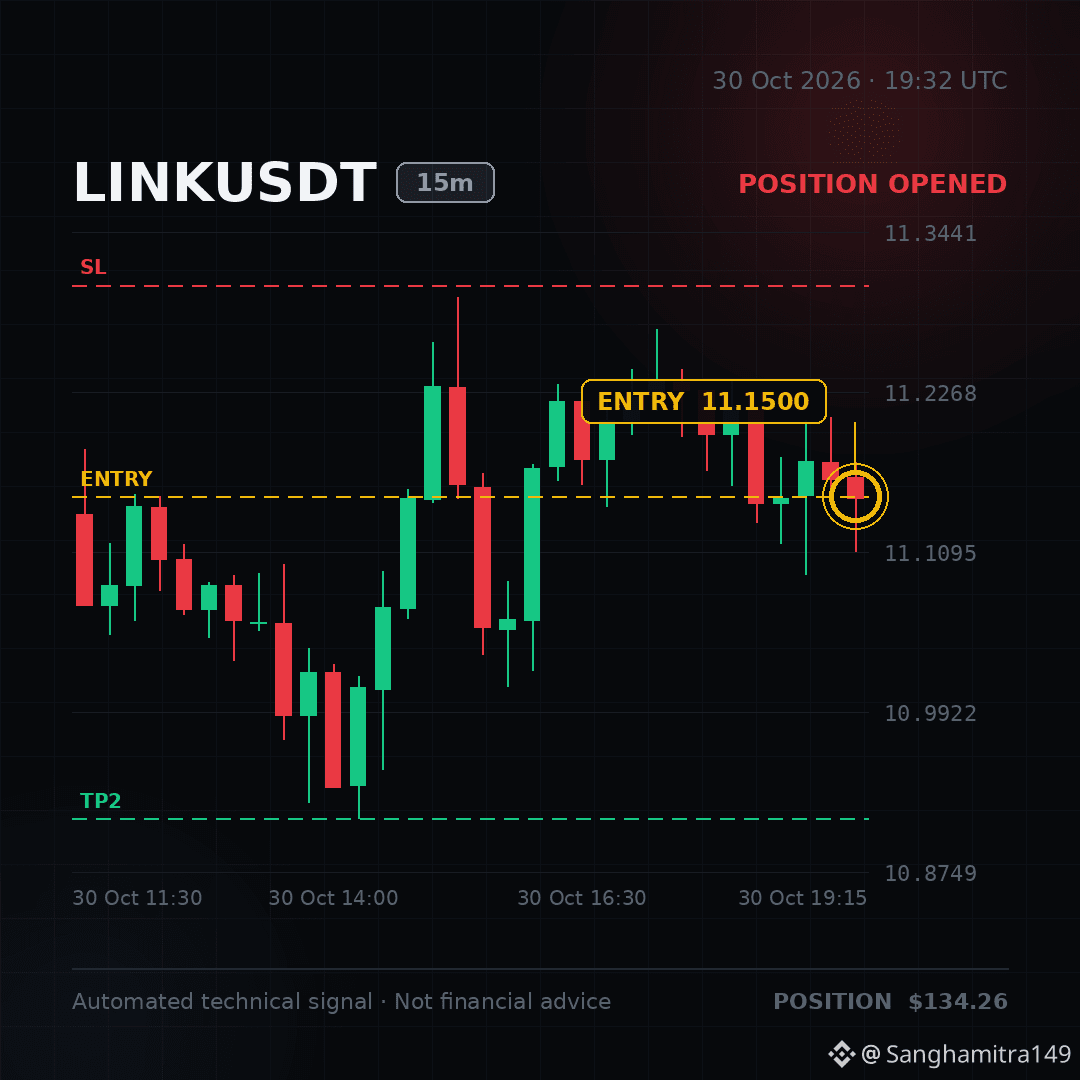
✅ POSITION ACTIVE — I've taken this short. Running at +0.05%.
🚨 #LINK SMC Liquidation Sweep Signals Drop! 🤯🩸
I'm shorting this position. $LINK 👇
Short..... First..... Thank meee... Later.....‼️‼️‼️
Entry: 11.1500 – 11.1590
Stop-loss: 11.3050
🟢 TP1: 10.9600
🟢 TP2: 10.9140
🟢 TP3: 10.2730
Join me in this trade! 👇⬇️⬇️ Short.. With meee...👇⬇️ $LINK
🚨 #LINK SMC Liquidation Sweep Signals Drop! 🤯🩸
I'm shorting this position. $LINK 👇
Short..... First..... Thank meee... Later.....‼️‼️‼️
Entry: 11.1500 – 11.1590
Stop-loss: 11.3050
🟢 TP1: 10.9600
🟢 TP2: 10.9140
🟢 TP3: 10.2730
Join me in this trade! 👇⬇️⬇️ Short.. With meee...👇⬇️ $LINK
1

·
--
Bearish
🚨 LINK/USDT — SPOT TRADING SIGNAL
💰 Price: ~$11.24
📉 24H Change: -4.89%
🔴 Market Bias: Bearish
🟡 SIGNAL: WAIT
🔑 Support: $10.27
🚧 Resistance: $11.29
📊 1H & 4H trends remain weak. A short-term bounce is not enough to confirm a reversal.
✅ BUY Trigger: 4H candle close above $11.29 + successful retest + strong volume.
🛑 Entry / SL / TP: Awaiting confirmation. No guessing.
Spot only. Risk max 0.5–1%. Protect your capital.
🎁 Voluntary Gifts are appreciated!
#LINK #Chainlink #SpotSignal #CryptoTrading
$LINK
{spot}(LINKUSDT)
🚨 LINK/USDT — SPOT TRADING SIGNAL
💰 Price: ~$11.24
📉 24H Change: -4.89%
🔴 Market Bias: Bearish
🟡 SIGNAL: WAIT
🔑 Support: $10.27
🚧 Resistance: $11.29
📊 1H & 4H trends remain weak. A short-term bounce is not enough to confirm a reversal.
✅ BUY Trigger: 4H candle close above $11.29 + successful retest + strong volume.
🛑 Entry / SL / TP: Awaiting confirmation. No guessing.
Spot only. Risk max 0.5–1%. Protect your capital.
🎁 Voluntary Gifts are appreciated!
#LINK #Chainlink #SpotSignal #CryptoTrading
$LINK
48

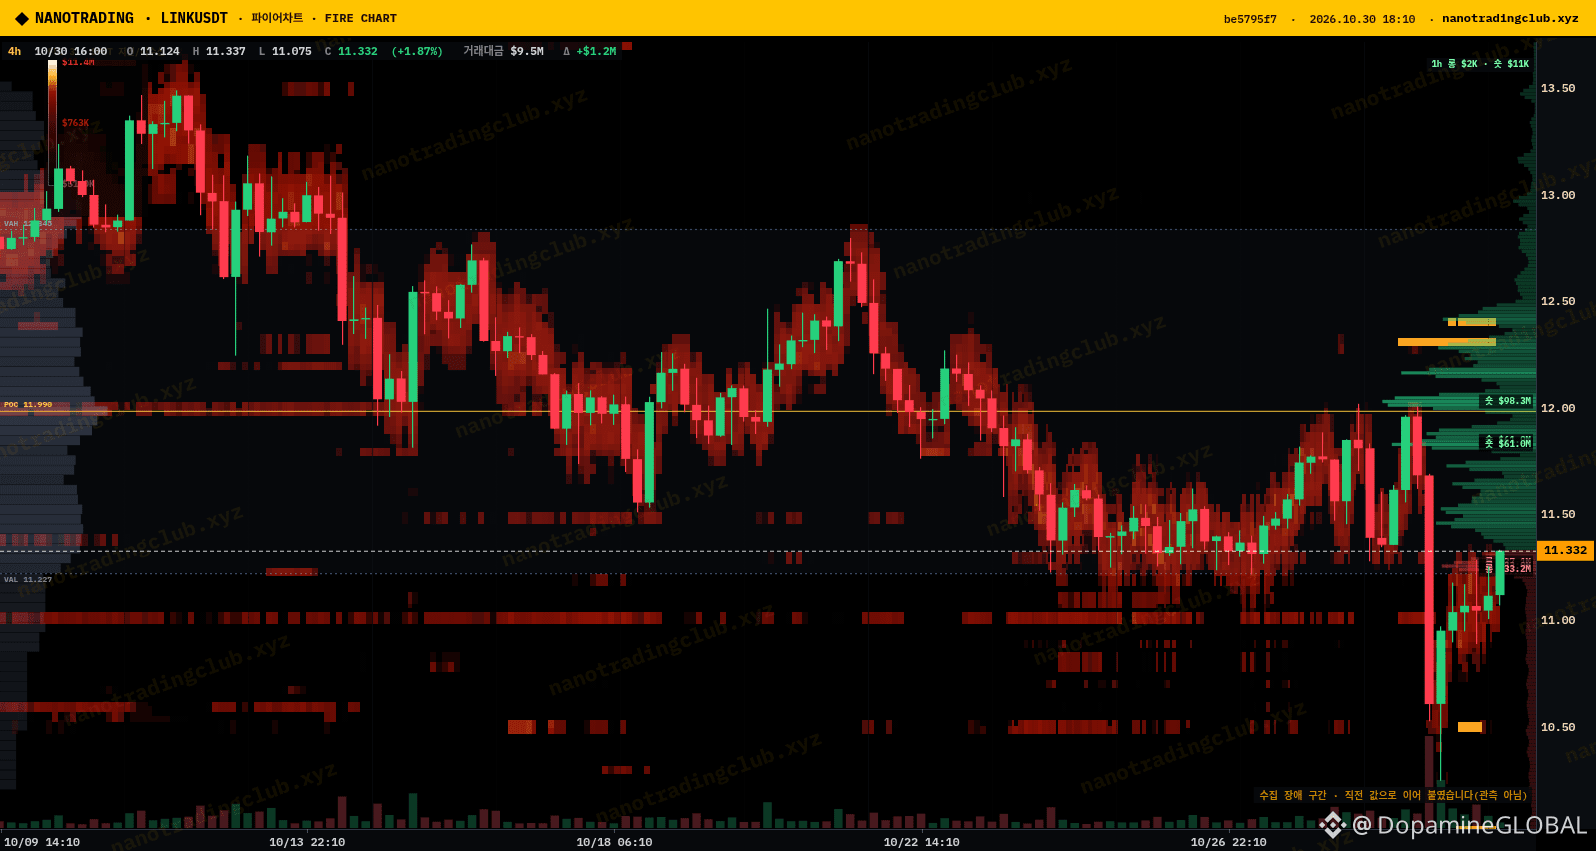
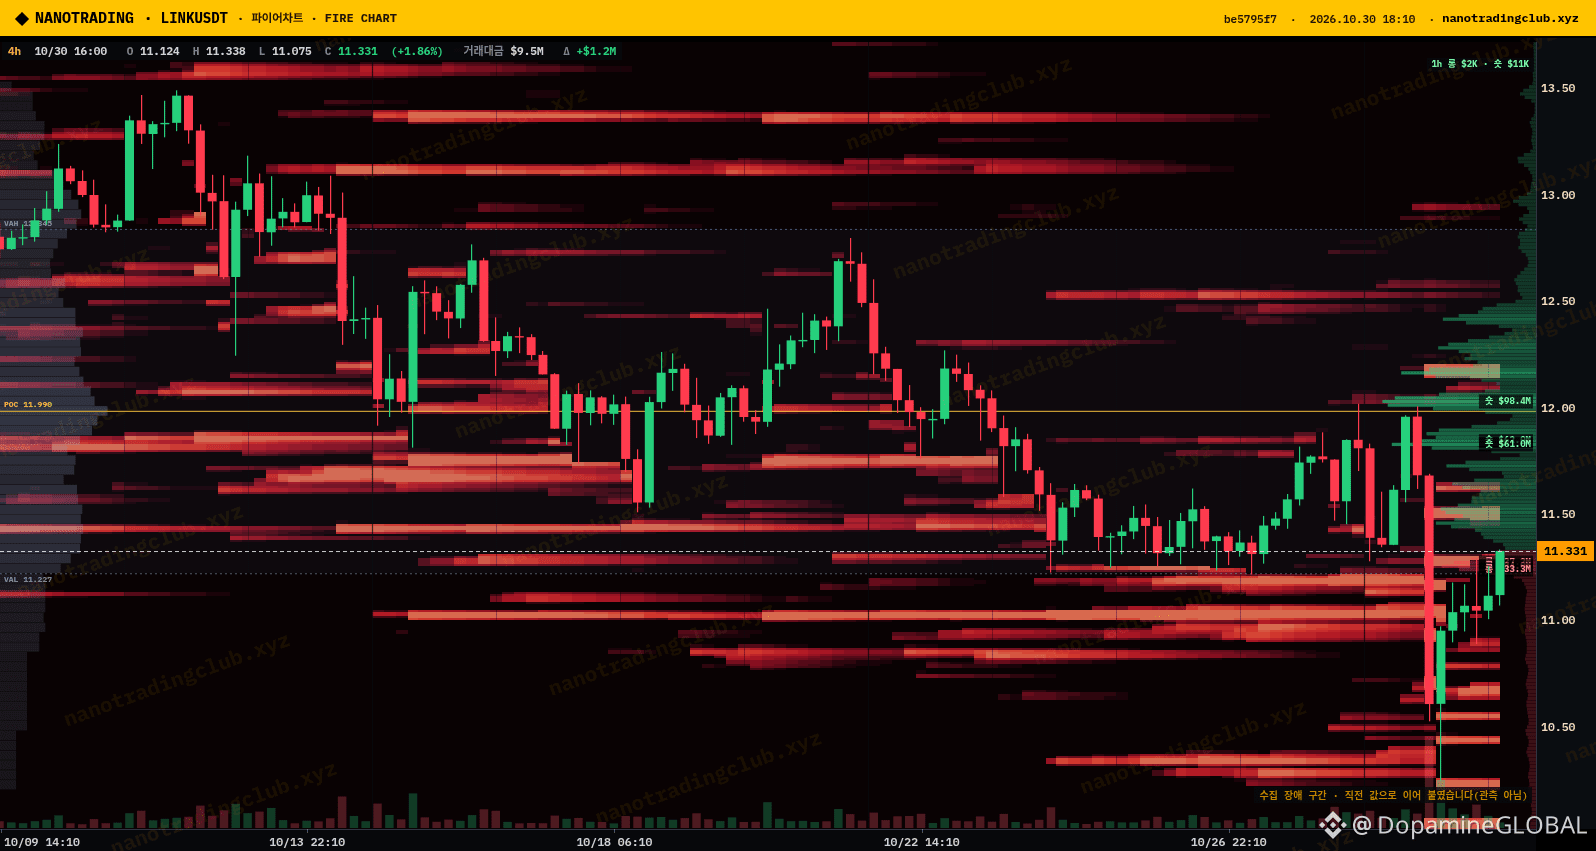
$LINK got flushed from ~11.96 to a 10.25 wick yesterday and has quietly clawed almost all of it back. Sitting around 11.31 now, +3.5% on the day on Binance futures.
What I like about this bounce: OI didn't chase it. Open interest slid from ~$93.7M to ~$89M across the last few 4h prints while price recovered, so this doesn't look like late longs piling in. Funding is barely positive (~0.002%), retail is ~63% long accounts and top traders ~61% long on positions. Leaning long, not crowded.
NanoTrading Fire chart 4h has the ceiling pretty clearly marked. Short-side walls of $61.0M around 11.85-11.90 and $98.3M right at 12.00, with POC ~11.99 sitting on the same spot. Below, the liquidation heatmap's thickest band is 11.00-11.10, then 10.60-10.70 near the wick low.
My read: 11.0-11.1 is the line to hold. If it does, I think $LINK goes back to test that 12.00 stack, and acceptance above it opens the 12.2-12.35 liq bands. Lose 11.0 and the 10.6 band is next 👀
Do you think 12.00 breaks on the first try or rejects?
NFA, just my chart notes.
Source: NanoTrading Fire chart (nanotradingclub.xyz)
#LINK #Chainlink #NanoTrading
49
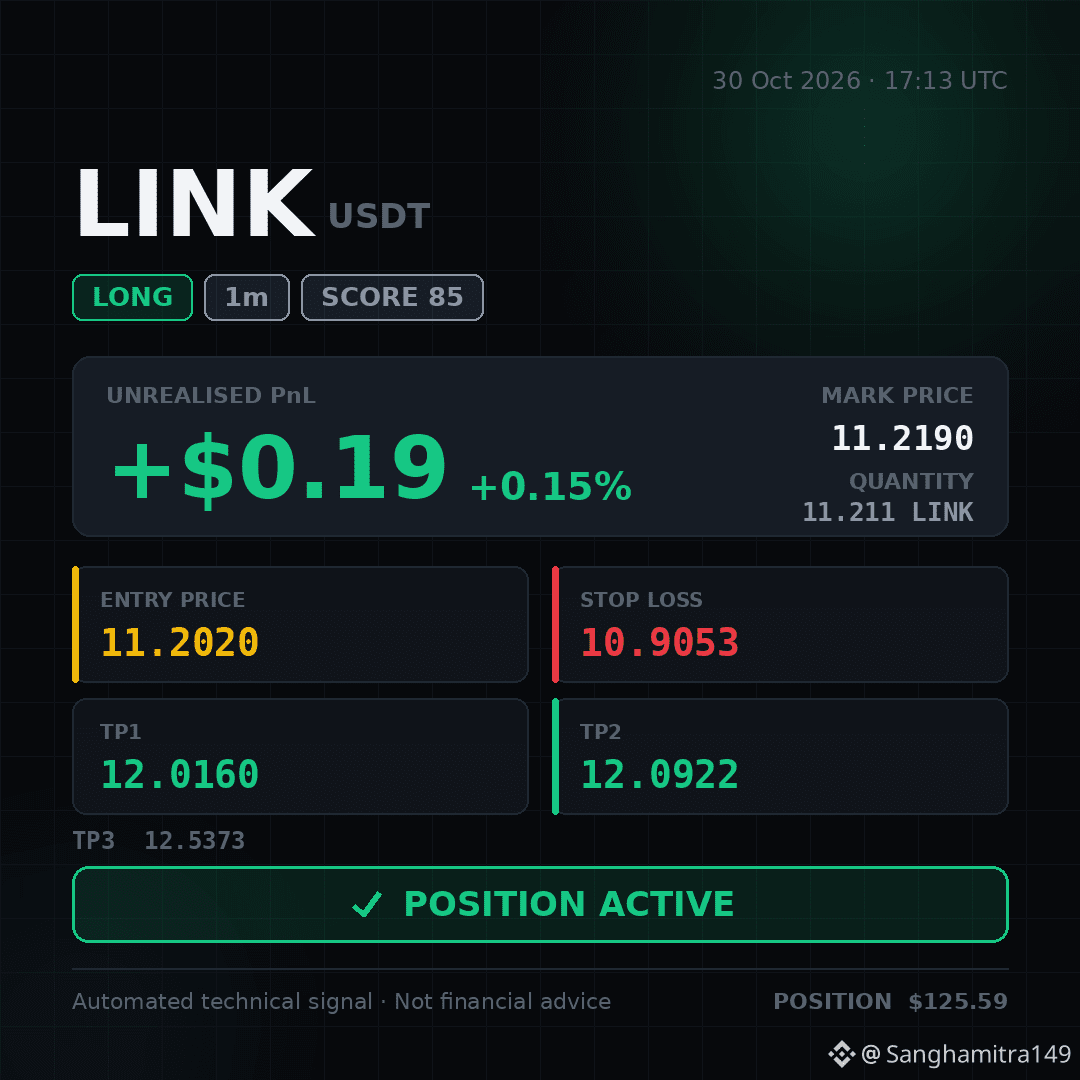
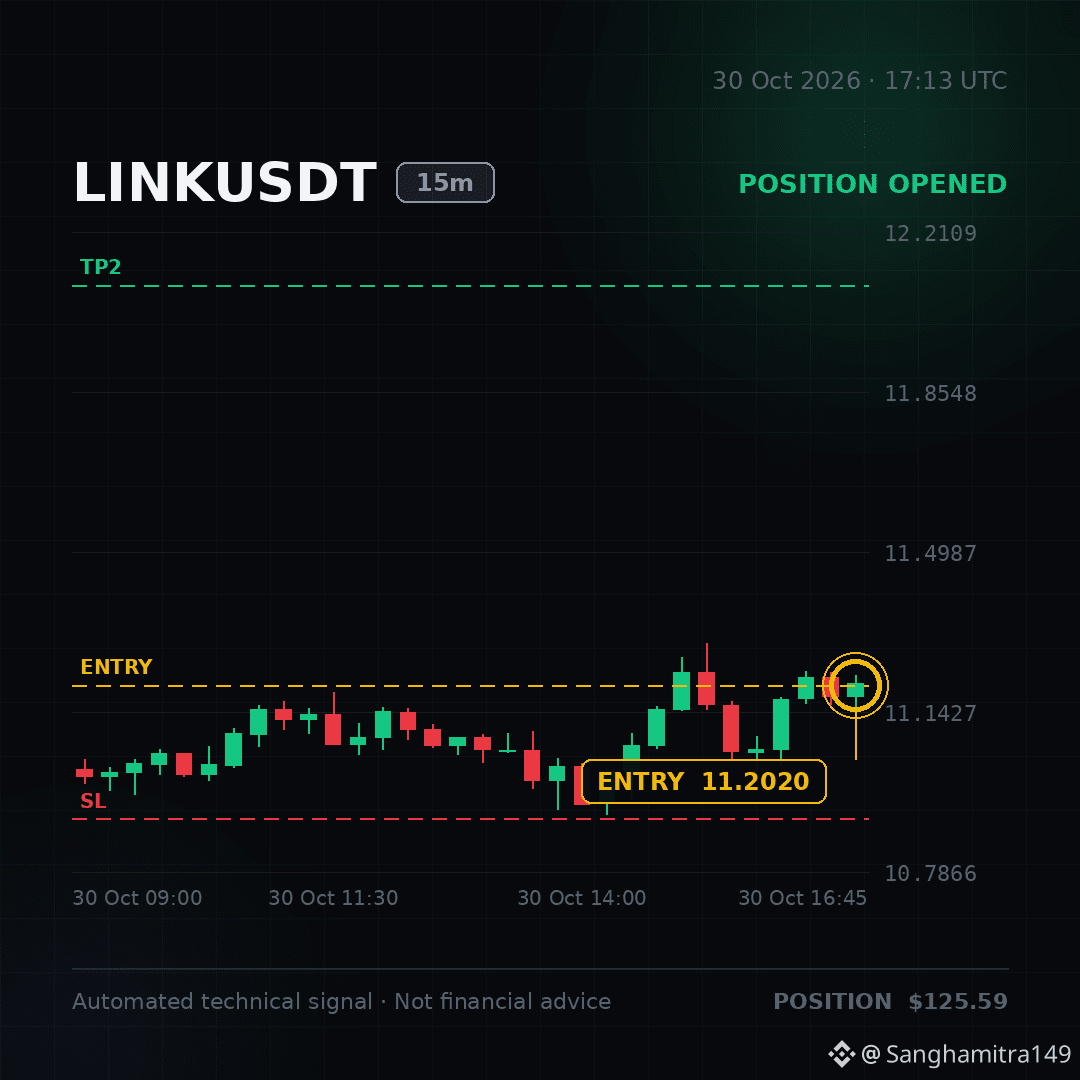
✅ POSITION ACTIVE — I've taken this long. Running at +0.15%.
🚨 #LINK SMC Liquidity Sweep Ignites Bull Run! 🤯⚡
I’m grabbing this bullish wave! $LINK 👇
Long..... First... Let’s roll... Thank meee... Later........‼️‼️‼️
Entry: 11.1950 – 11.2020
Stop-loss: 10.9053
🟢 TP1: 12.0160
🟢 TP2: 12.0922
🟢 TP3: 12.5373
Join me and ride this wave! 👇⬇️⬇️ Long.. With meee...👇⬇️ $LINK
1

·
--
👀 The Crypto Project Behind Smart Data!
Chainlink is working on something the blockchain ecosystem genuinely needs: reliable data connections between blockchains and the real world.
Sometimes the projects powering the infrastructure deserve more attention than the loudest coins.
Is $LINK on your watchlist?
#LINK #Chainlink #blockchain #crypto
58

·
--
$LINK #LINK
LINK is quietly one of the weakest majors this week, down almost 10 percent in 7 days.
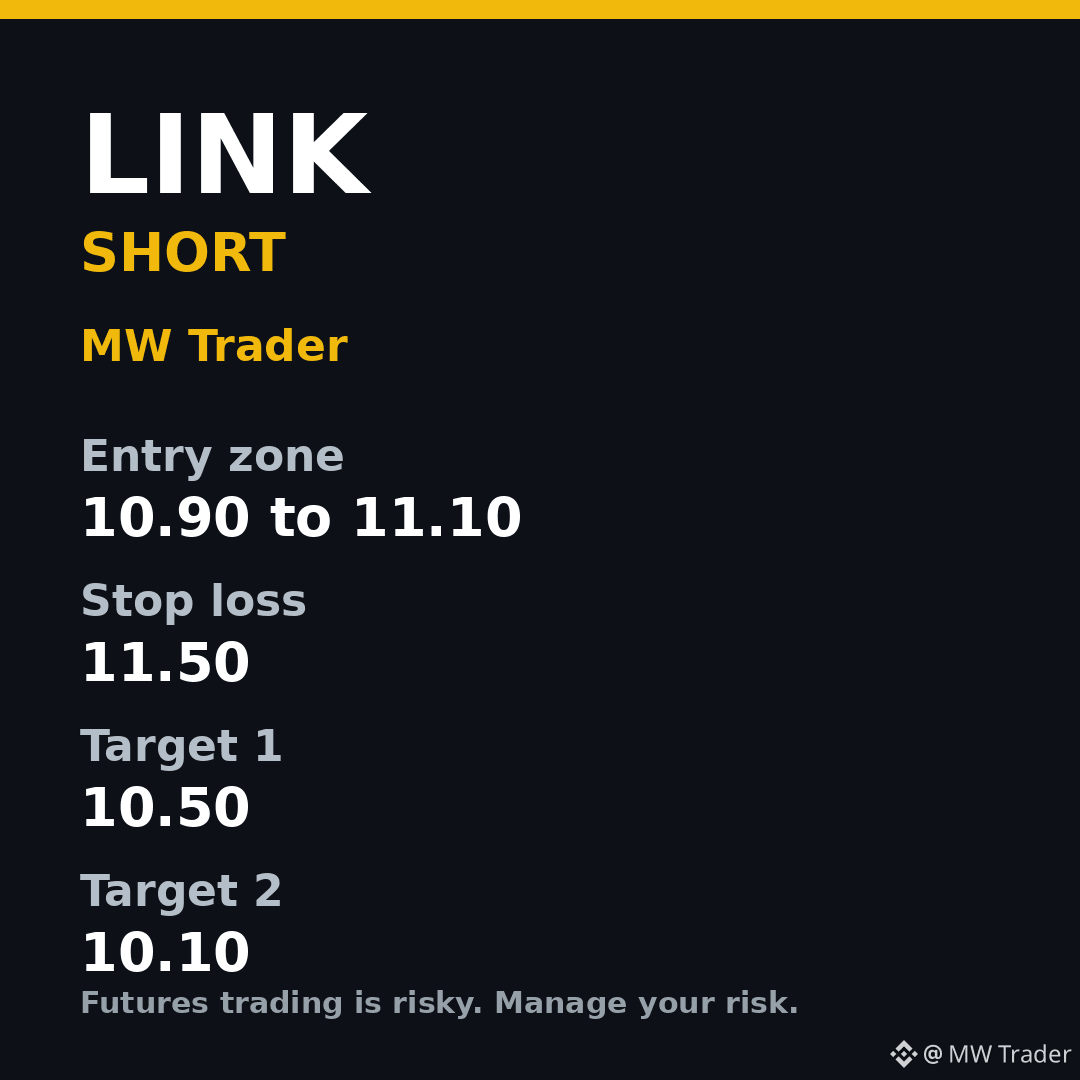
Chainlink is near $11.02, down 3.40 percent in 24 hours and down 9.77 percent over 7 days, according to CoinGecko. That underperformance matters. In a market where everything is falling, the coins that were already weak before the news usually fall furthest, because there is no strong buyer waiting underneath. LINK has shown no real bounce strength while HYPE and even TRX held up better, so my bias here is short. I would short into 10.90 to 11.10, with a stop above 11.50, because reclaiming 11.50 would tell me buyers are finally stepping in. Targets are 10.50 first, then 10.10 if the weakness continues.
Futures trading is risky, trade small, manage risk, do your own research.
#Chainlink #Crypto #FuturesTrading #TradingSignals
Follow for more trades
Does LINK fall to $10.50 before it reclaims $11.50?
9

·
--
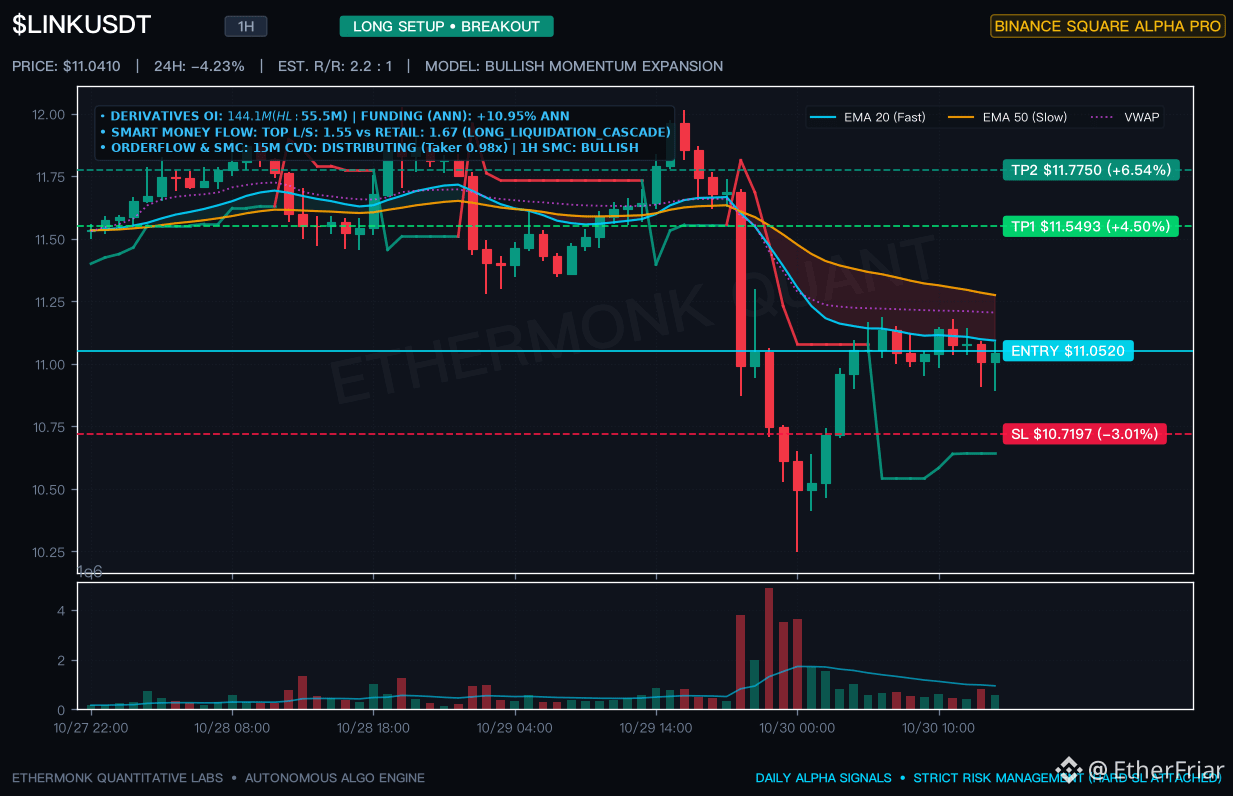
🚨 $LINK trap exposed as retail longs get squeezed at $11.052 (-6.49%) while smart money quietly absorbs volume!
Institutional Microstructure Proof:
• Whale vs Retail Positioning: Top Trader L/S Ratio sits at 1.55 vs Retail Global L/S at 1.67, with annualized funding rate holding at +10.95%.
• Cross-Market Open Interest: Total combined OI reaches $144.1M USD with Hyperliquid DEX commanding $55.52M alongside $349.0M 24h volume.
• OrderFlow & 1H SMC Structure: 15m CVD shows DISTRIBUTING with a 0.98x Taker Buy/Sell Ratio into 1H BULLISH structure supported by Bullish FVG $10.738-$10.902.
Primary Execution Plan (LONG $LINK):
• Entry Zone: $10.820 - $11.052
• TP1: $11.549
• TP2: $11.775
• Hard SL: $10.720
• Risk-Reward: 1.8 : 1
• 7D Backtest Win Rate: 52.0%
Flip Scenario (SHORT Trigger):
If 1H closes beyond $10.720, invalidate the long thesis and flip SHORT $LINK targeting $10.250.
👇 Tap $LINK below to inspect live orderbook depth and set your limit orders before the next volatility squeeze!
#LINK #CryptoTrading #BinanceSquare
🚨 $LINK trap exposed as retail longs get squeezed at $11.052 (-6.49%) while smart money quietly absorbs volume!
Institutional Microstructure Proof:
• Whale vs Retail Positioning: Top Trader L/S Ratio sits at 1.55 vs Retail Global L/S at 1.67, with annualized funding rate holding at +10.95%.
• Cross-Market Open Interest: Total combined OI reaches $144.1M USD with Hyperliquid DEX commanding $55.52M alongside $349.0M 24h volume.
• OrderFlow & 1H SMC Structure: 15m CVD shows DISTRIBUTING with a 0.98x Taker Buy/Sell Ratio into 1H BULLISH structure supported by Bullish FVG $10.738-$10.902.
Primary Execution Plan (LONG $LINK ):
• Entry Zone: $10.820 - $11.052
• TP1: $11.549
• TP2: $11.775
• Hard SL: $10.720
• Risk-Reward: 1.8 : 1
• 7D Backtest Win Rate: 52.0%
Flip Scenario (SHORT Trigger):
If 1H closes beyond $10.720, invalidate the long thesis and flip SHORT $LINK targeting $10.250.
👇 Tap $LINK below to inspect live orderbook depth and set your limit orders before the next volatility squeeze!
#LINK #CryptoTrading #BinanceSquare
1
Log in to explore more content
Join global crypto users on Binance Square
⚡️ Get latest and useful information about crypto.
💬 Trusted by the world’s largest crypto exchange.
👍 Discover real insights from verified creators.
Email / Phone number
Trending Topics
1
#UniswapA16zSeekDeFiExemptionFromIllinoisCryptoTax
31,752 views
829 Discussing
2
#HKDollarStablecoinHKDAPToLaunchOnSolana
23,555 views
534 Discussing
3
#$1.5BInLeveragedCryptoBetsLiquidated
50,358 views
264 Discussing
4
#TrezorSaysCryptoBilisSoldWalletMayContainMaliciousComponents
4,293 views
81 Discussing
5
#KOSPIFalls3.53%BackBelow6000
68,184 views
1,138 Discussing
6
#AmazonSharesFallAbout7%InPremarketTrading
31,448 views
623 Discussing
7
#USMidtermElections
268,884 views
2,405 Discussing
8
#StrategySTRCReaches$99.95ForFirstTimeIn165Days
33,419 views
96 Discussing
9
#BinanceWillListPredictPREDICT
103,604 views
1,439 Discussing
10
#SwitzerlandFirstSpotBitcoinETFExpectedToTradeInNovember
3,352 views
114 Discussing