

#ustreasurydoublesbuybackcapto$4b
ustreasurydoublesbuybackcapto$4b
13,257 views
80 Discussing
Hot
Latest

·
--
#USTreasuryDoublesBuybackCapTo$4B THIS IS INSANE.
🤯
The bond market just found out how big Bessent's bazooka actually is.
Here's what happened:
-
Treasury just doubled its buyback size from $2 billion to
at least $4 billion per operation
- The relief lasted about a day. The 30 year yield snapped back
to
roughly 5.25%
- CNBC now reports Treasury could tap its nearly $1 trillion General Account to fund much bigger buybacks
- That $1 trillion is 250 times the size of the buyback bump that already failed to hold
The part nobody's saying out loud: the Fed didn't do any of this. This entire move sits with Treasury, using cash it already has sitting in its own account, not new money printed, not a rate cut, not QE.
That matters because it means the Fed's hands stay clean while Treasury quietly does the heavy lifting on long-term yields.
And pulling nearly a trillion dollars out of that account doesn't just buy bonds. It pushes real liquidity into the system, the same kind of liquidity that tends to show up in stocks and crypto a few weeks later.
None of the trillion has actually been committed yet. This is Treasury showing the market what it's capable of, not what it's already done.
But the bond market just got a very expensive preview of the ceiling$ADIL.US $KNRX.US $RDAC.US
#USTreasuryDoublesBuybackCapTo$4B THIS IS INSANE.
🤯
The bond market just found out how big Bessent's bazooka actually is.
Here's what happened:
-
Treasury just doubled its buyback size from $2 billion to
at least $4 billion per operation
- The relief lasted about a day. The 30 year yield snapped back
to
roughly 5.25%
- CNBC now reports Treasury could tap its nearly $1 trillion General Account to fund much bigger buybacks
- That $1 trillion is 250 times the size of the buyback bump that already failed to hold
The part nobody's saying out loud: the Fed didn't do any of this. This entire move sits with Treasury, using cash it already has sitting in its own account, not new money printed, not a rate cut, not QE.
That matters because it means the Fed's hands stay clean while Treasury quietly does the heavy lifting on long-term yields.
And pulling nearly a trillion dollars out of that account doesn't just buy bonds. It pushes real liquidity into the system, the same kind of liquidity that tends to show up in stocks and crypto a few weeks later.
None of the trillion has actually been committed yet. This is Treasury showing the market what it's capable of, not what it's already done.
But the bond market just got a very expensive preview of the ceiling$ADIL.US $KNRX.US $RDAC.US
🤯
The bond market just found out how big Bessent's bazooka actually is.
Here's what happened:
-
Treasury just doubled its buyback size from $2 billion to
at least $4 billion per operation
- The relief lasted about a day. The 30 year yield snapped back
to
roughly 5.25%
- CNBC now reports Treasury could tap its nearly $1 trillion General Account to fund much bigger buybacks
- That $1 trillion is 250 times the size of the buyback bump that already failed to hold
The part nobody's saying out loud: the Fed didn't do any of this. This entire move sits with Treasury, using cash it already has sitting in its own account, not new money printed, not a rate cut, not QE.
That matters because it means the Fed's hands stay clean while Treasury quietly does the heavy lifting on long-term yields.
And pulling nearly a trillion dollars out of that account doesn't just buy bonds. It pushes real liquidity into the system, the same kind of liquidity that tends to show up in stocks and crypto a few weeks later.
None of the trillion has actually been committed yet. This is Treasury showing the market what it's capable of, not what it's already done.
But the bond market just got a very expensive preview of the ceiling$ADIL.US $KNRX.US $RDAC.US

RDACUS+0.72%
ADILUS-0.60%
KNRXUS-16.51%
220

·
--
Bullish
#USTreasuryDoublesBuybackCapTo$4B
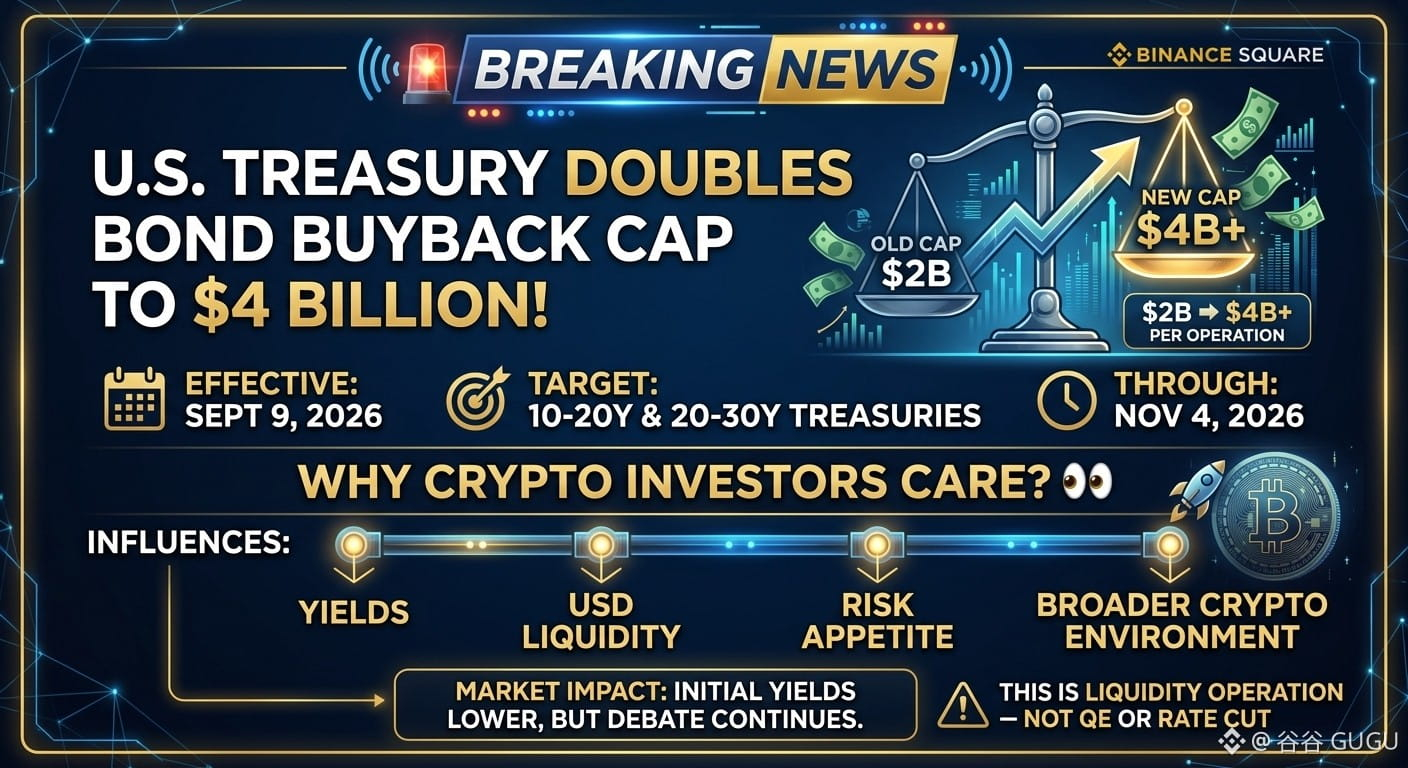
🚨 BREAKING: U.S. Treasury Doubles Long-Term Bond Buyback Cap to $4 BILLION
The U.S. Treasury has announced that it will at least double the size of its liquidity-support buyback operations for longer-dated bonds.
📈 Buyback cap: $2B ➜ at least $4B per operation
📅 Effective: September 9, 2026
🎯 Target: 10–20 year and 20–30 year Treasury securities
⏳ Current period: Through November 4, 2026
The official goal is to provide greater liquidity support to the long end of the Treasury market. This is important because long-term yields had recently surged, putting pressure on government borrowing costs and broader financial markets.
Why should crypto investors care? 👀
A major move in the U.S. bond market can influence:
🔹 Treasury yields
🔹 U.S. dollar liquidity
🔹 Risk appetite
🔹 Gold and equity markets
🔹 Ultimately, the broader environment in which #Bitcoin and #crypto trade
After the announcement, long-term yields initially moved lower, although analysts remain divided on whether buybacks alone can solve deeper concerns around U.S. debt and fiscal pressures.
⚠️ Important: This is a Treasury market-liquidity operation—not a direct Federal Reserve rate cut or a new QE program.
The bigger question now:
If long-term yields remain under pressure, could the Treasury increase support even further?
👀 Watch the bond market closely. Macro moves often reach crypto sooner or later.
Bullish or bearish for $BTC and crypto? Drop your view below. 👇
$ZEC $BTC
{future}(ZECUSDT)
{future}(BTCUSDT)
#USTreasuryDoublesBuybackCapTo$4B
🚨 BREAKING: U.S. Treasury Doubles Long-Term Bond Buyback Cap to $4 BILLION
The U.S. Treasury has announced that it will at least double the size of its liquidity-support buyback operations for longer-dated bonds.
📈 Buyback cap: $2B ➜ at least $4B per operation
📅 Effective: September 9, 2026
🎯 Target: 10–20 year and 20–30 year Treasury securities
⏳ Current period: Through November 4, 2026
The official goal is to provide greater liquidity support to the long end of the Treasury market. This is important because long-term yields had recently surged, putting pressure on government borrowing costs and broader financial markets.
Why should crypto investors care? 👀
A major move in the U.S. bond market can influence:
🔹 Treasury yields
🔹 U.S. dollar liquidity
🔹 Risk appetite
🔹 Gold and equity markets
🔹 Ultimately, the broader environment in which #Bitcoin and #crypto trade
After the announcement, long-term yields initially moved lower, although analysts remain divided on whether buybacks alone can solve deeper concerns around U.S. debt and fiscal pressures.
⚠️ Important: This is a Treasury market-liquidity operation—not a direct Federal Reserve rate cut or a new QE program.
The bigger question now:
If long-term yields remain under pressure, could the Treasury increase support even further?
👀 Watch the bond market closely. Macro moves often reach crypto sooner or later.
Bullish or bearish for $BTC and crypto? Drop your view below. 👇
$ZEC $BTC
🚨 BREAKING: U.S. Treasury Doubles Long-Term Bond Buyback Cap to $4 BILLION
The U.S. Treasury has announced that it will at least double the size of its liquidity-support buyback operations for longer-dated bonds.
📈 Buyback cap: $2B ➜ at least $4B per operation
📅 Effective: September 9, 2026
🎯 Target: 10–20 year and 20–30 year Treasury securities
⏳ Current period: Through November 4, 2026
The official goal is to provide greater liquidity support to the long end of the Treasury market. This is important because long-term yields had recently surged, putting pressure on government borrowing costs and broader financial markets.
Why should crypto investors care? 👀
A major move in the U.S. bond market can influence:
🔹 Treasury yields
🔹 U.S. dollar liquidity
🔹 Risk appetite
🔹 Gold and equity markets
🔹 Ultimately, the broader environment in which #Bitcoin and #crypto trade
After the announcement, long-term yields initially moved lower, although analysts remain divided on whether buybacks alone can solve deeper concerns around U.S. debt and fiscal pressures.
⚠️ Important: This is a Treasury market-liquidity operation—not a direct Federal Reserve rate cut or a new QE program.
The bigger question now:
If long-term yields remain under pressure, could the Treasury increase support even further?
👀 Watch the bond market closely. Macro moves often reach crypto sooner or later.
Bullish or bearish for $BTC and crypto? Drop your view below. 👇
$ZEC $BTC
1
1
178

·
--
Bullish
#USTreasuryDoublesBuybackCapTo$4B
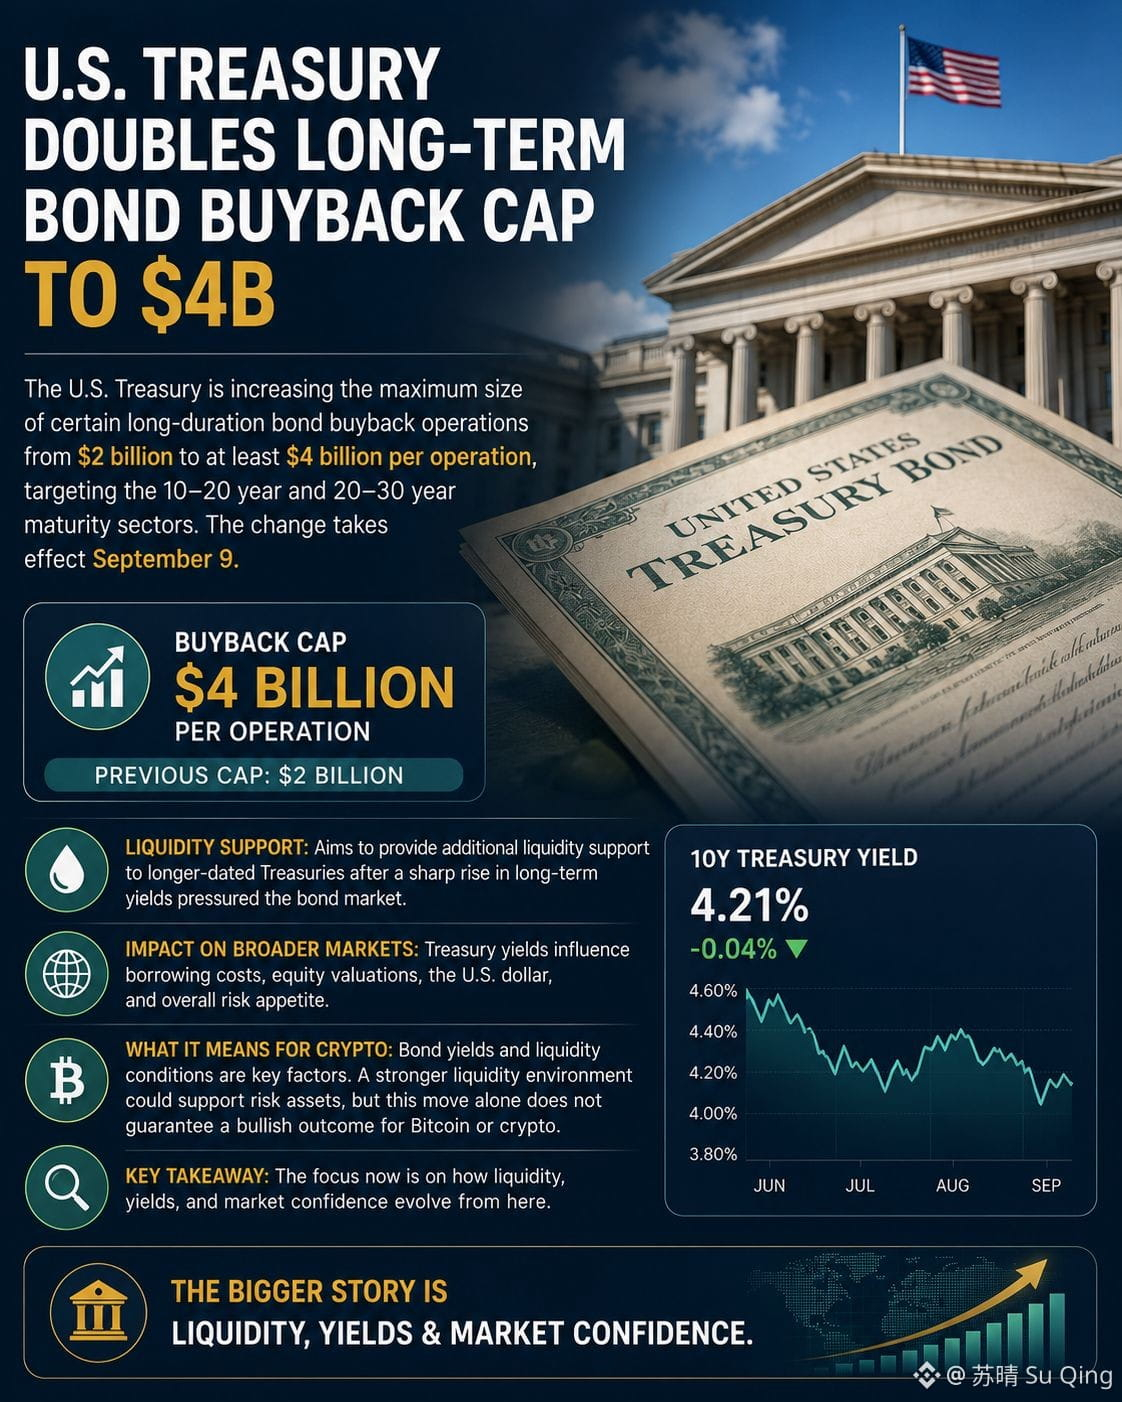
🇺🇸 U.S. Treasury Doubles Long-Term Bond Buyback Cap to $4B
The U.S. Treasury is increasing the maximum size of certain long-duration bond buyback operations from $2 billion to at least $4 billion per operation, targeting the 10–20 year and 20–30 year maturity sectors. The change takes effect September 9.
The move is designed to provide additional liquidity support to longer-dated Treasuries after a sharp rise in long-term yields put pressure on the bond market.
For broader markets, the development is worth watching because Treasury yields influence borrowing costs, equity valuations, the U.S. dollar, and overall risk appetite.
For crypto traders, the key question is how bond yields and liquidity conditions evolve from here. A stronger liquidity environment could influence risk assets, but this move alone does not guarantee a bullish outcome for Bitcoin or crypto.
The bigger story is liquidity, yields, and market confidence.
$FHE
{future}(FHEUSDT)
$COTI
{future}(COTIUSDT)
$SOXS
{future}(SOXSUSDT)
#USTreasuryDoublesBuybackCapTo$4B
🇺🇸 U.S. Treasury Doubles Long-Term Bond Buyback Cap to $4B
The U.S. Treasury is increasing the maximum size of certain long-duration bond buyback operations from $2 billion to at least $4 billion per operation, targeting the 10–20 year and 20–30 year maturity sectors. The change takes effect September 9.
The move is designed to provide additional liquidity support to longer-dated Treasuries after a sharp rise in long-term yields put pressure on the bond market.
For broader markets, the development is worth watching because Treasury yields influence borrowing costs, equity valuations, the U.S. dollar, and overall risk appetite.
For crypto traders, the key question is how bond yields and liquidity conditions evolve from here. A stronger liquidity environment could influence risk assets, but this move alone does not guarantee a bullish outcome for Bitcoin or crypto.
The bigger story is liquidity, yields, and market confidence.
$FHE
$COTI
$SOXS
🇺🇸 U.S. Treasury Doubles Long-Term Bond Buyback Cap to $4B
The U.S. Treasury is increasing the maximum size of certain long-duration bond buyback operations from $2 billion to at least $4 billion per operation, targeting the 10–20 year and 20–30 year maturity sectors. The change takes effect September 9.
The move is designed to provide additional liquidity support to longer-dated Treasuries after a sharp rise in long-term yields put pressure on the bond market.
For broader markets, the development is worth watching because Treasury yields influence borrowing costs, equity valuations, the U.S. dollar, and overall risk appetite.
For crypto traders, the key question is how bond yields and liquidity conditions evolve from here. A stronger liquidity environment could influence risk assets, but this move alone does not guarantee a bullish outcome for Bitcoin or crypto.
The bigger story is liquidity, yields, and market confidence.
$FHE
$COTI
$SOXS
52

·
--
Treasury doubled its long-end buyback cap from $2B to ≥$4B per operation (Sept 9–Nov 4) — and CNBC says it may fund bigger rounds from its ~$950B TGA , a potential ~$1T "Bessent Put". Not QE, but Washington capping its own yield curve with its own checkbook.
Tape: 30Y dropped 9bps to 5.194% on the news → gave it all back to 5.276% . DXY at multi-month lows, gold +5.2%/wk , BTC >$78K with ~$1.4B shorts liquidated .
The line in the sand: ▪ 30Y must hold below 5.30% (19-yr high) — a close above kills the "cap" narrative ▪ Today's 2pm ET presser (a real fiscal number changes everything) · PCE Wed · NVDA Wed · Jackson Hole/Warsh Fri ▪ Buyback ops begin Sept 9
Trade: stay long gold & $BTC while 30Y < 5.30% and DXY stays weak. Invalidation: 30Y closes > 5.30% or a hawkish surprise today.
Trigger: Real put, or $4B against a $40T debt market? The 30-year answers first. 👇
{future}(BTCUSDT)
#BitcoinOpenInterestFallsToTwoMonthLow #BitcoinRises23.6%Weekly #EtherETFsPost$697MWeeklyInflow #USTreasuryDoublesBuybackCapTo$4B #GoldReboundsAbove$4600
Treasury doubled its long-end buyback cap from $2B to ≥$4B per operation (Sept 9–Nov 4) — and CNBC says it may fund bigger rounds from its ~$950B TGA , a potential ~$1T "Bessent Put". Not QE, but Washington capping its own yield curve with its own checkbook.
Tape: 30Y dropped 9bps to 5.194% on the news → gave it all back to 5.276% . DXY at multi-month lows, gold +5.2%/wk , BTC >$78K with ~$1.4B shorts liquidated .
The line in the sand: ▪ 30Y must hold below 5.30% (19-yr high) — a close above kills the "cap" narrative ▪ Today's 2pm ET presser (a real fiscal number changes everything) · PCE Wed · NVDA Wed · Jackson Hole/Warsh Fri ▪ Buyback ops begin Sept 9
Trade: stay long gold & $BTC while 30Y < 5.30% and DXY stays weak. Invalidation: 30Y closes > 5.30% or a hawkish surprise today.
Trigger: Real put, or $4B against a $40T debt market? The 30-year answers first. 👇
#BitcoinOpenInterestFallsToTwoMonthLow #BitcoinRises23.6%Weekly #EtherETFsPost$697MWeeklyInflow #USTreasuryDoublesBuybackCapTo$4B #GoldReboundsAbove$4600
Tape: 30Y dropped 9bps to 5.194% on the news → gave it all back to 5.276% . DXY at multi-month lows, gold +5.2%/wk , BTC >$78K with ~$1.4B shorts liquidated .
The line in the sand: ▪ 30Y must hold below 5.30% (19-yr high) — a close above kills the "cap" narrative ▪ Today's 2pm ET presser (a real fiscal number changes everything) · PCE Wed · NVDA Wed · Jackson Hole/Warsh Fri ▪ Buyback ops begin Sept 9
Trade: stay long gold & $BTC while 30Y < 5.30% and DXY stays weak. Invalidation: 30Y closes > 5.30% or a hawkish surprise today.
Trigger: Real put, or $4B against a $40T debt market? The 30-year answers first. 👇
#BitcoinOpenInterestFallsToTwoMonthLow #BitcoinRises23.6%Weekly #EtherETFsPost$697MWeeklyInflow #USTreasuryDoublesBuybackCapTo$4B #GoldReboundsAbove$4600
136

·
--
Bullish
#USTreasuryDoublesBuybackCapTo$4B
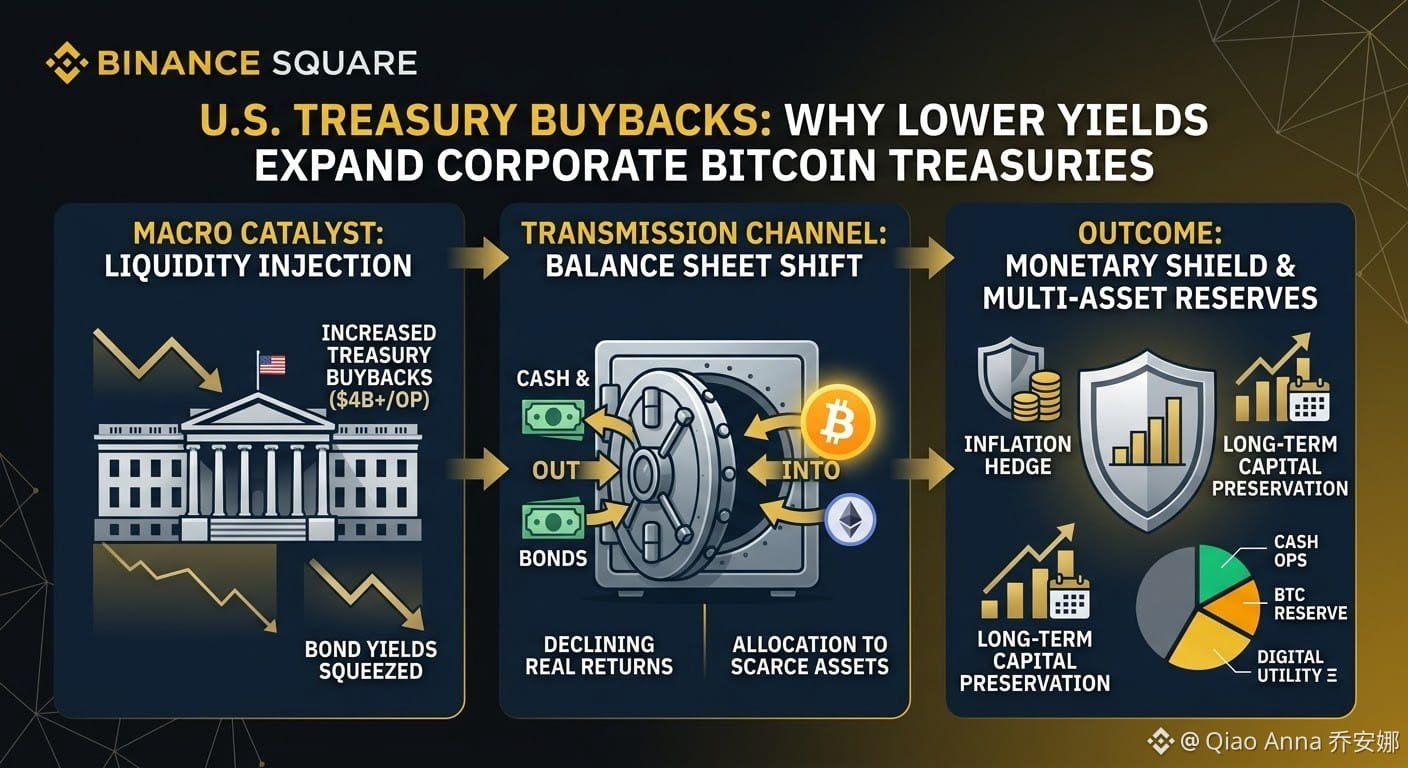
The U.S. Treasury is increasing the maximum size of its liquidity-support buyback operations for longer-dated Treasury securities from $2 billion to at least $4 billion per operation.
📅 The larger operations are scheduled to begin September 9, 2026, and continue through the end of the current refunding quarter on November 4.
Why it matters for markets:
• More support for liquidity in longer-term Treasury markets
• Potential impact on long-term bond yields
• Important implications for broader risk sentiment and financial conditions
• Crypto markets may also react as traders assess the changing liquidity environment
⚠️ This does not automatically mean bullish conditions for Bitcoin or crypto. The actual market impact will depend on yields, liquidity, inflation expectations and Federal Reserve policy.
For crypto traders, this is a macro development worth watching closely.
What do you think — could larger Treasury buybacks improve risk appetite across crypto markets?
$CYS $SOLV $BE
{future}(BEUSDT)
{future}(SOLVUSDT)
{future}(CYSUSDT)
#USTreasuryDoublesBuybackCapTo$4B
The U.S. Treasury is increasing the maximum size of its liquidity-support buyback operations for longer-dated Treasury securities from $2 billion to at least $4 billion per operation.
📅 The larger operations are scheduled to begin September 9, 2026, and continue through the end of the current refunding quarter on November 4.
Why it matters for markets:
• More support for liquidity in longer-term Treasury markets
• Potential impact on long-term bond yields
• Important implications for broader risk sentiment and financial conditions
• Crypto markets may also react as traders assess the changing liquidity environment
⚠️ This does not automatically mean bullish conditions for Bitcoin or crypto. The actual market impact will depend on yields, liquidity, inflation expectations and Federal Reserve policy.
For crypto traders, this is a macro development worth watching closely.
What do you think — could larger Treasury buybacks improve risk appetite across crypto markets?
$CYS $SOLV $BE
The U.S. Treasury is increasing the maximum size of its liquidity-support buyback operations for longer-dated Treasury securities from $2 billion to at least $4 billion per operation.
📅 The larger operations are scheduled to begin September 9, 2026, and continue through the end of the current refunding quarter on November 4.
Why it matters for markets:
• More support for liquidity in longer-term Treasury markets
• Potential impact on long-term bond yields
• Important implications for broader risk sentiment and financial conditions
• Crypto markets may also react as traders assess the changing liquidity environment
⚠️ This does not automatically mean bullish conditions for Bitcoin or crypto. The actual market impact will depend on yields, liquidity, inflation expectations and Federal Reserve policy.
For crypto traders, this is a macro development worth watching closely.
What do you think — could larger Treasury buybacks improve risk appetite across crypto markets?
$CYS $SOLV $BE
160
·
--
#USTreasuryDoublesBuybackCapTo$4B “So you announced a $4B buyback and US
Treasuries started selling off”
“Yes, Dave”
“And now you are announcing a $1 Trillion buyback and you're $40 trillion in debt”
“That's right, Dave”$RMAX.US $REAX.US $SDST.US
#USTreasuryDoublesBuybackCapTo$4B “So you announced a $4B buyback and US
Treasuries started selling off”
“Yes, Dave”
“And now you are announcing a $1 Trillion buyback and you're $40 trillion in debt”
“That's right, Dave”$RMAX.US $REAX.US $SDST.US
Treasuries started selling off”
“Yes, Dave”
“And now you are announcing a $1 Trillion buyback and you're $40 trillion in debt”
“That's right, Dave”$RMAX.US $REAX.US $SDST.US

REAXUS+2.14%
RMAXUS0.00%
SDSTUS-6.24%
453

·
--
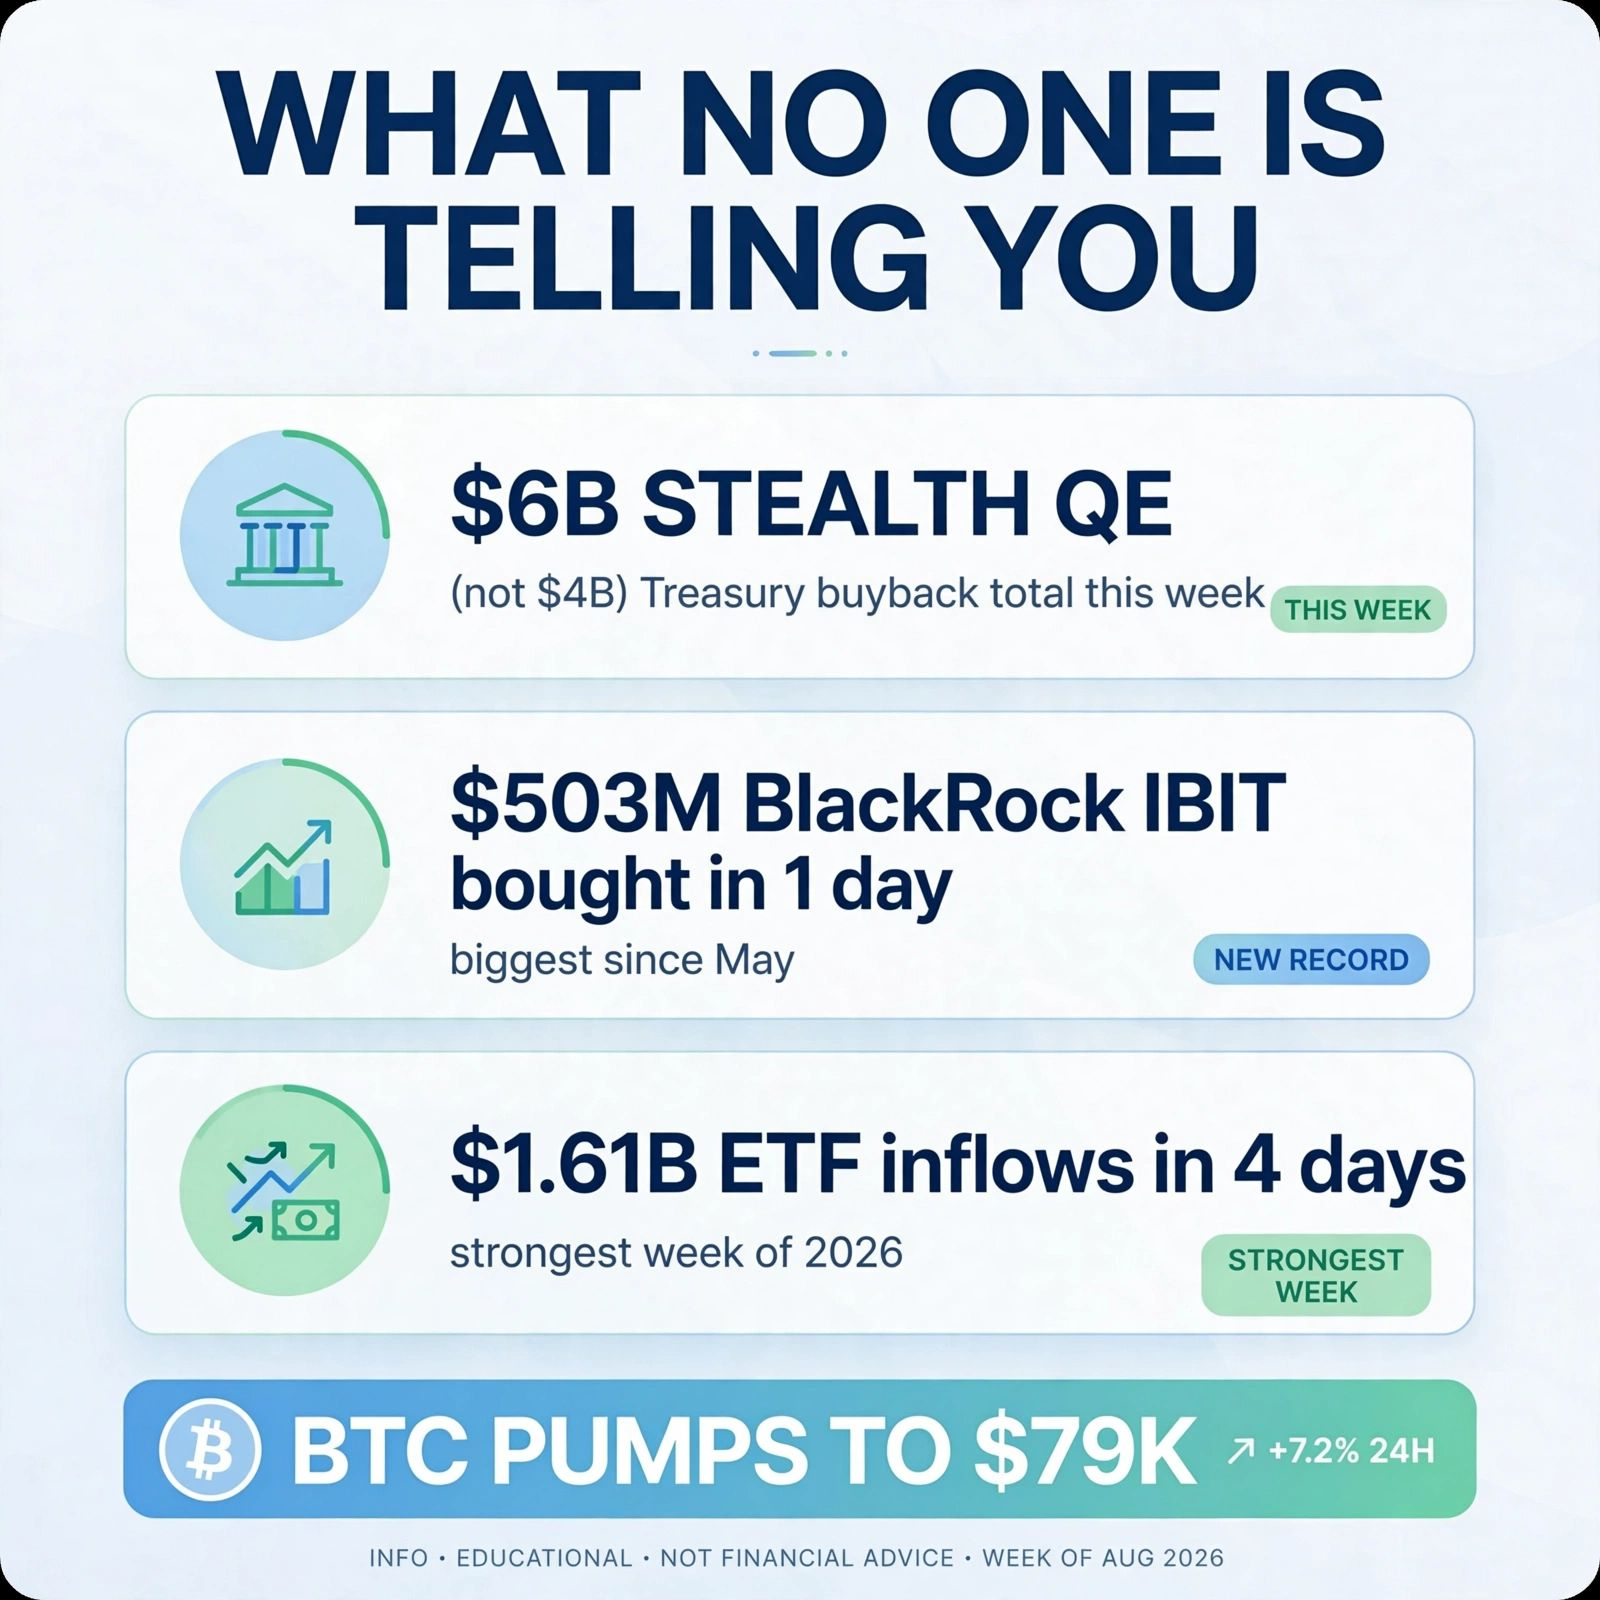
SHORTS GOT REKT - But here's what NO ONE is telling you 👇
Everyone is saying $4B Treasury buyback...
REAL number is $6 BILLION this week - $4B bonds + $2B TIPS. Treasury is doing stealth QE.
And BlackRock alone bought $503M in ONE DAY via IBIT. Total ETF inflow $1.6B in 4 days - biggest week of 2026.
They targeted "off-the-run" bonds (illiquid old bonds) to inject cash directly into banks.
Banks -> Risk Assets -> BTC $79K
Treasury Secretary said: "It could be MORE than $4B"
Translation: More liquidity is coming.
This is not a pump. This is liquidity injection.
Are you positioned?
#bitcoin #btc #cryptoalpha #treasury #etf#anthropicipocouldtopspacexrecordreportssay
SHORTS GOT REKT - But here's what NO ONE is telling you 👇
Everyone is saying $4B Treasury buyback...
REAL number is $6 BILLION this week - $4B bonds + $2B TIPS. Treasury is doing stealth QE.
And BlackRock alone bought $503M in ONE DAY via IBIT. Total ETF inflow $1.6B in 4 days - biggest week of 2026.
They targeted "off-the-run" bonds (illiquid old bonds) to inject cash directly into banks.
Banks -> Risk Assets -> BTC $79K
Treasury Secretary said: "It could be MORE than $4B"
Translation: More liquidity is coming.
This is not a pump. This is liquidity injection.
Are you positioned?
#bitcoin #btc #cryptoalpha #treasury #etf#anthropicipocouldtopspacexrecordreportssay
Everyone is saying $4B Treasury buyback...
REAL number is $6 BILLION this week - $4B bonds + $2B TIPS. Treasury is doing stealth QE.
And BlackRock alone bought $503M in ONE DAY via IBIT. Total ETF inflow $1.6B in 4 days - biggest week of 2026.
They targeted "off-the-run" bonds (illiquid old bonds) to inject cash directly into banks.
Banks -> Risk Assets -> BTC $79K
Treasury Secretary said: "It could be MORE than $4B"
Translation: More liquidity is coming.
This is not a pump. This is liquidity injection.
Are you positioned?
#bitcoin #btc #cryptoalpha #treasury #etf#anthropicipocouldtopspacexrecordreportssay
2
95

·
--
Bullish
A Treasury balance of $950 billion could fuel a bond buyback wave
Treasury Secretary Scott Bessent may have around $950 billion in additional firepower to support his campaign to lower long-term yields, after two senior Treasury officials told CNBC’s Steve Liesman that the general Treasury account is available to help finance expanded buybacks of long-term government bonds.#BTCReaches$80000 #BitcoinOpenInterestFallsToTwoMonthLow #AIHardwareStocksFallPreMarketAAOIDown11.66% #EtherETFsPost$697MWeeklyInflow #USTreasuryDoublesBuybackCapTo$4B $TRUMP
$XAU
{future}(XAUUSDT)
A Treasury balance of $950 billion could fuel a bond buyback wave
Treasury Secretary Scott Bessent may have around $950 billion in additional firepower to support his campaign to lower long-term yields, after two senior Treasury officials told CNBC’s Steve Liesman that the general Treasury account is available to help finance expanded buybacks of long-term government bonds.#BTCReaches$80000 #BitcoinOpenInterestFallsToTwoMonthLow #AIHardwareStocksFallPreMarketAAOIDown11.66% #EtherETFsPost$697MWeeklyInflow #USTreasuryDoublesBuybackCapTo$4B $TRUMP
$XAU
Treasury Secretary Scott Bessent may have around $950 billion in additional firepower to support his campaign to lower long-term yields, after two senior Treasury officials told CNBC’s Steve Liesman that the general Treasury account is available to help finance expanded buybacks of long-term government bonds.#BTCReaches$80000 #BitcoinOpenInterestFallsToTwoMonthLow #AIHardwareStocksFallPreMarketAAOIDown11.66% #EtherETFsPost$697MWeeklyInflow #USTreasuryDoublesBuybackCapTo$4B $TRUMP
$XAU

91

·
--
Bullish
Verified
#USTreasuryDoublesBuybackCapTo$4B
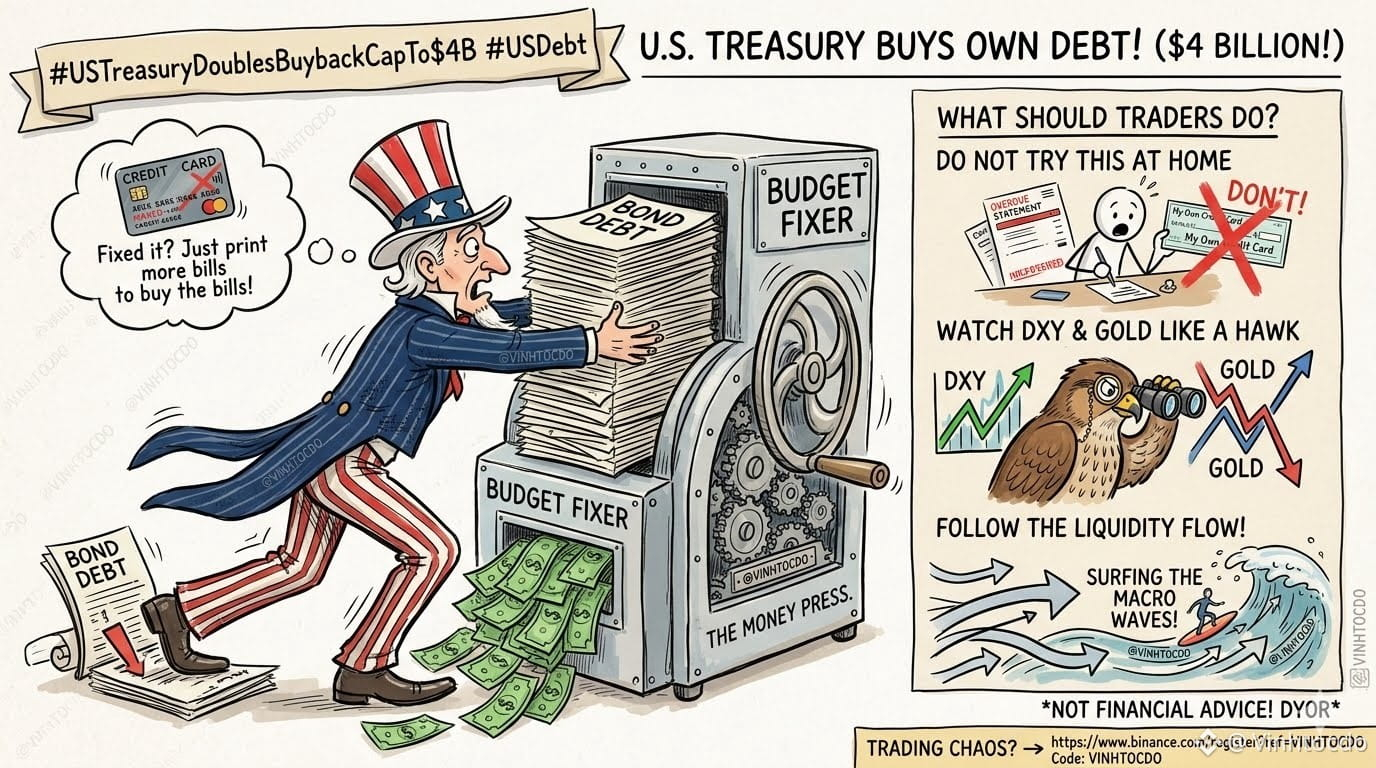
The US Treasury is doubling its buyback cap to $4B! 💸
Wait, so they are buying back their own debt? Imagine maxing out your credit card and fixing it by just... buying your own bills. Modern problems require printing-press solutions, right? 😂
Is Uncle Sam actually doing okay, or is this just elite financial wizardry? Either way, pumping billions back into the bond market means big waves are coming for liquidity, the DXY, and macro charts.
So, what should traders do?
1️⃣ Don't try this at home with your own debt. 🛑
2️⃣ Watch the DXY and Gold like a hawk. 🦅
3️⃣ Follow the liquidity flow!
Stay sharp and hedge your positions.
⚠️ NOT FINANCIAL ADVICE! DYOR, fam.
Ready to trade the macro chaos?
👉 Link: [https://www.binance.com/register?ref=VINHTOCDO](https://www.binance.com/register?ref=VINHTOCDO)
🔥 Code: VINHTOCDO
#USDebt #MacroEconomics #BondMarket #VINHTOCDO
$BTC
{future}(BTCUSDT)
$ETH
{future}(ETHUSDT)
$BNB
{future}(BNBUSDT)
#USTreasuryDoublesBuybackCapTo$4B
The US Treasury is doubling its buyback cap to $4B! 💸
Wait, so they are buying back their own debt? Imagine maxing out your credit card and fixing it by just... buying your own bills. Modern problems require printing-press solutions, right? 😂
Is Uncle Sam actually doing okay, or is this just elite financial wizardry? Either way, pumping billions back into the bond market means big waves are coming for liquidity, the DXY, and macro charts.
So, what should traders do?
1️⃣ Don't try this at home with your own debt. 🛑
2️⃣ Watch the DXY and Gold like a hawk. 🦅
3️⃣ Follow the liquidity flow!
Stay sharp and hedge your positions.
⚠️ NOT FINANCIAL ADVICE! DYOR, fam.
Ready to trade the macro chaos?
👉 Link: https://www.binance.com/register?ref=VINHTOCDO
🔥 Code: VINHTOCDO
#USDebt #MacroEconomics #BondMarket #VINHTOCDO
$BTC
$ETH
$BNB
The US Treasury is doubling its buyback cap to $4B! 💸
Wait, so they are buying back their own debt? Imagine maxing out your credit card and fixing it by just... buying your own bills. Modern problems require printing-press solutions, right? 😂
Is Uncle Sam actually doing okay, or is this just elite financial wizardry? Either way, pumping billions back into the bond market means big waves are coming for liquidity, the DXY, and macro charts.
So, what should traders do?
1️⃣ Don't try this at home with your own debt. 🛑
2️⃣ Watch the DXY and Gold like a hawk. 🦅
3️⃣ Follow the liquidity flow!
Stay sharp and hedge your positions.
⚠️ NOT FINANCIAL ADVICE! DYOR, fam.
Ready to trade the macro chaos?
👉 Link: https://www.binance.com/register?ref=VINHTOCDO
🔥 Code: VINHTOCDO
#USDebt #MacroEconomics #BondMarket #VINHTOCDO
$BTC
$ETH
$BNB
3
89

·
--
Was It a Rally or a Liquidity Hunt? The Lesson of the Last Week in CryptoAugust 17-24, 2026 | A market that rose against the prevailing context, created FOMO, and then began hunting liquidity in both directions
The last week abruptly brought volatility back into a crypto market that, before this episode, had looked rather anemic. BTC and ETH accelerated, breakouts appeared, volumes increased, massive liquidations followed and, inevitably, FOMO.
The simple interpretation would be that the market woke up and started a new rally.
But there is a problem: the context did not sufficiently explain this rise.
If we look not only at price, but also at the narratives, breadth, Futures behavior and the sequence of events, the last week starts to look different. Not necessarily as the beginning of an organic trend, but as a weak market in which price impulses themselves created the liquidity needed for the next impulses.
I am not claiming that we can demonstrate who initiated these moves or with what intention. But we can observe what happened and ask which mechanism best explains this sequence.
The First Question Mark: The Market Was Rising, but the Context Was Not Turning Bullish
Normally, a strong and sustainable rally should appear together with an improvement in the environment in which risk assets operate.
But the last week did not look like that.
U.S. bond yields remained a problem, U.S. debt and the deficit continued to put pressure on the bond market, geopolitics remained tense, and toward the end of the week trade tensions re-emerged along with a stronger dollar. On August 24, U.S. technology stocks were under pressure, equity breadth was negative, and DXY was rising. (Reuters)
Despite this, BTC and ETH were pushed aggressively higher.
Where was the optimism coming from?
One of the main bullish narratives of the week was the U.S. Treasury announcement that it would double certain long-duration bond buybacks, from $2 billion to $4 billion per operation.
The headline was powerful. Yields fell, the dollar weakened, and risk assets reacted immediately.
But there is an important detail: the expanded program would actually begin only on September 9, and several analysts judged that its effect could be limited or temporary. By the following day, a good part of the decline in yields had already been reversed. (Reuters)
In other words, price reacted much faster than the actual economic effect.
That does not mean the announcement had no value. It means, however, that the headline generated much more immediate speculative energy than the effective economic liquidity introduced at that moment.
On August 24, the Same Structure Repeated Itself
At the end of the week, another dramatic narrative appeared: extremely tough sanctions against Iran and the threat of extending them to its trading partners.
Before the announcement, the public language was extremely aggressive. China had become one of the main unknowns, as the largest buyer of Iranian oil. The market had real reasons to fear an economic escalation. (Reuters)
But when the details became clear, the immediate shock was smaller than the anticipation.
Concrete sanctions were introduced against a number of entities and sectors, but major Chinese institutions were not hit. The truly systemic part of the secondary sanctions remained, to a large extent, a warning: stop commercial relations with Iran or risk sanctions later. (Reuters)
Again, we have the same structure:
very powerful headline -> very powerful anticipation -> immediate economic effect more modest than the headline suggested.
And exactly around this event, the crypto market produced one of the most interesting sequences of the week.
The Day the Mechanism Became Visible
Before the event, BTC and ETH were pushed higher, with BTC reaching 80,000.
The problem was that the broader market was not confirming the move to the same extent.
ETH began to lag, altcoins did not show the same strength, and breadth deteriorated. In one snapshot from the same session, BTC was still positive on the day while almost the entire tracked sample of altcoins had already turned red.
This is an important signal.
In a generalized rally, BTC should lead, but capital should progressively propagate into the rest of the market.
Instead, BTC had become almost a positive anomaly.
Then came the drop.
BTC lost 79,000, ETH erased its entire daily advance, and altcoins accelerated lower. The longs built during the impulse were hit.
After the event, however, when the market concluded that the immediate shock was smaller than anticipated, BTC and ETH began to be lifted again.
Meanwhile, new shorts had formed during the decline.
And so, within a matter of hours, the market managed to create liquidity successively in both directions:
shorts eliminated on the way up -> FOMO and longs built near the top -> longs eliminated on the way down -> new shorts built lower -> rebound and pressure on the new shorts.
This structure looks less like the linear discovery of a new fundamental price and more like the successive exploitation of liquidity pools created by the preceding move.
A Weak Market Can Be Easier to Move
This is where the essential point appears.
A large participant does not need to buy the entire market in order to produce a rally.
In an environment with limited participation, it is enough to move the marginal price aggressively.
After that, the market can begin to do part of the work by itself.
Price rises, shorts have to close, momentum algorithms react, breakout traders enter, retail sees the move, ETFs receive inflows, and leverage increases.
A reflexive process then appears:
price displacement -> short covering -> FOMO -> new capital -> new leverage -> new liquidity pools.
The initial impulse creates its own demand.
And once enough capital has entered, the direction can be reversed.
I am not saying this is the only possible explanation for the last week. I am saying, however, that it explains very well an anomaly that the classic explanation "sentiment improved" does not explain: why prices rose so strongly in a context that was not becoming proportionally more favorable.
Why the Comparison With Shitcoins Becomes Relevant
BTC and ETH are not shitcoins, and their liquidity is incomparably greater.
But the microstructural morphology can become similar when the ratio between very large capital and available organic liquidity changes.
On small tokens, we often see a simple mechanism:
pump -> FOMO -> leverage -> liquidations -> reversal -> liquidations in the opposite direction -> another pump.
The bot or market maker does not control every transaction. It only needs to control enough of the initial impulse to set the market in motion.
The traders who arrive later become the fuel for the next stage.
If the BTC/ETH market is sufficiently anemic, the same principle can work on a much larger scale.
Not because someone can control BTC without limit, but because in a weak market, very large capital can temporarily have a disproportionate influence over price formation.
Increased Activity Does Not Necessarily Mean Healthy Participation
This is perhaps the most important conclusion.
We saw a great deal of activity during the last week.
But activity can be the cause of a healthy trend, or it can be the effect of volatility that has been created.
If price is pushed aggressively enough, it automatically generates:
FOMO, short covering, margin calls, liquidations, hedging, momentum algorithms and new speculative positions.
Volume increases.
But the fact that volume increased does not prove that, beforehand, there was a large mass of investors who had independently decided that BTC and ETH should be bought.
It is possible that an important part of that volume was created by the move itself.
What Remains After Liquidity Is Hunted Several Times
The problem for the next stage is that this process consumes traders.
After several episodes of massive liquidations in a short period, some participants lose their margin capital. The others reduce leverage, reduce position size or simply leave the market temporarily.
After you have seen shorts eliminated first, then longs, and then shorts again, the normal reaction of many traders is simple:
"I would rather wait."
And this is where a paradox begins.
The more cautious traders become, the more independent liquidity is reduced.
The more independent liquidity is reduced, the more very large participants can once again have a greater relative influence over price.
In the short term, this can continue to produce spectacular volatility.
Over a somewhat longer horizon, however, the mechanism consumes its own fuel.
You cannot hunt liquidity forever if traders stop offering it.
Conclusion: Maybe the Question Is Not Whether BTC Is Bullish or Bearish
Perhaps the most important anomaly of the last week was not the volatility.
It was the fact that price rose much more strongly than the context and the narratives justified, and then the same market successively produced liquidity for both directions.
We do not know who initiated every move.
We do not know what information each participant had.
And we cannot demonstrate whether certain moves were coordinated.
But neither should we ignore what we are seeing.
When a relatively weak market is pushed aggressively, creates FOMO, builds leverage, liquidates both directions successively and continues to show concentrated strength in only a few benchmarks, it is worth asking a different question:
Are we watching the formation of a trend or the exploitation of liquidity created by its own impulse?
Perhaps, during the last week, the two became the same thing for a while.
Was it a rally or a liquidity hunt?
My answer is that we have enough reasons to stop automatically assuming that every strong rise represents a market that has turned fundamentally bullish.
Sometimes, a liquidity hunt can look exactly like a rally - until the moment there is no longer enough liquidity left to hunt.
Author’s Note
This article reflects my personal interpretation of the market and may therefore contain subjective judgments. AI was used as a research and analytical assistant for collecting information, cross-checking data, examining market relationships, and organizing the analysis. The final interpretation, reasoning, and conclusions presented here are my own.
This article is intended for discussion and market analysis only and should not be considered financial advice.
#BTCReaches$80000 , #BitcoinRises23.6%Weekly , $BTC , $ETH , #USTreasuryDoublesBuybackCapTo$4B , #EtherETFsPost$697MWeeklyInflow
Was It a Rally or a Liquidity Hunt? The Lesson of the Last Week in Crypto
August 17-24, 2026 | A market that rose against the prevailing context, created FOMO, and then began hunting liquidity in both directions
The last week abruptly brought volatility back into a crypto market that, before this episode, had looked rather anemic. BTC and ETH accelerated, breakouts appeared, volumes increased, massive liquidations followed and, inevitably, FOMO.
The simple interpretation would be that the market woke up and started a new rally.
But there is a problem: the context did not sufficiently explain this rise.
If we look not only at price, but also at the narratives, breadth, Futures behavior and the sequence of events, the last week starts to look different. Not necessarily as the beginning of an organic trend, but as a weak market in which price impulses themselves created the liquidity needed for the next impulses.
I am not claiming that we can demonstrate who initiated these moves or with what intention. But we can observe what happened and ask which mechanism best explains this sequence.
The First Question Mark: The Market Was Rising, but the Context Was Not Turning Bullish
Normally, a strong and sustainable rally should appear together with an improvement in the environment in which risk assets operate.
But the last week did not look like that.
U.S. bond yields remained a problem, U.S. debt and the deficit continued to put pressure on the bond market, geopolitics remained tense, and toward the end of the week trade tensions re-emerged along with a stronger dollar. On August 24, U.S. technology stocks were under pressure, equity breadth was negative, and DXY was rising. (Reuters)
Despite this, BTC and ETH were pushed aggressively higher.
Where was the optimism coming from?
One of the main bullish narratives of the week was the U.S. Treasury announcement that it would double certain long-duration bond buybacks, from $2 billion to $4 billion per operation.
The headline was powerful. Yields fell, the dollar weakened, and risk assets reacted immediately.
But there is an important detail: the expanded program would actually begin only on September 9, and several analysts judged that its effect could be limited or temporary. By the following day, a good part of the decline in yields had already been reversed. (Reuters)
In other words, price reacted much faster than the actual economic effect.
That does not mean the announcement had no value. It means, however, that the headline generated much more immediate speculative energy than the effective economic liquidity introduced at that moment.
On August 24, the Same Structure Repeated Itself
At the end of the week, another dramatic narrative appeared: extremely tough sanctions against Iran and the threat of extending them to its trading partners.
Before the announcement, the public language was extremely aggressive. China had become one of the main unknowns, as the largest buyer of Iranian oil. The market had real reasons to fear an economic escalation. (Reuters)
But when the details became clear, the immediate shock was smaller than the anticipation.
Concrete sanctions were introduced against a number of entities and sectors, but major Chinese institutions were not hit. The truly systemic part of the secondary sanctions remained, to a large extent, a warning: stop commercial relations with Iran or risk sanctions later. (Reuters)
Again, we have the same structure:
very powerful headline -> very powerful anticipation -> immediate economic effect more modest than the headline suggested.
And exactly around this event, the crypto market produced one of the most interesting sequences of the week.
The Day the Mechanism Became Visible
Before the event, BTC and ETH were pushed higher, with BTC reaching 80,000.
The problem was that the broader market was not confirming the move to the same extent.
ETH began to lag, altcoins did not show the same strength, and breadth deteriorated. In one snapshot from the same session, BTC was still positive on the day while almost the entire tracked sample of altcoins had already turned red.
This is an important signal.
In a generalized rally, BTC should lead, but capital should progressively propagate into the rest of the market.
Instead, BTC had become almost a positive anomaly.
Then came the drop.
BTC lost 79,000, ETH erased its entire daily advance, and altcoins accelerated lower. The longs built during the impulse were hit.
After the event, however, when the market concluded that the immediate shock was smaller than anticipated, BTC and ETH began to be lifted again.
Meanwhile, new shorts had formed during the decline.
And so, within a matter of hours, the market managed to create liquidity successively in both directions:
shorts eliminated on the way up -> FOMO and longs built near the top -> longs eliminated on the way down -> new shorts built lower -> rebound and pressure on the new shorts.
This structure looks less like the linear discovery of a new fundamental price and more like the successive exploitation of liquidity pools created by the preceding move.
A Weak Market Can Be Easier to Move
This is where the essential point appears.
A large participant does not need to buy the entire market in order to produce a rally.
In an environment with limited participation, it is enough to move the marginal price aggressively.
After that, the market can begin to do part of the work by itself.
Price rises, shorts have to close, momentum algorithms react, breakout traders enter, retail sees the move, ETFs receive inflows, and leverage increases.
A reflexive process then appears:
price displacement -> short covering -> FOMO -> new capital -> new leverage -> new liquidity pools.
The initial impulse creates its own demand.
And once enough capital has entered, the direction can be reversed.
I am not saying this is the only possible explanation for the last week. I am saying, however, that it explains very well an anomaly that the classic explanation "sentiment improved" does not explain: why prices rose so strongly in a context that was not becoming proportionally more favorable.
Why the Comparison With Shitcoins Becomes Relevant
BTC and ETH are not shitcoins, and their liquidity is incomparably greater.
But the microstructural morphology can become similar when the ratio between very large capital and available organic liquidity changes.
On small tokens, we often see a simple mechanism:
pump -> FOMO -> leverage -> liquidations -> reversal -> liquidations in the opposite direction -> another pump.
The bot or market maker does not control every transaction. It only needs to control enough of the initial impulse to set the market in motion.
The traders who arrive later become the fuel for the next stage.
If the BTC/ETH market is sufficiently anemic, the same principle can work on a much larger scale.
Not because someone can control BTC without limit, but because in a weak market, very large capital can temporarily have a disproportionate influence over price formation.
Increased Activity Does Not Necessarily Mean Healthy Participation
This is perhaps the most important conclusion.
We saw a great deal of activity during the last week.
But activity can be the cause of a healthy trend, or it can be the effect of volatility that has been created.
If price is pushed aggressively enough, it automatically generates:
FOMO, short covering, margin calls, liquidations, hedging, momentum algorithms and new speculative positions.
Volume increases.
But the fact that volume increased does not prove that, beforehand, there was a large mass of investors who had independently decided that BTC and ETH should be bought.
It is possible that an important part of that volume was created by the move itself.
What Remains After Liquidity Is Hunted Several Times
The problem for the next stage is that this process consumes traders.
After several episodes of massive liquidations in a short period, some participants lose their margin capital. The others reduce leverage, reduce position size or simply leave the market temporarily.
After you have seen shorts eliminated first, then longs, and then shorts again, the normal reaction of many traders is simple:
"I would rather wait."
And this is where a paradox begins.
The more cautious traders become, the more independent liquidity is reduced.
The more independent liquidity is reduced, the more very large participants can once again have a greater relative influence over price.
In the short term, this can continue to produce spectacular volatility.
Over a somewhat longer horizon, however, the mechanism consumes its own fuel.
You cannot hunt liquidity forever if traders stop offering it.
Conclusion: Maybe the Question Is Not Whether BTC Is Bullish or Bearish
Perhaps the most important anomaly of the last week was not the volatility.
It was the fact that price rose much more strongly than the context and the narratives justified, and then the same market successively produced liquidity for both directions.
We do not know who initiated every move.
We do not know what information each participant had.
And we cannot demonstrate whether certain moves were coordinated.
But neither should we ignore what we are seeing.
When a relatively weak market is pushed aggressively, creates FOMO, builds leverage, liquidates both directions successively and continues to show concentrated strength in only a few benchmarks, it is worth asking a different question:
Are we watching the formation of a trend or the exploitation of liquidity created by its own impulse?
Perhaps, during the last week, the two became the same thing for a while.
Was it a rally or a liquidity hunt?
My answer is that we have enough reasons to stop automatically assuming that every strong rise represents a market that has turned fundamentally bullish.
Sometimes, a liquidity hunt can look exactly like a rally - until the moment there is no longer enough liquidity left to hunt.
Author’s Note
This article reflects my personal interpretation of the market and may therefore contain subjective judgments. AI was used as a research and analytical assistant for collecting information, cross-checking data, examining market relationships, and organizing the analysis. The final interpretation, reasoning, and conclusions presented here are my own.
This article is intended for discussion and market analysis only and should not be considered financial advice.
#BTCReaches$80000 , #BitcoinRises23.6%Weekly , $BTC , $ETH , #USTreasuryDoublesBuybackCapTo$4B , #EtherETFsPost$697MWeeklyInflow
The last week abruptly brought volatility back into a crypto market that, before this episode, had looked rather anemic. BTC and ETH accelerated, breakouts appeared, volumes increased, massive liquidations followed and, inevitably, FOMO.
The simple interpretation would be that the market woke up and started a new rally.
But there is a problem: the context did not sufficiently explain this rise.
If we look not only at price, but also at the narratives, breadth, Futures behavior and the sequence of events, the last week starts to look different. Not necessarily as the beginning of an organic trend, but as a weak market in which price impulses themselves created the liquidity needed for the next impulses.
I am not claiming that we can demonstrate who initiated these moves or with what intention. But we can observe what happened and ask which mechanism best explains this sequence.
The First Question Mark: The Market Was Rising, but the Context Was Not Turning Bullish
Normally, a strong and sustainable rally should appear together with an improvement in the environment in which risk assets operate.
But the last week did not look like that.
U.S. bond yields remained a problem, U.S. debt and the deficit continued to put pressure on the bond market, geopolitics remained tense, and toward the end of the week trade tensions re-emerged along with a stronger dollar. On August 24, U.S. technology stocks were under pressure, equity breadth was negative, and DXY was rising. (Reuters)
Despite this, BTC and ETH were pushed aggressively higher.
Where was the optimism coming from?
One of the main bullish narratives of the week was the U.S. Treasury announcement that it would double certain long-duration bond buybacks, from $2 billion to $4 billion per operation.
The headline was powerful. Yields fell, the dollar weakened, and risk assets reacted immediately.
But there is an important detail: the expanded program would actually begin only on September 9, and several analysts judged that its effect could be limited or temporary. By the following day, a good part of the decline in yields had already been reversed. (Reuters)
In other words, price reacted much faster than the actual economic effect.
That does not mean the announcement had no value. It means, however, that the headline generated much more immediate speculative energy than the effective economic liquidity introduced at that moment.
On August 24, the Same Structure Repeated Itself
At the end of the week, another dramatic narrative appeared: extremely tough sanctions against Iran and the threat of extending them to its trading partners.
Before the announcement, the public language was extremely aggressive. China had become one of the main unknowns, as the largest buyer of Iranian oil. The market had real reasons to fear an economic escalation. (Reuters)
But when the details became clear, the immediate shock was smaller than the anticipation.
Concrete sanctions were introduced against a number of entities and sectors, but major Chinese institutions were not hit. The truly systemic part of the secondary sanctions remained, to a large extent, a warning: stop commercial relations with Iran or risk sanctions later. (Reuters)
Again, we have the same structure:
very powerful headline -> very powerful anticipation -> immediate economic effect more modest than the headline suggested.
And exactly around this event, the crypto market produced one of the most interesting sequences of the week.
The Day the Mechanism Became Visible
Before the event, BTC and ETH were pushed higher, with BTC reaching 80,000.
The problem was that the broader market was not confirming the move to the same extent.
ETH began to lag, altcoins did not show the same strength, and breadth deteriorated. In one snapshot from the same session, BTC was still positive on the day while almost the entire tracked sample of altcoins had already turned red.
This is an important signal.
In a generalized rally, BTC should lead, but capital should progressively propagate into the rest of the market.
Instead, BTC had become almost a positive anomaly.
Then came the drop.
BTC lost 79,000, ETH erased its entire daily advance, and altcoins accelerated lower. The longs built during the impulse were hit.
After the event, however, when the market concluded that the immediate shock was smaller than anticipated, BTC and ETH began to be lifted again.
Meanwhile, new shorts had formed during the decline.
And so, within a matter of hours, the market managed to create liquidity successively in both directions:
shorts eliminated on the way up -> FOMO and longs built near the top -> longs eliminated on the way down -> new shorts built lower -> rebound and pressure on the new shorts.
This structure looks less like the linear discovery of a new fundamental price and more like the successive exploitation of liquidity pools created by the preceding move.
A Weak Market Can Be Easier to Move
This is where the essential point appears.
A large participant does not need to buy the entire market in order to produce a rally.
In an environment with limited participation, it is enough to move the marginal price aggressively.
After that, the market can begin to do part of the work by itself.
Price rises, shorts have to close, momentum algorithms react, breakout traders enter, retail sees the move, ETFs receive inflows, and leverage increases.
A reflexive process then appears:
price displacement -> short covering -> FOMO -> new capital -> new leverage -> new liquidity pools.
The initial impulse creates its own demand.
And once enough capital has entered, the direction can be reversed.
I am not saying this is the only possible explanation for the last week. I am saying, however, that it explains very well an anomaly that the classic explanation "sentiment improved" does not explain: why prices rose so strongly in a context that was not becoming proportionally more favorable.
Why the Comparison With Shitcoins Becomes Relevant
BTC and ETH are not shitcoins, and their liquidity is incomparably greater.
But the microstructural morphology can become similar when the ratio between very large capital and available organic liquidity changes.
On small tokens, we often see a simple mechanism:
pump -> FOMO -> leverage -> liquidations -> reversal -> liquidations in the opposite direction -> another pump.
The bot or market maker does not control every transaction. It only needs to control enough of the initial impulse to set the market in motion.
The traders who arrive later become the fuel for the next stage.
If the BTC/ETH market is sufficiently anemic, the same principle can work on a much larger scale.
Not because someone can control BTC without limit, but because in a weak market, very large capital can temporarily have a disproportionate influence over price formation.
Increased Activity Does Not Necessarily Mean Healthy Participation
This is perhaps the most important conclusion.
We saw a great deal of activity during the last week.
But activity can be the cause of a healthy trend, or it can be the effect of volatility that has been created.
If price is pushed aggressively enough, it automatically generates:
FOMO, short covering, margin calls, liquidations, hedging, momentum algorithms and new speculative positions.
Volume increases.
But the fact that volume increased does not prove that, beforehand, there was a large mass of investors who had independently decided that BTC and ETH should be bought.
It is possible that an important part of that volume was created by the move itself.
What Remains After Liquidity Is Hunted Several Times
The problem for the next stage is that this process consumes traders.
After several episodes of massive liquidations in a short period, some participants lose their margin capital. The others reduce leverage, reduce position size or simply leave the market temporarily.
After you have seen shorts eliminated first, then longs, and then shorts again, the normal reaction of many traders is simple:
"I would rather wait."
And this is where a paradox begins.
The more cautious traders become, the more independent liquidity is reduced.
The more independent liquidity is reduced, the more very large participants can once again have a greater relative influence over price.
In the short term, this can continue to produce spectacular volatility.
Over a somewhat longer horizon, however, the mechanism consumes its own fuel.
You cannot hunt liquidity forever if traders stop offering it.
Conclusion: Maybe the Question Is Not Whether BTC Is Bullish or Bearish
Perhaps the most important anomaly of the last week was not the volatility.
It was the fact that price rose much more strongly than the context and the narratives justified, and then the same market successively produced liquidity for both directions.
We do not know who initiated every move.
We do not know what information each participant had.
And we cannot demonstrate whether certain moves were coordinated.
But neither should we ignore what we are seeing.
When a relatively weak market is pushed aggressively, creates FOMO, builds leverage, liquidates both directions successively and continues to show concentrated strength in only a few benchmarks, it is worth asking a different question:
Are we watching the formation of a trend or the exploitation of liquidity created by its own impulse?
Perhaps, during the last week, the two became the same thing for a while.
Was it a rally or a liquidity hunt?
My answer is that we have enough reasons to stop automatically assuming that every strong rise represents a market that has turned fundamentally bullish.
Sometimes, a liquidity hunt can look exactly like a rally - until the moment there is no longer enough liquidity left to hunt.
Author’s Note
This article reflects my personal interpretation of the market and may therefore contain subjective judgments. AI was used as a research and analytical assistant for collecting information, cross-checking data, examining market relationships, and organizing the analysis. The final interpretation, reasoning, and conclusions presented here are my own.
This article is intended for discussion and market analysis only and should not be considered financial advice.
#BTCReaches$80000 , #BitcoinRises23.6%Weekly , $BTC , $ETH , #USTreasuryDoublesBuybackCapTo$4B , #EtherETFsPost$697MWeeklyInflow
1
1
276

·
--
Bullish
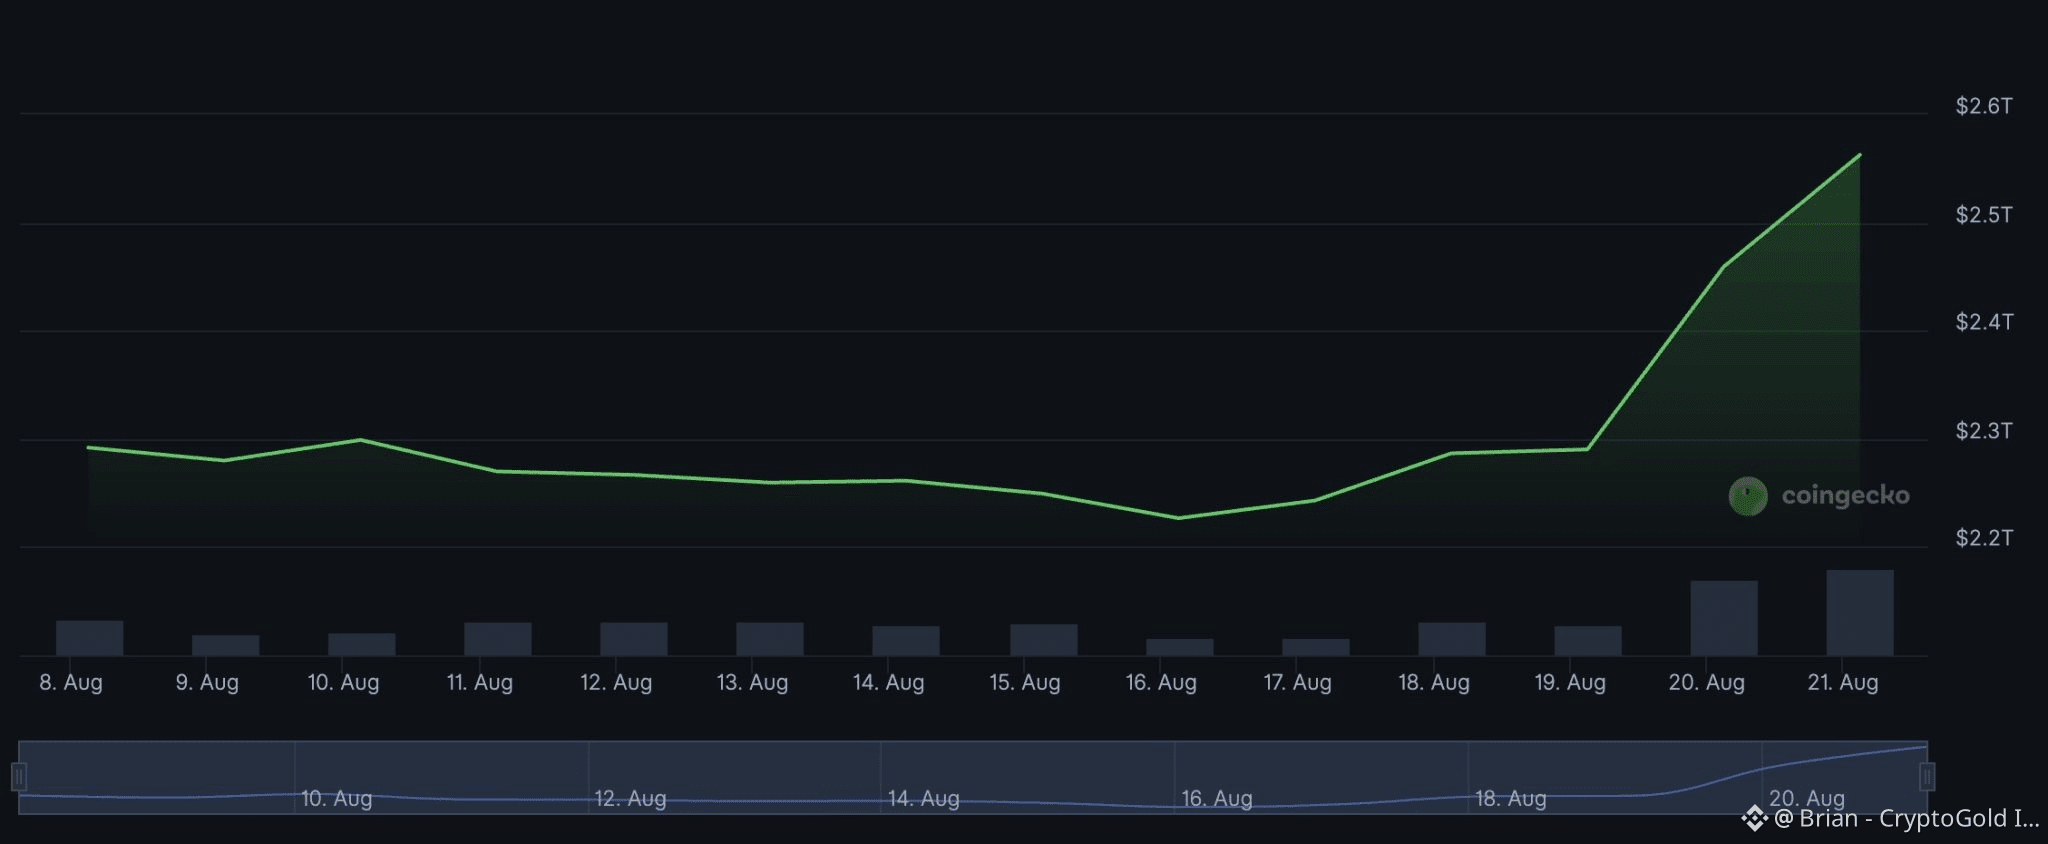
🚨 BREAKING: ALTCOINS EXPLODE AS CRYPTO RALLY ACCELERATES 🚀
ZEC :+47% | BCH : +31% | CC : +20% | ADA :+19% | DOGE :+18% | XRP : +14%
BTC is back above $77K, while ETH tops $2,430.
The catalyst? 🇺🇸 U.S. Treasury doubled long-term bond buybacks to $4B per session, potentially boosting liquidity and easing selling pressure.
Is the long-awaited altseason finally here? 👀
👉TRADE $ZEC
{spot}(ZECUSDT)
🚨 BREAKING: ALTCOINS EXPLODE AS CRYPTO RALLY ACCELERATES 🚀
ZEC :+47% | BCH : +31% | CC : +20% | ADA :+19% | DOGE :+18% | XRP : +14%
BTC is back above $77K, while ETH tops $2,430.
The catalyst? 🇺🇸 U.S. Treasury doubled long-term bond buybacks to $4B per session, potentially boosting liquidity and easing selling pressure.
Is the long-awaited altseason finally here? 👀
👉TRADE $ZEC
ZEC :+47% | BCH : +31% | CC : +20% | ADA :+19% | DOGE :+18% | XRP : +14%
BTC is back above $77K, while ETH tops $2,430.
The catalyst? 🇺🇸 U.S. Treasury doubled long-term bond buybacks to $4B per session, potentially boosting liquidity and easing selling pressure.
Is the long-awaited altseason finally here? 👀
👉TRADE $ZEC
1.5k

·
--
👉 Biticoin biggest Upsurge 🚀🚀📈 Bitcoin posts the biggest weekly dollar gain in history, closing at US$ 77,387
#Binance
Bitcoin has just added US$ 14,264 in a single week, rising 22.7% and closing at US$ 77,387—its largest recorded weekly dollar gain. The move happened as the U.S. Treasury expanded its share buyback program and investors returned to risk assets, helping to drive the market.$BTC C(image) recover serious momentum.
The numbers behind the surge are equally impressive. Spot Bitcoin ETFs attracted approximately US$ 1.92 billion in the week ended August 21, the largest weekly inflow since October 2025, while the Crypto Fear and Greed Index jumped to 78—its highest level since December 2024. 📊
👉 Biticoin biggest Upsurge 🚀🚀
📈 Bitcoin posts the biggest weekly dollar gain in history, closing at US$ 77,387
#Binance
Bitcoin has just added US$ 14,264 in a single week, rising 22.7% and closing at US$ 77,387—its largest recorded weekly dollar gain. The move happened as the U.S. Treasury expanded its share buyback program and investors returned to risk assets, helping to drive the market.$BTC C(image) recover serious momentum.
The numbers behind the surge are equally impressive. Spot Bitcoin ETFs attracted approximately US$ 1.92 billion in the week ended August 21, the largest weekly inflow since October 2025, while the Crypto Fear and Greed Index jumped to 78—its highest level since December 2024. 📊
#Binance
Bitcoin has just added US$ 14,264 in a single week, rising 22.7% and closing at US$ 77,387—its largest recorded weekly dollar gain. The move happened as the U.S. Treasury expanded its share buyback program and investors returned to risk assets, helping to drive the market.$BTC C(image) recover serious momentum.
The numbers behind the surge are equally impressive. Spot Bitcoin ETFs attracted approximately US$ 1.92 billion in the week ended August 21, the largest weekly inflow since October 2025, while the Crypto Fear and Greed Index jumped to 78—its highest level since December 2024. 📊
126
·
--
#USTreasuryDoublesBuybackCapTo$4B THE U.S. TREASURY COUKD BECOME THE NEXT BIG
CATALYST
Something very interesting just happened.
🇺🇸
Treasury officials say the government could tap its $1 TRILLION Treasury General Account to
fund additional bond buybacks.
Now deploying that cash c…$BTC $IPST.US $AAOI.US
#USTreasuryDoublesBuybackCapTo$4B THE U.S. TREASURY COUKD BECOME THE NEXT BIG
CATALYST
Something very interesting just happened.
🇺🇸
Treasury officials say the government could tap its $1 TRILLION Treasury General Account to
fund additional bond buybacks.
Now deploying that cash c…$BTC $IPST.US $AAOI.US
CATALYST
Something very interesting just happened.
🇺🇸
Treasury officials say the government could tap its $1 TRILLION Treasury General Account to
fund additional bond buybacks.
Now deploying that cash c…$BTC $IPST.US $AAOI.US

39
·
--
Bullish
$TRUMP
$XAU
#BitcoinOpenInterestFallsToTwoMonthLow #BitcoinRises23.6%Weekly #AIHardwareStocksFallPreMarketAAOIDown11.66% #EtherETFsPost$697MWeeklyInflow #USTreasuryDoublesBuybackCapTo$4B The dollar rises from its lowest levels in about 3
months amid fears over debt
The U.S. dollar rose during Monday’s trading, recovering marginally from its lowest level since the end of last May, amid a state of anxiety in markets after the U.S. Treasury pledged to increase its long-term bond buyback operations. Traders are also awaiting details of sanctions imposed on Iran, as well as remarks by officials from monetary policy in the United States and Japan this week.
In trading, the dollar index rose by 0.2% to 98.9 points by 11:36 GMT.
Trade tensions weighed on the Canadian dollar, which fell by 0.5% to 1.3836 Canadian dollars versus the U.S. dollar, after Washington imposed 50% tariffs on Canadian goods and Canada responded with similar measures.
$TRUMP
$XAU
#BitcoinOpenInterestFallsToTwoMonthLow #BitcoinRises23.6%Weekly #AIHardwareStocksFallPreMarketAAOIDown11.66% #EtherETFsPost$697MWeeklyInflow #USTreasuryDoublesBuybackCapTo$4B The dollar rises from its lowest levels in about 3
months amid fears over debt
The U.S. dollar rose during Monday’s trading, recovering marginally from its lowest level since the end of last May, amid a state of anxiety in markets after the U.S. Treasury pledged to increase its long-term bond buyback operations. Traders are also awaiting details of sanctions imposed on Iran, as well as remarks by officials from monetary policy in the United States and Japan this week.
In trading, the dollar index rose by 0.2% to 98.9 points by 11:36 GMT.
Trade tensions weighed on the Canadian dollar, which fell by 0.5% to 1.3836 Canadian dollars versus the U.S. dollar, after Washington imposed 50% tariffs on Canadian goods and Canada responded with similar measures.
$XAU
#BitcoinOpenInterestFallsToTwoMonthLow #BitcoinRises23.6%Weekly #AIHardwareStocksFallPreMarketAAOIDown11.66% #EtherETFsPost$697MWeeklyInflow #USTreasuryDoublesBuybackCapTo$4B The dollar rises from its lowest levels in about 3
months amid fears over debt
The U.S. dollar rose during Monday’s trading, recovering marginally from its lowest level since the end of last May, amid a state of anxiety in markets after the U.S. Treasury pledged to increase its long-term bond buyback operations. Traders are also awaiting details of sanctions imposed on Iran, as well as remarks by officials from monetary policy in the United States and Japan this week.
In trading, the dollar index rose by 0.2% to 98.9 points by 11:36 GMT.
Trade tensions weighed on the Canadian dollar, which fell by 0.5% to 1.3836 Canadian dollars versus the U.S. dollar, after Washington imposed 50% tariffs on Canadian goods and Canada responded with similar measures.
146

·
--
Bullish
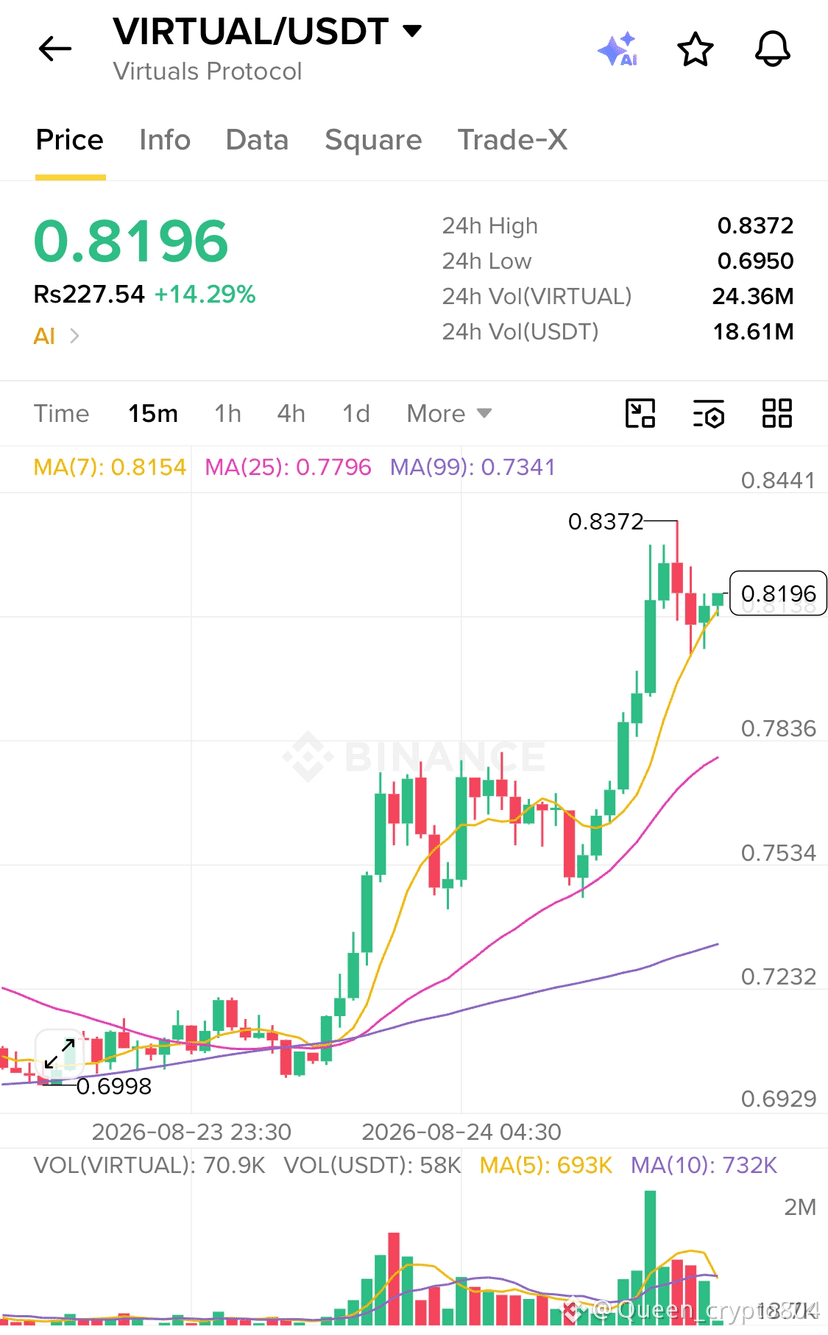
$VIRTUAL /USDT Trading Alert
I’m watching VIRTUAL closely here. Price is moving with strong momentum, but after a big push, I’d rather wait for a better entry than chase the move.
Current price: $0.8196
24H change: +14.29%
Buy zone: $0.795–$0.810
Targets:
$0.8372
$0.8600
$0.9000
Stop-loss: $0.7750
Key support:
$0.8000
$0.7836
$0.7796
Key resistance:
$0.8372
Market feeling: Bullish
I’m bullish as long as VIRTUAL holds the $0.795–$0.800 area. The trend is strong, the moving averages are rising, and buying volume increased during the breakout.
But I’m not chasing. If price breaks and holds above $0.8372, I’d watch for the next push toward $0.86 and potentially $0.90.
If $0.775 breaks, I’d step back and protect capital.
Follow for more and Share with your friend my account.
{spot}(VIRTUALUSDT)
#BitcoinOpenInterestFallsToTwoMonthLow #BitcoinRises23.6%Weekly #USTreasuryDoublesBuybackCapTo$4B #SP500FuturesFall #SamsungFalls8.97%DraggingKospiDown3.24%
$VIRTUAL /USDT Trading Alert
I’m watching VIRTUAL closely here. Price is moving with strong momentum, but after a big push, I’d rather wait for a better entry than chase the move.
Current price: $0.8196
24H change: +14.29%
Buy zone: $0.795–$0.810
Targets:
$0.8372
$0.8600
$0.9000
Stop-loss: $0.7750
Key support:
$0.8000
$0.7836
$0.7796
Key resistance:
$0.8372
Market feeling: Bullish
I’m bullish as long as VIRTUAL holds the $0.795–$0.800 area. The trend is strong, the moving averages are rising, and buying volume increased during the breakout.
But I’m not chasing. If price breaks and holds above $0.8372, I’d watch for the next push toward $0.86 and potentially $0.90.
If $0.775 breaks, I’d step back and protect capital.
Follow for more and Share with your friend my account.
#BitcoinOpenInterestFallsToTwoMonthLow #BitcoinRises23.6%Weekly #USTreasuryDoublesBuybackCapTo$4B #SP500FuturesFall #SamsungFalls8.97%DraggingKospiDown3.24%
I’m watching VIRTUAL closely here. Price is moving with strong momentum, but after a big push, I’d rather wait for a better entry than chase the move.
Current price: $0.8196
24H change: +14.29%
Buy zone: $0.795–$0.810
Targets:
$0.8372
$0.8600
$0.9000
Stop-loss: $0.7750
Key support:
$0.8000
$0.7836
$0.7796
Key resistance:
$0.8372
Market feeling: Bullish
I’m bullish as long as VIRTUAL holds the $0.795–$0.800 area. The trend is strong, the moving averages are rising, and buying volume increased during the breakout.
But I’m not chasing. If price breaks and holds above $0.8372, I’d watch for the next push toward $0.86 and potentially $0.90.
If $0.775 breaks, I’d step back and protect capital.
Follow for more and Share with your friend my account.
#BitcoinOpenInterestFallsToTwoMonthLow #BitcoinRises23.6%Weekly #USTreasuryDoublesBuybackCapTo$4B #SP500FuturesFall #SamsungFalls8.97%DraggingKospiDown3.24%
139

….$BITCOIN has made the news.
I hv gain a voucher.
#EtherETFsPost$697MWeeklyInflow #BitcoinOpenInterestFallsToTwoMonthLow #EtherETFsPost$697MWeeklyInflow #USTreasuryDoublesBuybackCapTo$4B
….$BITCOIN has made the news.
I hv gain a voucher.
#EtherETFsPost$697MWeeklyInflow #BitcoinOpenInterestFallsToTwoMonthLow #EtherETFsPost$697MWeeklyInflow #USTreasuryDoublesBuybackCapTo$4B
I hv gain a voucher.
#EtherETFsPost$697MWeeklyInflow #BitcoinOpenInterestFallsToTwoMonthLow #EtherETFsPost$697MWeeklyInflow #USTreasuryDoublesBuybackCapTo$4B
82

·
--
Bullish
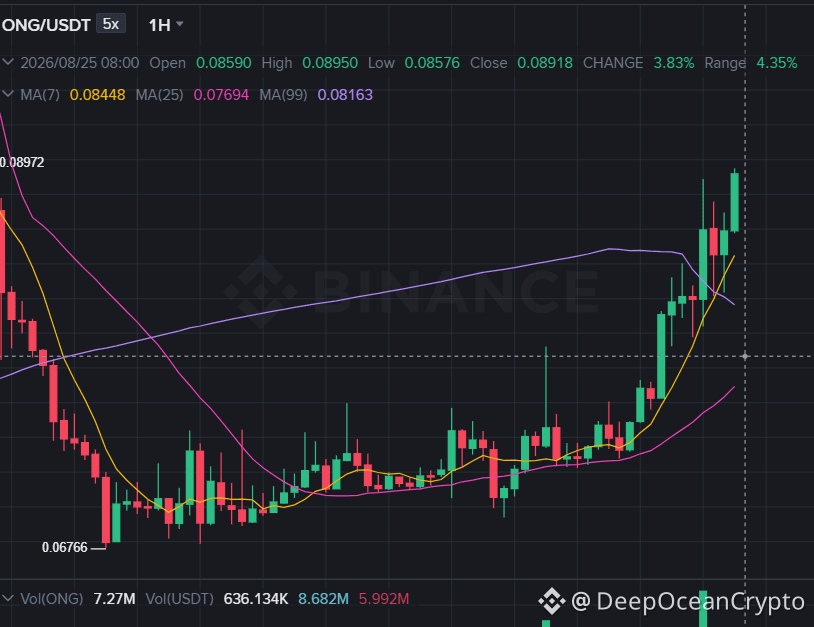
$ONG 🟢 ONG/USDT — LONG SIGNAL
Entry Zone: 0.0878 – 0.0892
Breakout: 0.0897+ with 1H hold 🚀
SL: 0.0855
TP1: 0.0915 🎯
TP2: 0.0940 🎯
TP3: 0.0970 🔥
Bias: 🟢 Bullish
Momentum: Building
Structure: Price is above MA7, MA25 and MA99 — buyers have the edge.
The move:
Hold 0.088 → LONG stays alive.
Break 0.0897 → momentum can accelerate.
Lose 0.0855 → GET OUT.
SIGNAL → LONG 🟢
Confidence → 7.5/10
Let the setup come to you. 😎🔥#ONGCOIN #USTreasuryDoublesBuybackCapTo$4B #BitcoinOpenInterestFallsToTwoMonthLow
{spot}(ONGUSDT)
$ONG 🟢 ONG/USDT — LONG SIGNAL
Entry Zone: 0.0878 – 0.0892
Breakout: 0.0897+ with 1H hold 🚀
SL: 0.0855
TP1: 0.0915 🎯
TP2: 0.0940 🎯
TP3: 0.0970 🔥
Bias: 🟢 Bullish
Momentum: Building
Structure: Price is above MA7, MA25 and MA99 — buyers have the edge.
The move:
Hold 0.088 → LONG stays alive.
Break 0.0897 → momentum can accelerate.
Lose 0.0855 → GET OUT.
SIGNAL → LONG 🟢
Confidence → 7.5/10
Let the setup come to you. 😎🔥#ONGCOIN #USTreasuryDoublesBuybackCapTo$4B #BitcoinOpenInterestFallsToTwoMonthLow
Entry Zone: 0.0878 – 0.0892
Breakout: 0.0897+ with 1H hold 🚀
SL: 0.0855
TP1: 0.0915 🎯
TP2: 0.0940 🎯
TP3: 0.0970 🔥
Bias: 🟢 Bullish
Momentum: Building
Structure: Price is above MA7, MA25 and MA99 — buyers have the edge.
The move:
Hold 0.088 → LONG stays alive.
Break 0.0897 → momentum can accelerate.
Lose 0.0855 → GET OUT.
SIGNAL → LONG 🟢
Confidence → 7.5/10
Let the setup come to you. 😎🔥#ONGCOIN #USTreasuryDoublesBuybackCapTo$4B #BitcoinOpenInterestFallsToTwoMonthLow
1
180

Article
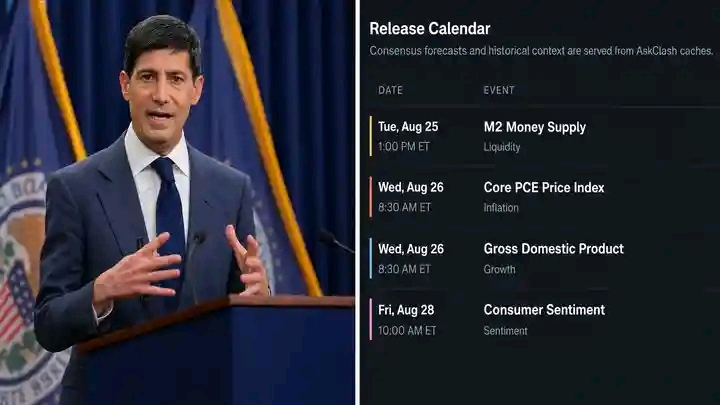
MACRO: Markets face a key data test this week.Wednesday brings Core PCE inflation and U.S. GDP, while Fed Chair Kevin Warsh speaks at Jackson Hole on Friday.
Cooler inflation with steady growth could support lower yields, stocks and crypto. Hotter data or a hawkish Fed message could bring volatility bac$SOL
k.
$AMZNB
{spot}(AMZNBUSDT)
$NVDAB
{spot}(NVDABUSDT)
#AIHardwareStocksFallPreMarketAAOIDown11.66% #USTreasuryDoublesBuybackCapTo$4B
MACRO: Markets face a key data test this week.
Wednesday brings Core PCE inflation and U.S. GDP, while Fed Chair Kevin Warsh speaks at Jackson Hole on Friday.
Cooler inflation with steady growth could support lower yields, stocks and crypto. Hotter data or a hawkish Fed message could bring volatility bac$SOL
k.
$AMZNB
$NVDAB
#AIHardwareStocksFallPreMarketAAOIDown11.66% #USTreasuryDoublesBuybackCapTo$4B
Cooler inflation with steady growth could support lower yields, stocks and crypto. Hotter data or a hawkish Fed message could bring volatility bac$SOL
k.
$AMZNB
$NVDAB
#AIHardwareStocksFallPreMarketAAOIDown11.66% #USTreasuryDoublesBuybackCapTo$4B
40


Log in to explore more content
Join global crypto users on Binance Square
⚡️ Get latest and useful information about crypto.
💬 Trusted by the world’s largest crypto exchange.
👍 Discover real insights from verified creators.
Email / Phone number
Trending Topics
1
#SECHaltsCryptoETFReviewsAmidFundingLapse
79,807 views
818 Discussing
2
#ZcashETFPostsFirstWeeklyOutflow$93.6M
68,059 views
214 Discussing
3
#GreekPoliceBustCryptoScamRingArrest17
233,128 views
1,618 Discussing
4
#BitcoinRejectedAt$87K
173,931 views
269 Discussing
5
#FedOctoberRateHikeOddsFallTo17%
251,698 views
1,783 Discussing
6
#NvidiaHitsRecordHighUp2.4%
173,029 views
1,242 Discussing
7
#CanaryFilesAmendedS1ForPEPEETF
53,250 views
828 Discussing
8
#BitcoinParesGainsAfterRallyTo$86.5K
60,848 views
182 Discussing
9
#CerebrasSinksNearly20%OnReportNvidiaToPowerOpenAI
163,856 views
1,411 Discussing
10
#SECProposesCryptoCustodyRules
230,847 views
1,754 Discussing