Binance Square
#btcreaches$80000

btcreaches$80000

Shontz
·
--
Bullish
Bitcoin Stalking the $80,000 Milestone: Genuine Expansion vs. Liquidity Exhaustion Bitcoin is aggressively knocking on the door of the $80,000 mark after surging from $64,000 to tap local highs near $79,800. While retail timelines are already pricing in a parabolic continuation, examining the structural conditions near psychological thresholds provides a clearer picture of market health. Key Structural Drivers Behind the Push: Cascading Squeeze vs. Spot ETF Backing: The explosive run toward $80k was heavily propelled by forced short liquidations as $BTC cleared key resistance between $72k–$75k. Crucially, this was accompanied by nearly $2B in weekly spot ETF inflows, signaling institutional capital absorption rather than an isolated leverage spike. The $80k Psychological Wall: The $79,500–$80,000 band represents a massive cluster of resting limit sell orders and un-triggered call option open interest. As price probes this ceiling, buyers must absorb heavy distribution from earlier dip-buyers taking profit. Macro Tailwinds: The broader hard-asset expansion—catalyzed by softer Treasury yields and dollar weakness, continues to provide macro liquidity support for digital assets. The Structural Reality: Reaching a major psychological round number like $80,000 often triggers a high-volatility liquidity sweep before genuine price discovery begins. If aggressive breakout buyers get absorbed at the threshold, a healthy consolidation toward the $75,500–$76,500 support shelf would allow the market to build structure. A clean reclaim of $80k with sustained spot volume opens the door to further expansion, but chasing momentum directly into multi-month supply walls carries high asymmetric risk. #BTCReaches$80000

Bitcoin Stalking the $80,000 Milestone: Genuine Expansion vs. Liquidity Exhaustion

Bitcoin is aggressively knocking on the door of the $80,000 mark after surging from $64,000 to tap local highs near $79,800. While retail timelines are already pricing in a parabolic continuation, examining the structural conditions near psychological thresholds provides a clearer picture of market health.

Key Structural Drivers Behind the Push:

Cascading Squeeze vs. Spot ETF Backing:

The explosive run toward $80k was heavily propelled by forced short liquidations as $BTC cleared key resistance between $72k–$75k. Crucially, this was accompanied by nearly $2B in weekly spot ETF inflows, signaling institutional capital absorption rather than an isolated leverage spike.

The $80k Psychological Wall:

The $79,500–$80,000 band represents a massive cluster of resting limit sell orders and un-triggered call option open interest. As price probes this ceiling, buyers must absorb heavy distribution from earlier dip-buyers taking profit.

Macro Tailwinds:

The broader hard-asset expansion—catalyzed by softer Treasury yields and dollar weakness, continues to provide macro liquidity support for digital assets.

The Structural Reality:
Reaching a major psychological round number like $80,000 often triggers a high-volatility liquidity sweep before genuine price discovery begins. If aggressive breakout buyers get absorbed at the threshold, a healthy consolidation toward the $75,500–$76,500 support shelf would allow the market to build structure.

A clean reclaim of $80k with sustained spot volume opens the door to further expansion, but chasing momentum directly into multi-month supply walls carries high asymmetric risk.

#BTCReaches$80000
erhang:
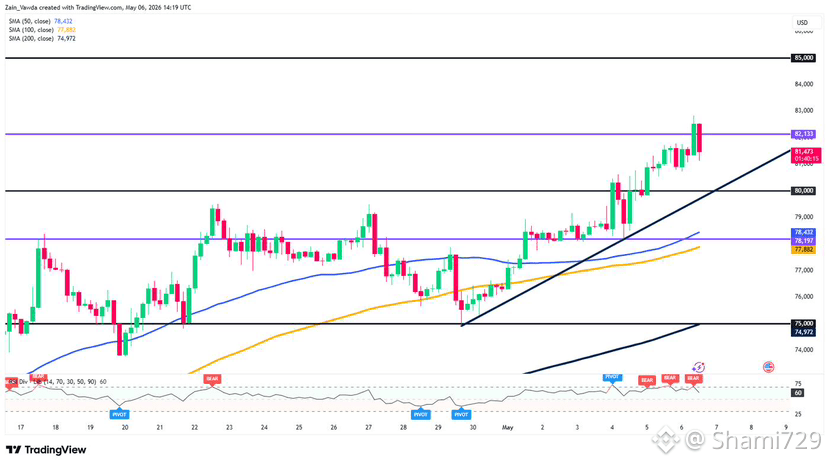
We’d separate price expansion from leverage expansion here: $BTC 24h OI is up just 0.07%, with funding at a 0.03% daily equivalent. The 1D trend is strong, but an 82.3 RSI makes follow-through more informative than the first touch of 80000. #BTCReaches$80000

🚨 $BTC — THE LINE IN THE SAND 🚨 If $BTC breaks above $83K and closes the weekly candle above it, I’ll consider the bear market officially over. 🐂📈 That would invalidate the expectation of another revisit to the range lows. And yes — I’ll be wrong too. 🤝 No moving the goalposts. No changing the narrative afterward. The level is $83K. The weekly close is what matters. 🎯 Let the market decide. ⚔️📊 #bitcoin #BitcoinRejectedAt$81K50WeekMA #BTCReaches$80000 #Binance {spot}(BTCUSDT)
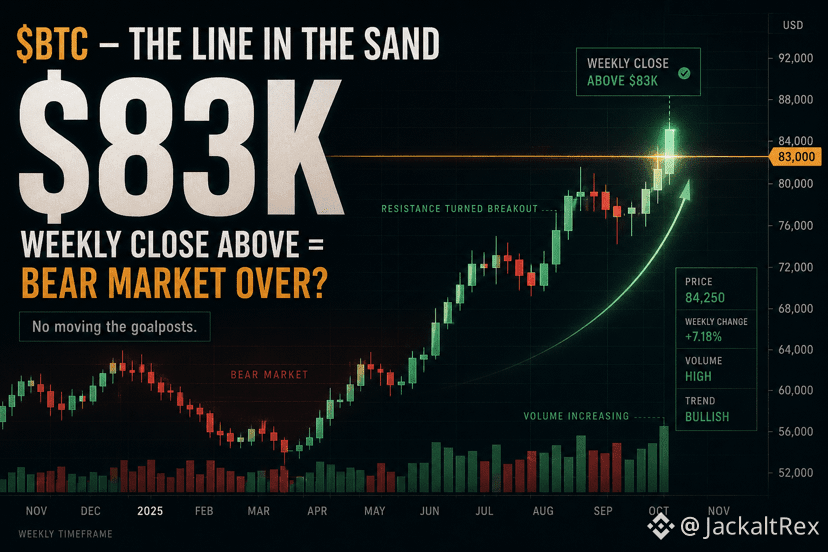
🚨 $BTC — THE LINE IN THE SAND 🚨

If $BTC breaks above $83K and closes the weekly candle above it, I’ll consider the bear market officially over. 🐂📈

That would invalidate the expectation of another revisit to the range lows.

And yes — I’ll be wrong too. 🤝

No moving the goalposts.
No changing the narrative afterward.
The level is $83K. The weekly close is what matters. 🎯

Let the market decide. ⚔️📊

#bitcoin #BitcoinRejectedAt$81K50WeekMA #BTCReaches$80000 #Binance

Article
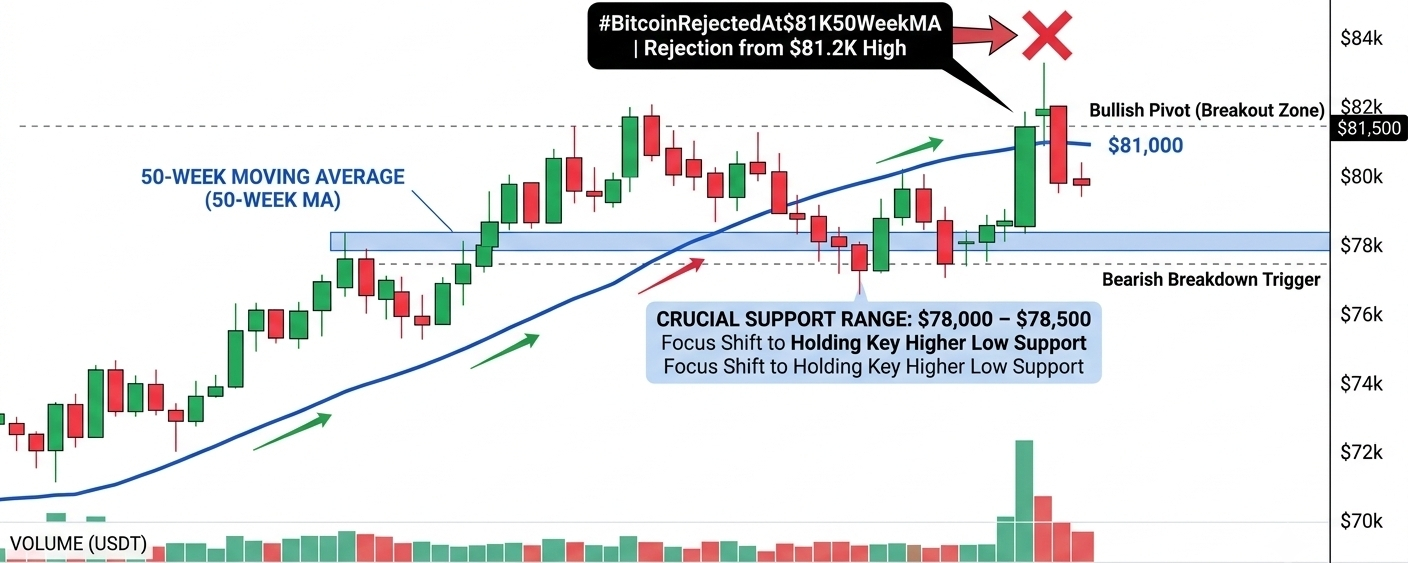
Bitcoin Faces Resistance: Rejection at $81K and the 50-Week MABitcoin ($BTC ) briefly surged past $81,200 before encountering heavy selling pressure that dragged prices back below $80,000. This reaction directly at the 50-week Moving Average (50-week MA) highlights the strength of macro resistance overhead. ​Key Takeaways ​Institutional Overhead: The 50-week MA is a crucial benchmark for institutional trend health. Defending this boundary proves bears remain aggressive at macro supply zones.​Volume Shortfall: Pushing to $81.2K generated initial optimism, but a lack of follow-through spot buying prevented a sustained breakout above $81,000.​Support to Watch: Retracting under $80,000 shifts focus toward $78,000–$78,500. Defense of this zone is critical to maintain a constructive higher-low structure. ​Technical Outlook ​From a structural standpoint, the market is navigating three distinct paths: a bullish breakout requires a decisive daily close above $81,500 to confirm trend continuation and target the $84,000–$86,000 range; a neutral consolidation phase will see $BTC bounce between $78,000 and $80,000 to build localized support; and a bearish breakdown below $77,500 risks accelerating downside momentum toward major $74,000 support levels. ​Rejection at key moving averages urges caution against chasing premature breakouts. Traders should track spot volume and weekly closes near $81,000 before taking leveraged positions. ​Disclaimer: Educational content only. DYOR. #BitcoinRejectedAt$81K50WeekMA #BTC #BTCReaches$80000 #btcbullrun

Bitcoin Faces Resistance: Rejection at $81K and the 50-Week MA

Bitcoin ($BTC ) briefly surged past $81,200 before encountering heavy selling pressure that dragged prices back below $80,000. This reaction directly at the 50-week Moving Average (50-week MA) highlights the strength of macro resistance overhead.
​Key Takeaways
​Institutional Overhead: The 50-week MA is a crucial benchmark for institutional trend health. Defending this boundary proves bears remain aggressive at macro supply zones.​Volume Shortfall: Pushing to $81.2K generated initial optimism, but a lack of follow-through spot buying prevented a sustained breakout above $81,000.​Support to Watch: Retracting under $80,000 shifts focus toward $78,000–$78,500. Defense of this zone is critical to maintain a constructive higher-low structure.
​Technical Outlook
​From a structural standpoint, the market is navigating three distinct paths: a bullish breakout requires a decisive daily close above $81,500 to confirm trend continuation and target the $84,000–$86,000 range; a neutral consolidation phase will see $BTC bounce between $78,000 and $80,000 to build localized support; and a bearish breakdown below $77,500 risks accelerating downside momentum toward major $74,000 support levels.
​Rejection at key moving averages urges caution against chasing premature breakouts. Traders should track spot volume and weekly closes near $81,000 before taking leveraged positions.
​Disclaimer: Educational content only. DYOR.
#BitcoinRejectedAt$81K50WeekMA #BTC #BTCReaches$80000 #btcbullrun
·
--
Bullish
$BTC  tagged $80,000 — four times. Still no close above it. 101 days later, price finally kisses the round number: 79,970 → 79,838 → 79,857 → 79,935. Four wicks, four rejections. The sellers at 80 are real — one whale reportedly shipped $570M into the ask over three days. But the fuel is real too: $1.9B weekly ETF inflows (best in 10 months), IBIT $503M in a single session, Strive adding 1,110 $BTC ($81.5M), $220M shorts liquidated in 24h — and a Treasury liquidity tailwind (~$950B TGA) capping the long end. Fear & Greed at 80 (Extreme Greed) . Everyone is staring at the same line. $BTC Setup — Pullback long Entry 78,400–78,700 (demand zone) SL 77,900  Invalidation: 1H close < 78,000TPs TP1 79,500 · TP2 79,970–80,000 · TP3 80,800 {future}(BTCUSDT) 1H close above $80,100 = breakout, not a wick. Close below $78,000 = this run gets a hangover. Round number szn. The last wall before the next leg. 🐂 #BitcoinOpenInterestFallsToTwoMonthLow #BTCReaches$80000 #BitcoinRises23.6%Weekly #AIHardwareStocksFallPreMarketAAOIDown11.66% #EtherETFsPost$697MWeeklyInflow

$BTC tagged $80,000 — four times. Still no close above it.
101 days later, price finally kisses the round number: 79,970 → 79,838 → 79,857 → 79,935. Four wicks, four rejections. The sellers at 80 are real — one whale reportedly shipped $570M into the ask over three days.

But the fuel is real too: $1.9B weekly ETF inflows (best in 10 months), IBIT $503M in a single session, Strive adding 1,110 $BTC ($81.5M), $220M shorts liquidated in 24h — and a Treasury liquidity tailwind (~$950B TGA) capping the long end.
Fear & Greed at 80 (Extreme Greed) . Everyone is staring at the same line.

$BTC Setup — Pullback long
Entry 78,400–78,700 (demand zone)
SL 77,900
Invalidation: 1H close < 78,000TPs
TP1 79,500 · TP2 79,970–80,000 · TP3 80,800

1H close above $80,100 = breakout, not a wick. Close below $78,000 = this run gets a hangover.
Round number szn. The last wall before the next leg. 🐂

#BitcoinOpenInterestFallsToTwoMonthLow #BTCReaches$80000 #BitcoinRises23.6%Weekly #AIHardwareStocksFallPreMarketAAOIDown11.66% #EtherETFsPost$697MWeeklyInflow
·
--
Bullish
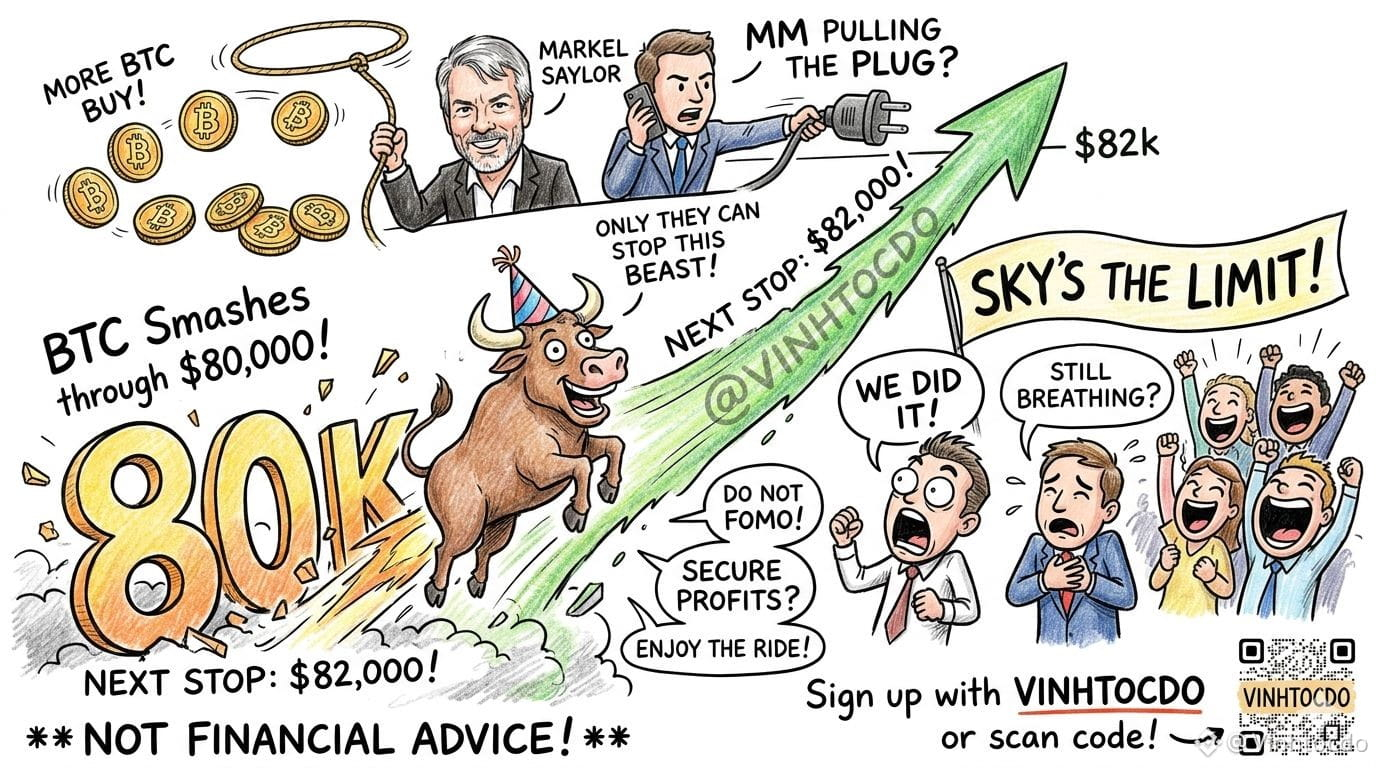
#BTCReaches$80000 🚀 We actually did it! BTC just smashed through $80,000! 🎉 Is everyone still breathing or are we all collectively screaming?! Next stop: $82,000! 🛑 If Bitcoin clears that level, honestly, nobody can stop this beast except Michael Saylor buying even more or the Market Makers pulling the plug! 😂 The sky is the limit! What should traders do right now? 1️⃣ Do NOT FOMO into the green candle (easier said than done, right?). 2️⃣ Secure some profits or just enjoy the legendary ride. 3️⃣ Remind yourself: This is not financial advice! ⚠️ Let's ride this bull together! Sign up using code VINHTOCDO or click here: [https://www.binance.com/register?ref=VINHTOCDO](https://www.binance.com/register?ref=VINHTOCDO) 💰 #Bitcoin #BTC #Bullrun #VINHTOCDO $BTC {future}(BTCUSDT) $ETH {future}(ETHUSDT) $BNB {future}(BNBUSDT)
#BTCReaches$80000 🚀
We actually did it! BTC just smashed through $80,000! 🎉 Is everyone still breathing or are we all collectively screaming?!
Next stop: $82,000! 🛑 If Bitcoin clears that level, honestly, nobody can stop this beast except Michael Saylor buying even more or the Market Makers pulling the plug! 😂 The sky is the limit!
What should traders do right now?
1️⃣ Do NOT FOMO into the green candle (easier said than done, right?).
2️⃣ Secure some profits or just enjoy the legendary ride.
3️⃣ Remind yourself: This is not financial advice! ⚠️
Let's ride this bull together! Sign up using code VINHTOCDO or click here: https://www.binance.com/register?ref=VINHTOCDO 💰
#Bitcoin #BTC #Bullrun #VINHTOCDO
$BTC
$ETH
$BNB
₿ BTC/USDT — TODAY'S MARKET OUTLOOK | AUGUST 25, 2026 🔥 BIAS: BULLISH — BUT DON'T CHASE THE BREAKOUT Bitcoin has successfully pushed through the psychological $80,000 level and printed an intraday high around $81,200. The key question now is not whether BTC can touch $80K — it already has. The question is whether $80K becomes support. 📍 KEY LEVELS 🔴 Major Resistance: $80,800 – $81,300 🟢 Breakout Confirmation: A clean 30M/1H close above $81,300, followed by a successful retest, would strengthen the bullish continuation setup. 🔵 Primary Support: $79,200 – $79,500 🔵 Secondary Support: $78,200 – $78,700 🔵 Major Support: $77,000 – $77,200 📈 BULLISH SCENARIO If BTC holds above $79.2K–$79.5K and buyers reclaim $80.8K–$81.3K, I will look for continuation toward: 🎯 TP1: $82,500 🎯 TP2: $84,000 🎯 TP3: $85,500+ Best approach: wait for a breakout + retest instead of chasing the candle. 📉 BEARISH SCENARIO If BTC strongly rejects $80.8K–$81.3K and loses $79.2K, a deeper pullback becomes possible. Potential downside targets: 🎯 TP1: $78,700 🎯 TP2: $77,200 🎯 TP3: $75,900 A sustained move below $77K would weaken the current bullish structure considerably. 🧠 MY PLAN 🟢 Bullish above $79.2K 🔥 Major decision zone: $80.8K–$81.3K 🚀 Break + retest above $81.3K = continuation setup 🔴 Loss of $79.2K = pullback risk ⚠️ Risk Management: BTC has already made a powerful move. Don't FOMO into the top. Wait for confirmation, use a defined stop-loss and keep leverage under control. Patience > FOMO. Confirmation > Prediction. Protect the capital first. 💰📊 #Bitcoin #BTC #BTCUSDT #Crypto #Cryptocurrency #Binance #BreakoutTrading #SupportAndResistance #PriceAction #CryptoMarket #DigitalAssets #Altcoins #DeFi #BitcoinOpenInterestFallsToTwoMonthLow Web3 #BTCReaches$80000

₿ BTC/USDT — TODAY'S MARKET OUTLOOK | AUGUST 25, 2026
🔥 BIAS: BULLISH — BUT DON'T CHASE THE BREAKOUT
Bitcoin has successfully pushed through the psychological $80,000 level and printed an intraday high around $81,200.
The key question now is not whether BTC can touch $80K — it already has.
The question is whether $80K becomes support.
📍 KEY LEVELS
🔴 Major Resistance:
$80,800 – $81,300
🟢 Breakout Confirmation:
A clean 30M/1H close above $81,300, followed by a successful retest, would strengthen the bullish continuation setup.
🔵 Primary Support:
$79,200 – $79,500
🔵 Secondary Support:
$78,200 – $78,700
🔵 Major Support:
$77,000 – $77,200
📈 BULLISH SCENARIO
If BTC holds above $79.2K–$79.5K and buyers reclaim $80.8K–$81.3K, I will look for continuation toward:
🎯 TP1: $82,500
🎯 TP2: $84,000
🎯 TP3: $85,500+
Best approach: wait for a breakout + retest instead of chasing the candle.
📉 BEARISH SCENARIO
If BTC strongly rejects $80.8K–$81.3K and loses $79.2K, a deeper pullback becomes possible.
Potential downside targets:
🎯 TP1: $78,700
🎯 TP2: $77,200
🎯 TP3: $75,900
A sustained move below $77K would weaken the current bullish structure considerably.
🧠 MY PLAN
🟢 Bullish above $79.2K
🔥 Major decision zone: $80.8K–$81.3K
🚀 Break + retest above $81.3K = continuation setup
🔴 Loss of $79.2K = pullback risk
⚠️ Risk Management: BTC has already made a powerful move. Don't FOMO into the top. Wait for confirmation, use a defined stop-loss and keep leverage under control.
Patience > FOMO.
Confirmation > Prediction.
Protect the capital first. 💰📊

#Bitcoin #BTC #BTCUSDT #Crypto #Cryptocurrency #Binance #BreakoutTrading #SupportAndResistance #PriceAction #CryptoMarket #DigitalAssets #Altcoins #DeFi #BitcoinOpenInterestFallsToTwoMonthLow Web3 #BTCReaches$80000
🚨 $BTC $85K FIRST… THEN $75K? Everyone is bullish after BTC blasted above $80K. I'm not convinced the next move is straight up. BTC has just posted roughly a 25% weekly rally, while ETF inflows and the weaker-dollar/debasement narrative are helping fuel the move. But here's my unpopular take: $85K could come before the real test begins. If BTC pushes toward $85K and then the crowd becomes too bullish, a sharp reversal toward $75K wouldn't surprise me. 📈 Bull case: $85K+ breakout ⚠️ My risk zone: $75K 👀 Key question: Can BTC hold the breakout after the FOMO arrives? Would you buy $85K BTC — or wait for a possible $75K pullback? 📊 Open $BTC and check the chart. ⚠️ Personal market opinion only. Not financial advice. DYOR. #BTC #Bitcoin #Crypto #Binance #cryptotrading #BTCAnalysis #BTCReaches$80000 {spot}(BTCUSDT)
🚨 $BTC $85K FIRST… THEN $75K?
Everyone is bullish after BTC blasted above $80K.
I'm not convinced the next move is straight up.
BTC has just posted roughly a 25% weekly rally, while ETF inflows and the weaker-dollar/debasement narrative are helping fuel the move.
But here's my unpopular take:
$85K could come before the real test begins.
If BTC pushes toward $85K and then the crowd becomes too bullish, a sharp reversal toward $75K wouldn't surprise me.
📈 Bull case: $85K+ breakout
⚠️ My risk zone: $75K
👀 Key question: Can BTC hold the breakout after the FOMO arrives?
Would you buy $85K BTC — or wait for a possible $75K pullback?
📊 Open $BTC and check the chart.
⚠️ Personal market opinion only. Not financial advice. DYOR.
#BTC #Bitcoin #Crypto #Binance #cryptotrading #BTCAnalysis
#BTCReaches$80000
Article
Is this $79k BTC and Solana bounce a massive trap?If you’ve looked at your charts over the last week, your phone has probably {spot}(BTCUSDT) been blowing up with alerts. Bitcoin just snapped right back to $80,000, Ethereum is sitting above {spot}(ETHUSDT) $2,400, and Solana easily cleared {spot}(SOLUSDT) $94 again. I know exactly what you’re feeling right now if you’re sitting on cash like FOMO. It feels like the train is leaving the station, the next massive bull run is expected. But before you open your exchange app and panic, take a deep breath. Let’s actually look at what the data is telling us. Having seen multiple full crypto cycles—2016, 2020, and 2024—I want to give you a quick reality check. This 10% to 30% pump isn't the start of the next golden age. It’s highly likely a classic "relief rally" trap. Here is what’s actually happening behind the screens right now. 🔎 What actually triggered this pump? When crypto shoots up 20% in a few days, retail investors always assume it’s because "mass adoption" or big institutions are finally here. It’s almost never that. This move was manufactured by two very specific things: 1. The US Treasury Injected Cash A few days ago, the US Treasury injected a massive wave of short-term liquidity into global financial systems by buying back long-dated bonds. Think of this cash injection like a shot of adrenaline for high-risk assets. Tech stocks bumped up, and the crypto market tagged along for the ride. 2. The Over-Leveraged Shorts Got Absolutely Destroyed For the past two months, everyone and their brother was shorting this market, betting that crypto was going to tank. When the Treasury cash caused prices to tick up even a tiny bit, it triggered a chain reaction. All those short positions were forcefully liquidated by the exchanges. In futures trading, getting liquidated forces an automatic, market-buy order. This created an artificial vacuum that aggressively dragged Bitcoin and Solana upward. It was a structural wipeout of debt, not a wave of real that long-term investors buying actual coins on the spot market. 📊 The Pre-Halving Rule: What history proves Crypto operates on pretty rigid, hardcoded 4-year cycles because of the Bitcoin Halving. The next halving isn't until around April 2028. The two years before a halving which is exactly where we are right now are historically known as the boring, painful Accumulation Phase (or Crypto Winter). Look at how the market treated eager buyers during these exact same windows in the past: The 2019 Fake-out: In mid-2019, Bitcoin suddenly doubled in a few months. Everyone screamed that the bull market was back. It wasn't. The market turned right around, crashed over 50%, and went sideways for a year until the actual halving happened.The 2023 Relief Trap: Late 2023 saw massive 30% bounces that looked unstoppable, only for the market to violently drop back down and test absolute rock bottom right before the real liftoff. A real multi trillion dollar macro bull run never starts two years before a halving. The market requires months of boring, exhausting, sideways movement to completely wipe out retail patience before the real wealth expansion begins. 📉 What happens next? Expect one final flush A market can't keep climbing forever just on short term liquidations. Right now, global interest rates are still incredibly high, meaning big institutional money is perfectly happy sitting in safe government bonds instead of risking it on altcoins. Once this short squeeze runs out of steam over the next few weeks, the momentum is going to fade. Historically, before every major halving run, there is always one Final Crash -a sudden, ugly 30% to 50% drop across the entire market, usually triggered by a bad global news headline. This final drop is entirely intentional: it scares away the remaining retail traders and lets Wall Street whales scoop up cheap spot assets at a massive discount. 💡 My exact strategy to handle this Instead of playing like gambler, play like an institutional insider. 1. Keep your cash flat If you did not take this pump till now, Don't be FOMO into these green candles. Keep your core investing capital sitting completely flat in safe, stable $USDC or cash. By staying in spot cash, you are completely immune to this short-term volatility. Avoid futures, leverage, or margin trading entirely 2. Wait for the "Dead Time" Let the market bounce up and down all it wants. Just wait out the hype. When that final, painful crash arrives, and the internet is screaming that crypto is officially dead for the time. that is your buy signal. That is when you deploy your cash into heavily discounted, high-utility Spot layer-1s (like $LINK, $TAO, and $SUI) at rock-bottom prices. Hold those actual, physical spot coins through the 2028 halving, set your sell limits, and walk away. You’ll be perfectly positioned to cash out your 10x to 50x returns back into stablecoins during the actual bull market peak—winning the entire game without ever sweating the daily charts. What's your move during this $80k $recovery?Keeping my capital flat in stablecoins 💵Buying the bounce / FOMOing in 🚀Shorting the market 📉#BTCReaches$80000 #BTC #CryptoPatience #sol

Is this $79k BTC and Solana bounce a massive trap?

If you’ve looked at your charts over the last week, your phone has probably
been blowing up with alerts. Bitcoin just snapped right back to $80,000, Ethereum is sitting above
$2,400, and Solana easily cleared
$94 again.
I know exactly what you’re feeling right now if you’re sitting on cash like FOMO. It feels like the train is leaving the station, the next massive bull run is expected.
But before you open your exchange app and panic, take a deep breath. Let’s actually look at what the data is telling us.
Having seen multiple full crypto cycles—2016, 2020, and 2024—I want to give you a quick reality check. This 10% to 30% pump isn't the start of the next golden age. It’s highly likely a classic "relief rally" trap.
Here is what’s actually happening behind the screens right now.
🔎 What actually triggered this pump?
When crypto shoots up 20% in a few days, retail investors always assume it’s because "mass adoption" or big institutions are finally here. It’s almost never that. This move was manufactured by two very specific things:
1. The US Treasury Injected Cash
A few days ago, the US Treasury injected a massive wave of short-term liquidity into global financial systems by buying back long-dated bonds. Think of this cash injection like a shot of adrenaline for high-risk assets. Tech stocks bumped up, and the crypto market tagged along for the ride.
2. The Over-Leveraged Shorts Got Absolutely Destroyed
For the past two months, everyone and their brother was shorting this market, betting that crypto was going to tank. When the Treasury cash caused prices to tick up even a tiny bit, it triggered a chain reaction. All those short positions were forcefully liquidated by the exchanges.
In futures trading, getting liquidated forces an automatic, market-buy order. This created an artificial vacuum that aggressively dragged Bitcoin and Solana upward. It was a structural wipeout of debt, not a wave of real that long-term investors buying actual coins on the spot market.
📊 The Pre-Halving Rule: What history proves
Crypto operates on pretty rigid, hardcoded 4-year cycles because of the Bitcoin Halving. The next halving isn't until around April 2028.
The two years before a halving which is exactly where we are right now are historically known as the boring, painful Accumulation Phase (or Crypto Winter). Look at how the market treated eager buyers during these exact same windows in the past:
The 2019 Fake-out: In mid-2019, Bitcoin suddenly doubled in a few months. Everyone screamed that the bull market was back. It wasn't. The market turned right around, crashed over 50%, and went sideways for a year until the actual halving happened.The 2023 Relief Trap: Late 2023 saw massive 30% bounces that looked unstoppable, only for the market to violently drop back down and test absolute rock bottom right before the real liftoff.
A real multi trillion dollar macro bull run never starts two years before a halving. The market requires months of boring, exhausting, sideways movement to completely wipe out retail patience before the real wealth expansion begins.
📉 What happens next? Expect one final flush
A market can't keep climbing forever just on short term liquidations. Right now, global interest rates are still incredibly high, meaning big institutional money is perfectly happy sitting in safe government bonds instead of risking it on altcoins.
Once this short squeeze runs out of steam over the next few weeks, the momentum is going to fade.
Historically, before every major halving run, there is always one Final Crash -a sudden, ugly 30% to 50% drop across the entire market, usually triggered by a bad global news headline. This final drop is entirely intentional: it scares away the remaining retail traders and lets Wall Street whales scoop up cheap spot assets at a massive discount.
💡 My exact strategy to handle this
Instead of playing like gambler, play like an institutional insider.
1. Keep your cash flat
If you did not take this pump till now, Don't be FOMO into these green candles. Keep your core investing capital sitting completely flat in safe, stable $USDC or cash. By staying in spot cash, you are completely immune to this short-term volatility. Avoid futures, leverage, or margin trading entirely
2. Wait for the "Dead Time"
Let the market bounce up and down all it wants. Just wait out the hype. When that final, painful crash arrives, and the internet is screaming that crypto is officially dead for the time. that is your buy signal. That is when you deploy your cash into heavily discounted, high-utility Spot layer-1s (like $LINK, $TAO, and $SUI) at rock-bottom prices.
Hold those actual, physical spot coins through the 2028 halving, set your sell limits, and walk away. You’ll be perfectly positioned to cash out your 10x to 50x returns back into stablecoins during the actual bull market peak—winning the entire game without ever sweating the daily charts.
What's your move during this $80k $recovery?Keeping my capital flat in stablecoins 💵Buying the bounce / FOMOing in 🚀Shorting the market 📉#BTCReaches$80000 #BTC #CryptoPatience #sol
Article
BTCUSDT is at $78,326.00 on 2026-08-25,BTCUSDT is at $78,326.00 on 2026-08-25, down 0.09% over the latest 24 hours after  Spot Bitcoin ETF inflows provided real demand. U.S. spot BTC ETFs logged consecutive days of net inflows (including ~$337–$338 million on Aug 24), extending a multi-day streak after a strong prior week that brought in roughly $1.9B+. BlackRock’s IBIT led much of the activity. Assets under management rose meaningfully with both inflows and the price move.7f8645 Coindesk Broad risk appetite and macro factors (weaker dollar, debasement concerns tied to Treasury actions, and improving liquidity) supported the broader move. Short-covering / liquidations amplified the upside. Earlier in the week there were sizable short liquidations (billions in notional across sessions), which helped fuel the rapid advance from the mid-$60Ks / low-$70Ks. The rally pushed BTC above key daily moving averages and delivered one of its strongest weekly gains in years (~23–25%+ in places), recovering substantially from the earlier 2026 drawdown after the prior cycle high near $126K. Near-term technical picture The key level you flag is correct: whether BTC can reclaim and hold above $80K. Price was rejected near the 50-week moving average (reported around $81,085–$81,087, with some analysis citing the broader $81–82K zone). This longer-term average has historically been a meaningful cycle gauge—reclaiming it on a weekly close has often aligned with the end of prior bear phases (Galaxy Research and others have highlighted the pattern of bottoms forming before or around such reclaims in many past cycles). First approaches after a steep run often face resistance, so a clean hold or weekly close above it would be more constructive than a one-touch rejection.00d350 Cryptonews Supporting levels and context: Holding the $78–80K zone keeps the short-term structure intact after the surge. A sustained break back above $80–81K (and ideally the 50-week MA) would open room for further upside. Failure to reclaim and renewed selling could see a deeper retracement toward prior support in the mid-to-high $70Ks as the market digests the move and overbought short-term conditions (strong 7-day rate of change). Overall, the combination of ETF demand, short covering, and improving sentiment turned a technical squeeze into a more fundamental-looking advance, but the rejection at the 50-week MA leaves the immediate question open: consolidation/reclaim of $80K+ versus a pause or pullback. Watch volume on any retest of $80K, continued ETF flow data, and broader risk markets for confirmation.#BTCReaches$80000 #BitcoinRejectedAt$81K50WeekMA #Binance #bitcoin
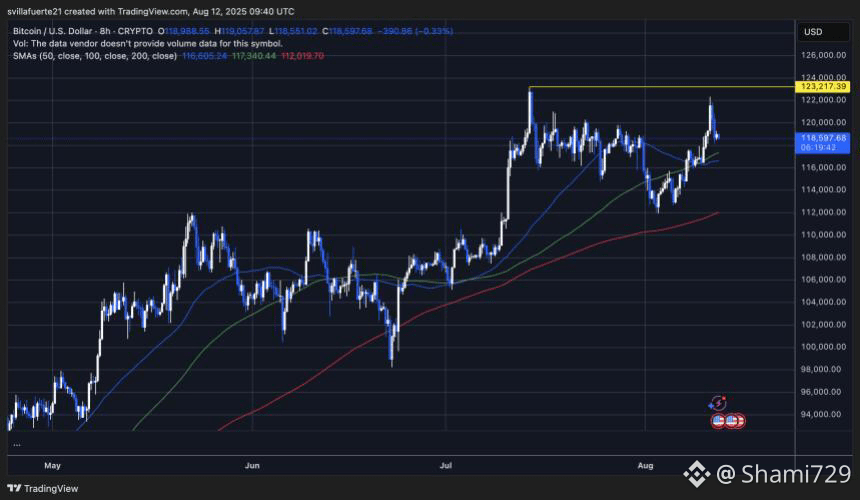
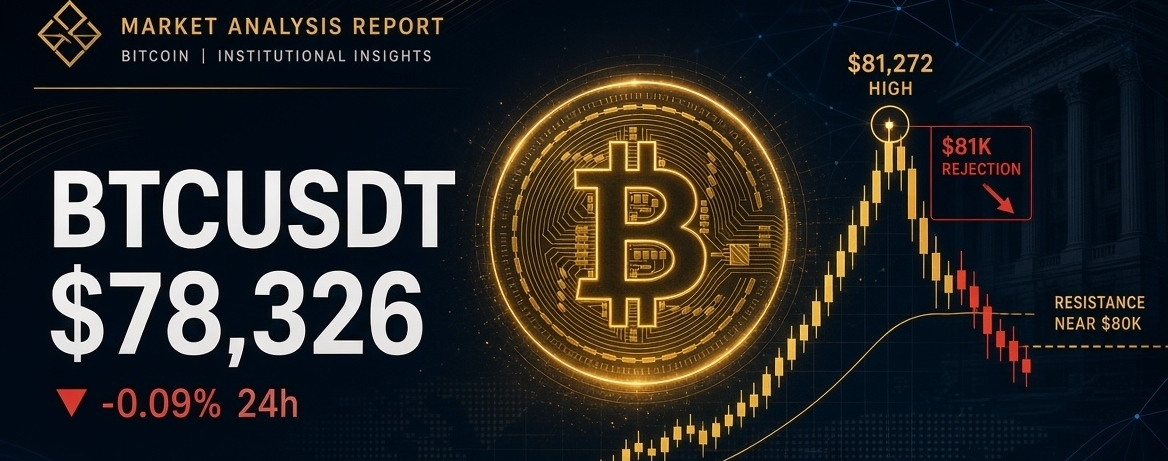
BTCUSDT is at $78,326.00 on 2026-08-25,

BTCUSDT is at $78,326.00 on 2026-08-25,
down 0.09% over the latest 24 hours after
Spot Bitcoin ETF inflows provided real demand. U.S. spot BTC ETFs logged consecutive days of net inflows (including ~$337–$338 million on Aug 24), extending a multi-day streak after a strong prior week that brought in roughly $1.9B+. BlackRock’s IBIT led much of the activity. Assets under management rose meaningfully with both inflows and the price move.7f8645
Coindesk
Broad risk appetite and macro factors (weaker dollar, debasement concerns tied to Treasury actions, and improving liquidity) supported the broader move.
Short-covering / liquidations amplified the upside. Earlier in the week there were sizable short liquidations (billions in notional across sessions), which helped fuel the rapid advance from the mid-$60Ks / low-$70Ks.
The rally pushed BTC above key daily moving averages and delivered one of its strongest weekly gains in years (~23–25%+ in places), recovering substantially from the earlier 2026 drawdown after the prior cycle high near $126K.
Near-term technical picture
The key level you flag is correct: whether BTC can reclaim and hold above $80K.
Price was rejected near the 50-week moving average (reported around $81,085–$81,087, with some analysis citing the broader $81–82K zone). This longer-term average has historically been a meaningful cycle gauge—reclaiming it on a weekly close has often aligned with the end of prior bear phases (Galaxy Research and others have highlighted the pattern of bottoms forming before or around such reclaims in many past cycles). First approaches after a steep run often face resistance, so a clean hold or weekly close above it would be more constructive than a one-touch rejection.00d350
Cryptonews
Supporting levels and context:
Holding the $78–80K zone keeps the short-term structure intact after the surge.
A sustained break back above $80–81K (and ideally the 50-week MA) would open room for further upside.
Failure to reclaim and renewed selling could see a deeper retracement toward prior support in the mid-to-high $70Ks as the market digests the move and overbought short-term conditions (strong 7-day rate of change).
Overall, the combination of ETF demand, short covering, and improving sentiment turned a technical squeeze into a more fundamental-looking advance, but the rejection at the 50-week MA leaves the immediate question open: consolidation/reclaim of $80K+ versus a pause or pullback. Watch volume on any retest of $80K, continued ETF flow data, and broader risk markets for confirmation.#BTCReaches$80000 #BitcoinRejectedAt$81K50WeekMA #Binance #bitcoin
$BTC ₿ BTC is back above $80K! Bitcoin has surged above $80,000, reaching around $81.2K today and posting one of its strongest weekly rallies of 2026. 📈 #BTCReaches$80000 $BTC {spot}(BTCUSDT)
$BTC ₿ BTC is back above $80K!

Bitcoin has surged above $80,000, reaching around $81.2K today and posting one of its strongest weekly rallies of 2026. 📈
#BTCReaches$80000 $BTC

·
--
Bullish
#BTCReaches$80000 🚨 BITCOIN RECLAIMS $80,000 — A MAJOR MARKET SIGNAL Bitcoin ($BTC) has officially pushed above the $80,000 level, reaching around $81,200 during Tuesday’s move — its strongest price area since mid-May. The breakout comes after a powerful August rally, with BTC gaining roughly 28% this month. Recent momentum has been supported by renewed spot ETF demand, a weaker U.S. dollar, and growing investor focus on macroeconomic and regulatory developments. But $80K is not just a headline number. The key question now is whether Bitcoin can HOLD above this psychological level and turn it into sustainable support. If buyers maintain control, the market will increasingly watch the $85K–$90K zone next. At the same time, sharp pullbacks remain possible after such a fast rally. 📌 $80K reclaimed. 📌 ~$81.2K local high. 📌 Strong August momentum. 📌 ETF flows and macro conditions remain important. This is a significant Bitcoin milestone, but confirmation matters more than excitement. $ONG $AMP $HOLO {future}(HOLOUSDT) {spot}(AMPUSDT) {future}(ONGUSDT)
#BTCReaches$80000
🚨 BITCOIN RECLAIMS $80,000 — A MAJOR MARKET SIGNAL
Bitcoin ($BTC) has officially pushed above the $80,000 level, reaching around $81,200 during Tuesday’s move — its strongest price area since mid-May.
The breakout comes after a powerful August rally, with BTC gaining roughly 28% this month. Recent momentum has been supported by renewed spot ETF demand, a weaker U.S. dollar, and growing investor focus on macroeconomic and regulatory developments.
But $80K is not just a headline number.
The key question now is whether Bitcoin can HOLD above this psychological level and turn it into sustainable support.
If buyers maintain control, the market will increasingly watch the $85K–$90K zone next. At the same time, sharp pullbacks remain possible after such a fast rally.
📌 $80K reclaimed.
📌 ~$81.2K local high.
📌 Strong August momentum.
📌 ETF flows and macro conditions remain important.
This is a significant Bitcoin milestone, but confirmation matters more than excitement.
$ONG $AMP $HOLO

Article
🔥 Bitcoin traders place $2.9 million bet on a rapid price jump above $82000Bitcoin’s $BTC $80,733.47 recent staggering price rise has some traders paying millions for upside exposure. On Monday, one or more traders bought 2,000 bitcoin call-option contracts with an $82,000 strike price expiring on Sept. 4, according to data tracking platform Laevitas. The trade effectively bets that bitcoin’s spot price, currently near $80,000, will rise above $82,000 on or before Sept. 4. Think of it like buying a lottery ticket up– the buyer pays a relatively small upfront amount for the chance of a much larger payout if the bet pays off. In this case, the call buyers spent $2.9 million in premium, the maximum they stand to lose if bitcoin remains below $82,000 through the Sept. 4 expiry. This bullish options flow comes amid a renewed upswing in Bitcoin. $BTC is currently trading around $80,000, up from roughly $64,000 a week ago, a 25% gain over seven days, according to CoinDesk data. The rally appears to have been driven by the U.S. Treasury’s bond-buyback announcement, continued inflows into spot Bitcoin ETFs, and short liquidations that likely accelerated the move higher. Caution persists Broadly speaking, the multi-billion dollar options market listed on Deribit continues to showcase caution. That’s evident from a metric called skew, which tracks the spread between volatility premium for calls relative to puts. Negative readings indicate a bias for puts or downside protection. According to Leavitas, seven-day skew slipped to -5.17% from +2.36%. ETH’s skew fell to -12.15% to +3.41%. “That reads as downside protection being bid aggressively after a violent rally that has since stalled in the high 70s, with the surface pricing the wall of event risk into the back half of the week rather than a breakdown in the tape,” Laevitas noted Monday. Since then, Bitcoin has pushed above $80,000, though seven-day skew remains negative, suggesting demand for upside calls still outweighs demand for downside puts despite the fresh highs. #BTCReaches$80000 $BTC {future}(BTCUSDT)

🔥 Bitcoin traders place $2.9 million bet on a rapid price jump above $82000

Bitcoin’s $BTC $80,733.47 recent staggering price rise has some traders paying millions for upside exposure.
On Monday, one or more traders bought 2,000 bitcoin call-option contracts with an $82,000 strike price expiring on Sept. 4, according to data tracking platform Laevitas. The trade effectively bets that bitcoin’s spot price, currently near $80,000, will rise above $82,000 on or before Sept. 4.
Think of it like buying a lottery ticket up– the buyer pays a relatively small upfront amount for the chance of a much larger payout if the bet pays off. In this case, the call buyers spent $2.9 million in premium, the maximum they stand to lose if bitcoin remains below $82,000 through the Sept. 4 expiry.
This bullish options flow comes amid a renewed upswing in Bitcoin. $BTC is currently trading around $80,000, up from roughly $64,000 a week ago, a 25% gain over seven days, according to CoinDesk data.
The rally appears to have been driven by the U.S. Treasury’s bond-buyback announcement, continued inflows into spot Bitcoin ETFs, and short liquidations that likely accelerated the move higher.
Caution persists
Broadly speaking, the multi-billion dollar options market listed on Deribit continues to showcase caution.
That’s evident from a metric called skew, which tracks the spread between volatility premium for calls relative to puts. Negative readings indicate a bias for puts or downside protection.
According to Leavitas, seven-day skew slipped to -5.17% from +2.36%. ETH’s skew fell to -12.15% to +3.41%.
“That reads as downside protection being bid aggressively after a violent rally that has since stalled in the high 70s, with the surface pricing the wall of event risk into the back half of the week rather than a breakdown in the tape,” Laevitas noted Monday. Since then, Bitcoin has pushed above $80,000, though seven-day skew remains negative, suggesting demand for upside calls still outweighs demand for downside puts despite the fresh highs.
#BTCReaches$80000
$BTC
·
--
#BTCReaches$80000 🚨 BITCOIN IS KNOCKING ON $80K — BREAKOUT OR TRAP? 👀 BTC has ripped from around $64K to nearly $79.8K, putting the $80,000 psychological level back in focus. But here's what traders should really watch 👇 🔥 Short squeeze: The move through $72K–$75K triggered heavy short liquidations, adding fuel to the rally. 🏦 ETF demand: Nearly $2B in weekly spot ETF inflows suggests real buying is supporting the move — not just leverage. 🧱 $80K resistance: This is a major psychological and technical zone where profit-taking and sell orders could create serious volatility. 🌎 Macro tailwinds: Softer Treasury yields and dollar weakness are also supporting risk assets. So what's next? 📈 Clean breakout + strong spot volume: Potential continuation. 📉 Rejection at $80K: BTC could consolidate toward $75.5K–$76.5K before another attempt. ⚠️ Don't FOMO into a major resistance zone. Will BTC finally flip $80K into support, or are bulls walking into a liquidity wall? 👀 $BTC {spot}(BTCUSDT) #bitcoin #BTC #Crypto #BitcoinPrice #trading
#BTCReaches$80000
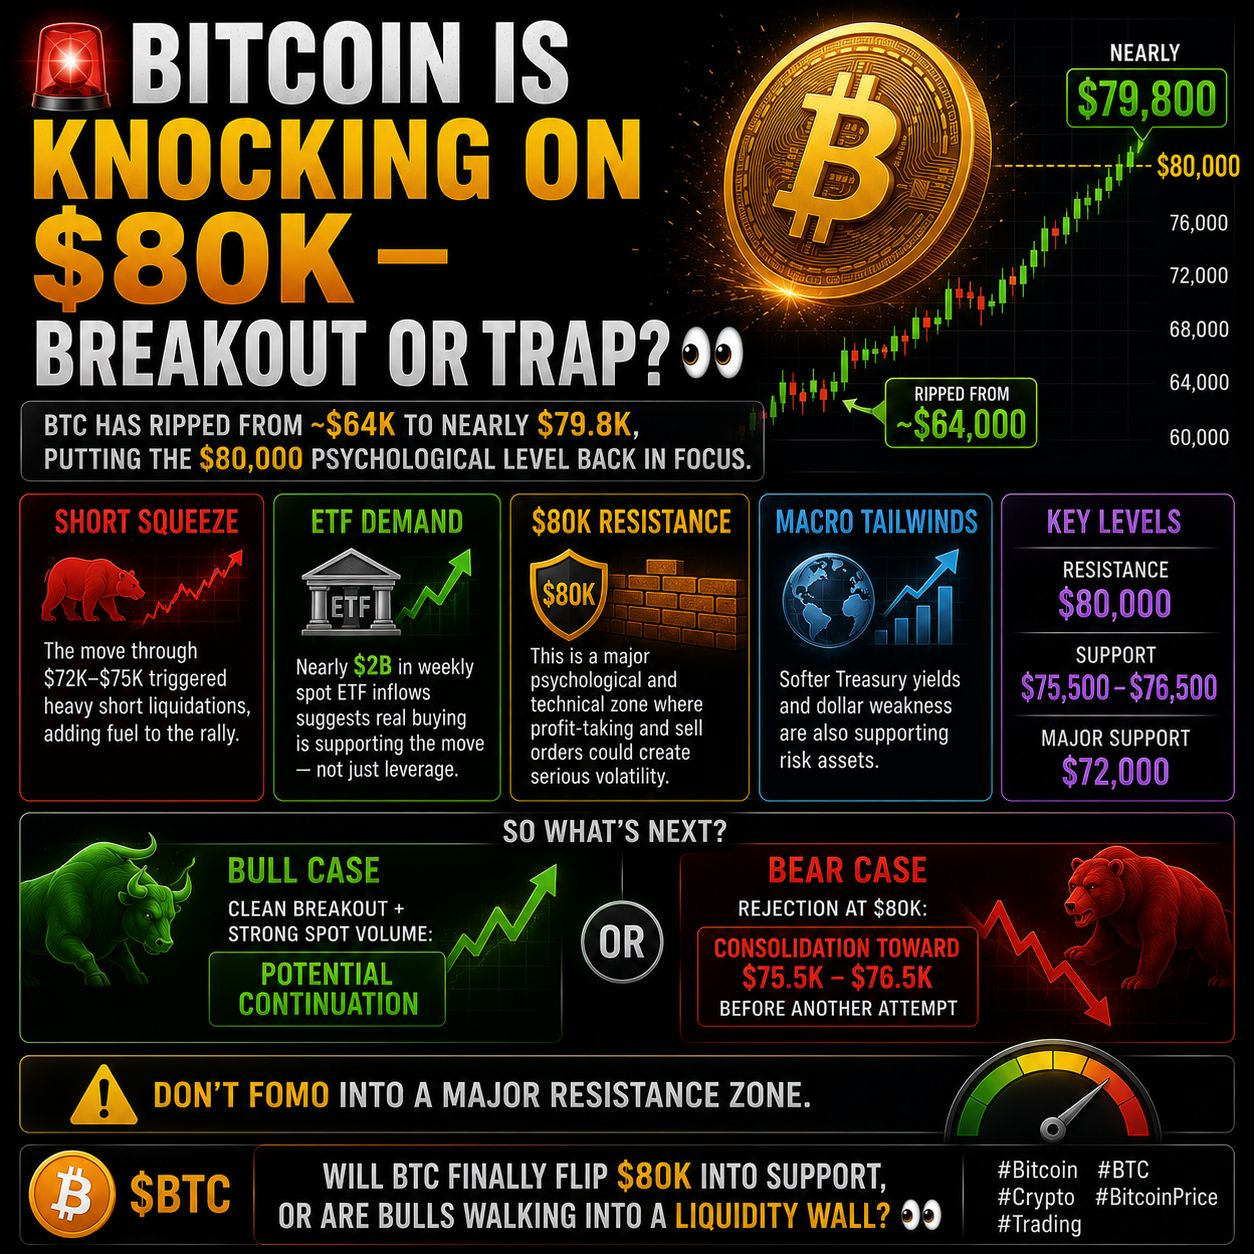
🚨 BITCOIN IS KNOCKING ON $80K — BREAKOUT OR TRAP? 👀

BTC has ripped from around $64K to nearly $79.8K, putting the $80,000 psychological level back in focus.

But here's what traders should really watch 👇
🔥 Short squeeze: The move through $72K–$75K triggered heavy short liquidations, adding fuel to the rally.

🏦 ETF demand: Nearly $2B in weekly spot ETF inflows suggests real buying is supporting the move — not just leverage.

🧱 $80K resistance: This is a major psychological and technical zone where profit-taking and sell orders could create serious volatility.

🌎 Macro tailwinds: Softer Treasury yields and dollar weakness are also supporting risk assets.

So what's next?
📈 Clean breakout + strong spot volume: Potential continuation.
📉 Rejection at $80K: BTC could consolidate toward $75.5K–$76.5K before another attempt.
⚠️ Don't FOMO into a major resistance zone.

Will BTC finally flip $80K into support, or are bulls walking into a liquidity wall? 👀

$BTC
#bitcoin #BTC #Crypto #BitcoinPrice #trading
·
--
Bullish
#BTCReaches$80000 🔥 Bitcoin just knocked on the $80K door… and now the real test begins. BTC exploded through $80,000 after a brutal rally driven by a powerful mix of ETF demand, macro liquidity and a massive short squeeze. 📈 BTC: roughly +20% in a week 💰 Spot ETF inflows: around $1.9B 💥 Shorts liquidated: billions wiped out 🏦 Corporate buyers are still adding BTC But here's the part everyone is skipping. Breaking $80K is easy. Holding it is harder. After such a vertical move, Bitcoin doesn't necessarily need another instant pump. A consolidation—or even a retest—could actually be healthier. The key question is acceptance. If BTC can build support above the reclaimed zone, this starts looking like a genuine market structure shift. But if price quickly falls back below $80K, the breakout could turn into another liquidity sweep. And there's another twist: futures positioning doesn't tell a simple “everyone is bullish” story. Part of the derivatives activity may be institutional basis trading rather than pure directional bets. 👀 $80K was the breakout. The retest may be the real trade. Square Insight: A level isn't truly broken when price touches it. It's broken when the market refuses to give it back. Do you think BTC builds a base above $80K—or are we getting one more shakeout first? #Bitcoin #CryptoMarket #BinanceSquare $BTC {future}(BTCUSDT) $ETH {future}(ETHUSDT) $SOL {future}(SOLUSDT)
#BTCReaches$80000
🔥 Bitcoin just knocked on the $80K door… and now the real test begins.
BTC exploded through $80,000 after a brutal rally driven by a powerful mix of ETF demand, macro liquidity and a massive short squeeze.
📈 BTC: roughly +20% in a week
💰 Spot ETF inflows: around $1.9B
💥 Shorts liquidated: billions wiped out
🏦 Corporate buyers are still adding BTC
But here's the part everyone is skipping.
Breaking $80K is easy. Holding it is harder.
After such a vertical move, Bitcoin doesn't necessarily need another instant pump. A consolidation—or even a retest—could actually be healthier.
The key question is acceptance.
If BTC can build support above the reclaimed zone, this starts looking like a genuine market structure shift.
But if price quickly falls back below $80K, the breakout could turn into another liquidity sweep.
And there's another twist: futures positioning doesn't tell a simple “everyone is bullish” story. Part of the derivatives activity may be institutional basis trading rather than pure directional bets.
👀 $80K was the breakout. The retest may be the real trade.
Square Insight: A level isn't truly broken when price touches it. It's broken when the market refuses to give it back.
Do you think BTC builds a base above $80K—or are we getting one more shakeout first?
#Bitcoin #CryptoMarket #BinanceSquare
$BTC
$ETH
$SOL

Article
🚨 BITCOIN JUST HIT $80K — HERE IS WHY IT COULD GO HIGHER BEFORE SEPT 15🚨 BITCOIN UPDATE — BTC JUST PRINTED A $80K RECOVERY, BUT CAN IT HOLD INTO SEPTEMBER?BTC ripped ~22% in 7 days — from the mid-$60K lows back through $80K — and the market is asking the same question again: Is this just a dead-cat bounce, or the start of the next leg higher?Everybody is wondering why Bitcoin suddenly pumped so hard. This move is not only because of hype. There are two major catalysts stacking on top of each other, and both are happening very close to each other. Let me explain them in simple words.1️⃣ The first catalyst is institutional spot demand. Look at the tape, not the headlines.Strive just bought 1,110 BTC ($81.5M) on Aug 24, pushing its corporate treasury higher.Crypto exchange volumes doubled in just 5 days.$BTC 24h volume is back near $25B, and open interest is climbing alongside spot.BTC jumped from $77,716 to $80,648.68 (+4.52% in 24h) per Yahoo Finance, with Aug 25 intraday high at $81,023 and low at $78,982.Spot bid, not leverage, is doing the heavy lifting. That is what a sustainable breakout looks like. When corporates start stacking sats with their own balance sheets, that is a different kind of buyer than a leveraged degen.2️⃣ The second catalyst is the U.S. regulatory + macro combo. The same two pillars the market has been watching all summer are loading up again:The CLARITY Act is becoming an important topic in the U.S. again. The market is watching its progress very closely. The CLARITY Act would define how digital assets are regulated in the U.S., and regulatory clarity usually equals capital inflows. One important date being discussed is September 15. Why does this matter for Bitcoin? Because markets usually start moving before an important event actually happens. Traders buy when they expect good news, and when the real news finally comes, some of them start taking profit. This is what we call: "Buy the rumor, sell the news." So there is a good chance that Bitcoin will continue to pump as we move closer to September 15. But remember one thing. If BTC keeps pumping before this date, we should also be ready for more volatility or even a correction once the news is actually out. That does not mean the bull move is finished. It simply means the market may need to cool down after a strong rally.The second reason is coming from the U.S. bond market. U.S. Treasury yields have remained elevated, and there has been a lot of pressure in the bond market. When investors start worrying about government debt, interest rates and the value of money, assets like gold and Bitcoin usually get more attention. Bitcoin is seen by many investors as an asset that is outside the normal banking system, so during this type of uncertainty, demand can increase. Another date to keep in mind is around September 9, because there may be more activity in the Treasury market around that time.So now we have two important dates sitting very close together: 📅 September 9 — Treasury & macro pressure window 📅 September 15 — CLARITY Act related expectationsThis is why Bitcoin may continue to stay strong into the first half of September.What I am watching on the chart:✅ Hold $77K–$78K on any pullback → that keeps the bullish structure intact.✅ Clean break and hold above $81K → opens the door to $84K–$86K next.⚠️ Lose $77K → we are back in range, momentum off, and shorts re-take control.⚠️ Highs above $82K then a 4H bearish rejection → "sell the news" risk before Sept 15. $BTC #BTCReaches$80000 #bitcoin #crypto

🚨 BITCOIN JUST HIT $80K — HERE IS WHY IT COULD GO HIGHER BEFORE SEPT 15

🚨 BITCOIN UPDATE — BTC JUST PRINTED A $80K RECOVERY, BUT CAN IT HOLD INTO SEPTEMBER?BTC ripped ~22% in 7 days — from the mid-$60K lows back through $80K — and the market is asking the same question again:
Is this just a dead-cat bounce, or the start of the next leg higher?Everybody is wondering why Bitcoin suddenly pumped so hard.
This move is not only because of hype.
There are two major catalysts stacking on top of each other, and both are happening very close to each other.
Let me explain them in simple words.1️⃣ The first catalyst is institutional spot demand.
Look at the tape, not the headlines.Strive just bought 1,110 BTC ($81.5M) on Aug 24, pushing its corporate treasury higher.Crypto exchange volumes doubled in just 5 days.$BTC 24h volume is back near $25B, and open interest is climbing alongside spot.BTC jumped from $77,716 to $80,648.68 (+4.52% in 24h) per Yahoo Finance, with Aug 25 intraday high at $81,023 and low at $78,982.Spot bid, not leverage, is doing the heavy lifting. That is what a sustainable breakout looks like. When corporates start stacking sats with their own balance sheets, that is a different kind of buyer than a leveraged degen.2️⃣ The second catalyst is the U.S. regulatory + macro combo.
The same two pillars the market has been watching all summer are loading up again:The CLARITY Act is becoming an important topic in the U.S. again. The market is watching its progress very closely. The CLARITY Act would define how digital assets are regulated in the U.S., and regulatory clarity usually equals capital inflows.
One important date being discussed is September 15.
Why does this matter for Bitcoin? Because markets usually start moving before an important event actually happens. Traders buy when they expect good news, and when the real news finally comes, some of them start taking profit.
This is what we call: "Buy the rumor, sell the news."
So there is a good chance that Bitcoin will continue to pump as we move closer to September 15.
But remember one thing. If BTC keeps pumping before this date, we should also be ready for more volatility or even a correction once the news is actually out. That does not mean the bull move is finished. It simply means the market may need to cool down after a strong rally.The second reason is coming from the U.S. bond market. U.S. Treasury yields have remained elevated, and there has been a lot of pressure in the bond market. When investors start worrying about government debt, interest rates and the value of money, assets like gold and Bitcoin usually get more attention. Bitcoin is seen by many investors as an asset that is outside the normal banking system, so during this type of uncertainty, demand can increase.
Another date to keep in mind is around September 9, because there may be more activity in the Treasury market around that time.So now we have two important dates sitting very close together:
📅 September 9 — Treasury & macro pressure window
📅 September 15 — CLARITY Act related expectationsThis is why Bitcoin may continue to stay strong into the first half of September.What I am watching on the chart:✅ Hold $77K–$78K on any pullback → that keeps the bullish structure intact.✅ Clean break and hold above $81K → opens the door to $84K–$86K next.⚠️ Lose $77K → we are back in range, momentum off, and shorts re-take control.⚠️ Highs above $82K then a 4H bearish rejection → "sell the news" risk before Sept 15.
$BTC
#BTCReaches$80000 #bitcoin #crypto
·
--
Bullish
#BTCReaches$80000 🔥 BITCOIN RECLAIMS $80,000 — THE MARKET IS WATCHING Bitcoin has officially pushed back above the $80,000 level, reaching around $81,238 on August 25 — its strongest price since mid-May. BTC was recently trading near $80,323 after the breakout. The move comes after a powerful weekly rally of more than 25%, with renewed demand supported by a weaker U.S. dollar, Treasury bond-buyback plans and stronger investor interest in Bitcoin. U.S. spot Bitcoin ETFs also recorded about $1.9 billion of inflows last week, their strongest weekly showing since October 2025. 📈 WHAT MATTERS NOW? $80,000 has shifted from a major psychological barrier into a key level for traders to watch. If BTC can hold above this area and maintain momentum, attention could increasingly turn toward the $90,000–$100,000 zone. But a breakout alone does not guarantee a straight move higher. ⚠️ The market is already showing signs of strong optimism, so volatility and profit-taking remain important risks. Analysts are also cautioning that it is still too early to declare a confirmed new bull market. For now, the key question is simple: 👉 Can Bitcoin turn $80K into solid support? The next few sessions could tell us whether this is the beginning of a larger recovery or another temporary breakout. $ONG $AMP $HOLO {future}(ONGUSDT) {spot}(AMPUSDT) {future}(HOLOUSDT)
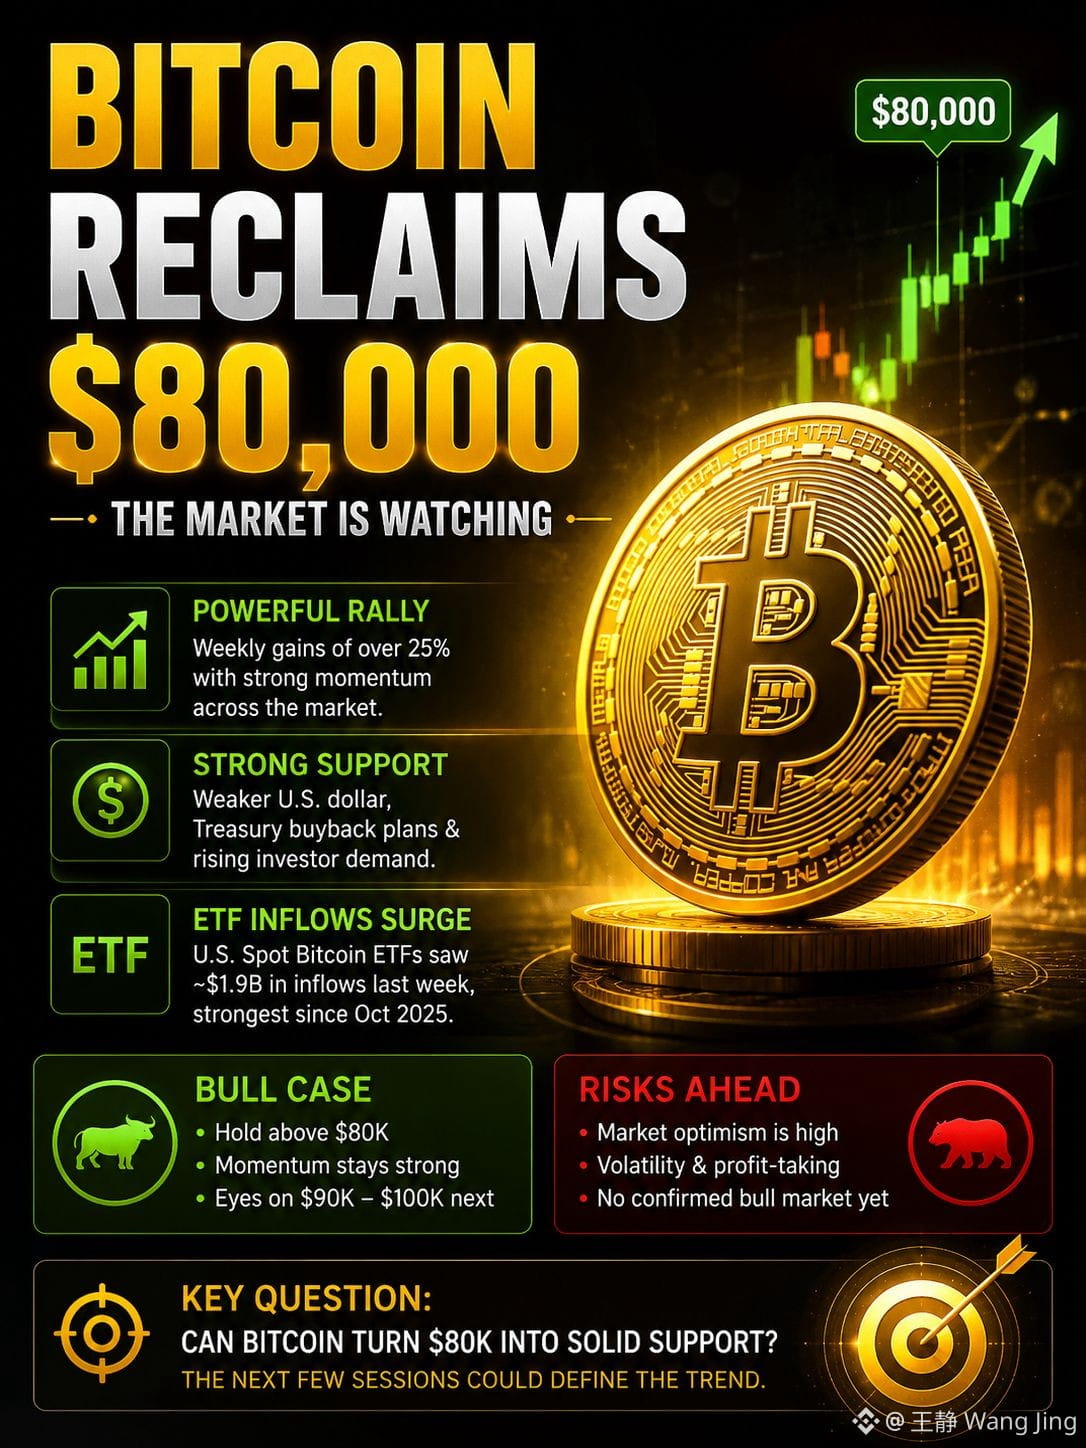
#BTCReaches$80000
🔥 BITCOIN RECLAIMS $80,000 — THE MARKET IS WATCHING
Bitcoin has officially pushed back above the $80,000 level, reaching around $81,238 on August 25 — its strongest price since mid-May. BTC was recently trading near $80,323 after the breakout.
The move comes after a powerful weekly rally of more than 25%, with renewed demand supported by a weaker U.S. dollar, Treasury bond-buyback plans and stronger investor interest in Bitcoin. U.S. spot Bitcoin ETFs also recorded about $1.9 billion of inflows last week, their strongest weekly showing since October 2025.
📈 WHAT MATTERS NOW?
$80,000 has shifted from a major psychological barrier into a key level for traders to watch.
If BTC can hold above this area and maintain momentum, attention could increasingly turn toward the $90,000–$100,000 zone. But a breakout alone does not guarantee a straight move higher.
⚠️ The market is already showing signs of strong optimism, so volatility and profit-taking remain important risks. Analysts are also cautioning that it is still too early to declare a confirmed new bull market.
For now, the key question is simple:
👉 Can Bitcoin turn $80K into solid support?
The next few sessions could tell us whether this is the beginning of a larger recovery or another temporary breakout.

$ONG $AMP $HOLO
Log in to explore more content
Join global crypto users on Binance Square
⚡️ Get latest and useful information about crypto.
💬 Trusted by the world’s largest crypto exchange.
👍 Discover real insights from verified creators.
Email / Phone number