
#usmayadpjobsexceedexpectations
usmayadpjobsexceedexpectations
71,700 views
601 Discussing
Hot
Latest

The latest ADP jobs report came in stronger than expected, showing that U.S. hiring remains steady despite economic uncertainty. The data suggests the labor market is still holding up well, and investors are now waiting to see if the official jobs report confirms the trend.
#USMayADPJobsExceedExpectations
The latest ADP jobs report came in stronger than expected, showing that U.S. hiring remains steady despite economic uncertainty. The data suggests the labor market is still holding up well, and investors are now waiting to see if the official jobs report confirms the trend.
#USMayADPJobsExceedExpectations
#USMayADPJobsExceedExpectations
1
1
275

#USMayADPJobsExceedExpectations
The U.S. labor market is carrying strong momentum into the summer. According to the latest ADP National Employment Report, private employers added 122,000 jobs in May, comfortably outperforming the projected 110,000.
This marks the fastest hiring pace since January 2025, signaling a resilient workforce despite broader economic headwinds. Growth was impressively broad-based, with 8 out of 10 supersectors adding positions—led by massive gains in education and health services. With wage growth holding steady at 4.4% for job-stayers, the economic engine is proving it still has plenty of fuel left.
#USMayADPJobsExceedExpectations #LaborMarket #USJobs #EconomicGrowth #EmploymentTrends #HiringMomentum
#USMayADPJobsExceedExpectations
The U.S. labor market is carrying strong momentum into the summer. According to the latest ADP National Employment Report, private employers added 122,000 jobs in May, comfortably outperforming the projected 110,000.
This marks the fastest hiring pace since January 2025, signaling a resilient workforce despite broader economic headwinds. Growth was impressively broad-based, with 8 out of 10 supersectors adding positions—led by massive gains in education and health services. With wage growth holding steady at 4.4% for job-stayers, the economic engine is proving it still has plenty of fuel left.
#USMayADPJobsExceedExpectations #LaborMarket #USJobs #EconomicGrowth #EmploymentTrends #HiringMomentum
The U.S. labor market is carrying strong momentum into the summer. According to the latest ADP National Employment Report, private employers added 122,000 jobs in May, comfortably outperforming the projected 110,000.
This marks the fastest hiring pace since January 2025, signaling a resilient workforce despite broader economic headwinds. Growth was impressively broad-based, with 8 out of 10 supersectors adding positions—led by massive gains in education and health services. With wage growth holding steady at 4.4% for job-stayers, the economic engine is proving it still has plenty of fuel left.
#USMayADPJobsExceedExpectations #LaborMarket #USJobs #EconomicGrowth #EmploymentTrends #HiringMomentum

1
167

·
--
The latest ADP report offered a positive surprise for the U.S. economy, showing that private-sector employers added 122,000 jobs in May. This figure came in above expectations and improved from April’s revised 105,000, signaling that hiring momentum is gradually strengthening after a relatively slow start earlier in the year.
A key highlight from the report is the broad-based nature of job growth. Hiring was not limited to a single sector or company size, with small businesses leading gains while large firms also contributed meaningfully. Industries such as education, healthcare, and transportation played a major role, suggesting a more balanced expansion across the economy.
This steady increase in employment reflects continued business confidence despite economic uncertainty. Companies appear willing to expand their workforce, supported by stable consumer spending and improving operational conditions, including fewer supply chain disruptions compared to previous years.
However, the labor market picture is not entirely strong across all fronts. While hiring remains solid, wage growth continues to lag behind inflation. This means that, in real terms, many workers are not experiencing meaningful income gains, leaving households under financial pressure despite rising employment levels.
From a policy perspective, these dynamics are especially important. Strong hiring may give reassurance about economic resilience, but persistent inflation and weak real income growth could complicate decisions for policymakers, particularly when it comes to interest rates and future monetary policy direction.
Looking ahead, attention now shifts to the official nonfarm payrolls report, which will provide a more comprehensive view of the labor market. If it confirms the ADP data, it could strengthen confidence in the economic outlook, but the balance between job growth and inflation will remain the key factor shaping market sentiment in the coming months.
#USMayADPJobsExceedExpectations
The latest ADP report offered a positive surprise for the U.S. economy, showing that private-sector employers added 122,000 jobs in May. This figure came in above expectations and improved from April’s revised 105,000, signaling that hiring momentum is gradually strengthening after a relatively slow start earlier in the year.
A key highlight from the report is the broad-based nature of job growth. Hiring was not limited to a single sector or company size, with small businesses leading gains while large firms also contributed meaningfully. Industries such as education, healthcare, and transportation played a major role, suggesting a more balanced expansion across the economy.
This steady increase in employment reflects continued business confidence despite economic uncertainty. Companies appear willing to expand their workforce, supported by stable consumer spending and improving operational conditions, including fewer supply chain disruptions compared to previous years.
However, the labor market picture is not entirely strong across all fronts. While hiring remains solid, wage growth continues to lag behind inflation. This means that, in real terms, many workers are not experiencing meaningful income gains, leaving households under financial pressure despite rising employment levels.
From a policy perspective, these dynamics are especially important. Strong hiring may give reassurance about economic resilience, but persistent inflation and weak real income growth could complicate decisions for policymakers, particularly when it comes to interest rates and future monetary policy direction.
Looking ahead, attention now shifts to the official nonfarm payrolls report, which will provide a more comprehensive view of the labor market. If it confirms the ADP data, it could strengthen confidence in the economic outlook, but the balance between job growth and inflation will remain the key factor shaping market sentiment in the coming months.
#USMayADPJobsExceedExpectations
A key highlight from the report is the broad-based nature of job growth. Hiring was not limited to a single sector or company size, with small businesses leading gains while large firms also contributed meaningfully. Industries such as education, healthcare, and transportation played a major role, suggesting a more balanced expansion across the economy.
This steady increase in employment reflects continued business confidence despite economic uncertainty. Companies appear willing to expand their workforce, supported by stable consumer spending and improving operational conditions, including fewer supply chain disruptions compared to previous years.
However, the labor market picture is not entirely strong across all fronts. While hiring remains solid, wage growth continues to lag behind inflation. This means that, in real terms, many workers are not experiencing meaningful income gains, leaving households under financial pressure despite rising employment levels.
From a policy perspective, these dynamics are especially important. Strong hiring may give reassurance about economic resilience, but persistent inflation and weak real income growth could complicate decisions for policymakers, particularly when it comes to interest rates and future monetary policy direction.
Looking ahead, attention now shifts to the official nonfarm payrolls report, which will provide a more comprehensive view of the labor market. If it confirms the ADP data, it could strengthen confidence in the economic outlook, but the balance between job growth and inflation will remain the key factor shaping market sentiment in the coming months.
#USMayADPJobsExceedExpectations

144

·
--
The financial markets and cryptocurrencies are keeping a close eye on the macroeconomic happenings in the U.S., especially after the ADP employment report came in with numbers that beat expectations. At first glance, this might seem like good news for the economy, but it also sparks a debate about how risk markets, including Bitcoin, might react.
When employment stays strong, the economy usually shows resilience, but at the same time, it could lessen the pressure on the Federal Reserve to cut interest rates in the short term. This is one of the key factors that traders are watching closely, as liquidity remains a crucial element for the behavior of digital assets.
Another topic that caught my attention was the news related to Strategy. Even though it continues to be one of the most Bitcoin-associated companies, recent changes in its market position reflect that even firms with heavy exposure to the crypto sector are still facing cycles of volatility and valuation adjustments.
On the Bitcoin front, I believe we’re in an interesting moment. The market seems to be weighing both the economic data and institutional participation. In similar situations, the initial reaction doesn’t always set the subsequent trend, so it’s going to be important to monitor price action, volume, and overall sentiment in the coming days.
Personally, I think the mix of macroeconomic and corporate factors could lead to significant movements in the short term. However, I also believe that Bitcoin's ability to keep investors engaged will remain one of the most critical aspects in determining its future direction.
For now, I’ll keep an eye on how the situation evolves before drawing any definitive conclusions.
Do you think the ADP report will be a factor for BTC's price?#StrategyFallsOutOfTop200US #USMayADPJobsExceedExpectations #BTC
The financial markets and cryptocurrencies are keeping a close eye on the macroeconomic happenings in the U.S., especially after the ADP employment report came in with numbers that beat expectations. At first glance, this might seem like good news for the economy, but it also sparks a debate about how risk markets, including Bitcoin, might react.
When employment stays strong, the economy usually shows resilience, but at the same time, it could lessen the pressure on the Federal Reserve to cut interest rates in the short term. This is one of the key factors that traders are watching closely, as liquidity remains a crucial element for the behavior of digital assets.
Another topic that caught my attention was the news related to Strategy. Even though it continues to be one of the most Bitcoin-associated companies, recent changes in its market position reflect that even firms with heavy exposure to the crypto sector are still facing cycles of volatility and valuation adjustments.
On the Bitcoin front, I believe we’re in an interesting moment. The market seems to be weighing both the economic data and institutional participation. In similar situations, the initial reaction doesn’t always set the subsequent trend, so it’s going to be important to monitor price action, volume, and overall sentiment in the coming days.
Personally, I think the mix of macroeconomic and corporate factors could lead to significant movements in the short term. However, I also believe that Bitcoin's ability to keep investors engaged will remain one of the most critical aspects in determining its future direction.
For now, I’ll keep an eye on how the situation evolves before drawing any definitive conclusions.
Do you think the ADP report will be a factor for BTC's price?#StrategyFallsOutOfTop200US #USMayADPJobsExceedExpectations #BTC
When employment stays strong, the economy usually shows resilience, but at the same time, it could lessen the pressure on the Federal Reserve to cut interest rates in the short term. This is one of the key factors that traders are watching closely, as liquidity remains a crucial element for the behavior of digital assets.
Another topic that caught my attention was the news related to Strategy. Even though it continues to be one of the most Bitcoin-associated companies, recent changes in its market position reflect that even firms with heavy exposure to the crypto sector are still facing cycles of volatility and valuation adjustments.
On the Bitcoin front, I believe we’re in an interesting moment. The market seems to be weighing both the economic data and institutional participation. In similar situations, the initial reaction doesn’t always set the subsequent trend, so it’s going to be important to monitor price action, volume, and overall sentiment in the coming days.
Personally, I think the mix of macroeconomic and corporate factors could lead to significant movements in the short term. However, I also believe that Bitcoin's ability to keep investors engaged will remain one of the most critical aspects in determining its future direction.
For now, I’ll keep an eye on how the situation evolves before drawing any definitive conclusions.
Do you think the ADP report will be a factor for BTC's price?#StrategyFallsOutOfTop200US #USMayADPJobsExceedExpectations #BTC
SÍ, ALCISTA
67%
SI BAJISTA
8%
De poco impacto
17%
No es un factor
8%
12 votes • Voting closed
370

#USMayADPJobsExceedExpectations
📊 #USMayADPJobsExceedExpectations: What the crypto market isn't telling you
On June 2nd, ADP reported +122,000 jobs in the U.S., surpassing the +117,000 expected. April was also revised upwards. At first glance, it seems like good news, but for crypto, it’s a caution signal.
🔍 Why does it affect Bitcoin and altcoins?
A strong labor market reduces the urgency for the Federal Reserve to lower interest rates. And high rates = enemy #1 for risk assets:
1. Less liquidity → investors prefer Treasury bonds
2. Stronger dollar → crypto tends to move inversely
3. "Risk-off" environment → institutions reduce exposure to volatility
📊 Key ADP Data
Indicator Data
Jobs created (May) +122,000 (vs +117K expected)
April revision +105,000 (from +109K)
Salaries (job-stayers) 4.4% annual
Salaries (job-changers) 6.5% annual
⚠️ What really matters: Friday
The ADP is just the appetizer. On Friday, June 5th, the government will release the non-farm payroll (NFP) report. Expectation: +85,000 jobs and unemployment at 4.3%.
If the NFP also exceeds expectations → the Fed will keep rates high for longer. If it disappoints → the market might price in cuts, potentially bullish for crypto.
🧠 Strategy for traders
· Short-term: Wait for volatility post-NFP on Friday. Employment data moves the market.
· Medium-term: Be cautious with leveraged long positions if the data remains solid.
· Key to watch: Upcoming inflation data (CPI) and Fed speeches.
Summary: The ADP was positive for the real economy, but neutral/bearish for crypto in the short term because it pushes rate cuts further away. The full picture will be clearer on Friday.
How are you positioned ahead of the NFP? 👇
#MacroEconomia #Fed
#USMayADPJobsExceedExpectations
📊 #USMayADPJobsExceedExpectations: What the crypto market isn't telling you
On June 2nd, ADP reported +122,000 jobs in the U.S., surpassing the +117,000 expected. April was also revised upwards. At first glance, it seems like good news, but for crypto, it’s a caution signal.
🔍 Why does it affect Bitcoin and altcoins?
A strong labor market reduces the urgency for the Federal Reserve to lower interest rates. And high rates = enemy #1 for risk assets:
1. Less liquidity → investors prefer Treasury bonds
2. Stronger dollar → crypto tends to move inversely
3. "Risk-off" environment → institutions reduce exposure to volatility
📊 Key ADP Data
Indicator Data
Jobs created (May) +122,000 (vs +117K expected)
April revision +105,000 (from +109K)
Salaries (job-stayers) 4.4% annual
Salaries (job-changers) 6.5% annual
⚠️ What really matters: Friday
The ADP is just the appetizer. On Friday, June 5th, the government will release the non-farm payroll (NFP) report. Expectation: +85,000 jobs and unemployment at 4.3%.
If the NFP also exceeds expectations → the Fed will keep rates high for longer. If it disappoints → the market might price in cuts, potentially bullish for crypto.
🧠 Strategy for traders
· Short-term: Wait for volatility post-NFP on Friday. Employment data moves the market.
· Medium-term: Be cautious with leveraged long positions if the data remains solid.
· Key to watch: Upcoming inflation data (CPI) and Fed speeches.
Summary: The ADP was positive for the real economy, but neutral/bearish for crypto in the short term because it pushes rate cuts further away. The full picture will be clearer on Friday.
How are you positioned ahead of the NFP? 👇
#MacroEconomia #Fed
📊 #USMayADPJobsExceedExpectations: What the crypto market isn't telling you
On June 2nd, ADP reported +122,000 jobs in the U.S., surpassing the +117,000 expected. April was also revised upwards. At first glance, it seems like good news, but for crypto, it’s a caution signal.
🔍 Why does it affect Bitcoin and altcoins?
A strong labor market reduces the urgency for the Federal Reserve to lower interest rates. And high rates = enemy #1 for risk assets:
1. Less liquidity → investors prefer Treasury bonds
2. Stronger dollar → crypto tends to move inversely
3. "Risk-off" environment → institutions reduce exposure to volatility
📊 Key ADP Data
Indicator Data
Jobs created (May) +122,000 (vs +117K expected)
April revision +105,000 (from +109K)
Salaries (job-stayers) 4.4% annual
Salaries (job-changers) 6.5% annual
⚠️ What really matters: Friday
The ADP is just the appetizer. On Friday, June 5th, the government will release the non-farm payroll (NFP) report. Expectation: +85,000 jobs and unemployment at 4.3%.
If the NFP also exceeds expectations → the Fed will keep rates high for longer. If it disappoints → the market might price in cuts, potentially bullish for crypto.
🧠 Strategy for traders
· Short-term: Wait for volatility post-NFP on Friday. Employment data moves the market.
· Medium-term: Be cautious with leveraged long positions if the data remains solid.
· Key to watch: Upcoming inflation data (CPI) and Fed speeches.
Summary: The ADP was positive for the real economy, but neutral/bearish for crypto in the short term because it pushes rate cuts further away. The full picture will be clearer on Friday.
How are you positioned ahead of the NFP? 👇
#MacroEconomia #Fed

1
213

·
--
#USMayADPJobsExceedExpectations U.S. May ADP Jobs Exceed Expectations
The latest ADP employment report shows that private-sector job growth in the United States exceeded market expectations in May. The stronger-than-anticipated hiring figures suggest that the labor market remains resilient despite ongoing economic uncertainties and concerns about interest rates.
Economists had forecast moderate job gains, but employers added more jobs than expected, reflecting continued demand for workers across several industries. The positive data may influence market sentiment and could play a role in future decisions by policymakers regarding economic and monetary policy.
Investors and analysts are closely watching labor market indicators, as strong employment growth is often viewed as a sign of economic strength. The May ADP report provides another indication that the U.S. economy continues to show resilience.
#USMayADPJobsExceedExpectations U.S. May ADP Jobs Exceed Expectations
The latest ADP employment report shows that private-sector job growth in the United States exceeded market expectations in May. The stronger-than-anticipated hiring figures suggest that the labor market remains resilient despite ongoing economic uncertainties and concerns about interest rates.
Economists had forecast moderate job gains, but employers added more jobs than expected, reflecting continued demand for workers across several industries. The positive data may influence market sentiment and could play a role in future decisions by policymakers regarding economic and monetary policy.
Investors and analysts are closely watching labor market indicators, as strong employment growth is often viewed as a sign of economic strength. The May ADP report provides another indication that the U.S. economy continues to show resilience.
The latest ADP employment report shows that private-sector job growth in the United States exceeded market expectations in May. The stronger-than-anticipated hiring figures suggest that the labor market remains resilient despite ongoing economic uncertainties and concerns about interest rates.
Economists had forecast moderate job gains, but employers added more jobs than expected, reflecting continued demand for workers across several industries. The positive data may influence market sentiment and could play a role in future decisions by policymakers regarding economic and monetary policy.
Investors and analysts are closely watching labor market indicators, as strong employment growth is often viewed as a sign of economic strength. The May ADP report provides another indication that the U.S. economy continues to show resilience.
214

·
--
#USMayADPJobsExceedExpectations Key Figures from the May 2026 ReportAccording to the official data released on June 3, 2026, by the ADP Research Institute in collaboration with the Stanford Digital Economy Lab:
Total Private Jobs Added: 122,000.April Revision: Downward to 105,000 from the initially reported 109,000.Job-Stayers Pay Growth: Steady at 4.4% year-over-year.Job-Changers Pay Growth: Slipped slightly to 6.5% from 6.6% in April.
Breakdown by Sector and DemographicsIndustry Performance: Service-providing sectors heavily dominated, adding 114,000 positions, while goods-producing sectors generated 8,000. Education and health services led growth with 57,000 new jobs.Establishment Size: Small businesses (1–49 employees) led the hiring charge by adding 67,000 workers, followed by large enterprises adding 40,000.Regional Growth: The Western region recorded the strongest gains at 45,000, followed by the Northeast with 35,000.Economic ContextThe stronger-than-expected data signals sustained labor market resilience even as financial markets closely monitor Federal Reserve interest rate positions and inflation headwinds. The ADP release serves as a precursor to the comprehensive U.S. Bureau of Labor Statistics (BLS) nonfarm payrolls report.
#USMayADPJobsExceedExpectations Key Figures from the May 2026 ReportAccording to the official data released on June 3, 2026, by the ADP Research Institute in collaboration with the Stanford Digital Economy Lab:
Total Private Jobs Added: 122,000.April Revision: Downward to 105,000 from the initially reported 109,000.Job-Stayers Pay Growth: Steady at 4.4% year-over-year.Job-Changers Pay Growth: Slipped slightly to 6.5% from 6.6% in April.
Breakdown by Sector and DemographicsIndustry Performance: Service-providing sectors heavily dominated, adding 114,000 positions, while goods-producing sectors generated 8,000. Education and health services led growth with 57,000 new jobs.Establishment Size: Small businesses (1–49 employees) led the hiring charge by adding 67,000 workers, followed by large enterprises adding 40,000.Regional Growth: The Western region recorded the strongest gains at 45,000, followed by the Northeast with 35,000.Economic ContextThe stronger-than-expected data signals sustained labor market resilience even as financial markets closely monitor Federal Reserve interest rate positions and inflation headwinds. The ADP release serves as a precursor to the comprehensive U.S. Bureau of Labor Statistics (BLS) nonfarm payrolls report.
Total Private Jobs Added: 122,000.April Revision: Downward to 105,000 from the initially reported 109,000.Job-Stayers Pay Growth: Steady at 4.4% year-over-year.Job-Changers Pay Growth: Slipped slightly to 6.5% from 6.6% in April.
Breakdown by Sector and DemographicsIndustry Performance: Service-providing sectors heavily dominated, adding 114,000 positions, while goods-producing sectors generated 8,000. Education and health services led growth with 57,000 new jobs.Establishment Size: Small businesses (1–49 employees) led the hiring charge by adding 67,000 workers, followed by large enterprises adding 40,000.Regional Growth: The Western region recorded the strongest gains at 45,000, followed by the Northeast with 35,000.Economic ContextThe stronger-than-expected data signals sustained labor market resilience even as financial markets closely monitor Federal Reserve interest rate positions and inflation headwinds. The ADP release serves as a precursor to the comprehensive U.S. Bureau of Labor Statistics (BLS) nonfarm payrolls report.
201

·
--
Verified
#USMayADPJobsExceedExpectations
Hiring in the U.S. private sector 🇺🇸 ramped up 💪🏼 in May, showcasing the labor market's resilience despite the spike 📈 in inflation and the uncertainty from geopolitical tensions in the Middle East.
According to data released on Wednesday by payroll processing firm ADP, private employers added 122,000 jobs last month, exceeding economists' expectations (110,000) and marking the fastest hiring pace since January 2025. $TRUMP
{spot}(TRUMPUSDT)
#USMayADPJobsExceedExpectations
Hiring in the U.S. private sector 🇺🇸 ramped up 💪🏼 in May, showcasing the labor market's resilience despite the spike 📈 in inflation and the uncertainty from geopolitical tensions in the Middle East.
According to data released on Wednesday by payroll processing firm ADP, private employers added 122,000 jobs last month, exceeding economists' expectations (110,000) and marking the fastest hiring pace since January 2025. $TRUMP
Hiring in the U.S. private sector 🇺🇸 ramped up 💪🏼 in May, showcasing the labor market's resilience despite the spike 📈 in inflation and the uncertainty from geopolitical tensions in the Middle East.
According to data released on Wednesday by payroll processing firm ADP, private employers added 122,000 jobs last month, exceeding economists' expectations (110,000) and marking the fastest hiring pace since January 2025. $TRUMP

4
749

·
--
Bearish
The strength of U.S. jobs reshapes the landscape: Between Bitcoin and Tether Gold... Where is the liquidity heading?
The U.S. employment data (ADP) came in above expectations, clearly signaling ongoing economic strength, which bolsters the likelihood of the Federal Reserve maintaining a tight monetary policy for a longer period.
But what does this mean for the markets?
🔹 Bitcoin (BTC):
High-risk assets face direct pressure in such an environment, as a delay in interest rate cuts reduces liquidity, impacting Bitcoin's performance and volatility in the short term.
🔹 Tether Gold (XAUT):
Conversely, the talk about hedging is back. Although rising interest rates may pressure gold, the uncertainty is pushing some investors toward related assets like XAUT as a relative safe haven.
Current equation:
Less liquidity → Pressure on BTC
Higher risks → Increased interest in XAUT
A market divided between growth and risk vs. safety and hedging.
Professional takeaway:
We are witnessing a smart liquidity redistribution phase, where the market does not choose one direction… but balances between betting on growth via BTC and hedging via XAUT.
The key now is not the direction… but managing the balance.
{future}(BTCUSDT)
{future}(XAUTUSDT)
#USMayADPJobsExceedExpectations
The strength of U.S. jobs reshapes the landscape: Between Bitcoin and Tether Gold... Where is the liquidity heading?
The U.S. employment data (ADP) came in above expectations, clearly signaling ongoing economic strength, which bolsters the likelihood of the Federal Reserve maintaining a tight monetary policy for a longer period.
But what does this mean for the markets?
🔹 Bitcoin (BTC):
High-risk assets face direct pressure in such an environment, as a delay in interest rate cuts reduces liquidity, impacting Bitcoin's performance and volatility in the short term.
🔹 Tether Gold (XAUT):
Conversely, the talk about hedging is back. Although rising interest rates may pressure gold, the uncertainty is pushing some investors toward related assets like XAUT as a relative safe haven.
Current equation:
Less liquidity → Pressure on BTC
Higher risks → Increased interest in XAUT
A market divided between growth and risk vs. safety and hedging.
Professional takeaway:
We are witnessing a smart liquidity redistribution phase, where the market does not choose one direction… but balances between betting on growth via BTC and hedging via XAUT.
The key now is not the direction… but managing the balance.
#USMayADPJobsExceedExpectations
The U.S. employment data (ADP) came in above expectations, clearly signaling ongoing economic strength, which bolsters the likelihood of the Federal Reserve maintaining a tight monetary policy for a longer period.
But what does this mean for the markets?
🔹 Bitcoin (BTC):
High-risk assets face direct pressure in such an environment, as a delay in interest rate cuts reduces liquidity, impacting Bitcoin's performance and volatility in the short term.
🔹 Tether Gold (XAUT):
Conversely, the talk about hedging is back. Although rising interest rates may pressure gold, the uncertainty is pushing some investors toward related assets like XAUT as a relative safe haven.
Current equation:
Less liquidity → Pressure on BTC
Higher risks → Increased interest in XAUT
A market divided between growth and risk vs. safety and hedging.
Professional takeaway:
We are witnessing a smart liquidity redistribution phase, where the market does not choose one direction… but balances between betting on growth via BTC and hedging via XAUT.
The key now is not the direction… but managing the balance.
#USMayADPJobsExceedExpectations

1
170

·
--
GM Market Briefing☕
$BTC Outlook (UTC 0):
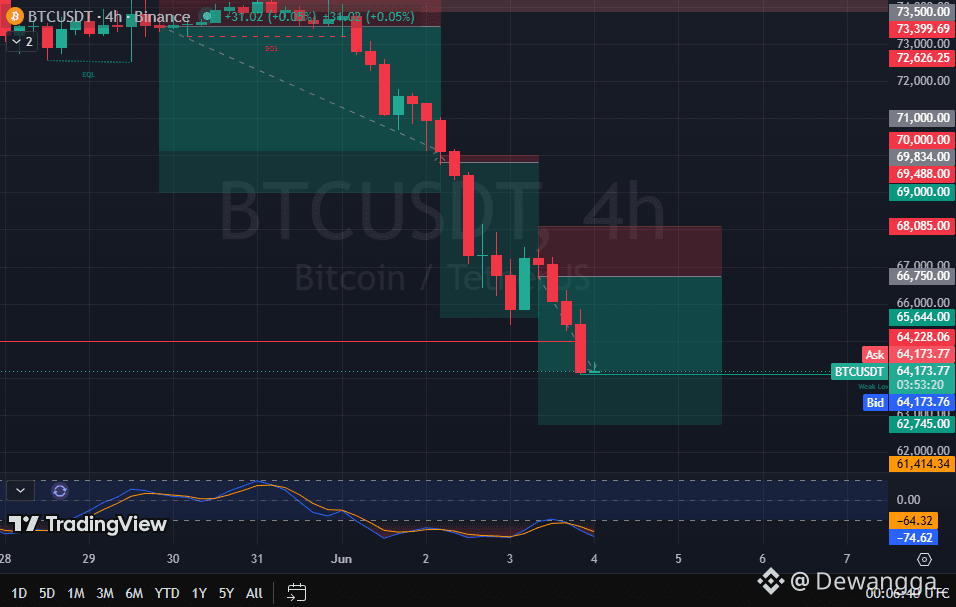
🟥00:00–09:00 → Down 📉 Strong US Factory Orders + ADP beat crushed BTC to $64K. RSI 29 oversold but momentum still bearish.
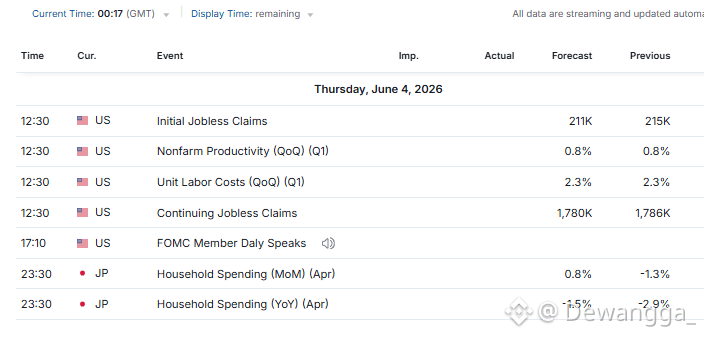
🟨09:00–11:00 → Slow ☕ Pre-data consolidation. Market holding breath before Jobless Claims at 12:30 UTC. Low volume chop expected.
🟥11:00–15:00 → Down ⚔️ Jobless Claims forecast 211k (down from 215k). If beats = stronger DXY = more BTC pain. Watch for initial spike then reversal.
🟨15:00–18:00 → Slow 🛡️ Post-data digestion. If Claims confirm labour strength, DXY holds gains. BTC ranges between $63.5K-$65K support.
🟩18:00–00:00 → Up RSI extreme oversold at 29.73. US-Iran war fears priced in. Expect relief bounce into NY close if no fresh headlines.
Bias: Bearish Capitulation → Oversold Bounce Setup ➡️
RSI 7 — Deeply oversold, historically signals local bottom within 24-48hrs.
#NFA #DYOR 🔥
Not a futures signal
📈ADP smashed 122K vs 105K prev. Factory Orders rocketed 4.8%. DXY ripping higher while BTC bleeds. Strong labour data = hawkish Fed pricing = risk assets dumped.
⚔US-Iran tensions escalating per Bloomberg Terminal feeds. Geopolitical risk should boost BTC as hedge but dollar strength dominating. Fear driving everything lower.
🏛️ISM Non-Manufacturing rose 53→54 but Services PMI slipped. Mixed signals yet dollar winning. Blackrock outflows continuing. Institutions de-risking into strength.
📊Jobless Claims tonight key. Forecast 211K would confirm tight labour market. If actual <211K = DXY moon = BTC retest $63K. If miss = relief rally back to $66K.
💎Strategy: Wait for Claims at 12:30 UTC. If beat + DXY spike = short bounce to $63.5K. If miss = long scalp targeting $66K. RSI 29 screams bounce soon. Don't fade extreme oversold without confirmation.
Money doesn't lie. Charts don't lie. Only politicians do.
Stay sharp. Stay sovereign. ☕₿
$ETH $POL #USMayADPJobsExceedExpectations #ZcashSurges10PctAfterCriticalBugFix #BitcoinFearGaugeSurgesNearly20%
GM Market Briefing☕
$BTC Outlook (UTC 0):
🟥00:00–09:00 → Down 📉 Strong US Factory Orders + ADP beat crushed BTC to $64K. RSI 29 oversold but momentum still bearish.
🟨09:00–11:00 → Slow ☕ Pre-data consolidation. Market holding breath before Jobless Claims at 12:30 UTC. Low volume chop expected.
🟥11:00–15:00 → Down ⚔️ Jobless Claims forecast 211k (down from 215k). If beats = stronger DXY = more BTC pain. Watch for initial spike then reversal.
🟨15:00–18:00 → Slow 🛡️ Post-data digestion. If Claims confirm labour strength, DXY holds gains. BTC ranges between $63.5K-$65K support.
🟩18:00–00:00 → Up RSI extreme oversold at 29.73. US-Iran war fears priced in. Expect relief bounce into NY close if no fresh headlines.
Bias: Bearish Capitulation → Oversold Bounce Setup ➡️
RSI 7 — Deeply oversold, historically signals local bottom within 24-48hrs.
#NFA #DYOR 🔥
Not a futures signal
📈ADP smashed 122K vs 105K prev. Factory Orders rocketed 4.8%. DXY ripping higher while BTC bleeds. Strong labour data = hawkish Fed pricing = risk assets dumped.
⚔US-Iran tensions escalating per Bloomberg Terminal feeds. Geopolitical risk should boost BTC as hedge but dollar strength dominating. Fear driving everything lower.
🏛️ISM Non-Manufacturing rose 53→54 but Services PMI slipped. Mixed signals yet dollar winning. Blackrock outflows continuing. Institutions de-risking into strength.
📊Jobless Claims tonight key. Forecast 211K would confirm tight labour market. If actual <211K = DXY moon = BTC retest $63K. If miss = relief rally back to $66K.
💎Strategy: Wait for Claims at 12:30 UTC. If beat + DXY spike = short bounce to $63.5K. If miss = long scalp targeting $66K. RSI 29 screams bounce soon. Don't fade extreme oversold without confirmation.
Money doesn't lie. Charts don't lie. Only politicians do.
Stay sharp. Stay sovereign. ☕₿
$ETH $POL #USMayADPJobsExceedExpectations #ZcashSurges10PctAfterCriticalBugFix #BitcoinFearGaugeSurgesNearly20%
$BTC Outlook (UTC 0):
🟥00:00–09:00 → Down 📉 Strong US Factory Orders + ADP beat crushed BTC to $64K. RSI 29 oversold but momentum still bearish.
🟨09:00–11:00 → Slow ☕ Pre-data consolidation. Market holding breath before Jobless Claims at 12:30 UTC. Low volume chop expected.
🟥11:00–15:00 → Down ⚔️ Jobless Claims forecast 211k (down from 215k). If beats = stronger DXY = more BTC pain. Watch for initial spike then reversal.
🟨15:00–18:00 → Slow 🛡️ Post-data digestion. If Claims confirm labour strength, DXY holds gains. BTC ranges between $63.5K-$65K support.
🟩18:00–00:00 → Up RSI extreme oversold at 29.73. US-Iran war fears priced in. Expect relief bounce into NY close if no fresh headlines.
Bias: Bearish Capitulation → Oversold Bounce Setup ➡️
RSI 7 — Deeply oversold, historically signals local bottom within 24-48hrs.
#NFA #DYOR 🔥
Not a futures signal
📈ADP smashed 122K vs 105K prev. Factory Orders rocketed 4.8%. DXY ripping higher while BTC bleeds. Strong labour data = hawkish Fed pricing = risk assets dumped.
⚔US-Iran tensions escalating per Bloomberg Terminal feeds. Geopolitical risk should boost BTC as hedge but dollar strength dominating. Fear driving everything lower.
🏛️ISM Non-Manufacturing rose 53→54 but Services PMI slipped. Mixed signals yet dollar winning. Blackrock outflows continuing. Institutions de-risking into strength.
📊Jobless Claims tonight key. Forecast 211K would confirm tight labour market. If actual <211K = DXY moon = BTC retest $63K. If miss = relief rally back to $66K.
💎Strategy: Wait for Claims at 12:30 UTC. If beat + DXY spike = short bounce to $63.5K. If miss = long scalp targeting $66K. RSI 29 screams bounce soon. Don't fade extreme oversold without confirmation.
Money doesn't lie. Charts don't lie. Only politicians do.
Stay sharp. Stay sovereign. ☕₿
$ETH $POL #USMayADPJobsExceedExpectations #ZcashSurges10PctAfterCriticalBugFix #BitcoinFearGaugeSurgesNearly20%
1
261

#genius $GENIUS
$GENIUS is one of those projects that many traders ignore until it suddenly starts trending.
Looking at the current price action, I see a market that is trying to build a base rather than chasing hype. This is usually the phase where impatient traders leave and smart money starts paying attention.
My focus right now is not on short-term pumps but on whether buyers can continue defending key support levels. If that happens, the next leg higher could surprise many people.
What I'm doing:
✔️ Avoiding FOMO entries.
✔️ Watching volume closely.
✔️ Taking profits gradually on strong moves.
✔️ Keeping risk management first.
Remember, every strong rally starts when nobody is talking about it. The question is whether $GENIUS is preparing for that stage.
Stay patient, stay disciplined, and always do your own research.
#GENIUS #Crypto #Altcoins #BinanceFeed #Trading #DYOR #CryptoMarketTrends #USMayADPJobsExceedExpectations
#genius $GENIUS
$GENIUS is one of those projects that many traders ignore until it suddenly starts trending.
Looking at the current price action, I see a market that is trying to build a base rather than chasing hype. This is usually the phase where impatient traders leave and smart money starts paying attention.
My focus right now is not on short-term pumps but on whether buyers can continue defending key support levels. If that happens, the next leg higher could surprise many people.
What I'm doing:
✔️ Avoiding FOMO entries.
✔️ Watching volume closely.
✔️ Taking profits gradually on strong moves.
✔️ Keeping risk management first.
Remember, every strong rally starts when nobody is talking about it. The question is whether $GENIUS is preparing for that stage.
Stay patient, stay disciplined, and always do your own research.
#GENIUS #Crypto #Altcoins #BinanceFeed #Trading #DYOR #CryptoMarketTrends #USMayADPJobsExceedExpectations
$GENIUS is one of those projects that many traders ignore until it suddenly starts trending.
Looking at the current price action, I see a market that is trying to build a base rather than chasing hype. This is usually the phase where impatient traders leave and smart money starts paying attention.
My focus right now is not on short-term pumps but on whether buyers can continue defending key support levels. If that happens, the next leg higher could surprise many people.
What I'm doing:
✔️ Avoiding FOMO entries.
✔️ Watching volume closely.
✔️ Taking profits gradually on strong moves.
✔️ Keeping risk management first.
Remember, every strong rally starts when nobody is talking about it. The question is whether $GENIUS is preparing for that stage.
Stay patient, stay disciplined, and always do your own research.
#GENIUS #Crypto #Altcoins #BinanceFeed #Trading #DYOR #CryptoMarketTrends #USMayADPJobsExceedExpectations



61

Bitcoin Spot ETFs Extend Outflow Streak as Institutions Pull Back
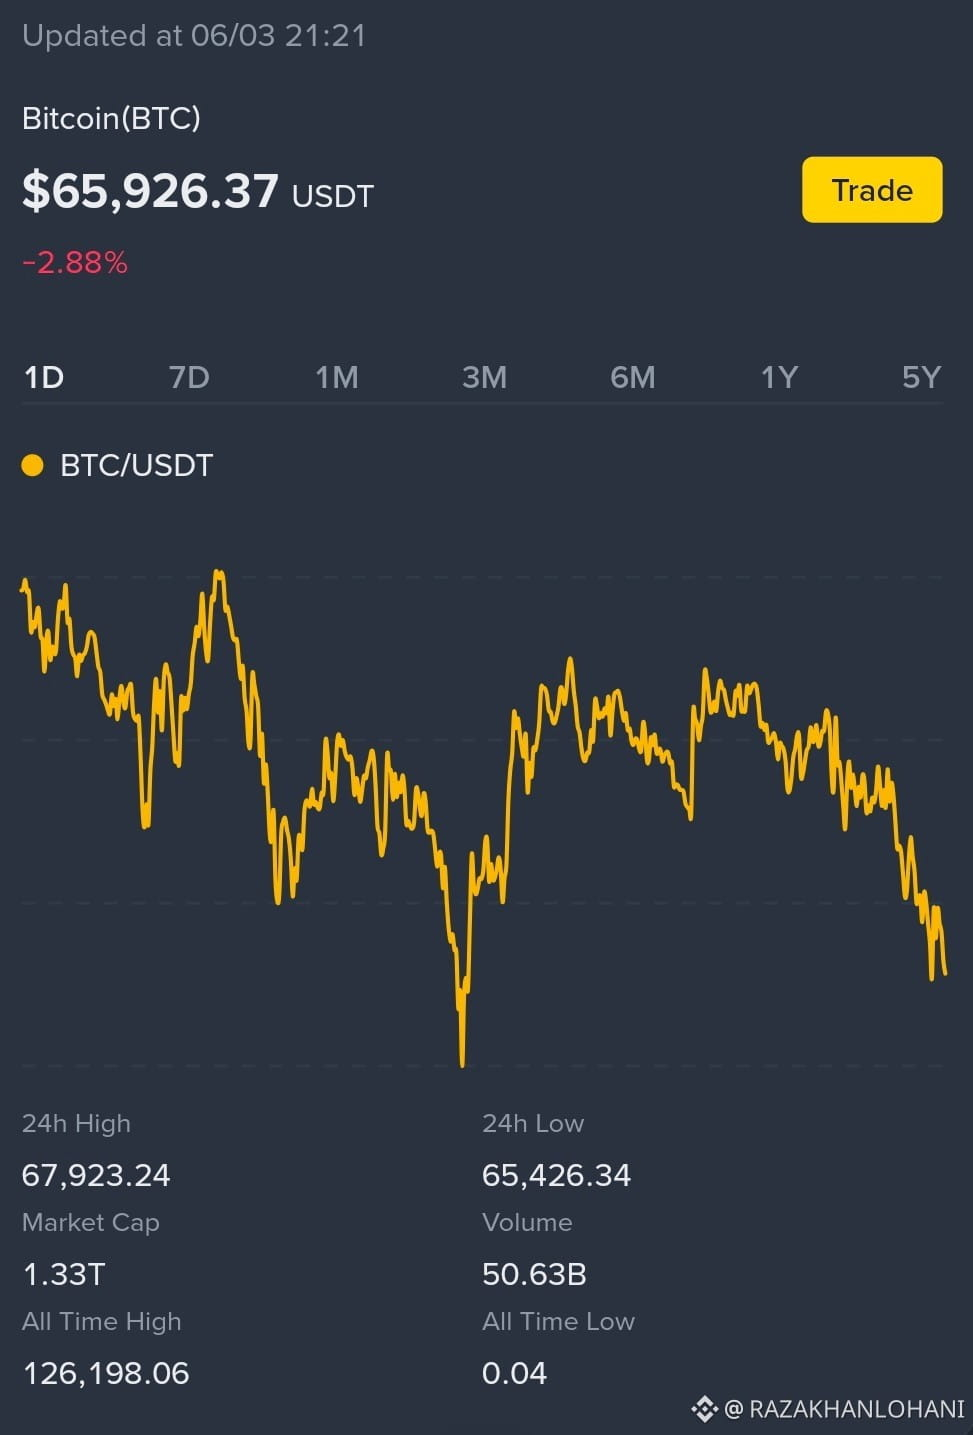
U.S.$BTC Bitcoin spot ETFs recorded $519 million in net outflows yesterday, marking the 12th straight day of withdrawals. Total outflows over the streak have now reached roughly $3.978 billion, signaling sustained selling pressure and a noticeable cooldown in institutional demand for Bitcoin ETF exposure.
#BitcoinFearGaugeSurgesNearly20%
#USMayADPJobsExceedExpectations
#XRPHits15WeekLow
Bitcoin Spot ETFs Extend Outflow Streak as Institutions Pull Back
U.S.$BTC Bitcoin spot ETFs recorded $519 million in net outflows yesterday, marking the 12th straight day of withdrawals. Total outflows over the streak have now reached roughly $3.978 billion, signaling sustained selling pressure and a noticeable cooldown in institutional demand for Bitcoin ETF exposure.
#BitcoinFearGaugeSurgesNearly20%
#USMayADPJobsExceedExpectations
#XRPHits15WeekLow
U.S.$BTC Bitcoin spot ETFs recorded $519 million in net outflows yesterday, marking the 12th straight day of withdrawals. Total outflows over the streak have now reached roughly $3.978 billion, signaling sustained selling pressure and a noticeable cooldown in institutional demand for Bitcoin ETF exposure.
#BitcoinFearGaugeSurgesNearly20%
#USMayADPJobsExceedExpectations
#XRPHits15WeekLow
72

·
--
Bullish
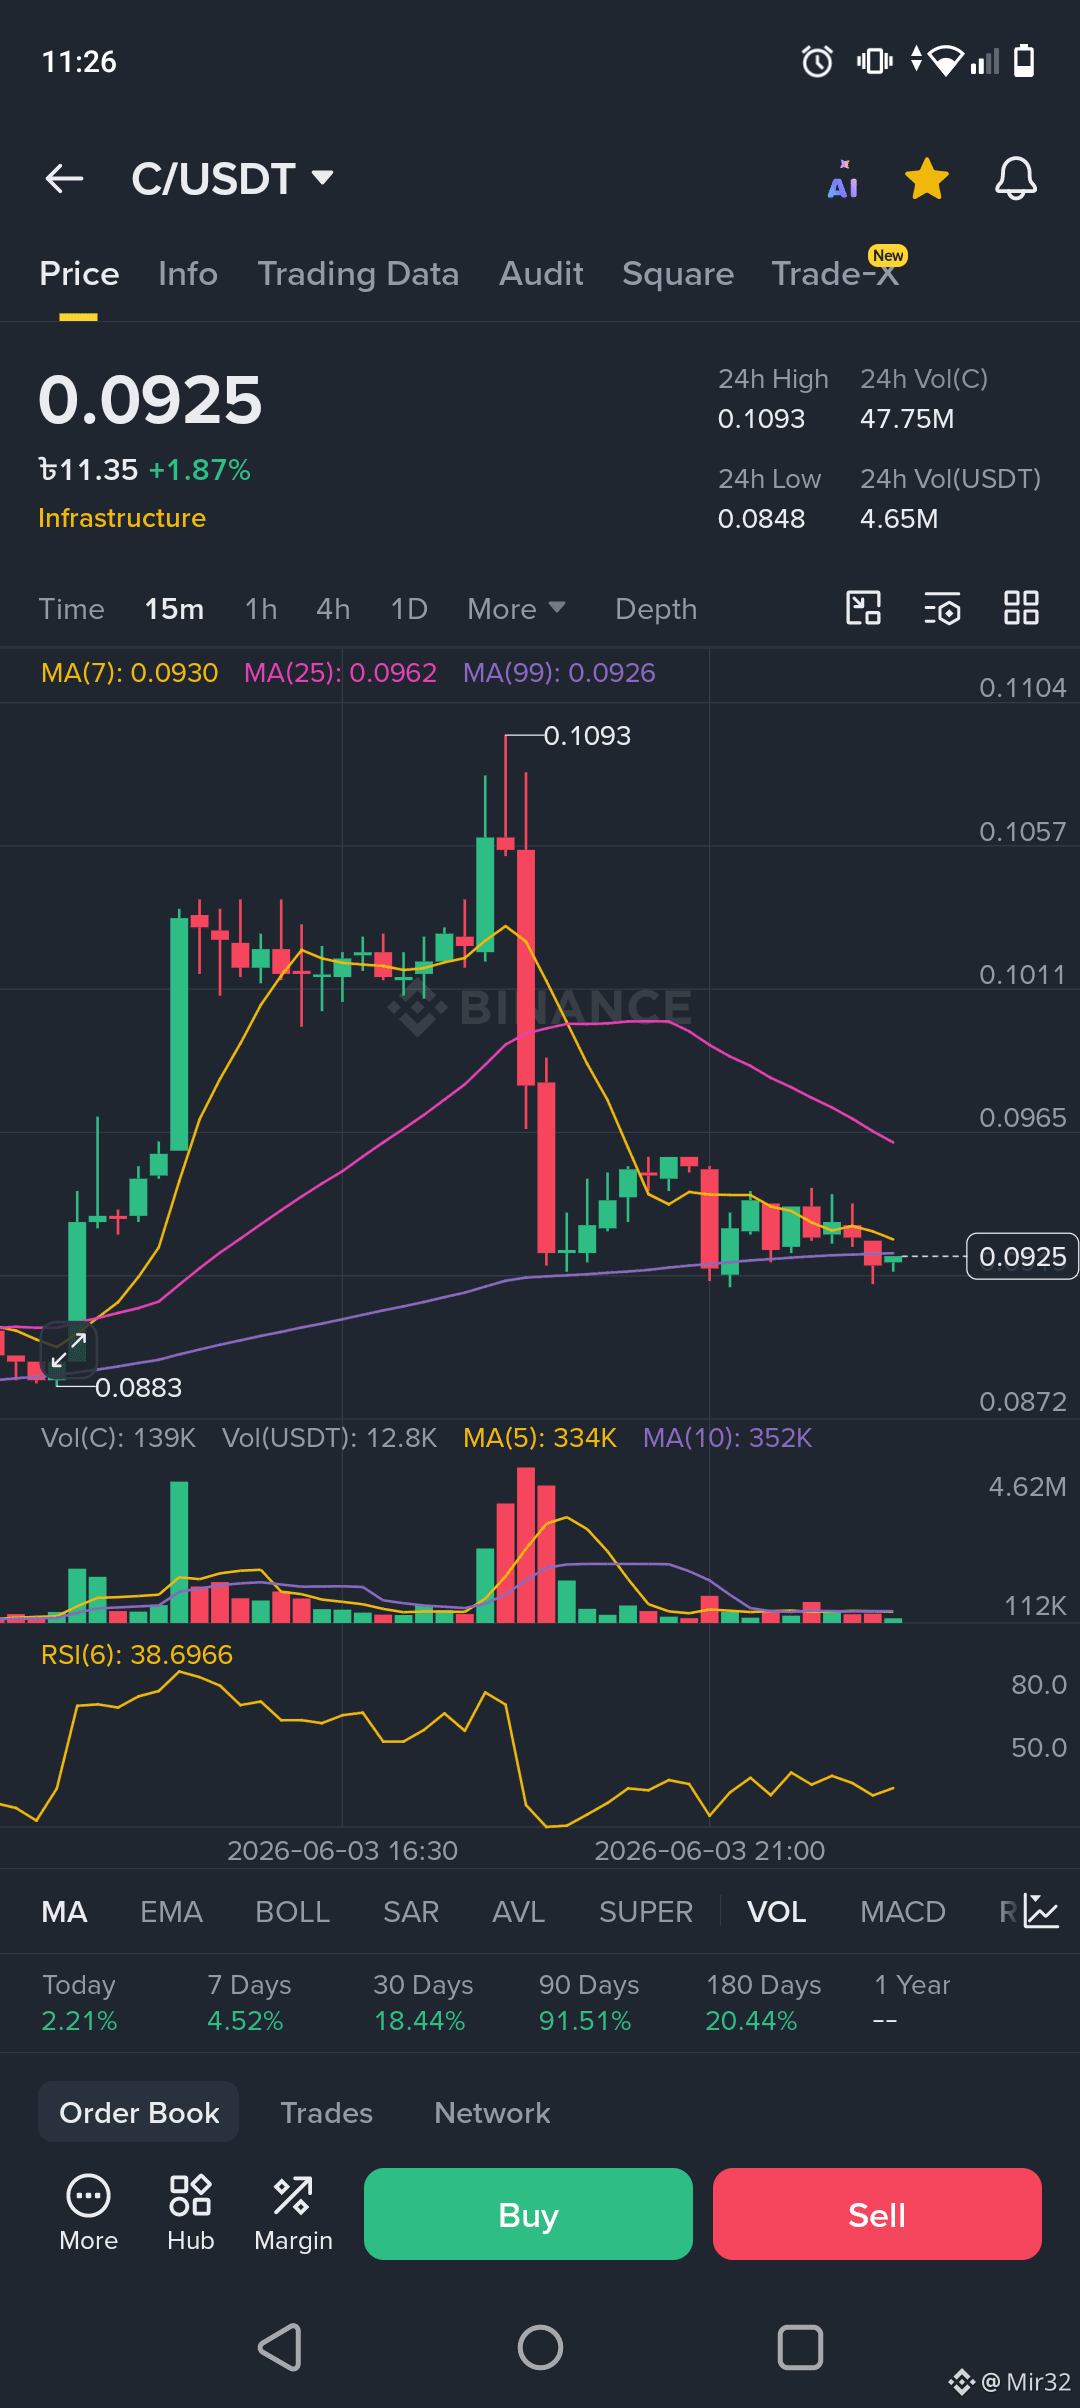
🚀 Binance Potential Gem: Chainbase ($C) 💎
Price: $0.0925 (১১.৩৫ টাকা)
Function: Web3 AI & Data (not a meme coin, real project)
News: Big whales or investors are quietly stacking this coin at the current price.
📊 Buy Zone: $0.0850 - $0.0900 (currently a perfect entry price)
🎯 Next Target:
Short-term: $0.1400
Medium-term: $0.1900
Long-term: $0.2700+ (3x profit potential)
💡 Opinion: Without losing on meme coins, this could be a solid long-term choice.
(DYOR: The crypto market is risky, invest at your own risk.)
#ZcashSurges10PctAfterCriticalBugFix #NEARSurgesAbove3USDT #USMayADPJobsExceedExpectations
$BTC $ETH $BNB
🚀 Binance Potential Gem: Chainbase ($C) 💎
Price: $0.0925 (১১.৩৫ টাকা)
Function: Web3 AI & Data (not a meme coin, real project)
News: Big whales or investors are quietly stacking this coin at the current price.
📊 Buy Zone: $0.0850 - $0.0900 (currently a perfect entry price)
🎯 Next Target:
Short-term: $0.1400
Medium-term: $0.1900
Long-term: $0.2700+ (3x profit potential)
💡 Opinion: Without losing on meme coins, this could be a solid long-term choice.
(DYOR: The crypto market is risky, invest at your own risk.)
#ZcashSurges10PctAfterCriticalBugFix #NEARSurgesAbove3USDT #USMayADPJobsExceedExpectations
$BTC $ETH $BNB
Price: $0.0925 (১১.৩৫ টাকা)
Function: Web3 AI & Data (not a meme coin, real project)
News: Big whales or investors are quietly stacking this coin at the current price.
📊 Buy Zone: $0.0850 - $0.0900 (currently a perfect entry price)
🎯 Next Target:
Short-term: $0.1400
Medium-term: $0.1900
Long-term: $0.2700+ (3x profit potential)
💡 Opinion: Without losing on meme coins, this could be a solid long-term choice.
(DYOR: The crypto market is risky, invest at your own risk.)
#ZcashSurges10PctAfterCriticalBugFix #NEARSurgesAbove3USDT #USMayADPJobsExceedExpectations
$BTC $ETH $BNB
59

·
--
Bearish
$GENIUS
{spot}(GENIUSUSDT)
Trede now 👆👆👆👆👆👆
– SHORT 🔴
📊 Trade Plan:
🔹 Entry: 0.503511 – 0.510913
🛑 SL: 0.542744
🎯 Targets:
🎯 TP1: 0.480563
🎯 TP2: 0.462797
🎯 TP3: 0.436147
#USMayADPJobsExceedExpectations #StrategyFallsOutOfTop200US LABTokenPlummets77PctErases$6B#ZcashFourHourBlockProductionHalt #BitcoinFearGaugeSurgesNearly20% #BitcoinFearGaugeSurgesNearly20% $HOME
{spot}(HOMEUSDT)
$POL
{spot}(POLUSDT)
$GENIUS
Trede now 👆👆👆👆👆👆
– SHORT 🔴
📊 Trade Plan:
🔹 Entry: 0.503511 – 0.510913
🛑 SL: 0.542744
🎯 Targets:
🎯 TP1: 0.480563
🎯 TP2: 0.462797
🎯 TP3: 0.436147
#USMayADPJobsExceedExpectations #StrategyFallsOutOfTop200US LABTokenPlummets77PctErases$6B#ZcashFourHourBlockProductionHalt #BitcoinFearGaugeSurgesNearly20% #BitcoinFearGaugeSurgesNearly20% $HOME
$POL
Trede now 👆👆👆👆👆👆
– SHORT 🔴
📊 Trade Plan:
🔹 Entry: 0.503511 – 0.510913
🛑 SL: 0.542744
🎯 Targets:
🎯 TP1: 0.480563
🎯 TP2: 0.462797
🎯 TP3: 0.436147
#USMayADPJobsExceedExpectations #StrategyFallsOutOfTop200US LABTokenPlummets77PctErases$6B#ZcashFourHourBlockProductionHalt #BitcoinFearGaugeSurgesNearly20% #BitcoinFearGaugeSurgesNearly20% $HOME
$POL
44

$MAGMA Magma Finance (MAGMA) is one of the strongest-performing DeFi tokens in the Sui ecosystem today. The token surged more than 40% in the last 24 hours, reaching a new all-time high near $0.39–$0.40 while trading volume expanded sharply, signaling strong market participation. citeturn0search0turn0search1turn0search3
Key Market Data
* Price: around $0.39
* 24h Change: +44%
* 7-Day Change: +50%
* Market Cap: approximately $73–74 million
* 24h Volume: $5–12 million
* New ATH recorded on June 3, 2026. ** maximum supply, creating a scarcity narrative in the short term. , short-term profit-taking is possible$MAGMA
{future}(MAGMAUSDT)
#StrategyFallsOutOfTop200US #USMayADPJobsExceedExpectations #XRPHits15WeekLow
$MAGMA Magma Finance (MAGMA) is one of the strongest-performing DeFi tokens in the Sui ecosystem today. The token surged more than 40% in the last 24 hours, reaching a new all-time high near $0.39–$0.40 while trading volume expanded sharply, signaling strong market participation. citeturn0search0turn0search1turn0search3
Key Market Data
* Price: around $0.39
* 24h Change: +44%
* 7-Day Change: +50%
* Market Cap: approximately $73–74 million
* 24h Volume: $5–12 million
* New ATH recorded on June 3, 2026. ** maximum supply, creating a scarcity narrative in the short term. , short-term profit-taking is possible$MAGMA
#StrategyFallsOutOfTop200US #USMayADPJobsExceedExpectations #XRPHits15WeekLow
Key Market Data
* Price: around $0.39
* 24h Change: +44%
* 7-Day Change: +50%
* Market Cap: approximately $73–74 million
* 24h Volume: $5–12 million
* New ATH recorded on June 3, 2026. ** maximum supply, creating a scarcity narrative in the short term. , short-term profit-taking is possible$MAGMA
#StrategyFallsOutOfTop200US #USMayADPJobsExceedExpectations #XRPHits15WeekLow

187


·
--
Bullish
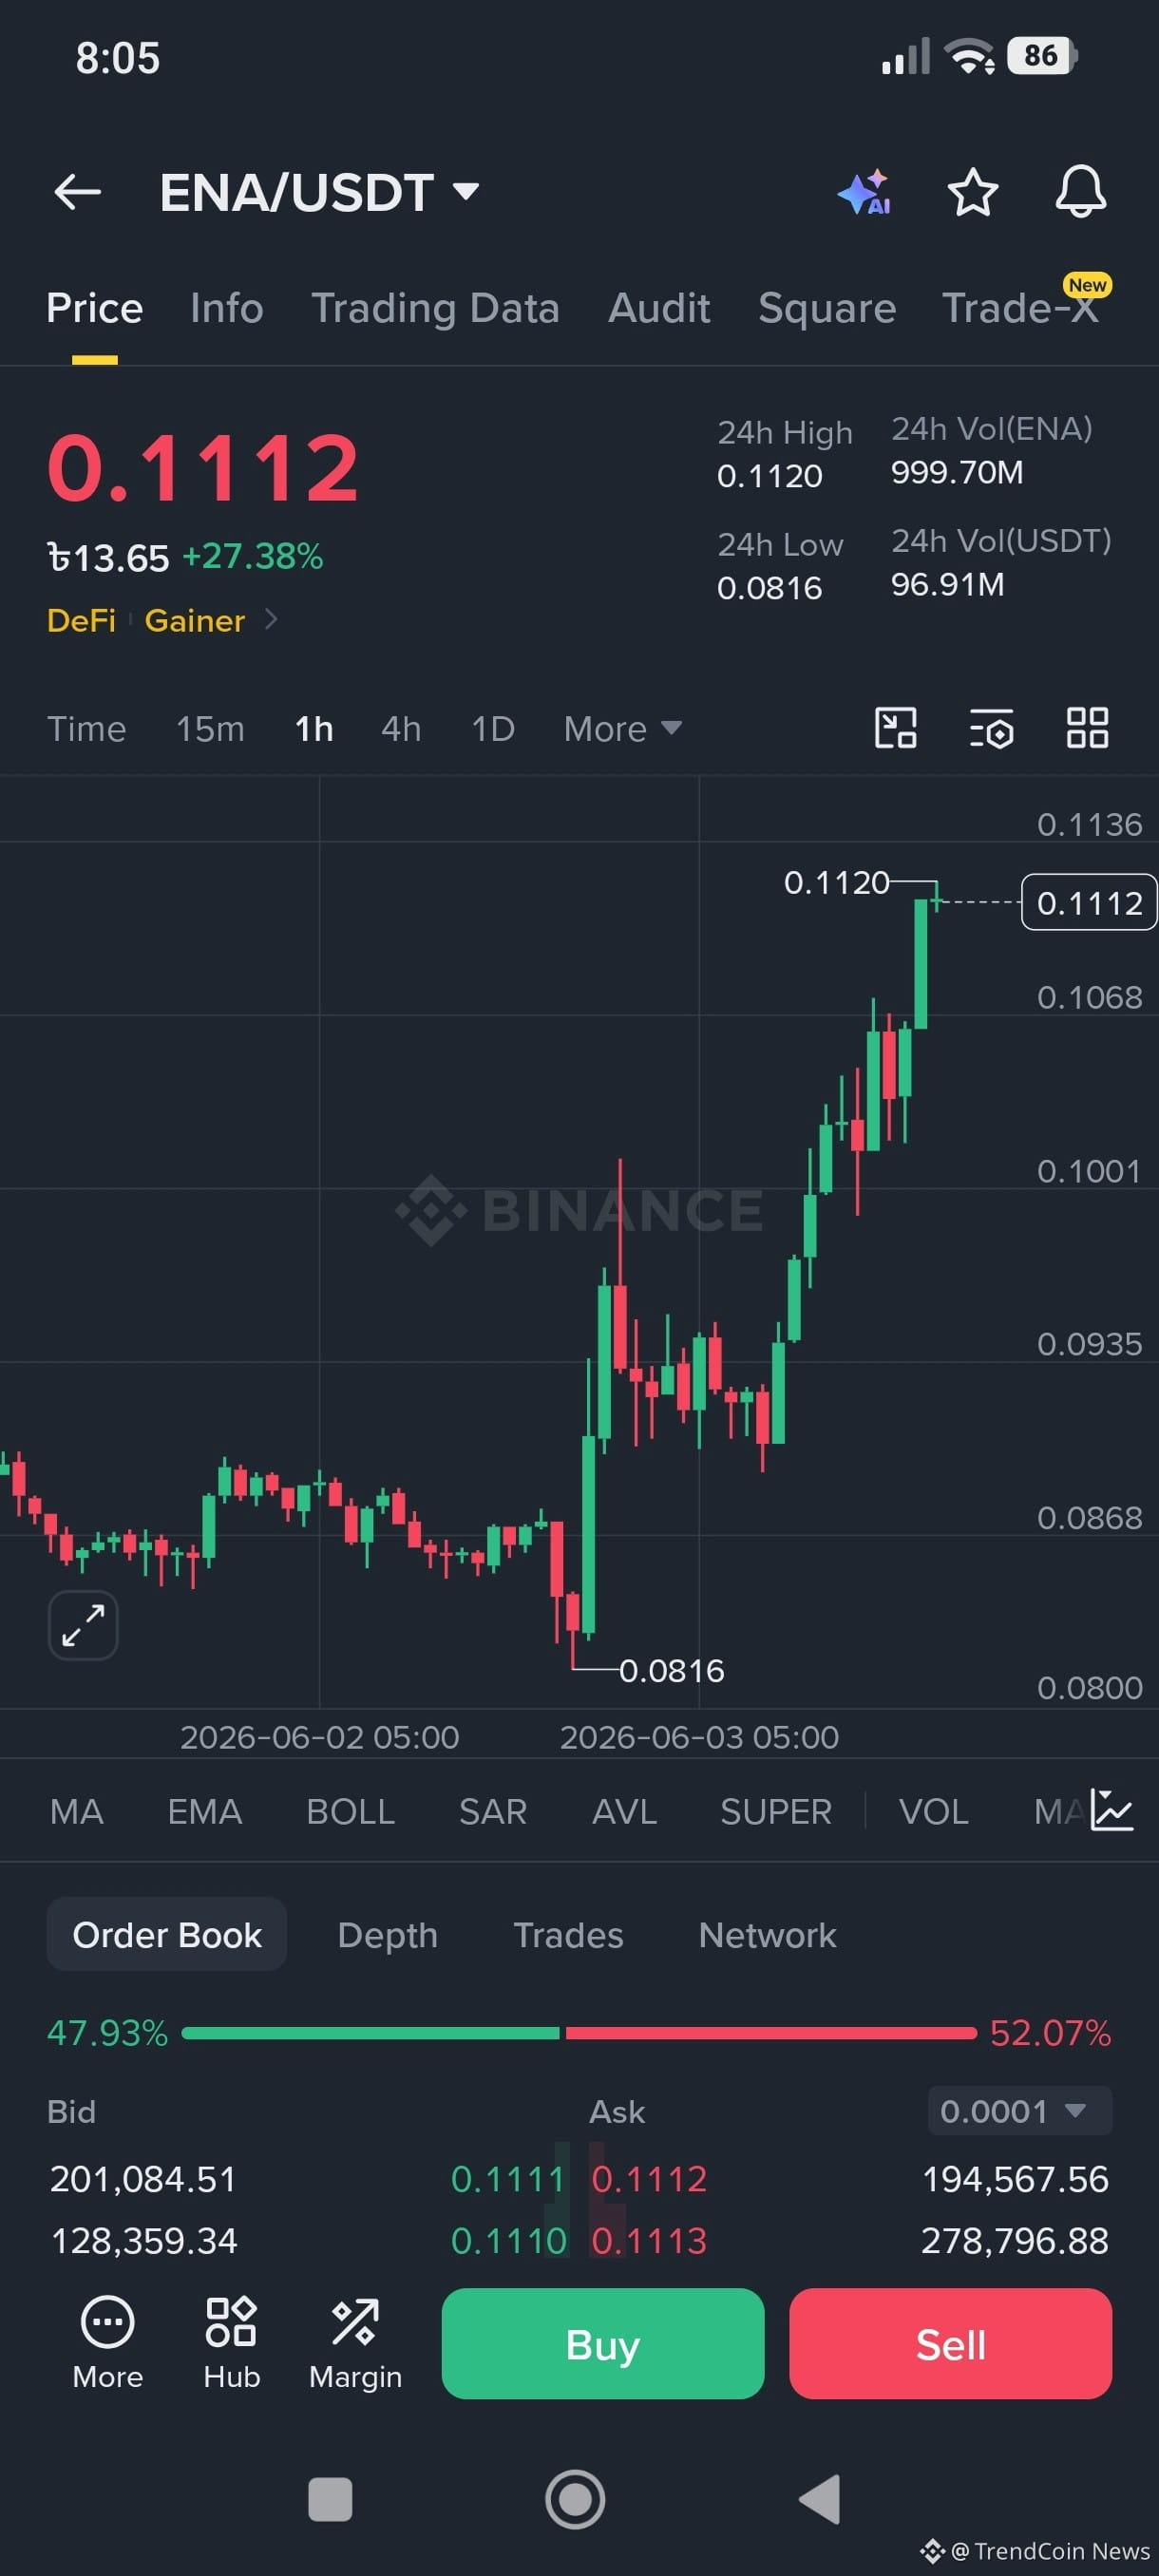
🚩 $ENA JUST POPPED 27% – AND VOLUME IS EXPLODING! 🔥
24h high at $0.112 – price sitting at $0.1112 right now. Almost there.
📊 Volume: 999M – that's not a joke. That's real demand.
⚔️ Order book: 52% asks / 47% bids – slight selling pressure, but buyers are hungry.
🎯 Next targets: $0.113 → $0.115 → $0.118
🛑 Stop loss: $0.107
👇 You in or watching from the sidelines?
Trade here 🔻
{future}(ENAUSDT)
#StrategyFallsOutOfTop200US #USMayADPJobsExceedExpectations #XRPHits15WeekLow LABTokenPlummets77PctErases$6B#MRVLSoarsOnNVDATrillionDollarOutlook #ZcashFourHourBlockProductionHalt
🚩 $ENA JUST POPPED 27% – AND VOLUME IS EXPLODING! 🔥
24h high at $0.112 – price sitting at $0.1112 right now. Almost there.
📊 Volume: 999M – that's not a joke. That's real demand.
⚔️ Order book: 52% asks / 47% bids – slight selling pressure, but buyers are hungry.
🎯 Next targets: $0.113 → $0.115 → $0.118
🛑 Stop loss: $0.107
👇 You in or watching from the sidelines?
Trade here 🔻
#StrategyFallsOutOfTop200US #USMayADPJobsExceedExpectations #XRPHits15WeekLow LABTokenPlummets77PctErases$6B#MRVLSoarsOnNVDATrillionDollarOutlook #ZcashFourHourBlockProductionHalt
24h high at $0.112 – price sitting at $0.1112 right now. Almost there.
📊 Volume: 999M – that's not a joke. That's real demand.
⚔️ Order book: 52% asks / 47% bids – slight selling pressure, but buyers are hungry.
🎯 Next targets: $0.113 → $0.115 → $0.118
🛑 Stop loss: $0.107
👇 You in or watching from the sidelines?
Trade here 🔻
#StrategyFallsOutOfTop200US #USMayADPJobsExceedExpectations #XRPHits15WeekLow LABTokenPlummets77PctErases$6B#MRVLSoarsOnNVDATrillionDollarOutlook #ZcashFourHourBlockProductionHalt
1
197




·
--
Bullish
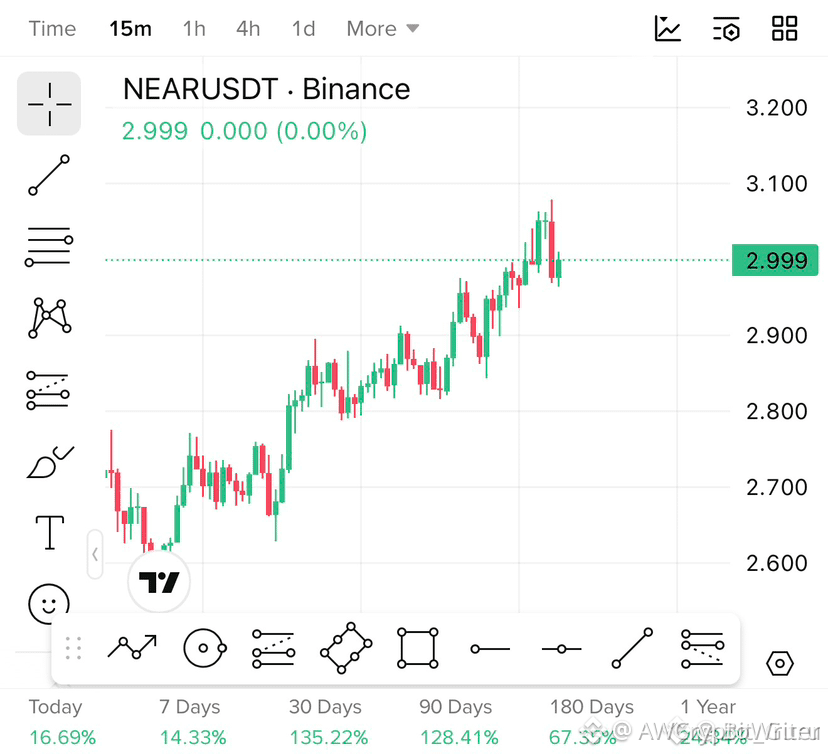
🚀 $NEAR Bulls Are Still Running Wild ‼️🔥
Why wait when the trend is this strong? 😏
📈 Trade Setup:
• Entry: Current Price
• TP: $3.20
• SL: $2.86
$NEAR continues to deliver one of the clearest bullish structures in the market, consistently printing higher highs and higher lows. Every pullback gets bought up quickly, showing strong buyer confidence and sustained demand.
The recent dip looks like nothing more than a healthy consolidation within a larger uptrend. As long as price holds above key support levels and the higher-low structure remains intact, bulls remain firmly in control.
📊 The trend is your friend — and right now, the trend is pointing higher. Until sellers can break market structure, the path of least resistance remains to the upside.
#NEAR #cryptotrading #StrategyFallsOutOfTop200US #USMayADPJobsExceedExpectations #XRPHits15WeekLow
{future}(NEARUSDT)
🚀 $NEAR Bulls Are Still Running Wild ‼️🔥
Why wait when the trend is this strong? 😏
📈 Trade Setup:
• Entry: Current Price
• TP: $3.20
• SL: $2.86
$NEAR continues to deliver one of the clearest bullish structures in the market, consistently printing higher highs and higher lows. Every pullback gets bought up quickly, showing strong buyer confidence and sustained demand.
The recent dip looks like nothing more than a healthy consolidation within a larger uptrend. As long as price holds above key support levels and the higher-low structure remains intact, bulls remain firmly in control.
📊 The trend is your friend — and right now, the trend is pointing higher. Until sellers can break market structure, the path of least resistance remains to the upside.
#NEAR #cryptotrading #StrategyFallsOutOfTop200US #USMayADPJobsExceedExpectations #XRPHits15WeekLow
Why wait when the trend is this strong? 😏
📈 Trade Setup:
• Entry: Current Price
• TP: $3.20
• SL: $2.86
$NEAR continues to deliver one of the clearest bullish structures in the market, consistently printing higher highs and higher lows. Every pullback gets bought up quickly, showing strong buyer confidence and sustained demand.
The recent dip looks like nothing more than a healthy consolidation within a larger uptrend. As long as price holds above key support levels and the higher-low structure remains intact, bulls remain firmly in control.
📊 The trend is your friend — and right now, the trend is pointing higher. Until sellers can break market structure, the path of least resistance remains to the upside.
#NEAR #cryptotrading #StrategyFallsOutOfTop200US #USMayADPJobsExceedExpectations #XRPHits15WeekLow
67
Log in to explore more content
Join global crypto users on Binance Square
⚡️ Get latest and useful information about crypto.
💬 Trusted by the world’s largest crypto exchange.
👍 Discover real insights from verified creators.
Email / Phone number
Trending Topics
1
#CPIWatch
86.8M views
502,484 Discussing
2
#BitcoinReboundsAbove$79KAfterCPI
1,583 views
109 Discussing
3
#BNBTops730USDT
14,404 views
567 Discussing
4
#BitcoinOpenInterestShareRisesTo42.1%
6,190 views
289 Discussing
5
#OpenAILaunchesAgentsAPIPublicBeta
4,319 views
175 Discussing
6
#SpotGoldRises0.87%SilverGains1.13%
5,399 views
177 Discussing
7
#USCoreCPIRises0.3%InAugustBeatingForecasts
16,157 views
287 Discussing
8
#BitcoinFallsTo$77KAfterGoldenCross
3,043 views
67 Discussing
9
#OracleJumpsOver6%OnEarningsBeat
25,389 views
415 Discussing
10
#CLARITYActRevisionToRuleNonDeFiControllers
32,548 views
517 Discussing