

#spotbitcoinetfsinflow
spotbitcoinetfsinflow
909 views
43 Discussing
Hot
Latest

Why is nobody talking about how those daily Bitcoin ETF inflow headlines have turned into a retail trap?
Every time the numbers look strong, traders rush in expecting $BTC to explode, only to get chopped up when the market barely reacts. That FOMO has cost more people money this cycle than actual rugs.
The story everyone repeats is that institutional money flooding into spot ETFs is the ultimate bullish catalyst. I don't buy it at these levels. With greed sitting at 73, those inflows are being used as exit liquidity by smarter money that's been sitting on profits. Price action after the news is what matters, not the headline itself.
Instead of chasing, watch whether $BTC actually holds its range after the print. Keep a portion in $USDT so you can buy the dip that tends to show up a day or two later. $ETH is a decent tell too. If it isn't confirming the move, the whole thing is probably just noise.
Anyone else seeing these inflow numbers as a reason to stay patient rather than jump in?
#SpotBitcoinETFsInflow #BitcoinFallsBelow #ETHBreaksAbove
Why is nobody talking about how those daily Bitcoin ETF inflow headlines have turned into a retail trap?
Every time the numbers look strong, traders rush in expecting $BTC to explode, only to get chopped up when the market barely reacts. That FOMO has cost more people money this cycle than actual rugs.
The story everyone repeats is that institutional money flooding into spot ETFs is the ultimate bullish catalyst. I don't buy it at these levels. With greed sitting at 73, those inflows are being used as exit liquidity by smarter money that's been sitting on profits. Price action after the news is what matters, not the headline itself.
Instead of chasing, watch whether $BTC actually holds its range after the print. Keep a portion in $USDT so you can buy the dip that tends to show up a day or two later. $ETH is a decent tell too. If it isn't confirming the move, the whole thing is probably just noise.
Anyone else seeing these inflow numbers as a reason to stay patient rather than jump in?
#SpotBitcoinETFsInflow #BitcoinFallsBelow #ETHBreaksAbove
Every time the numbers look strong, traders rush in expecting $BTC to explode, only to get chopped up when the market barely reacts. That FOMO has cost more people money this cycle than actual rugs.
The story everyone repeats is that institutional money flooding into spot ETFs is the ultimate bullish catalyst. I don't buy it at these levels. With greed sitting at 73, those inflows are being used as exit liquidity by smarter money that's been sitting on profits. Price action after the news is what matters, not the headline itself.
Instead of chasing, watch whether $BTC actually holds its range after the print. Keep a portion in $USDT so you can buy the dip that tends to show up a day or two later. $ETH is a decent tell too. If it isn't confirming the move, the whole thing is probably just noise.
Anyone else seeing these inflow numbers as a reason to stay patient rather than jump in?
#SpotBitcoinETFsInflow #BitcoinFallsBelow #ETHBreaksAbove

7

·
--
If you are still treating ETF inflow headlines as an instant buy signal, stop now.
Most traders see green inflow numbers, ape in at local tops out of sheer FOMO, and then wonder why their portfolio bleeds out the moment the market takes a routine liquidity sweep. Watching the Fear & Greed index sit comfortably in greed territory while chasing green candles is usually how retail ends up funding everyone else's exit liquidity.
The truth is, tracking $BTC institutional demand today looks very different from how we used to trade the 2021 bull run cycles. Back then, retail momentum led the charge with rapid rotation into assets like $ETC and legacy alts, but ETF flows operate on a completely different rhythm. Wall Street algorithms accumulate slowly over weeks, creating choppy ranges where over-leveraged long positions get flushed out before any real expansion happens.
While steady net inflows prove long-term absorption, they rarely translate into immediate vertical pumps within an intraday session. Parking capital into $USDT and waiting for confirmed pullbacks historically yields a much better risk-to-reward ratio than panic-buying every morning inflow report.
Are you using these inflow numbers to position long-term, or are you scaling back until the greed cools off?
#SpotBitcoinETFsInflow #ETHBreaksAbove
If you are still treating ETF inflow headlines as an instant buy signal, stop now.
Most traders see green inflow numbers, ape in at local tops out of sheer FOMO, and then wonder why their portfolio bleeds out the moment the market takes a routine liquidity sweep. Watching the Fear & Greed index sit comfortably in greed territory while chasing green candles is usually how retail ends up funding everyone else's exit liquidity.
The truth is, tracking $BTC institutional demand today looks very different from how we used to trade the 2021 bull run cycles. Back then, retail momentum led the charge with rapid rotation into assets like $ETC and legacy alts, but ETF flows operate on a completely different rhythm. Wall Street algorithms accumulate slowly over weeks, creating choppy ranges where over-leveraged long positions get flushed out before any real expansion happens.
While steady net inflows prove long-term absorption, they rarely translate into immediate vertical pumps within an intraday session. Parking capital into $USDT and waiting for confirmed pullbacks historically yields a much better risk-to-reward ratio than panic-buying every morning inflow report.
Are you using these inflow numbers to position long-term, or are you scaling back until the greed cools off?
#SpotBitcoinETFsInflow #ETHBreaksAbove
Most traders see green inflow numbers, ape in at local tops out of sheer FOMO, and then wonder why their portfolio bleeds out the moment the market takes a routine liquidity sweep. Watching the Fear & Greed index sit comfortably in greed territory while chasing green candles is usually how retail ends up funding everyone else's exit liquidity.
The truth is, tracking $BTC institutional demand today looks very different from how we used to trade the 2021 bull run cycles. Back then, retail momentum led the charge with rapid rotation into assets like $ETC and legacy alts, but ETF flows operate on a completely different rhythm. Wall Street algorithms accumulate slowly over weeks, creating choppy ranges where over-leveraged long positions get flushed out before any real expansion happens.
While steady net inflows prove long-term absorption, they rarely translate into immediate vertical pumps within an intraday session. Parking capital into $USDT and waiting for confirmed pullbacks historically yields a much better risk-to-reward ratio than panic-buying every morning inflow report.
Are you using these inflow numbers to position long-term, or are you scaling back until the greed cools off?
#SpotBitcoinETFsInflow #ETHBreaksAbove
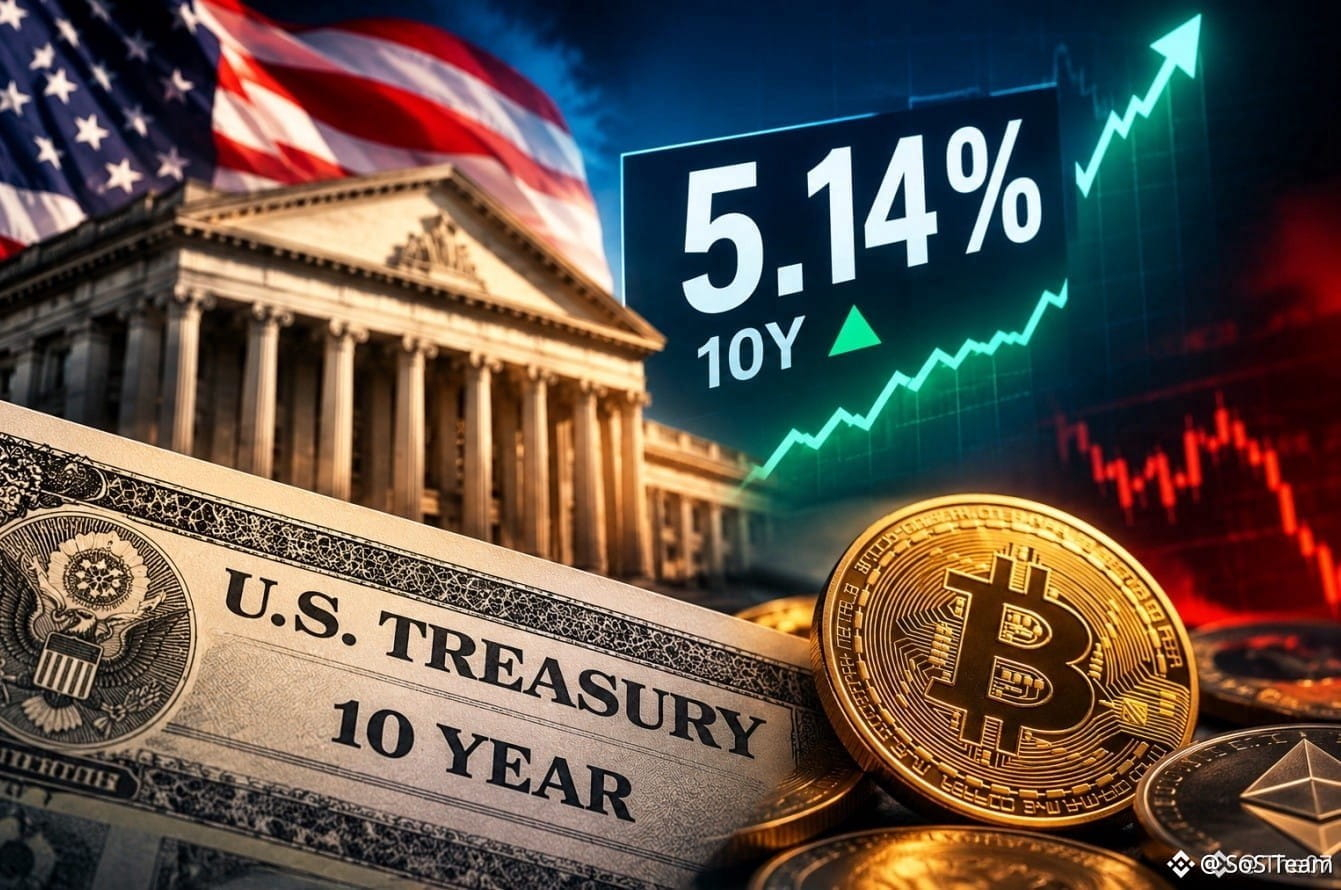
BTC+0.09%
IEFETF-0.05%
5
·
--
Spot Bitcoin ETFs have pulled more coins off the market this quarter than miners produced, and a Fear and Greed reading of 73 still has most people treating that flow like a sideshow.
You buy the green inflow print, get wicked out on the next red candle, then park in $USDT telling yourself the institutions already finished buying. That loop of chasing and regretting is how a lot of accounts died in the last two cycles.
I watched the same movie in 2017 when CME futures launched and the timeline called it the top. We were early, not wrong. The difference this time is the product actually takes $BTC into vaults that do not dump on a 20 percent drawdown. These buyers do not check Twitter. They submit creation orders. When greed is this loud the real risk is not that inflows stop. It is that everyone else climbs on the same side of the boat, then one hot print or a jump in the 10-year starts the unwind with the last people in.
Supply that leaves the float does not care about your 4-hour chart. That is the part I wish I had respected before the last halving.
Where do you think the next stretch of these flows goes from here?
#SpotBitcoinETFsInflow #US10YTreasuryYieldHits19YearHigh #BitcoinRejectedAt
Spot Bitcoin ETFs have pulled more coins off the market this quarter than miners produced, and a Fear and Greed reading of 73 still has most people treating that flow like a sideshow.
You buy the green inflow print, get wicked out on the next red candle, then park in $USDT telling yourself the institutions already finished buying. That loop of chasing and regretting is how a lot of accounts died in the last two cycles.
I watched the same movie in 2017 when CME futures launched and the timeline called it the top. We were early, not wrong. The difference this time is the product actually takes $BTC into vaults that do not dump on a 20 percent drawdown. These buyers do not check Twitter. They submit creation orders. When greed is this loud the real risk is not that inflows stop. It is that everyone else climbs on the same side of the boat, then one hot print or a jump in the 10-year starts the unwind with the last people in.
Supply that leaves the float does not care about your 4-hour chart. That is the part I wish I had respected before the last halving.
Where do you think the next stretch of these flows goes from here?
#SpotBitcoinETFsInflow #US10YTreasuryYieldHits19YearHigh #BitcoinRejectedAt
You buy the green inflow print, get wicked out on the next red candle, then park in $USDT telling yourself the institutions already finished buying. That loop of chasing and regretting is how a lot of accounts died in the last two cycles.
I watched the same movie in 2017 when CME futures launched and the timeline called it the top. We were early, not wrong. The difference this time is the product actually takes $BTC into vaults that do not dump on a 20 percent drawdown. These buyers do not check Twitter. They submit creation orders. When greed is this loud the real risk is not that inflows stop. It is that everyone else climbs on the same side of the boat, then one hot print or a jump in the 10-year starts the unwind with the last people in.
Supply that leaves the float does not care about your 4-hour chart. That is the part I wish I had respected before the last halving.
Where do you think the next stretch of these flows goes from here?
#SpotBitcoinETFsInflow #US10YTreasuryYieldHits19YearHigh #BitcoinRejectedAt

46
If you're still treating every positive $BTC ETF inflow as a green light to buy, stop now.
Too many traders have watched a strong inflow headline, piled in, and then sat through a stall or a dump with no exit plan. The pain hits when the institutional bid you were counting on just pauses.
There's a real split on this. Bulls say spot Bitcoin ETF inflows are the cleanest demand signal we have because real coins leave the market, and when the prints stay green $BTC tends to hold a floor. Skeptics say the numbers lag, price already moved, and a single outflow day can reverse the mood.
I'm with the skeptics this week. Greed is already at 73, so the crowd is leaning in, parking cash in $USDT and rotating into names like $AAVE while treating inflows as confirmation. Sticky yields and a firmer dollar can turn those ETF desks into sellers just as quickly as they bought.
Are you still buying the inflow headlines, or have you started treating them as lagging noise?
#SpotBitcoinETFsInflow #BitcoinRejectedAt #US10YTreasuryYieldHits19YearHigh
If you're still treating every positive $BTC ETF inflow as a green light to buy, stop now.
Too many traders have watched a strong inflow headline, piled in, and then sat through a stall or a dump with no exit plan. The pain hits when the institutional bid you were counting on just pauses.
There's a real split on this. Bulls say spot Bitcoin ETF inflows are the cleanest demand signal we have because real coins leave the market, and when the prints stay green $BTC tends to hold a floor. Skeptics say the numbers lag, price already moved, and a single outflow day can reverse the mood.
I'm with the skeptics this week. Greed is already at 73, so the crowd is leaning in, parking cash in $USDT and rotating into names like $AAVE while treating inflows as confirmation. Sticky yields and a firmer dollar can turn those ETF desks into sellers just as quickly as they bought.
Are you still buying the inflow headlines, or have you started treating them as lagging noise?
#SpotBitcoinETFsInflow #BitcoinRejectedAt #US10YTreasuryYieldHits19YearHigh
Too many traders have watched a strong inflow headline, piled in, and then sat through a stall or a dump with no exit plan. The pain hits when the institutional bid you were counting on just pauses.
There's a real split on this. Bulls say spot Bitcoin ETF inflows are the cleanest demand signal we have because real coins leave the market, and when the prints stay green $BTC tends to hold a floor. Skeptics say the numbers lag, price already moved, and a single outflow day can reverse the mood.
I'm with the skeptics this week. Greed is already at 73, so the crowd is leaning in, parking cash in $USDT and rotating into names like $AAVE while treating inflows as confirmation. Sticky yields and a firmer dollar can turn those ETF desks into sellers just as quickly as they bought.
Are you still buying the inflow headlines, or have you started treating them as lagging noise?
#SpotBitcoinETFsInflow #BitcoinRejectedAt #US10YTreasuryYieldHits19YearHigh

16

·
--
📰 BlackRock pushes $191.65M into BTC ETF inflows—why the bears’ pullback bets failed?
On Thursday, U.S. crypto ETF flows surged significantly. Bitcoin ETFs saw net inflows of $191.65 million, marking the sixth consecutive day of gains. Other products—such as Ethereum, Solana, and Ripple—also attracted capital, while the Zcash ETF remained flat for two straight days. Ongoing institutional buying of BTC ETFs signals strong demand.
Why is this news important?
BlackRock-led inflows suggest that the world’s largest asset manager has shifted from observing to taking a clearly bullish stance on the crypto market. The $191.65 million inflow set a record, and six straight bullish sessions indicate this is trend-driven capital. It means: 1) institutional investors are starting to include crypto assets in long-term allocation rather than treating them as short-term speculation; 2) market uncertainty around regulation (such as the SEC’s stance) appears to have been digested, with capital focusing more on the underlying asset value. Compared with the ETF applications that cooled off in March, this indicates the industry has moved past its darkest moment.
Market impact
For BTC, six straight days of inflows should help support the $83,819 level. ETH’s 1.09% rise in parallel shows that smaller-cap coins also benefit. In the short term, bulls may hold the upper hand, but watch for the explosive rallies in SOL/XRP, which could siphon some capital. Historically, when ETF inflows persist, BTC has been able to hold at least for two weeks. That suggests this rebound may last until at least next Friday. However, if inflows slow or profit-taking emerges, upside momentum will fade.
Trading idea
💡 BTC has strong support at $83,819, but the main upside risk comes from chase-buying after ETH breaks above $2,689. If inflows fall below $50 million per day next week, this view is invalid.
This article has no sponsorship from any project. The author does not hold any of the assets mentioned.
$BTC $ETH #BTC #ETH
⚠️ Not investment advice; forecasts are for reference only
#SpotBitcoinETFsInflow$2.31BInFourDays
📰 BlackRock pushes $191.65M into BTC ETF inflows—why the bears’ pullback bets failed?
On Thursday, U.S. crypto ETF flows surged significantly. Bitcoin ETFs saw net inflows of $191.65 million, marking the sixth consecutive day of gains. Other products—such as Ethereum, Solana, and Ripple—also attracted capital, while the Zcash ETF remained flat for two straight days. Ongoing institutional buying of BTC ETFs signals strong demand.
Why is this news important?
BlackRock-led inflows suggest that the world’s largest asset manager has shifted from observing to taking a clearly bullish stance on the crypto market. The $191.65 million inflow set a record, and six straight bullish sessions indicate this is trend-driven capital. It means: 1) institutional investors are starting to include crypto assets in long-term allocation rather than treating them as short-term speculation; 2) market uncertainty around regulation (such as the SEC’s stance) appears to have been digested, with capital focusing more on the underlying asset value. Compared with the ETF applications that cooled off in March, this indicates the industry has moved past its darkest moment.
Market impact
For BTC, six straight days of inflows should help support the $83,819 level. ETH’s 1.09% rise in parallel shows that smaller-cap coins also benefit. In the short term, bulls may hold the upper hand, but watch for the explosive rallies in SOL/XRP, which could siphon some capital. Historically, when ETF inflows persist, BTC has been able to hold at least for two weeks. That suggests this rebound may last until at least next Friday. However, if inflows slow or profit-taking emerges, upside momentum will fade.
Trading idea
💡 BTC has strong support at $83,819, but the main upside risk comes from chase-buying after ETH breaks above $2,689. If inflows fall below $50 million per day next week, this view is invalid.
This article has no sponsorship from any project. The author does not hold any of the assets mentioned.
$BTC $ETH #BTC #ETH
⚠️ Not investment advice; forecasts are for reference only
#SpotBitcoinETFsInflow$2.31BInFourDays
On Thursday, U.S. crypto ETF flows surged significantly. Bitcoin ETFs saw net inflows of $191.65 million, marking the sixth consecutive day of gains. Other products—such as Ethereum, Solana, and Ripple—also attracted capital, while the Zcash ETF remained flat for two straight days. Ongoing institutional buying of BTC ETFs signals strong demand.
Why is this news important?
BlackRock-led inflows suggest that the world’s largest asset manager has shifted from observing to taking a clearly bullish stance on the crypto market. The $191.65 million inflow set a record, and six straight bullish sessions indicate this is trend-driven capital. It means: 1) institutional investors are starting to include crypto assets in long-term allocation rather than treating them as short-term speculation; 2) market uncertainty around regulation (such as the SEC’s stance) appears to have been digested, with capital focusing more on the underlying asset value. Compared with the ETF applications that cooled off in March, this indicates the industry has moved past its darkest moment.
Market impact
For BTC, six straight days of inflows should help support the $83,819 level. ETH’s 1.09% rise in parallel shows that smaller-cap coins also benefit. In the short term, bulls may hold the upper hand, but watch for the explosive rallies in SOL/XRP, which could siphon some capital. Historically, when ETF inflows persist, BTC has been able to hold at least for two weeks. That suggests this rebound may last until at least next Friday. However, if inflows slow or profit-taking emerges, upside momentum will fade.
Trading idea
💡 BTC has strong support at $83,819, but the main upside risk comes from chase-buying after ETH breaks above $2,689. If inflows fall below $50 million per day next week, this view is invalid.
This article has no sponsorship from any project. The author does not hold any of the assets mentioned.
$BTC $ETH #BTC #ETH
⚠️ Not investment advice; forecasts are for reference only
#SpotBitcoinETFsInflow$2.31BInFourDays



582
·
--
📰 ETF狂买63亿,为什么比特币还能在84K徘徊?
On September 24, U.S. Eastern Time, the total net inflow into spot Bitcoin ETFs was $191 million. BlackRock’s IBIT pulled in $163 million in a single day, bringing its cumulative total to a surge of $65.1 billion; Fidelity’s FBTC also saw inflows of $12.86 million, with a cumulative $11.1 billion. While WisdomTree’s BTCW had a net outflow of $4.016 million, its cumulative amount still added up to $786.5 million in gains. At Bitcoin’s current level of $84.2K, is this round of capital inflows a last spurt or a new beginning?
Why is this news important?
At its core, it reflects two layers of contradictions. First, institutional capital is continuously competing for Bitcoin—this “tangible asset”—which is entirely different from the ETF capital game in traditional finance. For example, the daily inflows of a heavyweight player like BlackRock’s IBIT are enough to buy the market capitalization of the entire FTSE 100. Second, Bitcoin’s price performance is severely out of sync with the pace at which its ETFs are absorbing inflows. At $84K, cumulative inflows total only $74.5 billion, far below the ETF inflow scale of the S&P 500, which stands at $1.8 trillion. This suggests that, in the eyes of institutions, Bitcoin is still a “low-priced asset,” while the market is betting at a 300:1 premium that it can break through this bottleneck.
Impact on the market
In the short term, sustained ETF inflows will keep supporting BTC. Around $84.2K is a key zone where net ETF inflows exceed outflows. As long as this logic holds, the room for downside should be limited. But what does that mean? It means that unless ETFs “blow up,” Bitcoin’s range-bound consolidation could likely continue until the end of the year. Historically, whenever the spot ETF’s weekly net inflow exceeds $50 million, the probability of Bitcoin rising next week is 70%. This time, the inflow volume is double the weekly average, and the odds of Bitcoin holding above $84K within a 12-hour window are extremely high.
💡 I’m bullish on the $84–87K range. If Bitcoin falls below $82.5K, the narrative of institutional ETF inflows would collapse—because BlackRock’s most recent large-scale outflow happened in June 2019, when BTC was also trading below $80K.
【Judgment: invalidation conditions included】If next week the Fed hints at reducing QE, this judgment is invalid.
This article has no sponsorship from any project, and the author does not hold any of the assets mentioned.
Source: Binance Square
$BTC $ETH #BTC #ETH
⚠️ Not investment advice; predictions are for reference only
#SpotBitcoinETFsInflow$2.31BInFourDays
📰 ETF狂买63亿,为什么比特币还能在84K徘徊?
On September 24, U.S. Eastern Time, the total net inflow into spot Bitcoin ETFs was $191 million. BlackRock’s IBIT pulled in $163 million in a single day, bringing its cumulative total to a surge of $65.1 billion; Fidelity’s FBTC also saw inflows of $12.86 million, with a cumulative $11.1 billion. While WisdomTree’s BTCW had a net outflow of $4.016 million, its cumulative amount still added up to $786.5 million in gains. At Bitcoin’s current level of $84.2K, is this round of capital inflows a last spurt or a new beginning?
Why is this news important?
At its core, it reflects two layers of contradictions. First, institutional capital is continuously competing for Bitcoin—this “tangible asset”—which is entirely different from the ETF capital game in traditional finance. For example, the daily inflows of a heavyweight player like BlackRock’s IBIT are enough to buy the market capitalization of the entire FTSE 100. Second, Bitcoin’s price performance is severely out of sync with the pace at which its ETFs are absorbing inflows. At $84K, cumulative inflows total only $74.5 billion, far below the ETF inflow scale of the S&P 500, which stands at $1.8 trillion. This suggests that, in the eyes of institutions, Bitcoin is still a “low-priced asset,” while the market is betting at a 300:1 premium that it can break through this bottleneck.
Impact on the market
In the short term, sustained ETF inflows will keep supporting BTC. Around $84.2K is a key zone where net ETF inflows exceed outflows. As long as this logic holds, the room for downside should be limited. But what does that mean? It means that unless ETFs “blow up,” Bitcoin’s range-bound consolidation could likely continue until the end of the year. Historically, whenever the spot ETF’s weekly net inflow exceeds $50 million, the probability of Bitcoin rising next week is 70%. This time, the inflow volume is double the weekly average, and the odds of Bitcoin holding above $84K within a 12-hour window are extremely high.
💡 I’m bullish on the $84–87K range. If Bitcoin falls below $82.5K, the narrative of institutional ETF inflows would collapse—because BlackRock’s most recent large-scale outflow happened in June 2019, when BTC was also trading below $80K.
【Judgment: invalidation conditions included】If next week the Fed hints at reducing QE, this judgment is invalid.
This article has no sponsorship from any project, and the author does not hold any of the assets mentioned.
Source: Binance Square
$BTC $ETH #BTC #ETH
⚠️ Not investment advice; predictions are for reference only
#SpotBitcoinETFsInflow$2.31BInFourDays
On September 24, U.S. Eastern Time, the total net inflow into spot Bitcoin ETFs was $191 million. BlackRock’s IBIT pulled in $163 million in a single day, bringing its cumulative total to a surge of $65.1 billion; Fidelity’s FBTC also saw inflows of $12.86 million, with a cumulative $11.1 billion. While WisdomTree’s BTCW had a net outflow of $4.016 million, its cumulative amount still added up to $786.5 million in gains. At Bitcoin’s current level of $84.2K, is this round of capital inflows a last spurt or a new beginning?
Why is this news important?
At its core, it reflects two layers of contradictions. First, institutional capital is continuously competing for Bitcoin—this “tangible asset”—which is entirely different from the ETF capital game in traditional finance. For example, the daily inflows of a heavyweight player like BlackRock’s IBIT are enough to buy the market capitalization of the entire FTSE 100. Second, Bitcoin’s price performance is severely out of sync with the pace at which its ETFs are absorbing inflows. At $84K, cumulative inflows total only $74.5 billion, far below the ETF inflow scale of the S&P 500, which stands at $1.8 trillion. This suggests that, in the eyes of institutions, Bitcoin is still a “low-priced asset,” while the market is betting at a 300:1 premium that it can break through this bottleneck.
Impact on the market
In the short term, sustained ETF inflows will keep supporting BTC. Around $84.2K is a key zone where net ETF inflows exceed outflows. As long as this logic holds, the room for downside should be limited. But what does that mean? It means that unless ETFs “blow up,” Bitcoin’s range-bound consolidation could likely continue until the end of the year. Historically, whenever the spot ETF’s weekly net inflow exceeds $50 million, the probability of Bitcoin rising next week is 70%. This time, the inflow volume is double the weekly average, and the odds of Bitcoin holding above $84K within a 12-hour window are extremely high.
💡 I’m bullish on the $84–87K range. If Bitcoin falls below $82.5K, the narrative of institutional ETF inflows would collapse—because BlackRock’s most recent large-scale outflow happened in June 2019, when BTC was also trading below $80K.
【Judgment: invalidation conditions included】If next week the Fed hints at reducing QE, this judgment is invalid.
This article has no sponsorship from any project, and the author does not hold any of the assets mentioned.
Source: Binance Square
$BTC $ETH #BTC #ETH
⚠️ Not investment advice; predictions are for reference only
#SpotBitcoinETFsInflow$2.31BInFourDays


1

·
--
Hot list says four-day ETF inflows $2.31B|Recalculate the ‘one-size-fits-all’ table criteria|BTC at $84,200—I’ll wait first
My stance is cautiously bullish, but I won’t directly translate ETF net inflows into a “chase at this moment” order. The Binance Square hot topics read “Four days inflow of $2.31B,” and that’s definitely worth discussing; the key issue is that the统计 window and the update timing must be clarified first. Farside’s daily table for U.S. spot Bitcoin ETFs shows net inflows of $0.999B on Sep 21, $0.7147B on Sep 22, and $0.3469B on Sep 23—three days totaling $2.0606B. If you then include Sep 18’s $0.433B, four trading days total $2.4936B. At least based on the dates and methodology visible in this table right now, I can’t treat the hot-list $2.31B as the confirmed same-window figure. The line for Sep 24 hasn’t yet appeared with a full total; you can’t write the missing report as net outflow for that day, and you can’t back-calculate today’s trading using data that will be updated later.
The market reaction also doesn’t provide a simple answer of “funds inflow ⇒ spot must rally.” When I wrote this, KuCoin BTC/USDT was around $84,220, with a 24-hour high of $84,923 and a low of $82,868—about -0.45% change. Price is still within its range; it hasn’t reclaimed the high yet based on the ETF’s positive net inflows from the previous few days. ETF subscription/redemption statistics are usually reported later than intraday prices. Meanwhile, secondary-market buying/selling, market-maker hedging, futures leverage unwinding, and macro interest rates can all push the coin price in opposite directions within the same period. Inflow indicates there’s net demand through that channel, but it doesn’t mean every single dollar immediately becomes an active buy on the current candlestick. What I care more about is whether the subsequently published complete Sep 24 data continues the trend, and whether BTC can hold above the upper end of the range without an急拉 driven by leverage.
On key levels: around 84,900 is the 24-hour high for this round. First, watch whether the full sequence of 15-minute candles can close continuously above 85,000. Then, watch whether the pullback from 84,700–85,000 holds. Below that, 83,800 is my short-term observation line, and 82,868 is the day’s low. If the later complete ETF data weakens, or if BTC first breaks below the low, my cautiously bullish judgment will be invalidated. Even if it breaks out, you still need to guard against a fake breakout fueled only by outdated fund-flow data—don’t cancel your stop loss just because you saw an inflow headline.
If this were my own trading: I’m currently flat with zero position. I won’t chase a rally within the current range, and I won’t use high leverage. I’ll only consider trying spot longs. Only if two consecutive full 15-minute closes are above 85,000, and then a subsequent pullback to 84,700–85,000 does not break, I would enter using at most 0.3% of total funds. If price reaches 85,600, I’ll cut the position in half; around 86,400 I’ll close the remaining position. If, after entering, a 15-minute close falls back below 84,300, I’ll cut the remaining position by half first. If it touches 83,800, I’ll stop out and close everything. If before my entry trigger price breaks below 82,868, I cancel the whole long plan and keep waiting rather than betting on a short reversal. The position size is small because the time lag between the data and the price hasn’t disappeared—not because I’m sure this segment will necessarily rise.
#SpotBitcoinETFsInflow$2.31BInFourDays #BTC
The above is only my personal market observation and does not constitute investment advice.
Hot list says four-day ETF inflows $2.31B|Recalculate the ‘one-size-fits-all’ table criteria|BTC at $84,200—I’ll wait first
My stance is cautiously bullish, but I won’t directly translate ETF net inflows into a “chase at this moment” order. The Binance Square hot topics read “Four days inflow of $2.31B,” and that’s definitely worth discussing; the key issue is that the统计 window and the update timing must be clarified first. Farside’s daily table for U.S. spot Bitcoin ETFs shows net inflows of $0.999B on Sep 21, $0.7147B on Sep 22, and $0.3469B on Sep 23—three days totaling $2.0606B. If you then include Sep 18’s $0.433B, four trading days total $2.4936B. At least based on the dates and methodology visible in this table right now, I can’t treat the hot-list $2.31B as the confirmed same-window figure. The line for Sep 24 hasn’t yet appeared with a full total; you can’t write the missing report as net outflow for that day, and you can’t back-calculate today’s trading using data that will be updated later.
The market reaction also doesn’t provide a simple answer of “funds inflow ⇒ spot must rally.” When I wrote this, KuCoin BTC/USDT was around $84,220, with a 24-hour high of $84,923 and a low of $82,868—about -0.45% change. Price is still within its range; it hasn’t reclaimed the high yet based on the ETF’s positive net inflows from the previous few days. ETF subscription/redemption statistics are usually reported later than intraday prices. Meanwhile, secondary-market buying/selling, market-maker hedging, futures leverage unwinding, and macro interest rates can all push the coin price in opposite directions within the same period. Inflow indicates there’s net demand through that channel, but it doesn’t mean every single dollar immediately becomes an active buy on the current candlestick. What I care more about is whether the subsequently published complete Sep 24 data continues the trend, and whether BTC can hold above the upper end of the range without an急拉 driven by leverage.
On key levels: around 84,900 is the 24-hour high for this round. First, watch whether the full sequence of 15-minute candles can close continuously above 85,000. Then, watch whether the pullback from 84,700–85,000 holds. Below that, 83,800 is my short-term observation line, and 82,868 is the day’s low. If the later complete ETF data weakens, or if BTC first breaks below the low, my cautiously bullish judgment will be invalidated. Even if it breaks out, you still need to guard against a fake breakout fueled only by outdated fund-flow data—don’t cancel your stop loss just because you saw an inflow headline.
If this were my own trading: I’m currently flat with zero position. I won’t chase a rally within the current range, and I won’t use high leverage. I’ll only consider trying spot longs. Only if two consecutive full 15-minute closes are above 85,000, and then a subsequent pullback to 84,700–85,000 does not break, I would enter using at most 0.3% of total funds. If price reaches 85,600, I’ll cut the position in half; around 86,400 I’ll close the remaining position. If, after entering, a 15-minute close falls back below 84,300, I’ll cut the remaining position by half first. If it touches 83,800, I’ll stop out and close everything. If before my entry trigger price breaks below 82,868, I cancel the whole long plan and keep waiting rather than betting on a short reversal. The position size is small because the time lag between the data and the price hasn’t disappeared—not because I’m sure this segment will necessarily rise.
#SpotBitcoinETFsInflow$2.31BInFourDays #BTC
The above is only my personal market observation and does not constitute investment advice.
My stance is cautiously bullish, but I won’t directly translate ETF net inflows into a “chase at this moment” order. The Binance Square hot topics read “Four days inflow of $2.31B,” and that’s definitely worth discussing; the key issue is that the统计 window and the update timing must be clarified first. Farside’s daily table for U.S. spot Bitcoin ETFs shows net inflows of $0.999B on Sep 21, $0.7147B on Sep 22, and $0.3469B on Sep 23—three days totaling $2.0606B. If you then include Sep 18’s $0.433B, four trading days total $2.4936B. At least based on the dates and methodology visible in this table right now, I can’t treat the hot-list $2.31B as the confirmed same-window figure. The line for Sep 24 hasn’t yet appeared with a full total; you can’t write the missing report as net outflow for that day, and you can’t back-calculate today’s trading using data that will be updated later.
The market reaction also doesn’t provide a simple answer of “funds inflow ⇒ spot must rally.” When I wrote this, KuCoin BTC/USDT was around $84,220, with a 24-hour high of $84,923 and a low of $82,868—about -0.45% change. Price is still within its range; it hasn’t reclaimed the high yet based on the ETF’s positive net inflows from the previous few days. ETF subscription/redemption statistics are usually reported later than intraday prices. Meanwhile, secondary-market buying/selling, market-maker hedging, futures leverage unwinding, and macro interest rates can all push the coin price in opposite directions within the same period. Inflow indicates there’s net demand through that channel, but it doesn’t mean every single dollar immediately becomes an active buy on the current candlestick. What I care more about is whether the subsequently published complete Sep 24 data continues the trend, and whether BTC can hold above the upper end of the range without an急拉 driven by leverage.
On key levels: around 84,900 is the 24-hour high for this round. First, watch whether the full sequence of 15-minute candles can close continuously above 85,000. Then, watch whether the pullback from 84,700–85,000 holds. Below that, 83,800 is my short-term observation line, and 82,868 is the day’s low. If the later complete ETF data weakens, or if BTC first breaks below the low, my cautiously bullish judgment will be invalidated. Even if it breaks out, you still need to guard against a fake breakout fueled only by outdated fund-flow data—don’t cancel your stop loss just because you saw an inflow headline.
If this were my own trading: I’m currently flat with zero position. I won’t chase a rally within the current range, and I won’t use high leverage. I’ll only consider trying spot longs. Only if two consecutive full 15-minute closes are above 85,000, and then a subsequent pullback to 84,700–85,000 does not break, I would enter using at most 0.3% of total funds. If price reaches 85,600, I’ll cut the position in half; around 86,400 I’ll close the remaining position. If, after entering, a 15-minute close falls back below 84,300, I’ll cut the remaining position by half first. If it touches 83,800, I’ll stop out and close everything. If before my entry trigger price breaks below 82,868, I cancel the whole long plan and keep waiting rather than betting on a short reversal. The position size is small because the time lag between the data and the price hasn’t disappeared—not because I’m sure this segment will necessarily rise.
#SpotBitcoinETFsInflow$2.31BInFourDays #BTC
The above is only my personal market observation and does not constitute investment advice.

10
·
--
Four-day ETF net inflows of about $2.306 billion|BTC price still below this week’s high|84200… wait for the funds and price to move in the same direction
My attitude is to acknowledge institutional demand, but I don’t take the four-day total as proof that buying pressure is still ongoing right now. On Binance Square, there’s a trending topic: #SpotBitcoinETFsInflow$2.31BInFourDays. Cross-check Farside’s U.S. spot Bitcoin ETF fund flows day by day: on Sept. 17 net inflows were about $159.5 million; on the 18th about $433.0 million; on the 21st about $999.0 million; on the 22nd about $714.7 million. Summed over four trading days, that equals $2.3062 billion, which rounds to roughly $2.31 billion. This is the historical cumulative total as of the 22nd—not today’s net subscription of $2.31 billion, and certainly not a single direct order hitting the spot order book.
As for the 23rd, the listed company currently only shows partial fund data; the table’s automatic subtotal is about $32.40 million. Funds like IBIT, FBTC, and others still have missing entries. You can’t use an incomplete subtotal to prove that money has suddenly dried up, and you also can’t mechanically extrapolate the strong four-day inflows to today.
Why do fund flows matter? Spot ETF subscriptions and redemptions flow through authorized participants, market makers, and custodial arrangements, which influence spot supply and demand. Large net inflows over multiple consecutive days can strengthen expectations for mid-term absorption. But the net inflow statistics are collected by end-of-trading-day accounting. Changes in fund shares, hedging, and spot execution are not necessarily equivalent to a one-to-one buy at the same time. Especially when macro yields, the U.S. dollar, and derivative positions are moving as well, price can temporarily diverge from fund flow.
Interpreting “there is an institutional entry” as “price can only go up” can obscure the entry location and risk budgeting.
The market’s current reaction does not support chasing. When checking KuCoin’s public BTC/USDT spot statistics, the quoted price is about $84,189.7. Over the past 24 hours: high $86,614, low $83,517.1, with a 24-hour change of about -2.72%. This is not a denial of fund demand; it just indicates that overhead selling pressure and the influence of other capital are still present. The area around 83,500 is a low already seen. 85,000 is the first threshold I’m watching for repair. Around 86,600 is the 24-hour high. If later the complete ETF data clearly shifts to net redemptions, and BTC once again loses 83,500, then my absorption judgment would be invalidated. If the dataset is completed and remains net inflow, while the price also regains 86,600 on expanding volume, only then would the resonance between funds and price be more credible. If neither set of conditions appears, the hot-board numbers alone are not enough for me to place an order.
If I were trading myself: I would not participate now. Direction is neutral, position size 0%, and I wouldn’t use high leverage. I would only buy spot with at most 0.4% of total capital if and only if: (1) the 23rd fund details are fully filled in and there is no clear net redemption; (2) BTC prints two consecutive complete 15-minute candlesticks closing above 85,000; and (3) when it retraces to 84,600–85,000, it holds there. First target: 85,800–86,200; take profit at the halving point. Second target: 86,600–87,000; close out when reached. After entry, if a 15-minute candle closes below 84,400, I would first cut half the remaining position. If BTC breaks below 83,500, I would stop out and close the entire position. If 83,500 is broken before the conditions are met, the long plan is cancelled. If the data keeps missing, I’ll continue waiting and won’t write an untriggered plan as if it has already been executed.
#SpotBitcoinETFsInflow$2.31BInFourDays #BTC
The above is only my personal market observation and does not constitute investment advice.
Four-day ETF net inflows of about $2.306 billion|BTC price still below this week’s high|84200… wait for the funds and price to move in the same direction
My attitude is to acknowledge institutional demand, but I don’t take the four-day total as proof that buying pressure is still ongoing right now. On Binance Square, there’s a trending topic: #SpotBitcoinETFsInflow$2.31BInFourDays. Cross-check Farside’s U.S. spot Bitcoin ETF fund flows day by day: on Sept. 17 net inflows were about $159.5 million; on the 18th about $433.0 million; on the 21st about $999.0 million; on the 22nd about $714.7 million. Summed over four trading days, that equals $2.3062 billion, which rounds to roughly $2.31 billion. This is the historical cumulative total as of the 22nd—not today’s net subscription of $2.31 billion, and certainly not a single direct order hitting the spot order book.
As for the 23rd, the listed company currently only shows partial fund data; the table’s automatic subtotal is about $32.40 million. Funds like IBIT, FBTC, and others still have missing entries. You can’t use an incomplete subtotal to prove that money has suddenly dried up, and you also can’t mechanically extrapolate the strong four-day inflows to today.
Why do fund flows matter? Spot ETF subscriptions and redemptions flow through authorized participants, market makers, and custodial arrangements, which influence spot supply and demand. Large net inflows over multiple consecutive days can strengthen expectations for mid-term absorption. But the net inflow statistics are collected by end-of-trading-day accounting. Changes in fund shares, hedging, and spot execution are not necessarily equivalent to a one-to-one buy at the same time. Especially when macro yields, the U.S. dollar, and derivative positions are moving as well, price can temporarily diverge from fund flow.
Interpreting “there is an institutional entry” as “price can only go up” can obscure the entry location and risk budgeting.
The market’s current reaction does not support chasing. When checking KuCoin’s public BTC/USDT spot statistics, the quoted price is about $84,189.7. Over the past 24 hours: high $86,614, low $83,517.1, with a 24-hour change of about -2.72%. This is not a denial of fund demand; it just indicates that overhead selling pressure and the influence of other capital are still present. The area around 83,500 is a low already seen. 85,000 is the first threshold I’m watching for repair. Around 86,600 is the 24-hour high. If later the complete ETF data clearly shifts to net redemptions, and BTC once again loses 83,500, then my absorption judgment would be invalidated. If the dataset is completed and remains net inflow, while the price also regains 86,600 on expanding volume, only then would the resonance between funds and price be more credible. If neither set of conditions appears, the hot-board numbers alone are not enough for me to place an order.
If I were trading myself: I would not participate now. Direction is neutral, position size 0%, and I wouldn’t use high leverage. I would only buy spot with at most 0.4% of total capital if and only if: (1) the 23rd fund details are fully filled in and there is no clear net redemption; (2) BTC prints two consecutive complete 15-minute candlesticks closing above 85,000; and (3) when it retraces to 84,600–85,000, it holds there. First target: 85,800–86,200; take profit at the halving point. Second target: 86,600–87,000; close out when reached. After entry, if a 15-minute candle closes below 84,400, I would first cut half the remaining position. If BTC breaks below 83,500, I would stop out and close the entire position. If 83,500 is broken before the conditions are met, the long plan is cancelled. If the data keeps missing, I’ll continue waiting and won’t write an untriggered plan as if it has already been executed.
#SpotBitcoinETFsInflow$2.31BInFourDays #BTC
The above is only my personal market observation and does not constitute investment advice.
My attitude is to acknowledge institutional demand, but I don’t take the four-day total as proof that buying pressure is still ongoing right now. On Binance Square, there’s a trending topic: #SpotBitcoinETFsInflow$2.31BInFourDays. Cross-check Farside’s U.S. spot Bitcoin ETF fund flows day by day: on Sept. 17 net inflows were about $159.5 million; on the 18th about $433.0 million; on the 21st about $999.0 million; on the 22nd about $714.7 million. Summed over four trading days, that equals $2.3062 billion, which rounds to roughly $2.31 billion. This is the historical cumulative total as of the 22nd—not today’s net subscription of $2.31 billion, and certainly not a single direct order hitting the spot order book.
As for the 23rd, the listed company currently only shows partial fund data; the table’s automatic subtotal is about $32.40 million. Funds like IBIT, FBTC, and others still have missing entries. You can’t use an incomplete subtotal to prove that money has suddenly dried up, and you also can’t mechanically extrapolate the strong four-day inflows to today.
Why do fund flows matter? Spot ETF subscriptions and redemptions flow through authorized participants, market makers, and custodial arrangements, which influence spot supply and demand. Large net inflows over multiple consecutive days can strengthen expectations for mid-term absorption. But the net inflow statistics are collected by end-of-trading-day accounting. Changes in fund shares, hedging, and spot execution are not necessarily equivalent to a one-to-one buy at the same time. Especially when macro yields, the U.S. dollar, and derivative positions are moving as well, price can temporarily diverge from fund flow.
Interpreting “there is an institutional entry” as “price can only go up” can obscure the entry location and risk budgeting.
The market’s current reaction does not support chasing. When checking KuCoin’s public BTC/USDT spot statistics, the quoted price is about $84,189.7. Over the past 24 hours: high $86,614, low $83,517.1, with a 24-hour change of about -2.72%. This is not a denial of fund demand; it just indicates that overhead selling pressure and the influence of other capital are still present. The area around 83,500 is a low already seen. 85,000 is the first threshold I’m watching for repair. Around 86,600 is the 24-hour high. If later the complete ETF data clearly shifts to net redemptions, and BTC once again loses 83,500, then my absorption judgment would be invalidated. If the dataset is completed and remains net inflow, while the price also regains 86,600 on expanding volume, only then would the resonance between funds and price be more credible. If neither set of conditions appears, the hot-board numbers alone are not enough for me to place an order.
If I were trading myself: I would not participate now. Direction is neutral, position size 0%, and I wouldn’t use high leverage. I would only buy spot with at most 0.4% of total capital if and only if: (1) the 23rd fund details are fully filled in and there is no clear net redemption; (2) BTC prints two consecutive complete 15-minute candlesticks closing above 85,000; and (3) when it retraces to 84,600–85,000, it holds there. First target: 85,800–86,200; take profit at the halving point. Second target: 86,600–87,000; close out when reached. After entry, if a 15-minute candle closes below 84,400, I would first cut half the remaining position. If BTC breaks below 83,500, I would stop out and close the entire position. If 83,500 is broken before the conditions are met, the long plan is cancelled. If the data keeps missing, I’ll continue waiting and won’t write an untriggered plan as if it has already been executed.
#SpotBitcoinETFsInflow$2.31BInFourDays #BTC
The above is only my personal market observation and does not constitute investment advice.

5
·
--
Latest news shows that spot Bitcoin ETFs saw capital inflows of $23.1 billion in just four days, setting a historic high. This figure reflects a significant increase in investors’ confidence in the cryptocurrency market. According to CoinShares data, in the past week alone, total global crypto market inflows amounted to $12.7 billion, with Bitcoin ETFs contributing the vast majority. In addition, according to a Glassnode report, more than $15 billion worth of Bitcoin ETF capital has already recorded net inflows into the market. This trend indicates that traditional financial investors are gradually turning their attention to the cryptocurrency space, with Bitcoin’s value-storing asset characteristics becoming increasingly recognized. #SpotBitcoinETFsInflow
#BTC $BTC
Latest news shows that spot Bitcoin ETFs saw capital inflows of $23.1 billion in just four days, setting a historic high. This figure reflects a significant increase in investors’ confidence in the cryptocurrency market. According to CoinShares data, in the past week alone, total global crypto market inflows amounted to $12.7 billion, with Bitcoin ETFs contributing the vast majority. In addition, according to a Glassnode report, more than $15 billion worth of Bitcoin ETF capital has already recorded net inflows into the market. This trend indicates that traditional financial investors are gradually turning their attention to the cryptocurrency space, with Bitcoin’s value-storing asset characteristics becoming increasingly recognized. #SpotBitcoinETFsInflow
#BTC $BTC
#BTC $BTC
96
·
--
Have you noticed that $BTC just got rejected at a key level and greed is still sitting at 73 like the tape did not just change?
That is how traders get trapped. You buy the breakout, the wick prints, and then you sit in red while everyone insists it is a healthy pullback and you should add.
This rejection is a case study, not another wick to ignore. Spot Bitcoin ETF inflows have been the bull argument for months, but they do not override a dollar index reclaiming 101 or yields that have not been this high in nearly two decades. When those two hit at the same time as a failed break, the market is not being subtle.
The mainstream story is that the trend is intact. Fine. Greed at 73 after a failed level is still how late longs get trapped, and $USDT demand picking up in that window is a rotation, not a green light. $AAVE and the rest of the beta complex do not decouple when Bitcoin fails. They follow.
Where do you think this goes from here if that rejection holds?
#BitcoinRejectedAt #SpotBitcoinETFsInflow #DollarIndexReclaims101
Have you noticed that $BTC just got rejected at a key level and greed is still sitting at 73 like the tape did not just change?
That is how traders get trapped. You buy the breakout, the wick prints, and then you sit in red while everyone insists it is a healthy pullback and you should add.
This rejection is a case study, not another wick to ignore. Spot Bitcoin ETF inflows have been the bull argument for months, but they do not override a dollar index reclaiming 101 or yields that have not been this high in nearly two decades. When those two hit at the same time as a failed break, the market is not being subtle.
The mainstream story is that the trend is intact. Fine. Greed at 73 after a failed level is still how late longs get trapped, and $USDT demand picking up in that window is a rotation, not a green light. $AAVE and the rest of the beta complex do not decouple when Bitcoin fails. They follow.
Where do you think this goes from here if that rejection holds?
#BitcoinRejectedAt #SpotBitcoinETFsInflow #DollarIndexReclaims101
That is how traders get trapped. You buy the breakout, the wick prints, and then you sit in red while everyone insists it is a healthy pullback and you should add.
This rejection is a case study, not another wick to ignore. Spot Bitcoin ETF inflows have been the bull argument for months, but they do not override a dollar index reclaiming 101 or yields that have not been this high in nearly two decades. When those two hit at the same time as a failed break, the market is not being subtle.
The mainstream story is that the trend is intact. Fine. Greed at 73 after a failed level is still how late longs get trapped, and $USDT demand picking up in that window is a rotation, not a green light. $AAVE and the rest of the beta complex do not decouple when Bitcoin fails. They follow.
Where do you think this goes from here if that rejection holds?
#BitcoinRejectedAt #SpotBitcoinETFsInflow #DollarIndexReclaims101

27
Here's what happened when $BTC tagged resistance last week and most traders treated a wick as confirmation.
The pain isn't the rejection itself. It's buying the fake breakout, refusing to rotate into $USDT, and averaging down because a greed reading of 73 still feels like momentum.
Look at the actual sequence. Price pushed into a level that has already rejected it more than once, ETF inflows got used as the reason it had to break, and then the move failed. That is not random. When the dollar starts reclaiming ground and positioning is still crowded long, late leverage is the first thing that gets taken out.
The part most people skipped is how the rest of risk followed. $AAVE did not hold up on its own. It faded with Bitcoin, which is usually the tell that this was a market-wide de-risk, not an isolated wick. Failed breakouts at this kind of level tend to create the next down-leg, not a healthy retest.
Where do you think this goes from here if buyers cannot reclaim that level?
#BitcoinRejectedAt #SpotBitcoinETFsInflow #DollarIndexReclaims101
Here's what happened when $BTC tagged resistance last week and most traders treated a wick as confirmation.
The pain isn't the rejection itself. It's buying the fake breakout, refusing to rotate into $USDT, and averaging down because a greed reading of 73 still feels like momentum.
Look at the actual sequence. Price pushed into a level that has already rejected it more than once, ETF inflows got used as the reason it had to break, and then the move failed. That is not random. When the dollar starts reclaiming ground and positioning is still crowded long, late leverage is the first thing that gets taken out.
The part most people skipped is how the rest of risk followed. $AAVE did not hold up on its own. It faded with Bitcoin, which is usually the tell that this was a market-wide de-risk, not an isolated wick. Failed breakouts at this kind of level tend to create the next down-leg, not a healthy retest.
Where do you think this goes from here if buyers cannot reclaim that level?
#BitcoinRejectedAt #SpotBitcoinETFsInflow #DollarIndexReclaims101
The pain isn't the rejection itself. It's buying the fake breakout, refusing to rotate into $USDT, and averaging down because a greed reading of 73 still feels like momentum.
Look at the actual sequence. Price pushed into a level that has already rejected it more than once, ETF inflows got used as the reason it had to break, and then the move failed. That is not random. When the dollar starts reclaiming ground and positioning is still crowded long, late leverage is the first thing that gets taken out.
The part most people skipped is how the rest of risk followed. $AAVE did not hold up on its own. It faded with Bitcoin, which is usually the tell that this was a market-wide de-risk, not an isolated wick. Failed breakouts at this kind of level tend to create the next down-leg, not a healthy retest.
Where do you think this goes from here if buyers cannot reclaim that level?
#BitcoinRejectedAt #SpotBitcoinETFsInflow #DollarIndexReclaims101

8
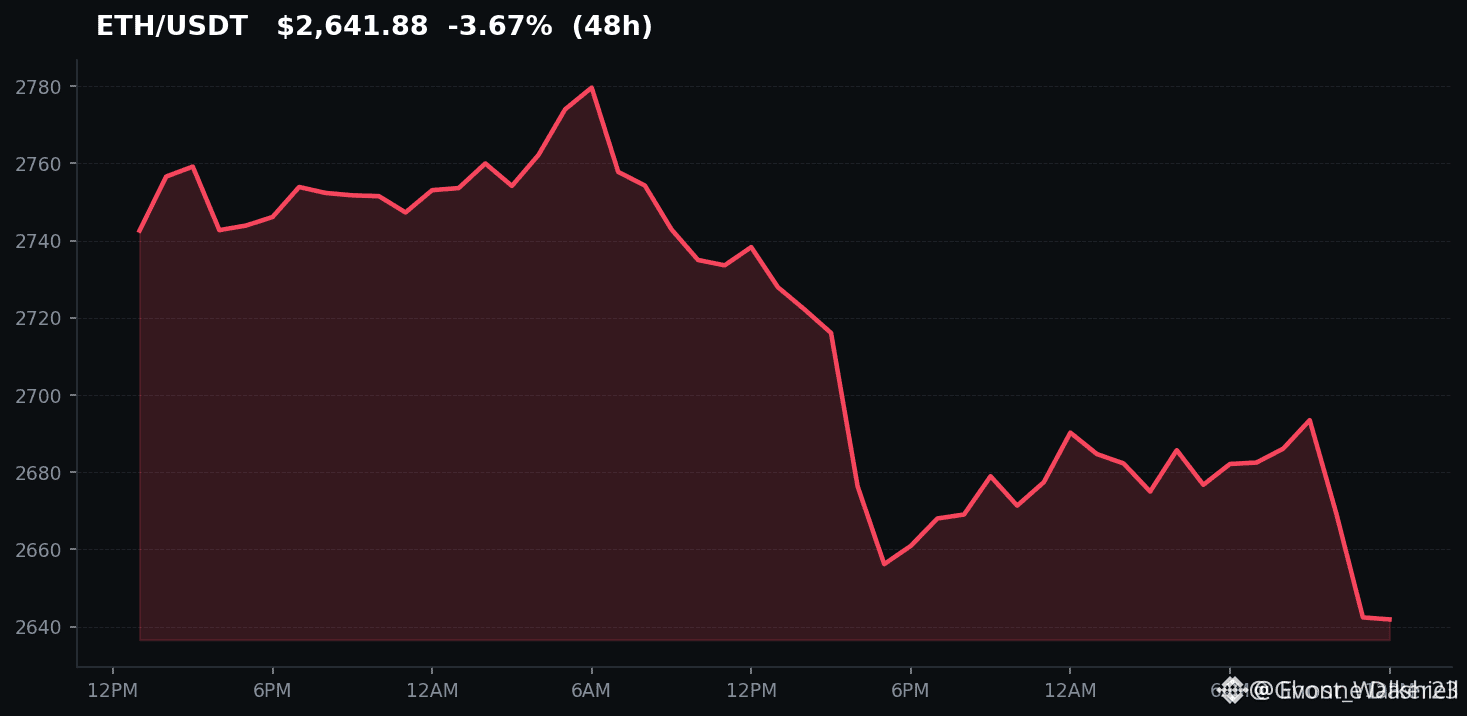
Here's what happened when Ethereum finally cleared the ceiling that had rejected it three times this year.
A lot of traders either bought the last two fakeouts and got wrecked, or they sat in $USDT waiting for a perfect signal and missed the actual break. That kind of timing pain is what this market loves to dish out.
This time the close above resistance actually held. Volume stayed in, and $ETH did not immediately dump the way it did in previous attempts. Compare that to $BTC, which keeps getting turned away at its own highs. We saw this exact rotation in 2021. Bitcoin ran first, then Ethereum caught the capital looking for the next leg. ETF inflows have already put a floor under the whole market, so the money has somewhere to go when it rotates.
Fear and greed sitting at 72 means people are already leaning long. Breakouts in that environment can run, but they also chew up anyone who chases the first green candles instead of waiting for the retest. Past ETH moves taught the same lesson. Size in after confirmation, not during the spike.
Where do you think this goes from here relative to Bitcoin?
#ETHBreaksAbove #SpotBitcoinETFsInflow #BitcoinRejectedAt
Here's what happened when Ethereum finally cleared the ceiling that had rejected it three times this year.
A lot of traders either bought the last two fakeouts and got wrecked, or they sat in $USDT waiting for a perfect signal and missed the actual break. That kind of timing pain is what this market loves to dish out.
This time the close above resistance actually held. Volume stayed in, and $ETH did not immediately dump the way it did in previous attempts. Compare that to $BTC , which keeps getting turned away at its own highs. We saw this exact rotation in 2021. Bitcoin ran first, then Ethereum caught the capital looking for the next leg. ETF inflows have already put a floor under the whole market, so the money has somewhere to go when it rotates.
Fear and greed sitting at 72 means people are already leaning long. Breakouts in that environment can run, but they also chew up anyone who chases the first green candles instead of waiting for the retest. Past ETH moves taught the same lesson. Size in after confirmation, not during the spike.
Where do you think this goes from here relative to Bitcoin?
#ETHBreaksAbove #SpotBitcoinETFsInflow #BitcoinRejectedAt
A lot of traders either bought the last two fakeouts and got wrecked, or they sat in $USDT waiting for a perfect signal and missed the actual break. That kind of timing pain is what this market loves to dish out.
This time the close above resistance actually held. Volume stayed in, and $ETH did not immediately dump the way it did in previous attempts. Compare that to $BTC , which keeps getting turned away at its own highs. We saw this exact rotation in 2021. Bitcoin ran first, then Ethereum caught the capital looking for the next leg. ETF inflows have already put a floor under the whole market, so the money has somewhere to go when it rotates.
Fear and greed sitting at 72 means people are already leaning long. Breakouts in that environment can run, but they also chew up anyone who chases the first green candles instead of waiting for the retest. Past ETH moves taught the same lesson. Size in after confirmation, not during the spike.
Where do you think this goes from here relative to Bitcoin?
#ETHBreaksAbove #SpotBitcoinETFsInflow #BitcoinRejectedAt
8
Have you noticed the US quietly planning to promote dollar stablecoins abroad while everyone obsesses over Bitcoin ETFs?
Traders keep getting wrecked by sudden regulatory news that tanks $USDT pairs. They scramble to exit positions they thought were safe in this greedy market.
This is a real-world case study in how governments co-opt innovation. $USDT already functions as the unofficial global dollar, especially in places with capital controls. Washington sees the volume and wants to bring it under official control, probably boosting compliant versions over the current setup.
The mainstream cheers this as more adoption. I see it as a slow squeeze on the permissionless part of crypto. With greed at these levels, a policy shift like this could dump DeFi tokens like $AAVE overnight as yields get regulated away.
Where do you think this goes from here for the dollar in crypto?
#USWeighsPromotingDollarStablecoinsAbroad #DollarIndexReclaims101 #SpotBitcoinETFsInflow
Have you noticed the US quietly planning to promote dollar stablecoins abroad while everyone obsesses over Bitcoin ETFs?
Traders keep getting wrecked by sudden regulatory news that tanks $USDT pairs. They scramble to exit positions they thought were safe in this greedy market.
This is a real-world case study in how governments co-opt innovation. $USDT already functions as the unofficial global dollar, especially in places with capital controls. Washington sees the volume and wants to bring it under official control, probably boosting compliant versions over the current setup.
The mainstream cheers this as more adoption. I see it as a slow squeeze on the permissionless part of crypto. With greed at these levels, a policy shift like this could dump DeFi tokens like $AAVE overnight as yields get regulated away.
Where do you think this goes from here for the dollar in crypto?
#USWeighsPromotingDollarStablecoinsAbroad #DollarIndexReclaims101 #SpotBitcoinETFsInflow
Traders keep getting wrecked by sudden regulatory news that tanks $USDT pairs. They scramble to exit positions they thought were safe in this greedy market.
This is a real-world case study in how governments co-opt innovation. $USDT already functions as the unofficial global dollar, especially in places with capital controls. Washington sees the volume and wants to bring it under official control, probably boosting compliant versions over the current setup.
The mainstream cheers this as more adoption. I see it as a slow squeeze on the permissionless part of crypto. With greed at these levels, a policy shift like this could dump DeFi tokens like $AAVE overnight as yields get regulated away.
Where do you think this goes from here for the dollar in crypto?
#USWeighsPromotingDollarStablecoinsAbroad #DollarIndexReclaims101 #SpotBitcoinETFsInflow

12
·
--
Have you noticed nobody is questioning whether this $ETH break above is just another fakeout dressed as a breakout?
The worst part is buying after the confirmation candle and then sitting through the dump back into range. That is how people keep losing money on moves they thought they finally timed right.
Look at Ethereum as a case study. The last few times it punched through a major level, greed was already high and the follow through never came. $USDT flooded in, volume spiked, and then the same sellers who waited at resistance took it back.
Fear and Greed is at 72 right now. $BTC already got rejected at the highs. This does not look like a clean trend start. It looks like the crowd getting excited at the exact moment they usually become exit liquidity.
The traders who actually caught $ETH runs bought the quiet periods, not the breakout headlines.
Where do you think this goes from here if greed stays elevated?
#ETHBreaksAbove #BitcoinRejectedAt #SpotBitcoinETFsInflow
Have you noticed nobody is questioning whether this $ETH break above is just another fakeout dressed as a breakout?
The worst part is buying after the confirmation candle and then sitting through the dump back into range. That is how people keep losing money on moves they thought they finally timed right.
Look at Ethereum as a case study. The last few times it punched through a major level, greed was already high and the follow through never came. $USDT flooded in, volume spiked, and then the same sellers who waited at resistance took it back.
Fear and Greed is at 72 right now. $BTC already got rejected at the highs. This does not look like a clean trend start. It looks like the crowd getting excited at the exact moment they usually become exit liquidity.
The traders who actually caught $ETH runs bought the quiet periods, not the breakout headlines.
Where do you think this goes from here if greed stays elevated?
#ETHBreaksAbove #BitcoinRejectedAt #SpotBitcoinETFsInflow
The worst part is buying after the confirmation candle and then sitting through the dump back into range. That is how people keep losing money on moves they thought they finally timed right.
Look at Ethereum as a case study. The last few times it punched through a major level, greed was already high and the follow through never came. $USDT flooded in, volume spiked, and then the same sellers who waited at resistance took it back.
Fear and Greed is at 72 right now. $BTC already got rejected at the highs. This does not look like a clean trend start. It looks like the crowd getting excited at the exact moment they usually become exit liquidity.
The traders who actually caught $ETH runs bought the quiet periods, not the breakout headlines.
Where do you think this goes from here if greed stays elevated?
#ETHBreaksAbove #BitcoinRejectedAt #SpotBitcoinETFsInflow

16
Everyone thinks a major listing like #BinanceWillListHyperliquid means guaranteed green candles right at launch, but actually, day-one market mechanics usually tell a completely different story.
Most retail traders end up losing money because they market-buy in the first five minutes of peak volatility and unintentionally become exit liquidity. It is painful watching hard-earned capital get chopped up before the order books even stabilize.
Think of a massive new listing like the opening rush at a flagship store sale. The crowd rushing the door creates immediate slippage, and market makers use that initial surge of $USDT liquidity to rebalance inventory before genuine price discovery even starts.
The most disciplined traders rarely chase the opening candle. Patiently watching the initial washouts, tracking real trading volume, and comparing market reactions to peers like $IO gives you clear structure instead of emotional guesswork.
Are you planning to trade the listing right at the opening bell or waiting for the first consolidation range to form?
#BinanceWillListHyperliquid #ETHBreaksAbove #SpotBitcoinETFsInflow
Everyone thinks a major listing like #BinanceWillListHyperliquid means guaranteed green candles right at launch, but actually, day-one market mechanics usually tell a completely different story.
Most retail traders end up losing money because they market-buy in the first five minutes of peak volatility and unintentionally become exit liquidity. It is painful watching hard-earned capital get chopped up before the order books even stabilize.
Think of a massive new listing like the opening rush at a flagship store sale. The crowd rushing the door creates immediate slippage, and market makers use that initial surge of $USDT liquidity to rebalance inventory before genuine price discovery even starts.
The most disciplined traders rarely chase the opening candle. Patiently watching the initial washouts, tracking real trading volume, and comparing market reactions to peers like $IO gives you clear structure instead of emotional guesswork.
Are you planning to trade the listing right at the opening bell or waiting for the first consolidation range to form?
#BinanceWillListHyperliquid #ETHBreaksAbove #SpotBitcoinETFsInflow
Most retail traders end up losing money because they market-buy in the first five minutes of peak volatility and unintentionally become exit liquidity. It is painful watching hard-earned capital get chopped up before the order books even stabilize.
Think of a massive new listing like the opening rush at a flagship store sale. The crowd rushing the door creates immediate slippage, and market makers use that initial surge of $USDT liquidity to rebalance inventory before genuine price discovery even starts.
The most disciplined traders rarely chase the opening candle. Patiently watching the initial washouts, tracking real trading volume, and comparing market reactions to peers like $IO gives you clear structure instead of emotional guesswork.
Are you planning to trade the listing right at the opening bell or waiting for the first consolidation range to form?
#BinanceWillListHyperliquid #ETHBreaksAbove #SpotBitcoinETFsInflow

5
·
--
Picture this: you spent months farming on-chain perps, watching your $USDT balance slowly grind upward, only to realize the real liquidity event was waiting for a tier-one centralized listing all along.
Most traders get caught in the trap of buying the announcement pump, chasing green candles right into peak exit liquidity because they failed to position beforehand.
Look at how the market reacted when tokens like $IO or dYdX hit major exchanges in past cycles. Early on-chain participants accumulated at a discount, while retail waited for exchange confirmations to jump in, often absorbing the initial sell pressure from airdrop claims. When rumors swirl around infrastructure plays like Hyperliquid, the playbook repeats itself almost to the letter.
What separates winning setups from pure exit liquidity is understanding where organic volume lives before centralized order books open up. When a decentralized protocol captures significant perp volume on its own, a listing acts less like a speculative spark and more like a bridge for sticky capital to finally enter at scale.
Are we looking at a classic buy-the-rumor event, or does the actual listing unlock sustainable open interest this time?
#BinanceWillListHyperliquid #SpotBitcoinETFsInflow #ETHBreaksAbove
Picture this: you spent months farming on-chain perps, watching your $USDT balance slowly grind upward, only to realize the real liquidity event was waiting for a tier-one centralized listing all along.
Most traders get caught in the trap of buying the announcement pump, chasing green candles right into peak exit liquidity because they failed to position beforehand.
Look at how the market reacted when tokens like $IO or dYdX hit major exchanges in past cycles. Early on-chain participants accumulated at a discount, while retail waited for exchange confirmations to jump in, often absorbing the initial sell pressure from airdrop claims. When rumors swirl around infrastructure plays like Hyperliquid, the playbook repeats itself almost to the letter.
What separates winning setups from pure exit liquidity is understanding where organic volume lives before centralized order books open up. When a decentralized protocol captures significant perp volume on its own, a listing acts less like a speculative spark and more like a bridge for sticky capital to finally enter at scale.
Are we looking at a classic buy-the-rumor event, or does the actual listing unlock sustainable open interest this time?
#BinanceWillListHyperliquid #SpotBitcoinETFsInflow #ETHBreaksAbove
Most traders get caught in the trap of buying the announcement pump, chasing green candles right into peak exit liquidity because they failed to position beforehand.
Look at how the market reacted when tokens like $IO or dYdX hit major exchanges in past cycles. Early on-chain participants accumulated at a discount, while retail waited for exchange confirmations to jump in, often absorbing the initial sell pressure from airdrop claims. When rumors swirl around infrastructure plays like Hyperliquid, the playbook repeats itself almost to the letter.
What separates winning setups from pure exit liquidity is understanding where organic volume lives before centralized order books open up. When a decentralized protocol captures significant perp volume on its own, a listing acts less like a speculative spark and more like a bridge for sticky capital to finally enter at scale.
Are we looking at a classic buy-the-rumor event, or does the actual listing unlock sustainable open interest this time?
#BinanceWillListHyperliquid #SpotBitcoinETFsInflow #ETHBreaksAbove

32
·
--
📰 Just said Solana is cooling down—does Forward still want to buy a pile of “dog coins”?
Forward Industries said it wants to buy more Solana, and now it’s actually reaching for its wallet. The company plans to sell 3,125,000 shares at $8 per share, potentially earning $25 million—then using it all to buy and stock up on SOL. A couple of days ago, it even posted that Solana would be “cold,” but now it’s buying big. So what’s going on?
Why is this news important?
Forward’s move isn’t a small fry. SOL is only around $121 right now, yet they want to take it all. That suggests they don’t think it will break through to the downside. In other words, institutions don’t believe Solana is finished—some even see this as a bargain. Compare it with Bitcoin: at $8,394, people are still watching from the sidelines, which shows that in the eyes of institutions, SOL is an unconventional investment opportunity.
Impact on the market
In the short term, this deal could push SOL up a bit, but $121 is still far from “crazy.” If Forward’s buying isn’t the end of it, it likely means more money will flow in. For the whole crypto market, this implies that although BTC and Ethereum are struggling, there are still institutions betting that smaller coins can turn into something special. A historical reference: before Ethereum’s explosive rally in 2018, there were similar kinds of frantic coin-hoarding behaviors by small institutions.
💡 SOL may test the $126 resistance level next week due to this inflow. If, after this purchase, the price drops below $118 within the following days, this view becomes invalid.
【Author’s style】Data-driven: Forward plans to spend $25 million to buy SOL, and SOL is only $121 now—an extremely high value-for-money deal.
This article has no sponsorship from any project, and the author does not hold the assets mentioned
$BTC $ETH #BTC #ETH
⚠️ Not investment advice; predictions are for reference only
#SpotBitcoinETFsInflow$2.31BInFourDays
📰 Just said Solana is cooling down—does Forward still want to buy a pile of “dog coins”?
Forward Industries said it wants to buy more Solana, and now it’s actually reaching for its wallet. The company plans to sell 3,125,000 shares at $8 per share, potentially earning $25 million—then using it all to buy and stock up on SOL. A couple of days ago, it even posted that Solana would be “cold,” but now it’s buying big. So what’s going on?
Why is this news important?
Forward’s move isn’t a small fry. SOL is only around $121 right now, yet they want to take it all. That suggests they don’t think it will break through to the downside. In other words, institutions don’t believe Solana is finished—some even see this as a bargain. Compare it with Bitcoin: at $8,394, people are still watching from the sidelines, which shows that in the eyes of institutions, SOL is an unconventional investment opportunity.
Impact on the market
In the short term, this deal could push SOL up a bit, but $121 is still far from “crazy.” If Forward’s buying isn’t the end of it, it likely means more money will flow in. For the whole crypto market, this implies that although BTC and Ethereum are struggling, there are still institutions betting that smaller coins can turn into something special. A historical reference: before Ethereum’s explosive rally in 2018, there were similar kinds of frantic coin-hoarding behaviors by small institutions.
💡 SOL may test the $126 resistance level next week due to this inflow. If, after this purchase, the price drops below $118 within the following days, this view becomes invalid.
【Author’s style】Data-driven: Forward plans to spend $25 million to buy SOL, and SOL is only $121 now—an extremely high value-for-money deal.
This article has no sponsorship from any project, and the author does not hold the assets mentioned
$BTC $ETH #BTC #ETH
⚠️ Not investment advice; predictions are for reference only
#SpotBitcoinETFsInflow$2.31BInFourDays
Forward Industries said it wants to buy more Solana, and now it’s actually reaching for its wallet. The company plans to sell 3,125,000 shares at $8 per share, potentially earning $25 million—then using it all to buy and stock up on SOL. A couple of days ago, it even posted that Solana would be “cold,” but now it’s buying big. So what’s going on?
Why is this news important?
Forward’s move isn’t a small fry. SOL is only around $121 right now, yet they want to take it all. That suggests they don’t think it will break through to the downside. In other words, institutions don’t believe Solana is finished—some even see this as a bargain. Compare it with Bitcoin: at $8,394, people are still watching from the sidelines, which shows that in the eyes of institutions, SOL is an unconventional investment opportunity.
Impact on the market
In the short term, this deal could push SOL up a bit, but $121 is still far from “crazy.” If Forward’s buying isn’t the end of it, it likely means more money will flow in. For the whole crypto market, this implies that although BTC and Ethereum are struggling, there are still institutions betting that smaller coins can turn into something special. A historical reference: before Ethereum’s explosive rally in 2018, there were similar kinds of frantic coin-hoarding behaviors by small institutions.
💡 SOL may test the $126 resistance level next week due to this inflow. If, after this purchase, the price drops below $118 within the following days, this view becomes invalid.
【Author’s style】Data-driven: Forward plans to spend $25 million to buy SOL, and SOL is only $121 now—an extremely high value-for-money deal.
This article has no sponsorship from any project, and the author does not hold the assets mentioned
$BTC $ETH #BTC #ETH
⚠️ Not investment advice; predictions are for reference only
#SpotBitcoinETFsInflow$2.31BInFourDays
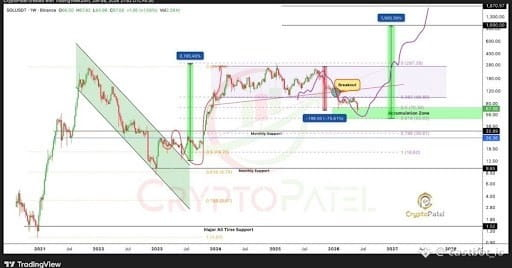


205
·
--
If you're still buying the top of every sudden pump like this one, stop now.
Too many traders are getting crushed chasing these 28% moves, loading up on FOMO and then watching their bags bleed as soon as the volume dries up. You never know when to exit because the greed just keeps whispering that it will go higher.
Bitcoin Cash just jumped 28% and discussions are everywhere. Some see it as $BCH finally getting recognition as a faster payments option compared to Bitcoin, especially with ETF inflows potentially spilling over. Others call it a classic overbought bounce in a market already sitting at 73 on the fear and greed index.
I've seen this pattern too many times.
The second view makes more sense to me. These parabolic moves often trap late buyers. Volume is pouring from $USDT into $BCH, but $AAVE and similar plays aren't seeing the same rush, which tells me this is isolated speculation.
Where do you think this goes from here?
#BCHJumps28 #SpotBitcoinETFsInflow #BitcoinRejectedAt
If you're still buying the top of every sudden pump like this one, stop now.
Too many traders are getting crushed chasing these 28% moves, loading up on FOMO and then watching their bags bleed as soon as the volume dries up. You never know when to exit because the greed just keeps whispering that it will go higher.
Bitcoin Cash just jumped 28% and discussions are everywhere. Some see it as $BCH finally getting recognition as a faster payments option compared to Bitcoin, especially with ETF inflows potentially spilling over. Others call it a classic overbought bounce in a market already sitting at 73 on the fear and greed index.
I've seen this pattern too many times.
The second view makes more sense to me. These parabolic moves often trap late buyers. Volume is pouring from $USDT into $BCH , but $AAVE and similar plays aren't seeing the same rush, which tells me this is isolated speculation.
Where do you think this goes from here?
#BCHJumps28 #SpotBitcoinETFsInflow #BitcoinRejectedAt
Too many traders are getting crushed chasing these 28% moves, loading up on FOMO and then watching their bags bleed as soon as the volume dries up. You never know when to exit because the greed just keeps whispering that it will go higher.
Bitcoin Cash just jumped 28% and discussions are everywhere. Some see it as $BCH finally getting recognition as a faster payments option compared to Bitcoin, especially with ETF inflows potentially spilling over. Others call it a classic overbought bounce in a market already sitting at 73 on the fear and greed index.
I've seen this pattern too many times.
The second view makes more sense to me. These parabolic moves often trap late buyers. Volume is pouring from $USDT into $BCH , but $AAVE and similar plays aren't seeing the same rush, which tells me this is isolated speculation.
Where do you think this goes from here?
#BCHJumps28 #SpotBitcoinETFsInflow #BitcoinRejectedAt

17
Have you noticed $BCH just jumped 28% while the rest of the market is still chasing whatever is trending in search?
Most traders will buy this green candle at the worst possible time. That is how you lose money in a greed market sitting at 73.
The lazy narrative is that Bitcoin Cash lost years ago and nobody should care. I disagree. $BCH is still one of the few chains built for actual payments, and it just woke up while $BTC takes all the ETF inflows. Moves like this do not happen in isolation. They happen when attention is elsewhere and liquidity rotates fast.
If you caught it, do not get greedy. Peel profits into $USDT and let a runner work with a stop. If you missed it, wait for the retest. Buying the 28% candle after it prints is how you become someone else's exit.
Where do you think this goes from here?
#BCHJumps28 #SpotBitcoinETFsInflow #BitcoinRejectedAt
Have you noticed $BCH just jumped 28% while the rest of the market is still chasing whatever is trending in search?
Most traders will buy this green candle at the worst possible time. That is how you lose money in a greed market sitting at 73.
The lazy narrative is that Bitcoin Cash lost years ago and nobody should care. I disagree. $BCH is still one of the few chains built for actual payments, and it just woke up while $BTC takes all the ETF inflows. Moves like this do not happen in isolation. They happen when attention is elsewhere and liquidity rotates fast.
If you caught it, do not get greedy. Peel profits into $USDT and let a runner work with a stop. If you missed it, wait for the retest. Buying the 28% candle after it prints is how you become someone else's exit.
Where do you think this goes from here?
#BCHJumps28 #SpotBitcoinETFsInflow #BitcoinRejectedAt
Most traders will buy this green candle at the worst possible time. That is how you lose money in a greed market sitting at 73.
The lazy narrative is that Bitcoin Cash lost years ago and nobody should care. I disagree. $BCH is still one of the few chains built for actual payments, and it just woke up while $BTC takes all the ETF inflows. Moves like this do not happen in isolation. They happen when attention is elsewhere and liquidity rotates fast.
If you caught it, do not get greedy. Peel profits into $USDT and let a runner work with a stop. If you missed it, wait for the retest. Buying the 28% candle after it prints is how you become someone else's exit.
Where do you think this goes from here?
#BCHJumps28 #SpotBitcoinETFsInflow #BitcoinRejectedAt

20
·
--
Picture this: the market is sitting at a comfortable Greed level, your altcoins are finally showing life, and suddenly macro reality pulls the rug from under everyone.
Most crypto investors treat traditional macro indicators as background noise right up until liquidity vanishes overnight, leaving late entrants holding bags and wondering why solid fundamentals couldn't save their positions.
Back in 2022, we watched a virtually identical script play out when surging sovereign yields drained capital directly out of speculative assets and forced heavy rotation back into safe havens like $USDT. When risk-free paper starts offering generationally high returns, large funds simply stop chasing beta in mid-caps like $NEAR and de-risk their portfolios until liquidity stabilizes.
What makes today fascinating is how decentralized lending protocols such as $AAVE now react in real time, serving as an instant benchmark for on-chain borrowing demand versus traditional sovereign debt. The capital isn't necessarily leaving the ecosystem permanently, but it is becoming far more selective about where it demands yield.
Are you adjusting your portfolio for higher-for-longer macro yields, or staying fully allocated to risk?
#US10YTreasuryYieldHits19YearHigh #DollarIndexReclaims101 #SpotBitcoinETFsInflow
Picture this: the market is sitting at a comfortable Greed level, your altcoins are finally showing life, and suddenly macro reality pulls the rug from under everyone.
Most crypto investors treat traditional macro indicators as background noise right up until liquidity vanishes overnight, leaving late entrants holding bags and wondering why solid fundamentals couldn't save their positions.
Back in 2022, we watched a virtually identical script play out when surging sovereign yields drained capital directly out of speculative assets and forced heavy rotation back into safe havens like $USDT. When risk-free paper starts offering generationally high returns, large funds simply stop chasing beta in mid-caps like $NEAR and de-risk their portfolios until liquidity stabilizes.
What makes today fascinating is how decentralized lending protocols such as $AAVE now react in real time, serving as an instant benchmark for on-chain borrowing demand versus traditional sovereign debt. The capital isn't necessarily leaving the ecosystem permanently, but it is becoming far more selective about where it demands yield.
Are you adjusting your portfolio for higher-for-longer macro yields, or staying fully allocated to risk?
#US10YTreasuryYieldHits19YearHigh #DollarIndexReclaims101 #SpotBitcoinETFsInflow
Most crypto investors treat traditional macro indicators as background noise right up until liquidity vanishes overnight, leaving late entrants holding bags and wondering why solid fundamentals couldn't save their positions.
Back in 2022, we watched a virtually identical script play out when surging sovereign yields drained capital directly out of speculative assets and forced heavy rotation back into safe havens like $USDT. When risk-free paper starts offering generationally high returns, large funds simply stop chasing beta in mid-caps like $NEAR and de-risk their portfolios until liquidity stabilizes.
What makes today fascinating is how decentralized lending protocols such as $AAVE now react in real time, serving as an instant benchmark for on-chain borrowing demand versus traditional sovereign debt. The capital isn't necessarily leaving the ecosystem permanently, but it is becoming far more selective about where it demands yield.
Are you adjusting your portfolio for higher-for-longer macro yields, or staying fully allocated to risk?
#US10YTreasuryYieldHits19YearHigh #DollarIndexReclaims101 #SpotBitcoinETFsInflow
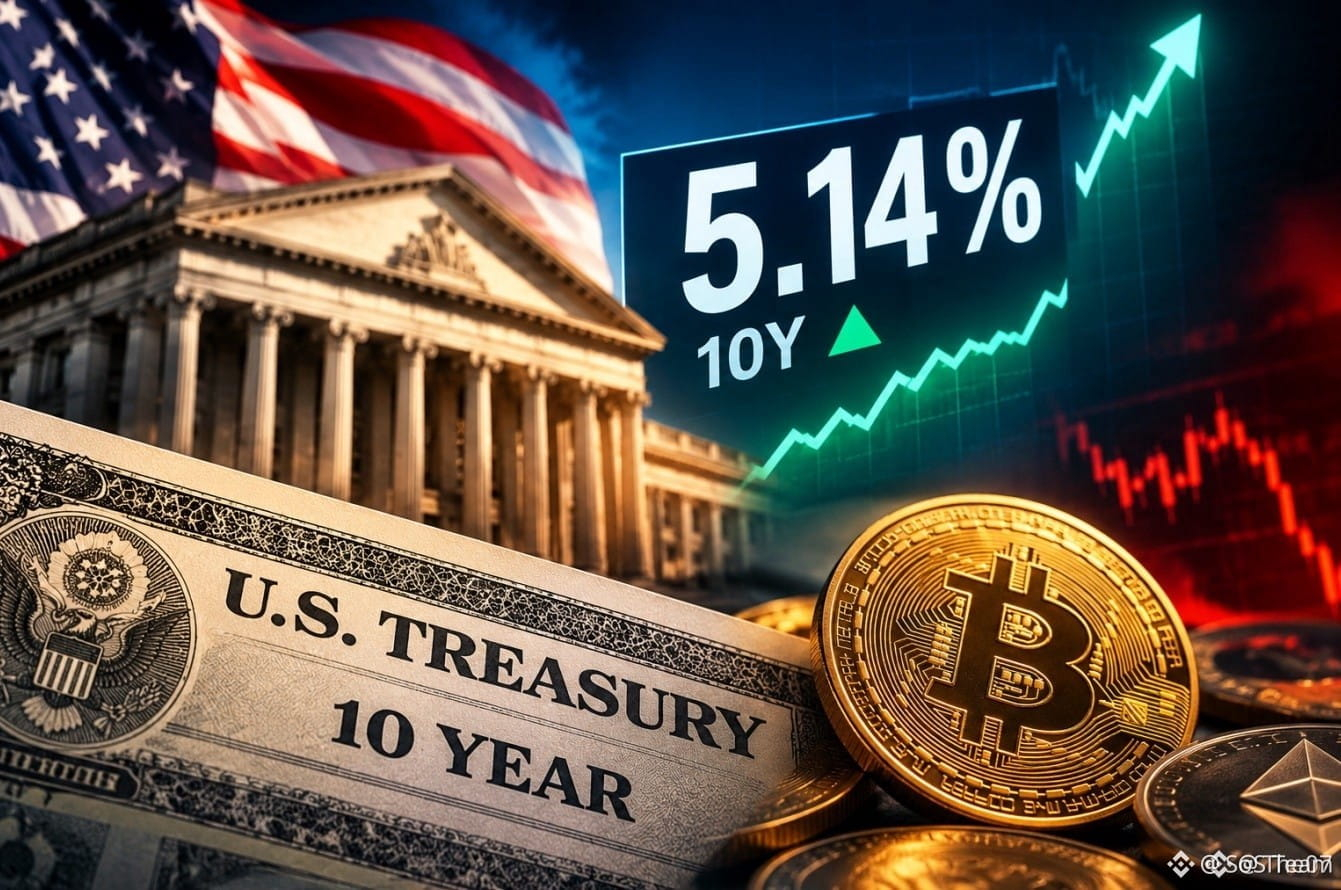
58
Log in to explore more content
Join global crypto users on Binance Square
⚡️ Get latest and useful information about crypto.
💬 Trusted by the world’s largest crypto exchange.
👍 Discover real insights from verified creators.
Email / Phone number
Trending Topics
1
#NvidiaApproves$150BBuyback
216 views
10 Discussing
2
#OpenAIDelaysGPT6.1OverSafetyIssues
657 views
53 Discussing
3
#AMDToAcquireWorldLabsFor$8.2B
86 views
16 Discussing
4
#AnthropicIPOProspectusCouldValueItOver$2T
1,226 views
47 Discussing
5
#HackersDrainOver12.4MXRPFromDCENTWallets
8,687 views
276 Discussing
6
#SECSaysDecentralizedTokenBuybacksNotInvestmentContracts
548 views
18 Discussing
7
#UKFCAWinsCourtOrderToRecover851400Pounds
64,545 views
1,163 Discussing
8
#ChainlinkLaunchesCCIP2WithEnterpriseVerification
73,216 views
1,279 Discussing
9
#GoldFallsTo$4144
23,674 views
184 Discussing
10
#QNTFallsOver40%FromMorningHigh
123,749 views
1,643 Discussing