

#samsung
samsung
376,137 views
2,375 Discussing
Hot
Latest

$SAMSUNG USDT Technical Update: Recovery and Momentum
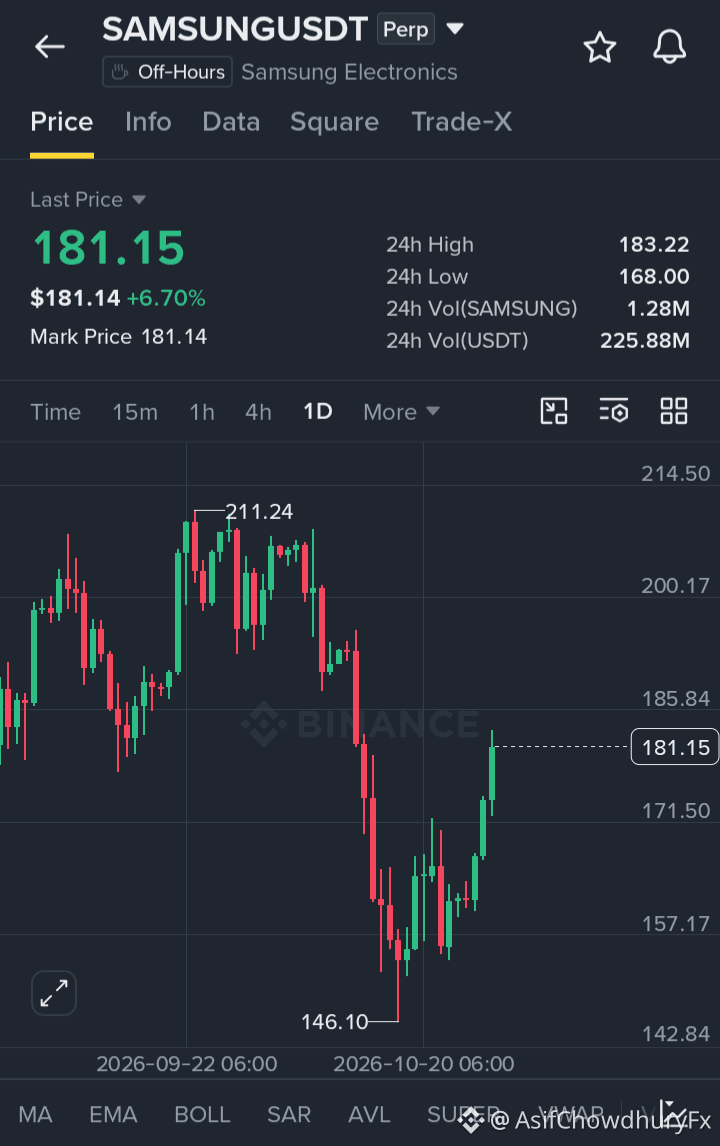
$SAMSUNG is showing solid recovery momentum, currently trading around $181.15 with a +6.70% daily gain after bouncing strongly from the $146.10 low[span_0](start_span)[span_0](end_span).
Key Technical Levels:
• Support Zone: $168.00 - $157.17[span_1](start_span)[span_1](end_span)
• Immediate Resistance: $183.22 (24h High)[span_2](start_span)[span_2](end_span)
• Major Upside Target: $200.17 - $211.24[span_3](start_span)[span_3](end_span)
Market Strategy:
The price structure indicates strong bullish continuation after a successful bottom test. Accumulate near support and manage risk strictly.
#SAMSUNG #CryptoAnalysis #TradingStrategy
{future}(SAMSUNGUSDT)
$SAMSUNG USDT Technical Update: Recovery and Momentum
$SAMSUNG is showing solid recovery momentum, currently trading around $181.15 with a +6.70% daily gain after bouncing strongly from the $146.10 low[span_0](start_span)[span_0](end_span).
Key Technical Levels:
• Support Zone: $168.00 - $157.17[span_1](start_span)[span_1](end_span)
• Immediate Resistance: $183.22 (24h High)[span_2](start_span)[span_2](end_span)
• Major Upside Target: $200.17 - $211.24[span_3](start_span)[span_3](end_span)
Market Strategy:
The price structure indicates strong bullish continuation after a successful bottom test. Accumulate near support and manage risk strictly.
#SAMSUNG #CryptoAnalysis #TradingStrategy
167

·
--
SAMSUNGUSDT PERP — Bullish Surge +6.96% 🔥
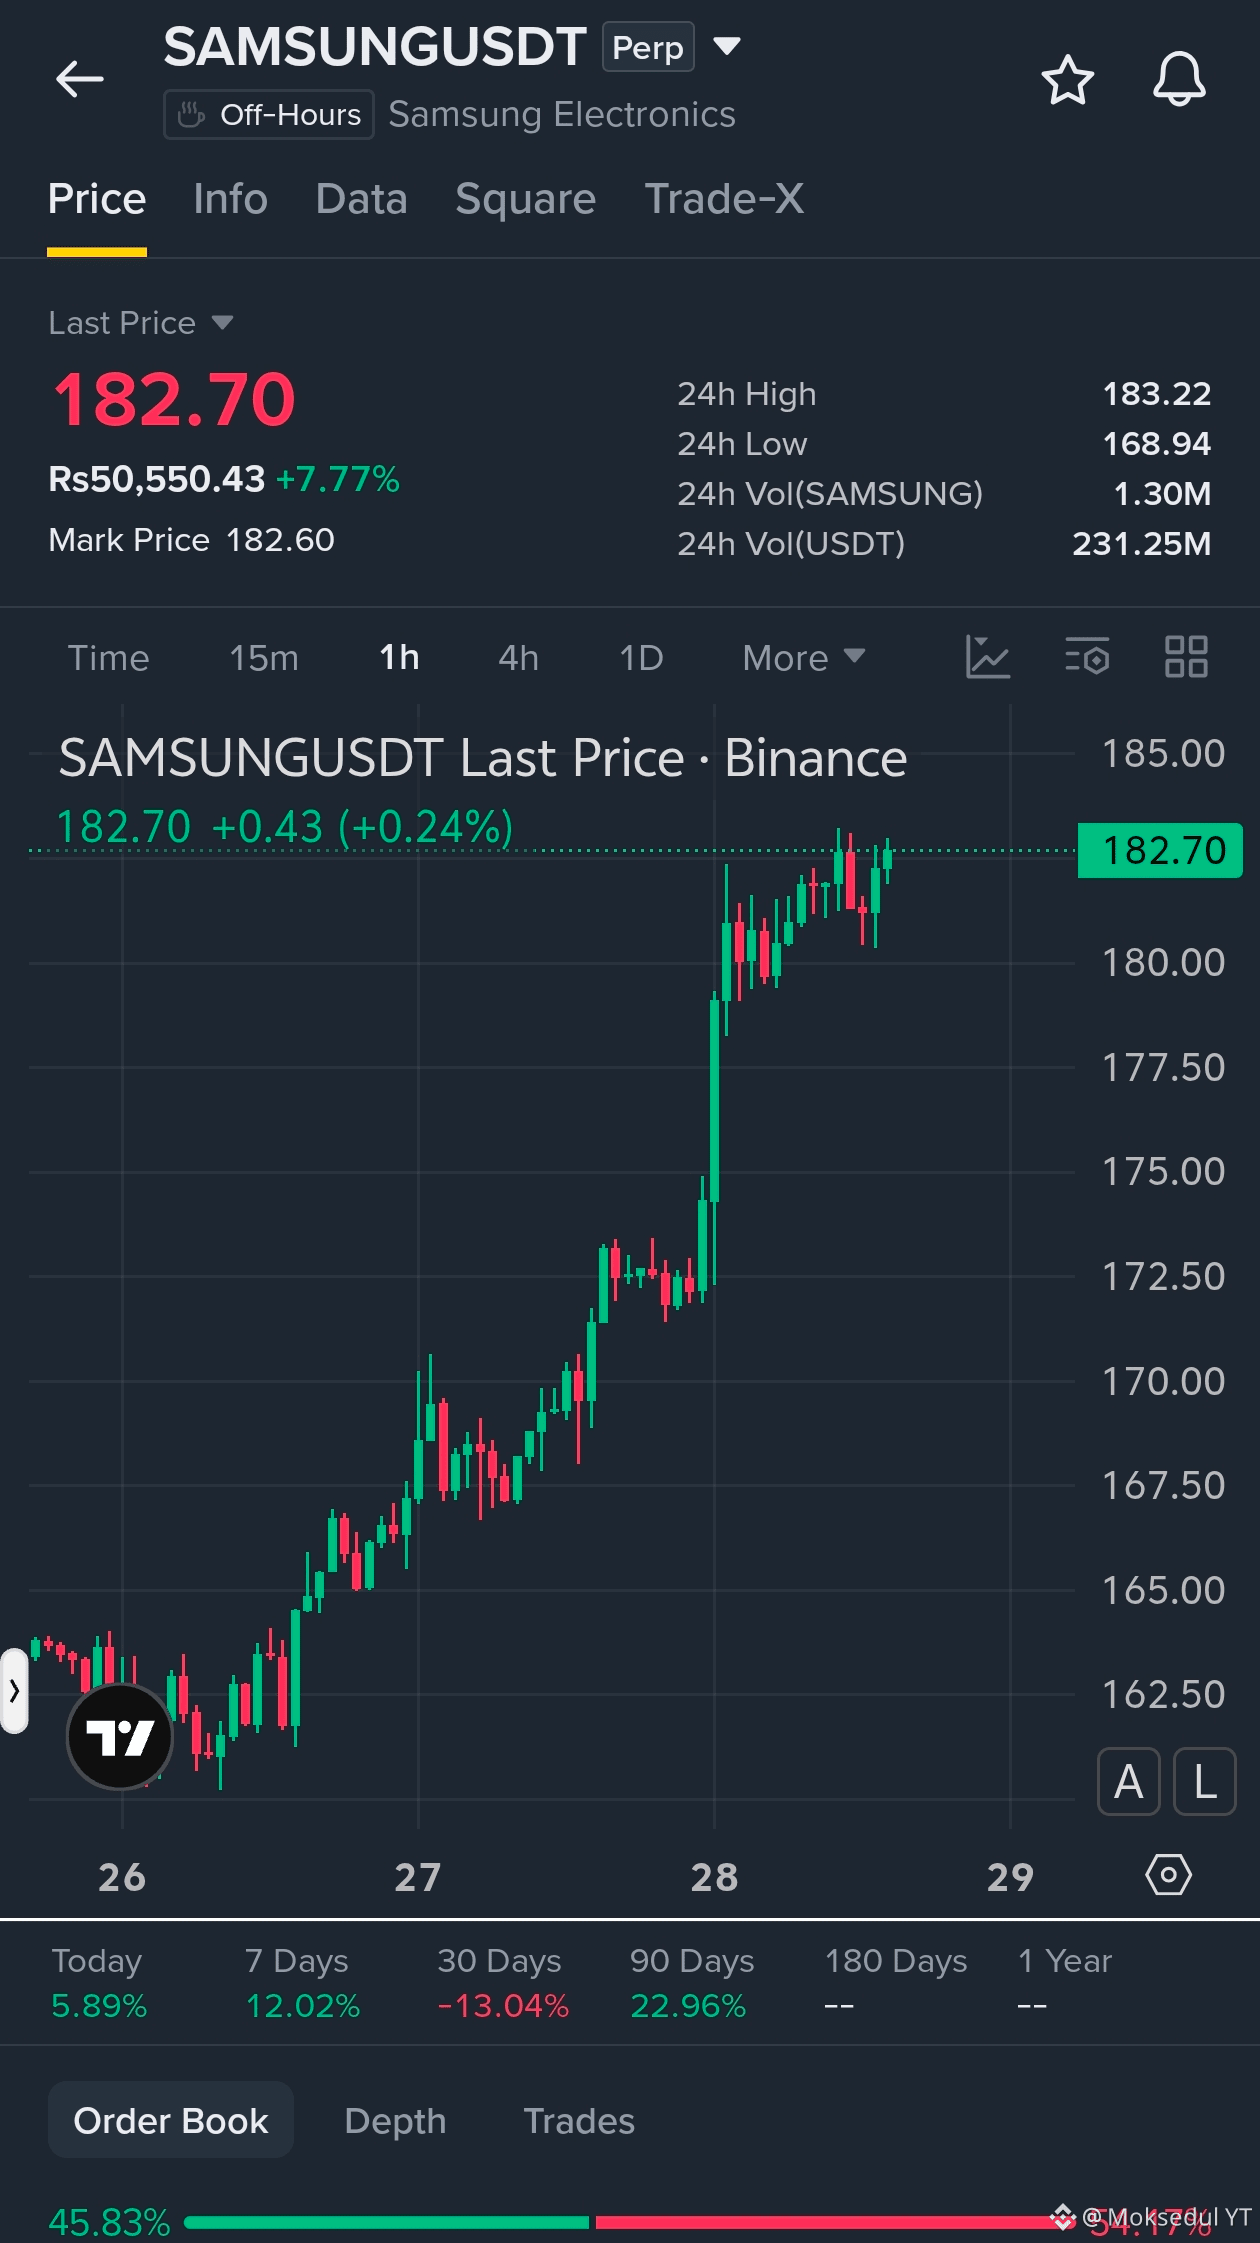
💰 Price Now: 182.04 (Rs50,141.37) — Pumping!
📈 24H High 183.22 | Low 168.86
💧 Volume: 1.30M SAMSUNG (230.12M USDT)
Off-Hours Trading but momentum strong! 📊
Long or Short? 👇
#SAMSUNG #SAMSUNGUSDT #Binance #Perp #Bullish
$SAMSUNG $BTC $ETH
{future}(SAMSUNGUSDT)
SAMSUNGUSDT PERP — Bullish Surge +6.96% 🔥
💰 Price Now: 182.04 (Rs50,141.37) — Pumping!
📈 24H High 183.22 | Low 168.86
💧 Volume: 1.30M SAMSUNG (230.12M USDT)
Off-Hours Trading but momentum strong! 📊
Long or Short? 👇
#SAMSUNG #SAMSUNGUSDT #Binance #Perp #Bullish
$SAMSUNG $BTC $ETH
💰 Price Now: 182.04 (Rs50,141.37) — Pumping!
📈 24H High 183.22 | Low 168.86
💧 Volume: 1.30M SAMSUNG (230.12M USDT)
Off-Hours Trading but momentum strong! 📊
Long or Short? 👇
#SAMSUNG #SAMSUNGUSDT #Binance #Perp #Bullish
$SAMSUNG $BTC $ETH
92

·
--

Article
🚨 SAMSUNG TO $200? Is This the Next Big Trading Opportunity?Can SAMSUNG push toward $200, or are traders getting ahead of the market? 👀📈
Every trader loves a big price target. But after years of watching markets, one lesson stands out: a target means nothing without a clear setup, strong confirmation, and a plan to manage risk.
Let's look at what traders should watch before making a move.
📊 1. Why Is the $200 Level Important?
Round-number levels often attract attention because traders place buy orders, take profits, and set stop-losses around them.
If $SAMSUNG is trading below $200, the key question is whether buyers have enough strength to push the price higher.
Here are three signals worth watching:
Bullish breakout: Price breaks above resistance with strong trading volume.
Successful retest: The former resistance holds as support, suggesting buyers are defending the breakout.
Weak breakout: Price briefly moves above resistance but quickly falls back below it.
That third scenario is where FOMO buyers can get trapped.
Remember, a move toward $200 is a possibility to evaluate, not a guaranteed outcome.
🟢 2. The Bullish Scenario
A bullish setup becomes more convincing when price forms higher highs and higher lows, trading volume increases, and buyers successfully defend important support levels.
If these conditions appear on the chart, traders can watch for a confirmed breakout and a potential continuation toward $200.
However, buying simply because the price is rising is not a strategy. Waiting for confirmation may mean entering later, but it can also help avoid chasing a false breakout.
🔴 3. What Could Go Wrong?
Markets rarely move in a straight line.
If buying pressure weakens, price could reject resistance, lose support, or reverse sharply. A sudden shift in sentiment can also trigger liquidations in leveraged positions.
Watch out for:
Declining volume during an attempted breakout.
Repeated rejection near resistance.
A breakdown below the latest higher low.
Excessive leverage and poorly placed stop-losses.
A bullish target does not eliminate downside risk.
🎯 4. How Would I Approach This Trade?
Before considering a position, I would identify the current price, the nearest support and resistance zones, and the market structure on the 4-hour and daily charts.
My checklist would be simple:
Wait for a confirmed price signal.
Define the entry and invalidation level before opening a trade.
Set a stop-loss based on the actual chart structure.
Calculate the risk-to-reward ratio before entering.
Avoid risking too much capital on a single idea.
Without a verified live chart, I would not invent entry prices, support levels, or a stop-loss just to make the setup look attractive.
🧠 5. The Trading Psychology That Matters
When traders start talking about a $200 target, excitement can quickly turn into FOMO.
Some buy too late because they fear missing the move. Others refuse to exit a losing position because they are emotionally attached to their target.
Experienced traders approach it differently: they follow the price, respect their invalidation levels, and accept that even a well-planned trade can fail.
Protecting capital matters more than proving a prediction right.
💬 Final Take: Is $200 Realistic?
The $200 target could attract attention, but whether it is achievable depends on the exact asset, its current price, trading volume, and technical structure.
I would rather wait for a clean setup than enter blindly because of an exciting target.
Your turn: Do you think $SAMSUNG can reach $200, or will sellers step in before that level? Share your reasoning in the comments. 👇
Not financial advice (NFA). This is a conditional trading framework, not a confirmed buy signal. Always verify the exact asset and live market data, and do your own research (DYOR) before investing.
{future}(SAMSUNGUSDT)
#Samsung #FOMCWatch #CryptoAnalysis #Binance #cryptouniverseofficial
🚨 SAMSUNG TO $200? Is This the Next Big Trading Opportunity?
Can SAMSUNG push toward $200, or are traders getting ahead of the market? 👀📈
Every trader loves a big price target. But after years of watching markets, one lesson stands out: a target means nothing without a clear setup, strong confirmation, and a plan to manage risk.
Let's look at what traders should watch before making a move.
📊 1. Why Is the $200 Level Important?
Round-number levels often attract attention because traders place buy orders, take profits, and set stop-losses around them.
If $SAMSUNG is trading below $200, the key question is whether buyers have enough strength to push the price higher.
Here are three signals worth watching:
Bullish breakout: Price breaks above resistance with strong trading volume.
Successful retest: The former resistance holds as support, suggesting buyers are defending the breakout.
Weak breakout: Price briefly moves above resistance but quickly falls back below it.
That third scenario is where FOMO buyers can get trapped.
Remember, a move toward $200 is a possibility to evaluate, not a guaranteed outcome.
🟢 2. The Bullish Scenario
A bullish setup becomes more convincing when price forms higher highs and higher lows, trading volume increases, and buyers successfully defend important support levels.
If these conditions appear on the chart, traders can watch for a confirmed breakout and a potential continuation toward $200.
However, buying simply because the price is rising is not a strategy. Waiting for confirmation may mean entering later, but it can also help avoid chasing a false breakout.
🔴 3. What Could Go Wrong?
Markets rarely move in a straight line.
If buying pressure weakens, price could reject resistance, lose support, or reverse sharply. A sudden shift in sentiment can also trigger liquidations in leveraged positions.
Watch out for:
Declining volume during an attempted breakout.
Repeated rejection near resistance.
A breakdown below the latest higher low.
Excessive leverage and poorly placed stop-losses.
A bullish target does not eliminate downside risk.
🎯 4. How Would I Approach This Trade?
Before considering a position, I would identify the current price, the nearest support and resistance zones, and the market structure on the 4-hour and daily charts.
My checklist would be simple:
Wait for a confirmed price signal.
Define the entry and invalidation level before opening a trade.
Set a stop-loss based on the actual chart structure.
Calculate the risk-to-reward ratio before entering.
Avoid risking too much capital on a single idea.
Without a verified live chart, I would not invent entry prices, support levels, or a stop-loss just to make the setup look attractive.
🧠 5. The Trading Psychology That Matters
When traders start talking about a $200 target, excitement can quickly turn into FOMO.
Some buy too late because they fear missing the move. Others refuse to exit a losing position because they are emotionally attached to their target.
Experienced traders approach it differently: they follow the price, respect their invalidation levels, and accept that even a well-planned trade can fail.
Protecting capital matters more than proving a prediction right.
💬 Final Take: Is $200 Realistic?
The $200 target could attract attention, but whether it is achievable depends on the exact asset, its current price, trading volume, and technical structure.
I would rather wait for a clean setup than enter blindly because of an exciting target.
Your turn: Do you think $SAMSUNG can reach $200, or will sellers step in before that level? Share your reasoning in the comments. 👇
Not financial advice (NFA). This is a conditional trading framework, not a confirmed buy signal. Always verify the exact asset and live market data, and do your own research (DYOR) before investing.
#Samsung #FOMCWatch #CryptoAnalysis #Binance #cryptouniverseofficial
1
132


·
--
Bullish
$SAMSUNG Long Setup Taking Shape
#SAMSUNG keeps holding near the $180.00 support, and the structure suggests a push toward the upper range.
LONG SETUP
Entry: $181.00 – $182.70
TP1: $185.00
TP2: $188.00
TP3: $192.00
SL: $177.50
$180.00 is the level to watch. A bounce could open the move toward $192.00.
Buy & Trade
{future}(SAMSUNGEMUSDT)
$EVAA
{future}(EVAAUSDT)
$HAEDAL
{future}(HAEDALUSDT)
$SAMSUNG Long Setup Taking Shape
#SAMSUNG keeps holding near the $180.00 support, and the structure suggests a push toward the upper range.
LONG SETUP
Entry: $181.00 – $182.70
TP1: $185.00
TP2: $188.00
TP3: $192.00
SL: $177.50
$180.00 is the level to watch. A bounce could open the move toward $192.00.
Buy & Trade
$EVAA
$HAEDAL
#SAMSUNG keeps holding near the $180.00 support, and the structure suggests a push toward the upper range.
LONG SETUP
Entry: $181.00 – $182.70
TP1: $185.00
TP2: $188.00
TP3: $192.00
SL: $177.50
$180.00 is the level to watch. A bounce could open the move toward $192.00.
Buy & Trade
$EVAA
$HAEDAL
2
200

🚀 $SAMSUNG BULLS ARE TRAPPING SHORTS IN A RUTHLESS PARABOLIC SQUEEZE! ⚡
Entry: 186.71 ⚡
Target: 189.00 🚀
Stop Loss: 185.00 ⚠️
Buyers just mounted an aggressive charge from 180 straight to 186, leaving shorts completely suffocated with zero breathing room. 🌊 Deep order book bids are heavily stacked right underneath us, forming a rock-solid structural floor.
Clearing the key resistance trigger at 187.93 is the spark that unlocks vertical acceleration. 📊 Momentum is surging rapidly, and order flow signals smart money positioning early for the immediate expansion phase.
💬 Are you bidding this momentum right now, or waiting for 187.93 to flip into confirmed support? 👇
⚠️ Not financial advice. Always manage your risk. 🛡️
🏷️ #SAMSUNG #LongSetup #Breakout #Crypto
🔥 ⚡
8

·
--
📊 $SAMSUNG Technical Analysis & Setup
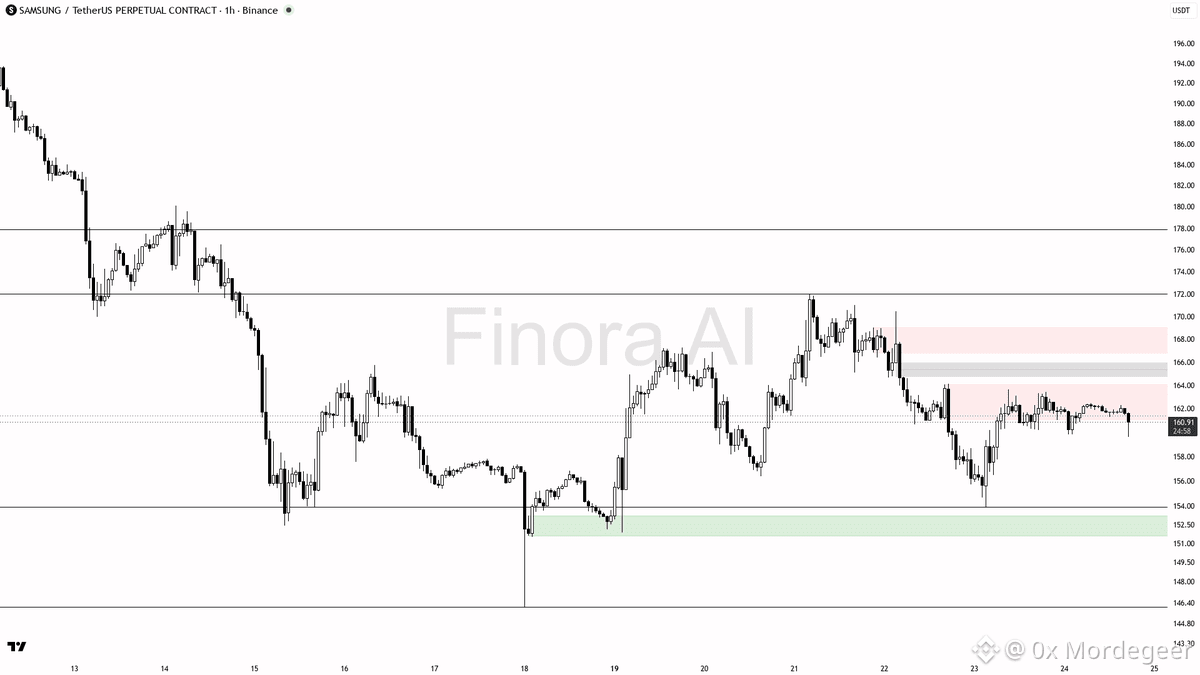
$SAMSUNG is currently exhibiting a bearish 1h market structure, defined by a lower high at 162.49 and a lower low at 159.84. A recent 15m liquidity sweep below 160.88 followed by a reclaim is acting as a trap, heavily favoring continuation lower rather than a true reversal.
• Key Support / Demand: 159.84 (first target) and major support at 153.88
• Resistance / Supply Targets: 162.49 (invalidation zone)
• Trigger / Confirmation: Bearish rejection or engulfing candle on LTF within the 160.90 to 161.50 zone
• Risk / Invalidation: Confirmed 1h close above 162.49 flips structure bullish
• Market Execution: Monitor order book depth and volume alongside negative funding (-0.0102%) for continuation signals
DYOR — Educational setup, not financial advice. Manage your risk strictly.
#BinanceSquare #Crypto #SAMSUNG #Trading
2

·
--
The biggest talking point around SAMSUNG right now isn’t the gain—it’s the divergence.
Binance TradFi perpetuals (traditional finance assets; high risk of price gaps outside trading hours) | SAMSUNG is up 7.36% over the past 24 hours, and momentum remains strong. For a continuation, first watch for a pullback. Current price is around 182, with 24-hour trading volume of about 223 million; the 30m volume ratio is only 0.6x, suggesting weak participation. Positioning: 68% of accounts are long; the taker buy/sell ratio is 1.06 (taker activity is close to balanced); 30m open interest is down 0.8%.
Reference indicators: 30m KDJ is 82.31/81.53/83.86, suggesting short-term buying enthusiasm is stretched. With the J value at a high level, the key question is whether price can find support on a pullback. Support and resistance: first watch the 178.25 / 183.22 levels. The closer price gets to support, the more useful it is to watch for signs of buying support; near resistance, pay closer attention to whether a breakout comes with rising volume or price pulls back after a spike.
Watch just two key levels: whether the taker buy/sell ratio of 1.06 can move out of the balance zone around 1, and whether the KDJ J value of 83.9 can retreat from elevated levels. Two paths lie ahead: buying support could sustain the rally, or sentiment could unwind as volume contracts.
#SAMSUNG #UnusualMoveAlert
9

·
--
Article
SAMSUNG rose 8%, but were shorts liquidated nearly 2,000 times more than longs?#SAMSUNG #爆仓数据 #TradFi #FuturesMarket
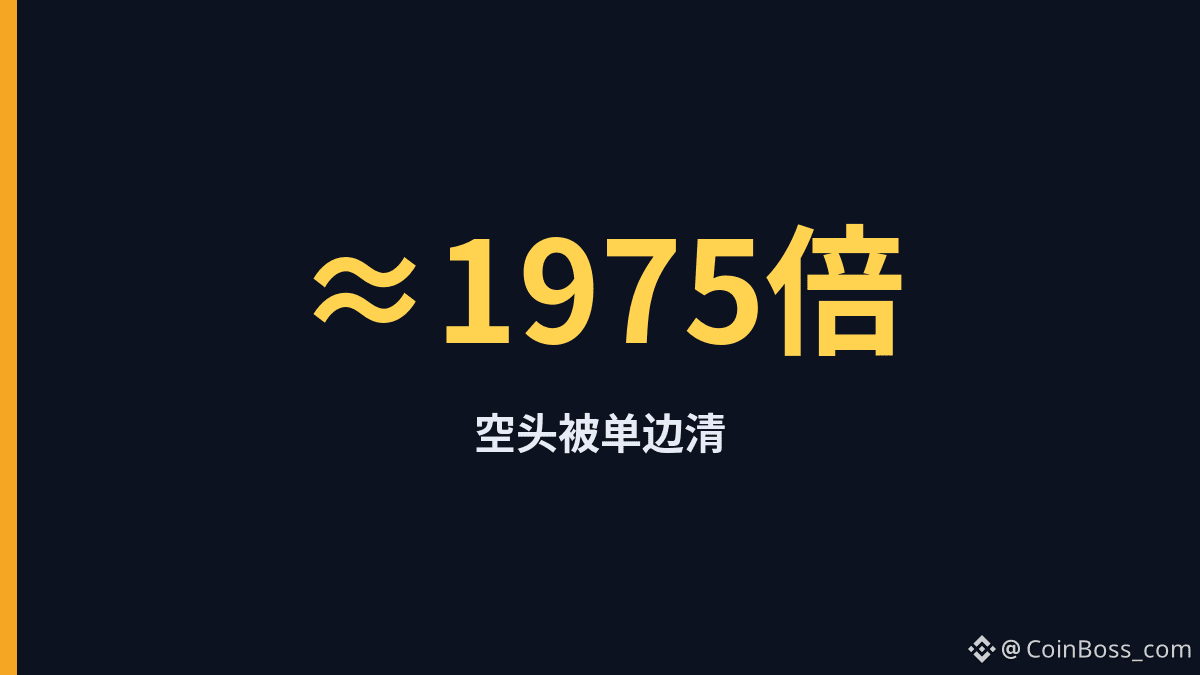
SAMSUNG rose 8%, but short liquidations reached nearly 2,000 times the long liquidations—as the price surged, leveraged short positions were almost completely swept away in a one-sided move.
TradFi stats over the past 24 hours: about $584,000 in short liquidations versus just $296 in long liquidations, a ratio of roughly 1,975 to 1. The price was around 181.22 on Binance, up about 8.02%, and around 181.16 on OKX, up about 7.99%—the two exchanges saw almost identical prices and gains. This wasn’t a two-sided liquidation cascade; it looks more like leveraged shorts were wiped out en masse during a sharp rally.
After short liquidations hit nearly 2,000 times the long liquidations, will longs keep adding leverage to chase the rally?
View live: https://www.coinboss.com/currencies/SAMSUNG
SAMSUNG rose 8%, but were shorts liquidated nearly 2,000 times more than longs?
#SAMSUNG #爆仓数据 #TradFi #FuturesMarket
SAMSUNG rose 8%, but short liquidations reached nearly 2,000 times the long liquidations—as the price surged, leveraged short positions were almost completely swept away in a one-sided move.
TradFi stats over the past 24 hours: about $584,000 in short liquidations versus just $296 in long liquidations, a ratio of roughly 1,975 to 1. The price was around 181.22 on Binance, up about 8.02%, and around 181.16 on OKX, up about 7.99%—the two exchanges saw almost identical prices and gains. This wasn’t a two-sided liquidation cascade; it looks more like leveraged shorts were wiped out en masse during a sharp rally.
After short liquidations hit nearly 2,000 times the long liquidations, will longs keep adding leverage to chase the rally?
View live: https://www.coinboss.com/currencies/SAMSUNG
8

·
--
October 28, 2026 12:19
Market Pulse | $SAMSUNG
Price 180.53 · Cautiously bullish, watching
Capital: Strong inflow
Support: 160.56
Resistance: 181.06
Next: Let's talk after a retest of 160.56
Key levels (4h):
· Key support below: 160.56 (swept · distance -11.07%)
· Support zone below: 174.89-180.03, midpoint 177.46
· Bullish support zone: 171.92-173.18
· Near-term resistance: 181.06
Sharing ideas only—not stock recommendations or trade calls. Trade at your own risk.
#SAMSUNG #交易信号 $SAMSUNG
3

·
--
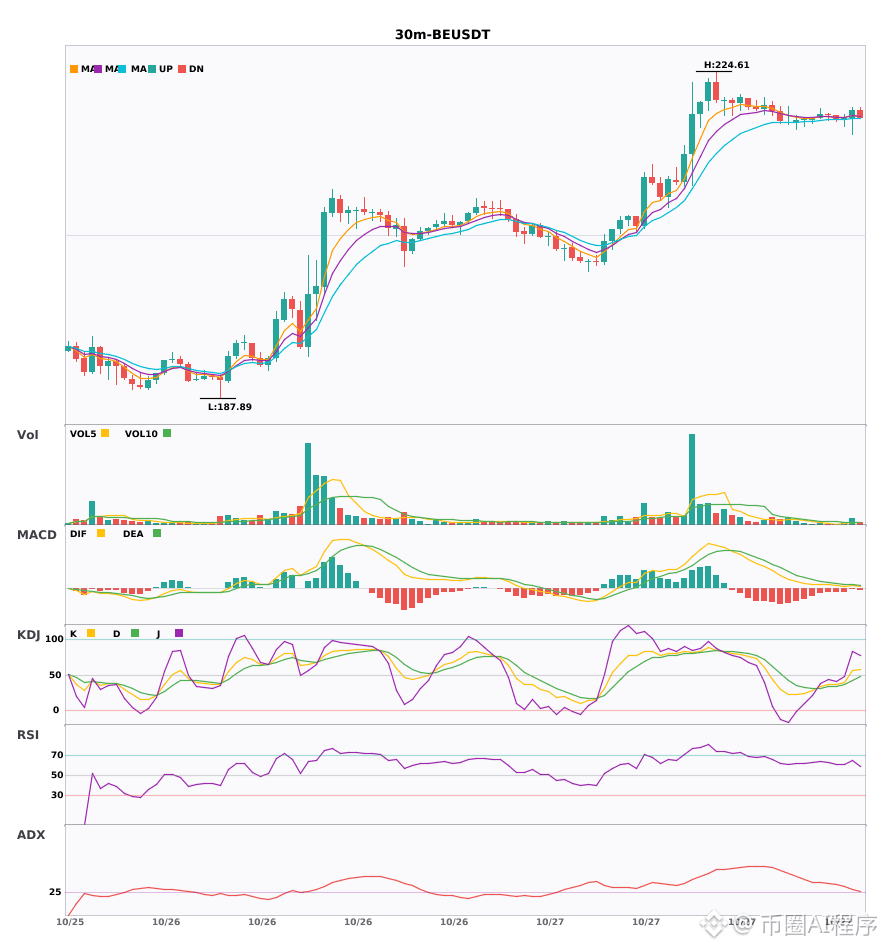
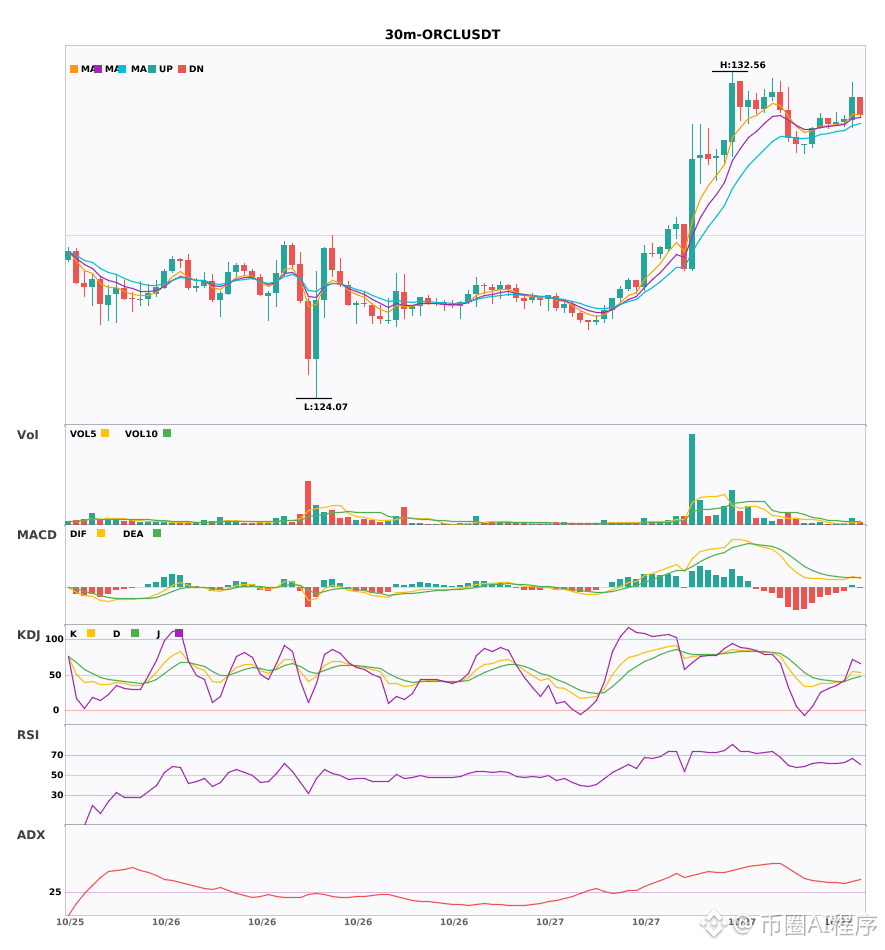
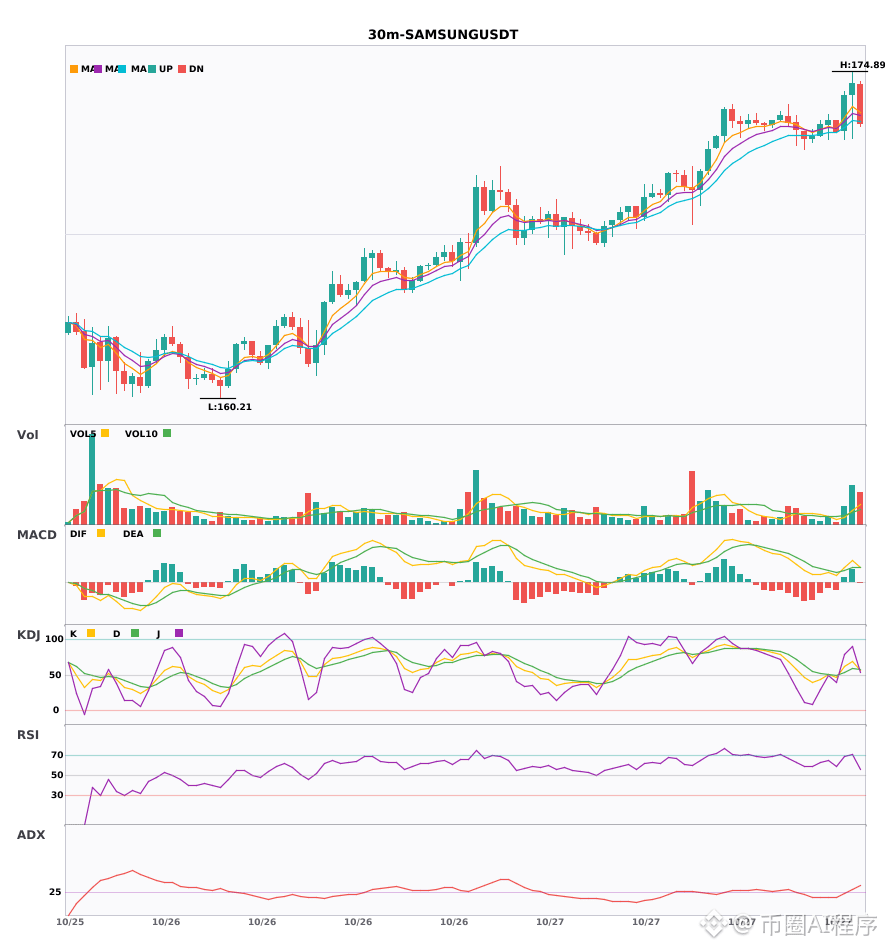
$BE / $ORCL / $SAMSUNG 30-minute bullish + 4-hour bullish alignment; multi-timeframe confluence turns bullish 🔥
════════════════════
🔴 $BE 30-minute bullish signal
⚠️ Technical: 4-hour bullish confluence confirmed | 30-minute entry: EMA5 crosses above EMA8, signaling a short-term bullish turn | Volume increase (2.4x)
════════════════════
🔴 $ORCL 30-minute bullish signal
⚠️ Technical: 4-hour bullish confluence confirmed | 30-minute entry: MACD bullish crossover above zero, releasing bullish momentum | EMA5 > EMA8 > EMA13, bullish alignment | Volume increase (1.7x)
════════════════════
🔴 $SAMSUNG 30-minute bullish signal
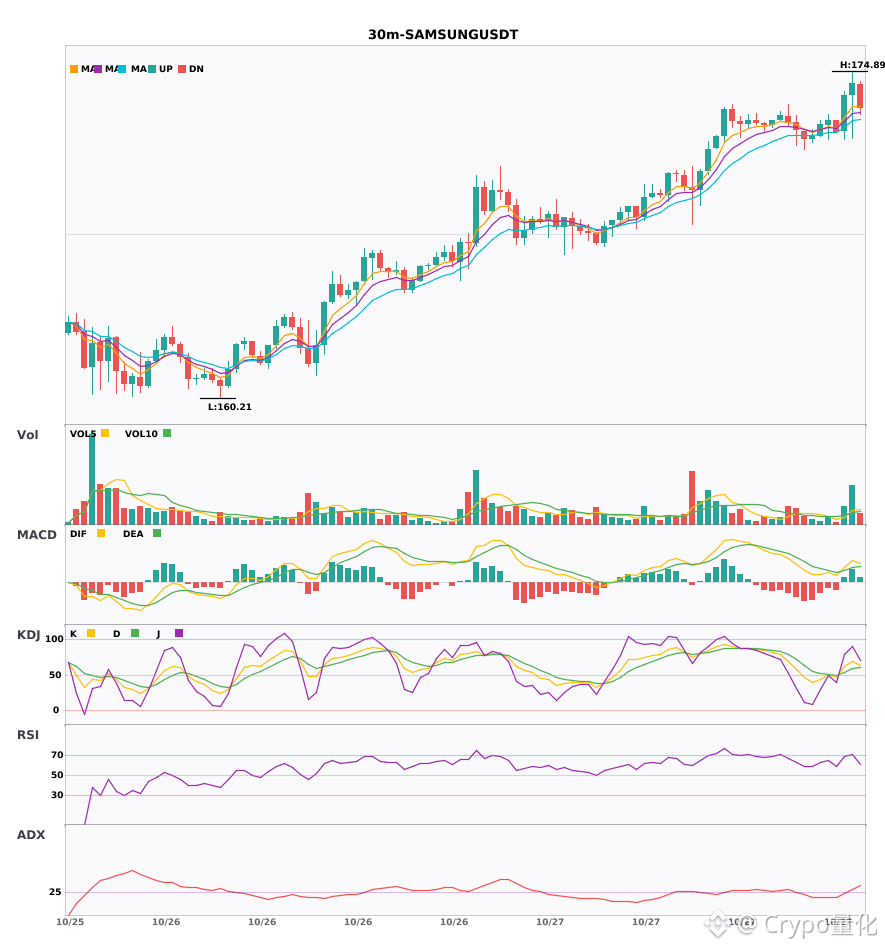
⚠️ Technical: 4-hour bullish confluence confirmed | 30-minute entry: MACD bullish crossover above zero, releasing bullish momentum | EMA5 > EMA8 > EMA13, bullish alignment | KDJ bullish crossover, short-term outlook is bullish (K: 61.8, D: 53.6) | Volume increase (2.0x)
════════════════════
🔔 Follow for first-hand market alerts 🔔
#多周期共振 #BE #ORCL #SAMSUNG
📌 When trading, pay attention to whether the candlestick pattern confirms
════════════════════
🔴 $BE 30-minute bullish signal
⚠️ Technical: 4-hour bullish confluence confirmed | 30-minute entry: EMA5 crosses above EMA8, signaling a short-term bullish turn | Volume increase (2.4x)
════════════════════
🔴 $ORCL 30-minute bullish signal
⚠️ Technical: 4-hour bullish confluence confirmed | 30-minute entry: MACD bullish crossover above zero, releasing bullish momentum | EMA5 > EMA8 > EMA13, bullish alignment | Volume increase (1.7x)
════════════════════
🔴 $SAMSUNG 30-minute bullish signal
⚠️ Technical: 4-hour bullish confluence confirmed | 30-minute entry: MACD bullish crossover above zero, releasing bullish momentum | EMA5 > EMA8 > EMA13, bullish alignment | KDJ bullish crossover, short-term outlook is bullish (K: 61.8, D: 53.6) | Volume increase (2.0x)
════════════════════
🔔 Follow for first-hand market alerts 🔔
#多周期共振 #BE #ORCL #SAMSUNG
📌 When trading, pay attention to whether the candlestick pattern confirms
9

·
--
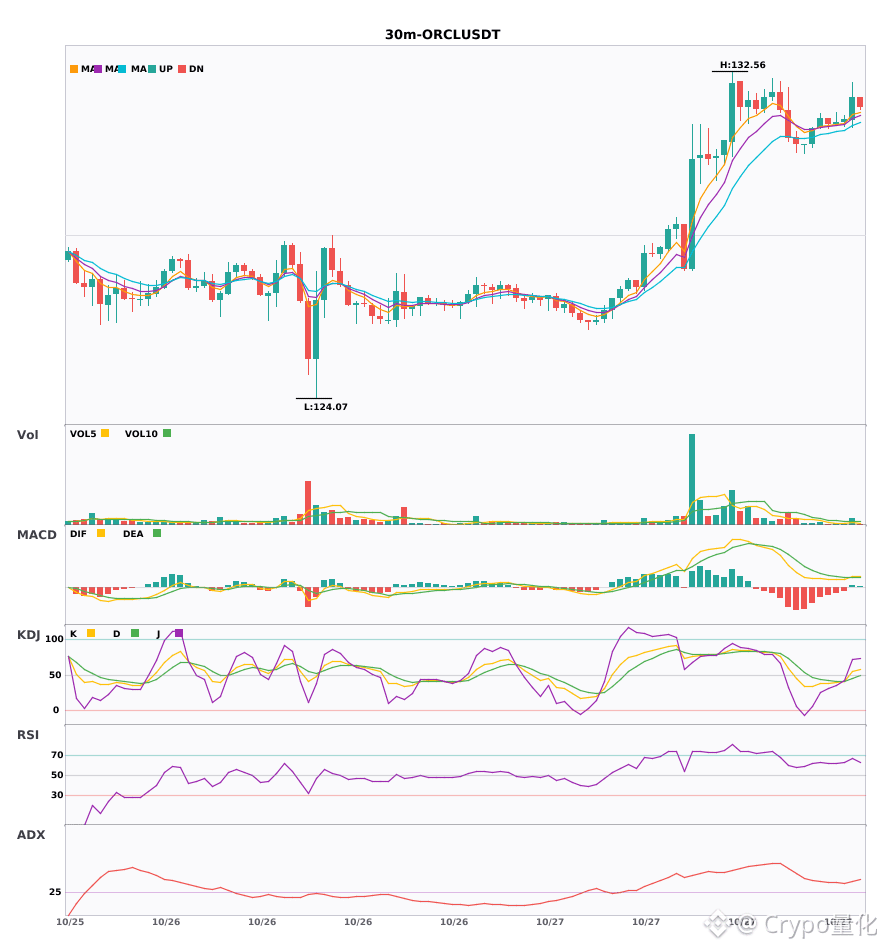
Three 30-minute bullish signals appeared simultaneously: $ORCL / $SAMSUNG / $INTW🔥
════════════════════
🔴 $ORCL 30-minute bullish signal
⚠️ Technicals: ADX (35): clear trending market | MACD bullish crossover above zero, bullish momentum emerging | EMA5 > EMA8 > EMA13: bullish alignment | Volume increased (1.7x)
════════════════════
🔴 $SAMSUNG 30-minute bullish signal
⚠️ Technicals: ADX (25): trend is forming; potential opportunity | MACD bullish crossover above zero, bullish momentum emerging | EMA5 > EMA8 > EMA13: bullish alignment | KDJ bullish crossover, short-term outlook is bullish (K: 61.8, D: 53.6) | Volume increased (2.0x)
════════════════════
🔴 $INTW 30-minute bullish signal
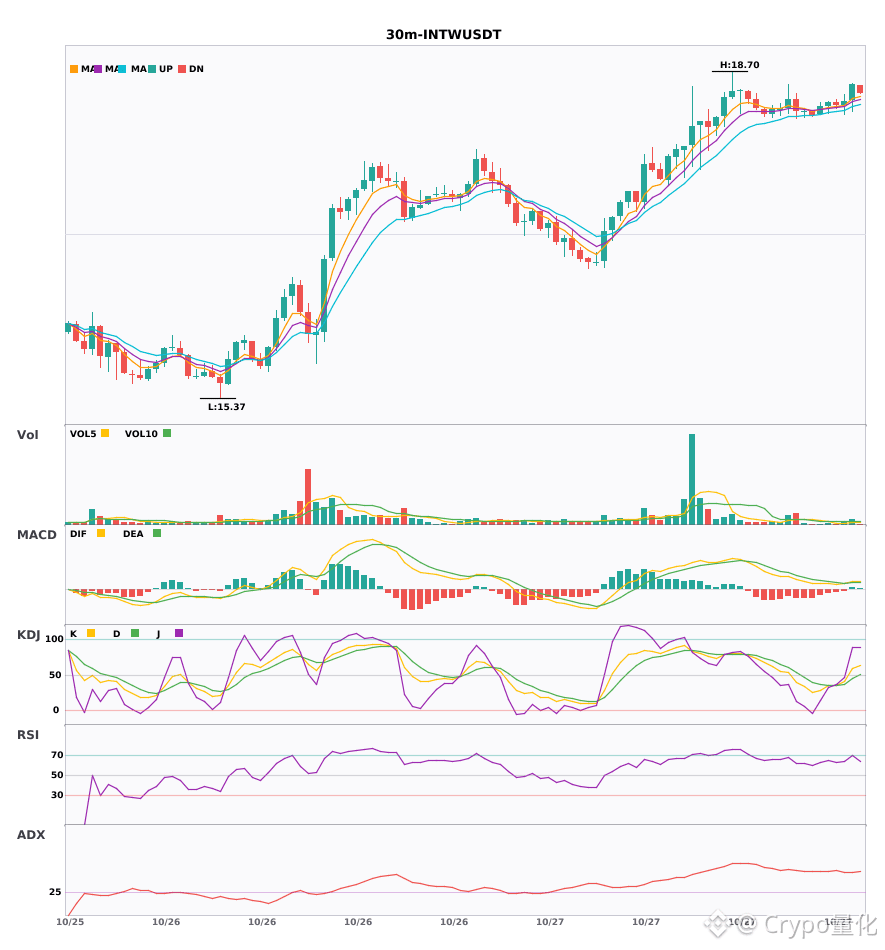
⚠️ Technicals: ADX (47): very strong trend (watch for an overbought pullback) | MACD bullish crossover above zero, bullish momentum emerging | EMA5 > EMA8 > EMA13: bullish alignment | Volume increased (1.6x)
════════════════════
🔔 Follow for first-hand market alerts 🔔
#技术分析 #ORCL #SAMSUNG #INTW
📌 When trading, check whether the candlestick pattern confirms the signal
Three 30-minute bullish signals appeared simultaneously: $ORCL / $SAMSUNG / $INTW 🔥
════════════════════
🔴 $ORCL 30-minute bullish signal
⚠️ Technicals: ADX (35): clear trending market | MACD bullish crossover above zero, bullish momentum emerging | EMA5 > EMA8 > EMA13: bullish alignment | Volume increased (1.7x)
════════════════════
🔴 $SAMSUNG 30-minute bullish signal
⚠️ Technicals: ADX (25): trend is forming; potential opportunity | MACD bullish crossover above zero, bullish momentum emerging | EMA5 > EMA8 > EMA13: bullish alignment | KDJ bullish crossover, short-term outlook is bullish (K: 61.8, D: 53.6) | Volume increased (2.0x)
════════════════════
🔴 $INTW 30-minute bullish signal
⚠️ Technicals: ADX (47): very strong trend (watch for an overbought pullback) | MACD bullish crossover above zero, bullish momentum emerging | EMA5 > EMA8 > EMA13: bullish alignment | Volume increased (1.6x)
════════════════════
🔔 Follow for first-hand market alerts 🔔
#技术分析 #ORCL #SAMSUNG #INTW
📌 When trading, check whether the candlestick pattern confirms the signal
════════════════════
🔴 $ORCL 30-minute bullish signal
⚠️ Technicals: ADX (35): clear trending market | MACD bullish crossover above zero, bullish momentum emerging | EMA5 > EMA8 > EMA13: bullish alignment | Volume increased (1.7x)
════════════════════
🔴 $SAMSUNG 30-minute bullish signal
⚠️ Technicals: ADX (25): trend is forming; potential opportunity | MACD bullish crossover above zero, bullish momentum emerging | EMA5 > EMA8 > EMA13: bullish alignment | KDJ bullish crossover, short-term outlook is bullish (K: 61.8, D: 53.6) | Volume increased (2.0x)
════════════════════
🔴 $INTW 30-minute bullish signal
⚠️ Technicals: ADX (47): very strong trend (watch for an overbought pullback) | MACD bullish crossover above zero, bullish momentum emerging | EMA5 > EMA8 > EMA13: bullish alignment | Volume increased (1.6x)
════════════════════
🔔 Follow for first-hand market alerts 🔔
#技术分析 #ORCL #SAMSUNG #INTW
📌 When trading, check whether the candlestick pattern confirms the signal
9
·
--
Multi-timeframe confluence: $PONS / $SKUU / $SAMSUNG strengthening on the 30-minute timeframe; 4-hour bullish trend confirmed 🔥
════════════════════
🔴 $PONS 30-minute bullish signal
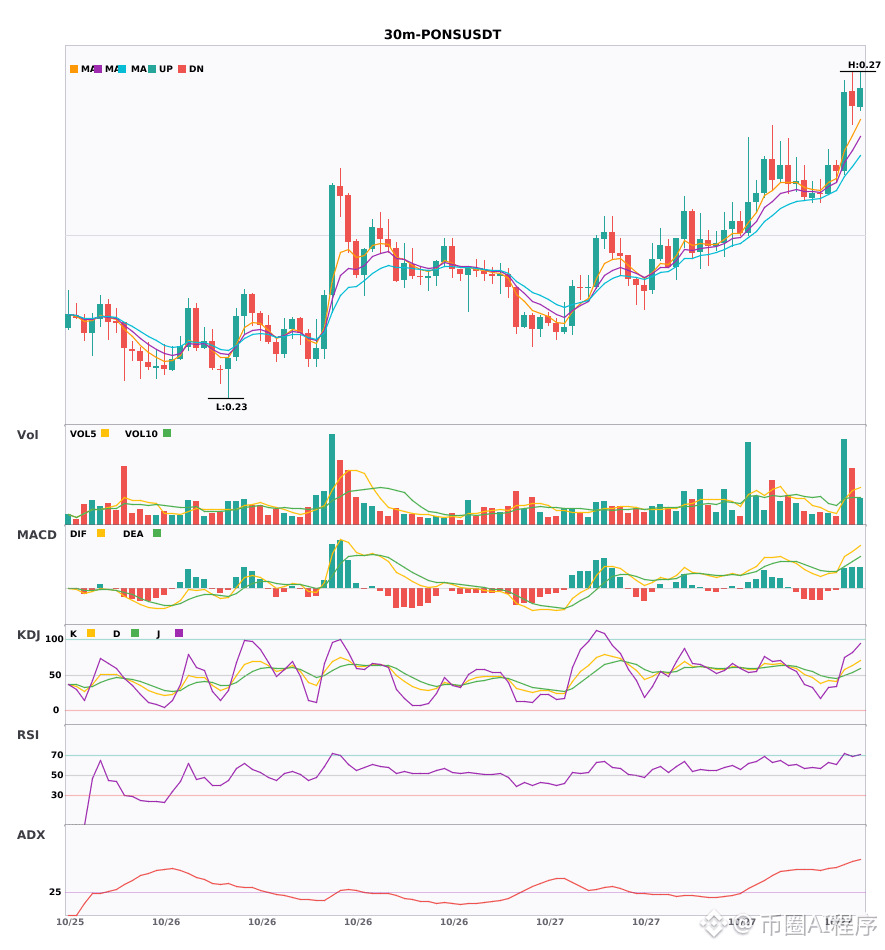
⚠️Technical analysis: 4-hour bullish confluence confirmed | 30-minute entry: MACD golden cross above zero, bullish momentum building | EMA5 > EMA8 > EMA13, bullish alignment | KDJ golden cross, short-term bullish (K: 57.3, D: 49.0) | Volume surge (3.3x)
════════════════════
🔴 $SKUU 30-minute bullish signal
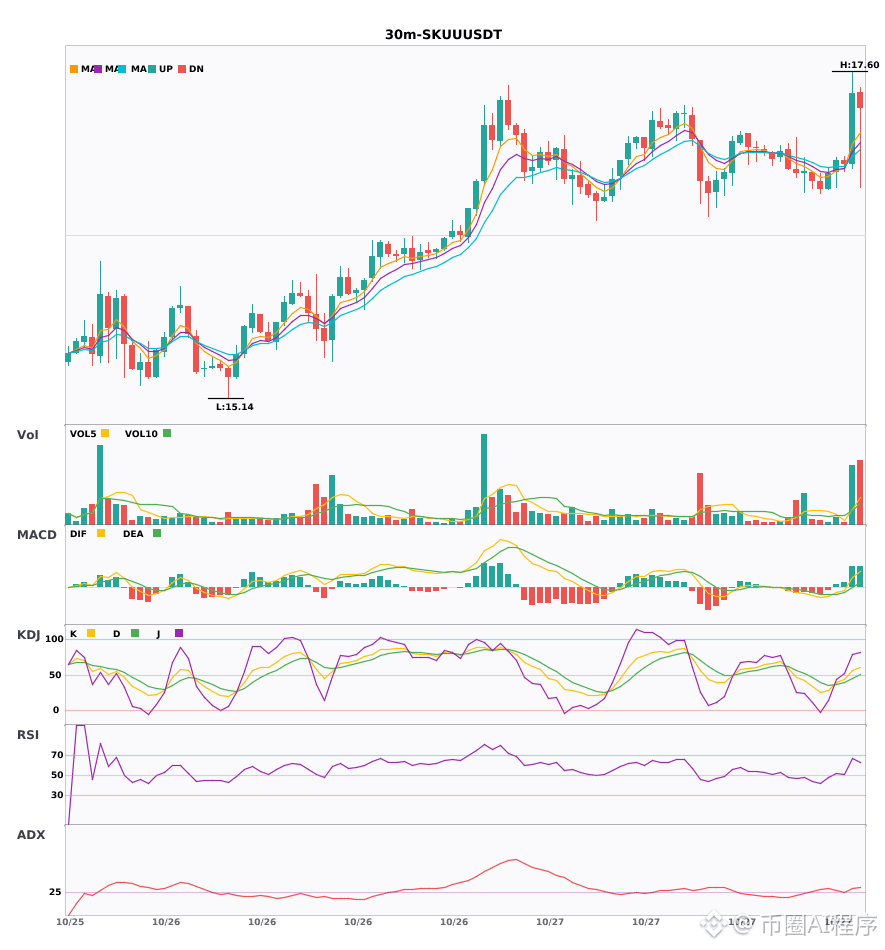
⚠️Technical analysis: 4-hour bullish confluence confirmed | 30-minute entry: MACD DIF breaks above the zero line, trend turns bullish | EMA5 crosses above EMA8, short-term outlook turns bullish | Volume surge (4.0x)
════════════════════
🔴 $SAMSUNG 30-minute bullish signal
⚠️Technical analysis: 4-hour bullish confluence confirmed | 30-minute entry: MACD golden cross above zero, bullish momentum building | EMA5 > EMA8 > EMA13, bullish alignment | KDJ golden cross, short-term bullish (K: 61.8, D: 53.6) | Volume expands (2.0x)
════════════════════
🔔 Follow for real-time market alerts 🔔
#多周期共振 #PONS #SKUU #SAMSUNG
📌 When trading, watch for confirmation from the candlestick pattern
════════════════════
🔴 $PONS 30-minute bullish signal
⚠️Technical analysis: 4-hour bullish confluence confirmed | 30-minute entry: MACD golden cross above zero, bullish momentum building | EMA5 > EMA8 > EMA13, bullish alignment | KDJ golden cross, short-term bullish (K: 57.3, D: 49.0) | Volume surge (3.3x)
════════════════════
🔴 $SKUU 30-minute bullish signal
⚠️Technical analysis: 4-hour bullish confluence confirmed | 30-minute entry: MACD DIF breaks above the zero line, trend turns bullish | EMA5 crosses above EMA8, short-term outlook turns bullish | Volume surge (4.0x)
════════════════════
🔴 $SAMSUNG 30-minute bullish signal
⚠️Technical analysis: 4-hour bullish confluence confirmed | 30-minute entry: MACD golden cross above zero, bullish momentum building | EMA5 > EMA8 > EMA13, bullish alignment | KDJ golden cross, short-term bullish (K: 61.8, D: 53.6) | Volume expands (2.0x)
════════════════════
🔔 Follow for real-time market alerts 🔔
#多周期共振 #PONS #SKUU #SAMSUNG
📌 When trading, watch for confirmation from the candlestick pattern
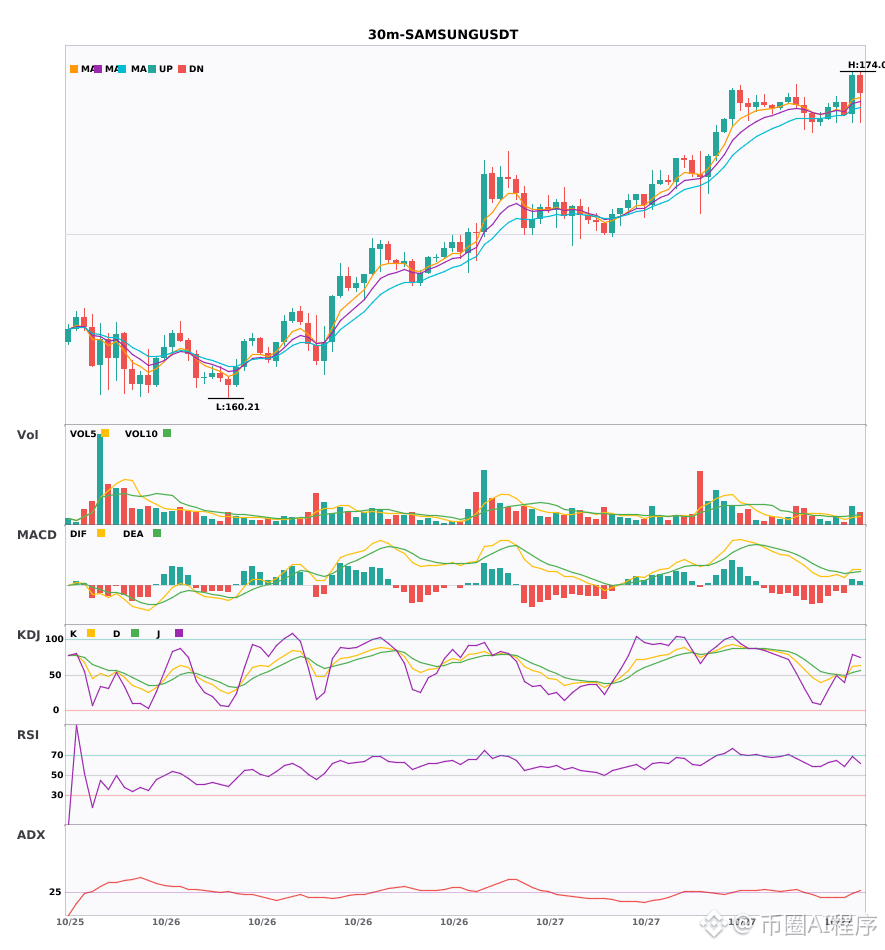
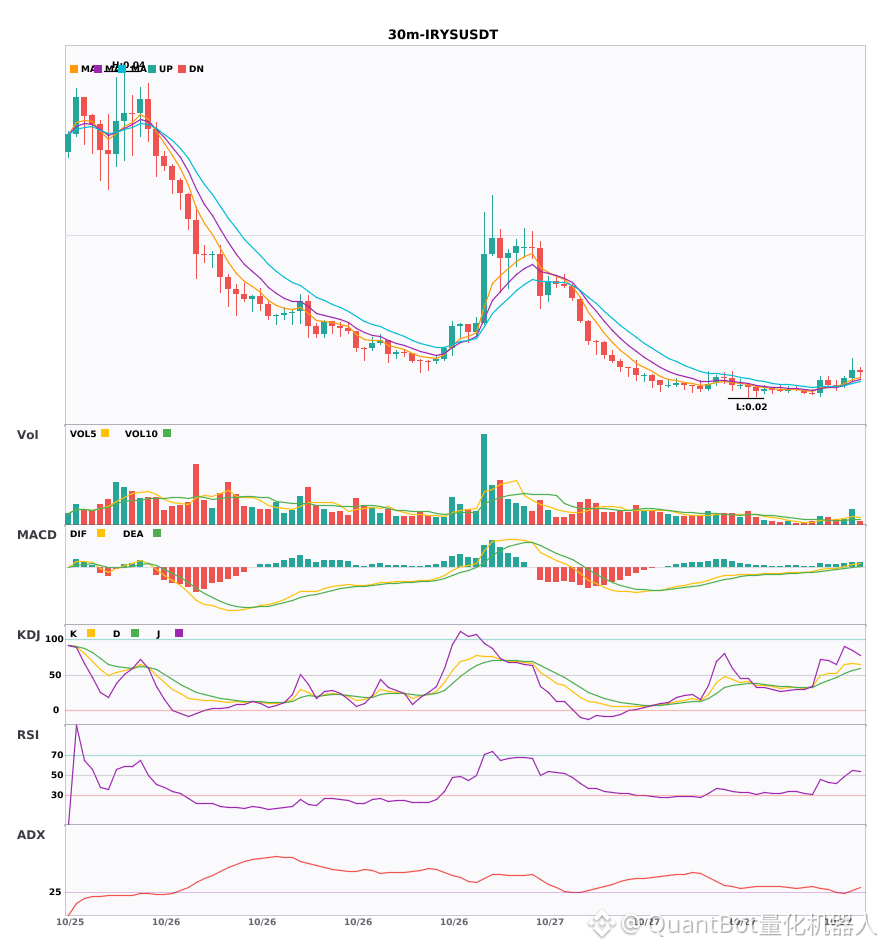
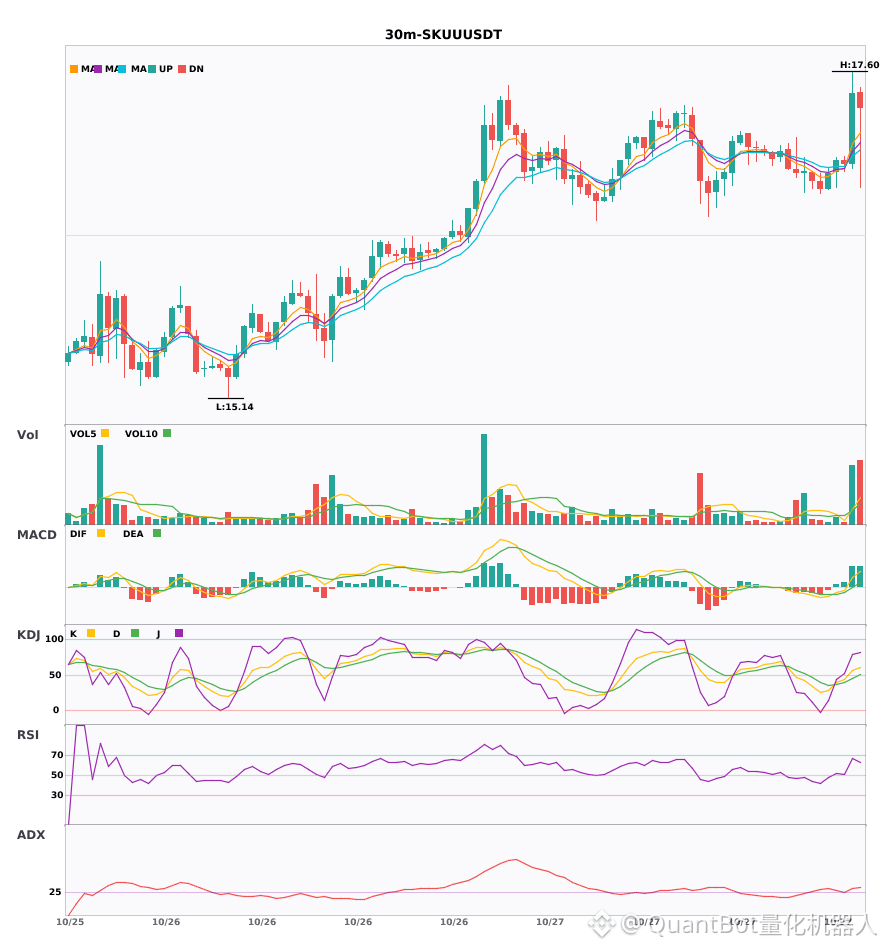
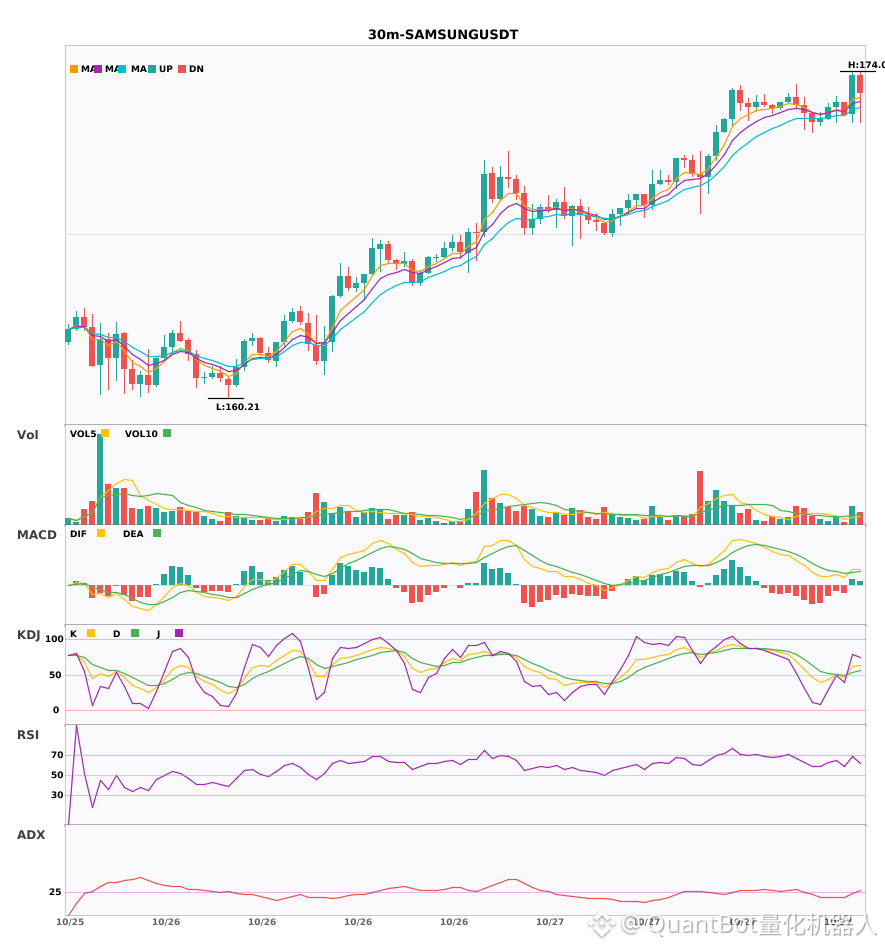
30

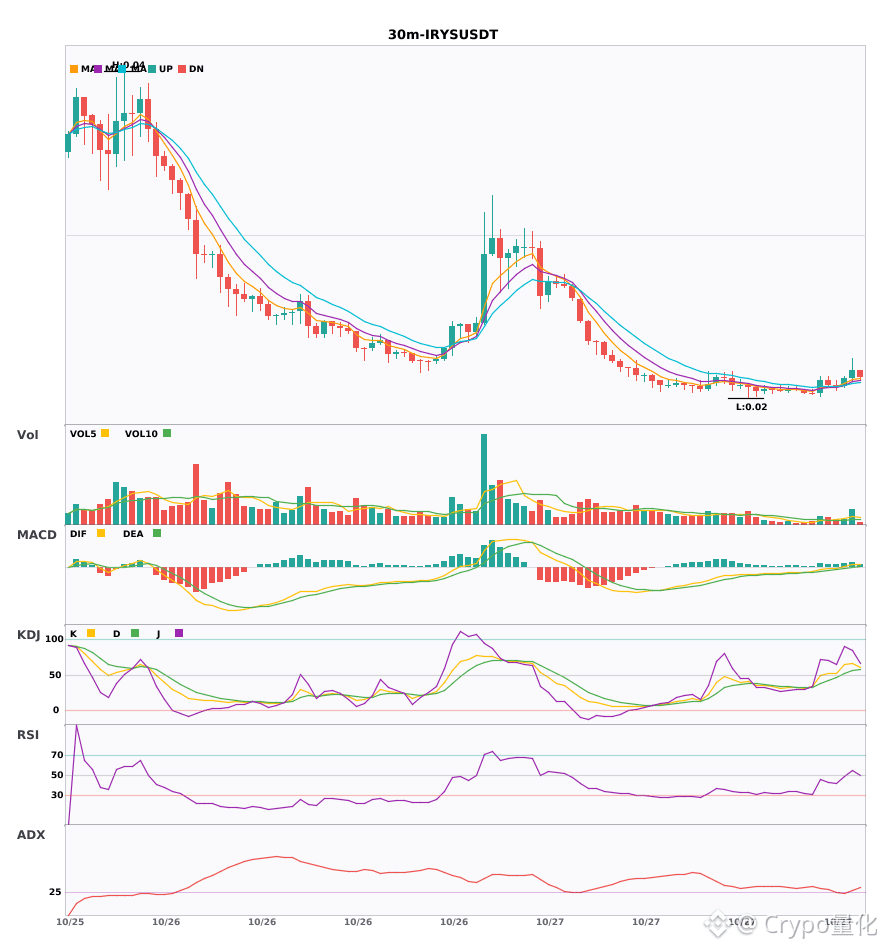
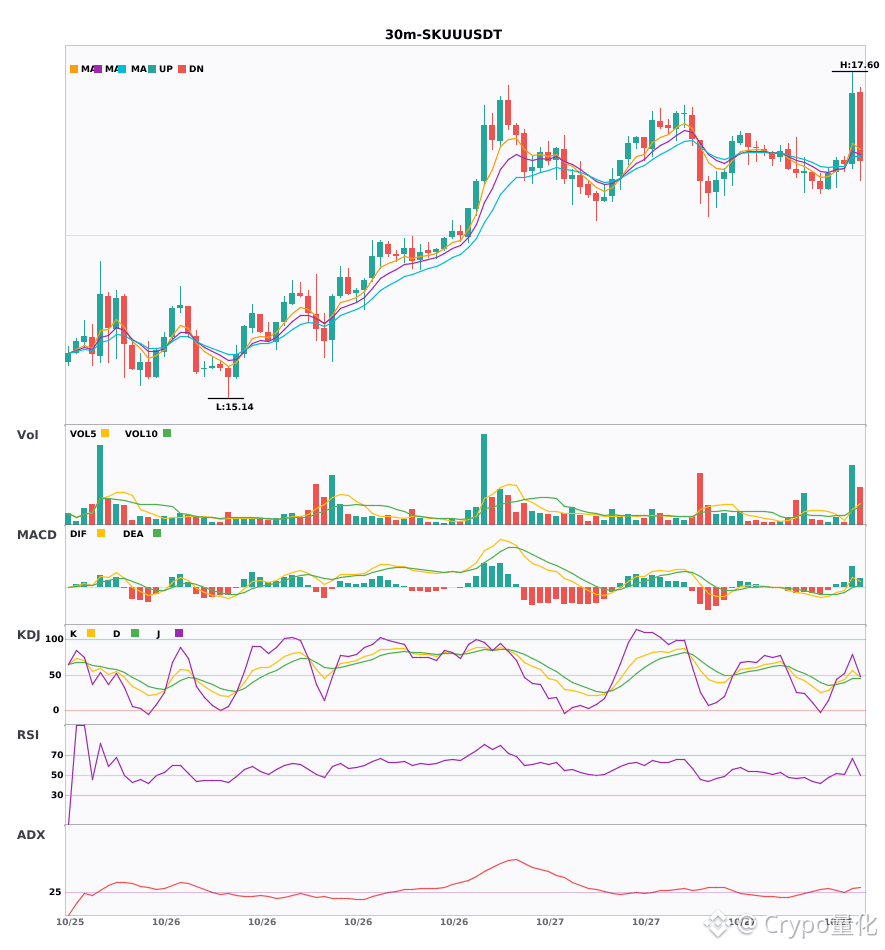
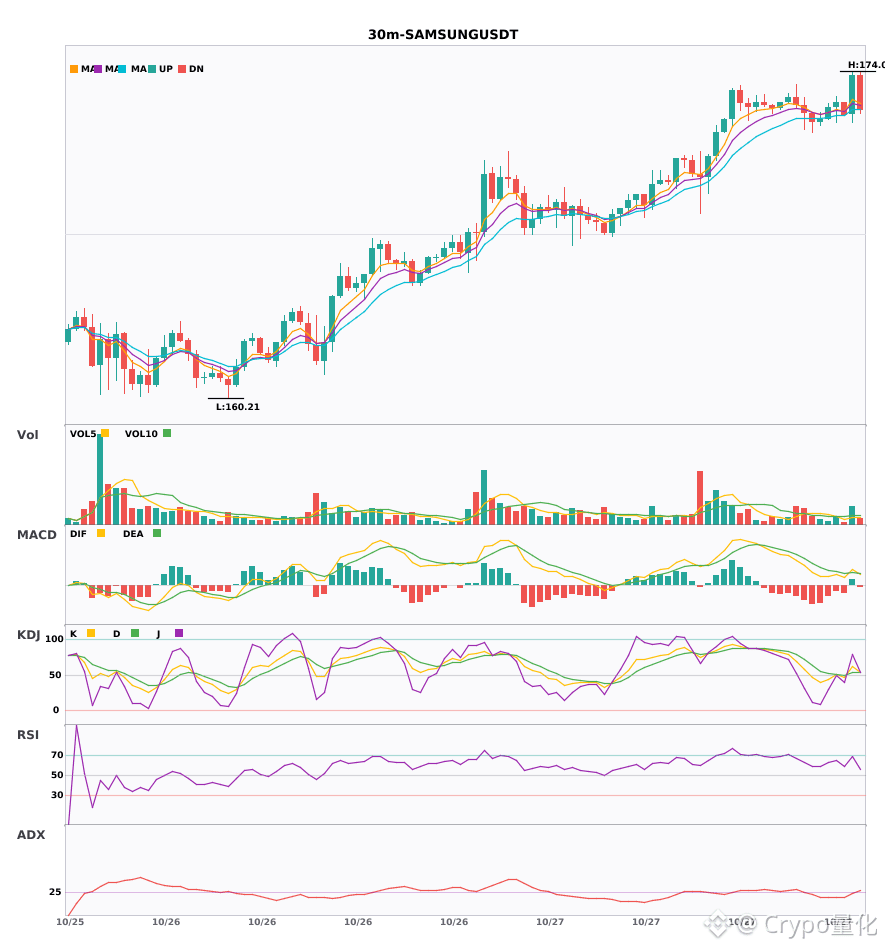
$IRYS / $SKUU / $SAMSUNG 30-minute timeframe bullish, short-term confluence opportunity
📈 $IRYS | 30-minute bullish signal
━━━━━━━━━━━━━━━━━━
Technical analysis: ADX(30): Trend is forming; potential entry | MACD bullish, trend relatively strong, momentum increasing | EMA5 > EMA8 > EMA13: bullish alignment | KDJ trending strongly, bulls in control (K: 66.1, D: 56.9) | Volume spike (2.7x)
Price change: 1.5400%
📈 $SKUU | 30-minute bullish signal
━━━━━━━━━━━━━━━━━━
Technical analysis: ADX(32): Clear trending market | MACD DIF breaks above zero, trend turns bullish | EMA5 crosses above EMA8, short-term trend turns bullish | Volume spike (4.0x)
Price change: 3.1400%
📈 $SAMSUNG | 30-minute bullish signal
━━━━━━━━━━━━━━━━━━
Technical analysis: ADX(25): Trend is forming; potential entry | MACD bullish crossover above zero, bullish momentum released | EMA5 > EMA8 > EMA13: bullish alignment | KDJ bullish crossover, short-term outlook bullish (K: 61.8, D: 53.6) | Volume increases (2.0x)
Price change: 0.9600%
━━━━━━━━━━━━━━━━━━
#技术分析 #IRYS #SKUU #SAMSUNG
📌 The above content is for reference only and does not constitute investment advice
13
·
--
Three 30-minute bullish signals appearing simultaneously: $IRYS / $SKUU / $SAMSUNG🔥
════════════════════
🔴 $IRYS 30-minute bullish signal
⚠️Technical analysis: ADX(30): Trend is forming; potential entry | MACD is bullish, trend is strong and momentum is increasing | EMA5 > EMA8 > EMA13: bullish alignment | KDJ is strong, with bulls in control (K: 66.1, D: 56.9) | Volume surge (2.7x)
════════════════════
🔴 $SKUU 30-minute bullish signal
⚠️Technical analysis: ADX(32): Clear trending market | MACD DIF breaks above the zero line, trend turns bullish | EMA5 crosses above EMA8, short-term trend turns bullish | Volume surge (4.0x)
════════════════════
🔴 $SAMSUNG 30-minute bullish signal
⚠️Technical analysis: ADX(25): Trend is forming; potential entry | MACD bullish crossover above zero, bullish momentum released | EMA5 > EMA8 > EMA13: bullish alignment | KDJ bullish crossover, short-term outlook is bullish (K: 61.8, D: 53.6) | Volume increase (2.0x)
════════════════════
🔔 Follow for first-hand market movement updates 🔔
#技术分析 #IRYS #SKUU #SAMSUNG
📌 When trading, watch for whether the candlestick pattern confirms the signal
Three 30-minute bullish signals appearing simultaneously: $IRYS / $SKUU / $SAMSUNG 🔥
════════════════════
🔴 $IRYS 30-minute bullish signal
⚠️Technical analysis: ADX(30): Trend is forming; potential entry | MACD is bullish, trend is strong and momentum is increasing | EMA5 > EMA8 > EMA13: bullish alignment | KDJ is strong, with bulls in control (K: 66.1, D: 56.9) | Volume surge (2.7x)
════════════════════
🔴 $SKUU 30-minute bullish signal
⚠️Technical analysis: ADX(32): Clear trending market | MACD DIF breaks above the zero line, trend turns bullish | EMA5 crosses above EMA8, short-term trend turns bullish | Volume surge (4.0x)
════════════════════
🔴 $SAMSUNG 30-minute bullish signal
⚠️Technical analysis: ADX(25): Trend is forming; potential entry | MACD bullish crossover above zero, bullish momentum released | EMA5 > EMA8 > EMA13: bullish alignment | KDJ bullish crossover, short-term outlook is bullish (K: 61.8, D: 53.6) | Volume increase (2.0x)
════════════════════
🔔 Follow for first-hand market movement updates 🔔
#技术分析 #IRYS #SKUU #SAMSUNG
📌 When trading, watch for whether the candlestick pattern confirms the signal
════════════════════
🔴 $IRYS 30-minute bullish signal
⚠️Technical analysis: ADX(30): Trend is forming; potential entry | MACD is bullish, trend is strong and momentum is increasing | EMA5 > EMA8 > EMA13: bullish alignment | KDJ is strong, with bulls in control (K: 66.1, D: 56.9) | Volume surge (2.7x)
════════════════════
🔴 $SKUU 30-minute bullish signal
⚠️Technical analysis: ADX(32): Clear trending market | MACD DIF breaks above the zero line, trend turns bullish | EMA5 crosses above EMA8, short-term trend turns bullish | Volume surge (4.0x)
════════════════════
🔴 $SAMSUNG 30-minute bullish signal
⚠️Technical analysis: ADX(25): Trend is forming; potential entry | MACD bullish crossover above zero, bullish momentum released | EMA5 > EMA8 > EMA13: bullish alignment | KDJ bullish crossover, short-term outlook is bullish (K: 61.8, D: 53.6) | Volume increase (2.0x)
════════════════════
🔔 Follow for first-hand market movement updates 🔔
#技术分析 #IRYS #SKUU #SAMSUNG
📌 When trading, watch for whether the candlestick pattern confirms the signal
28
·
--
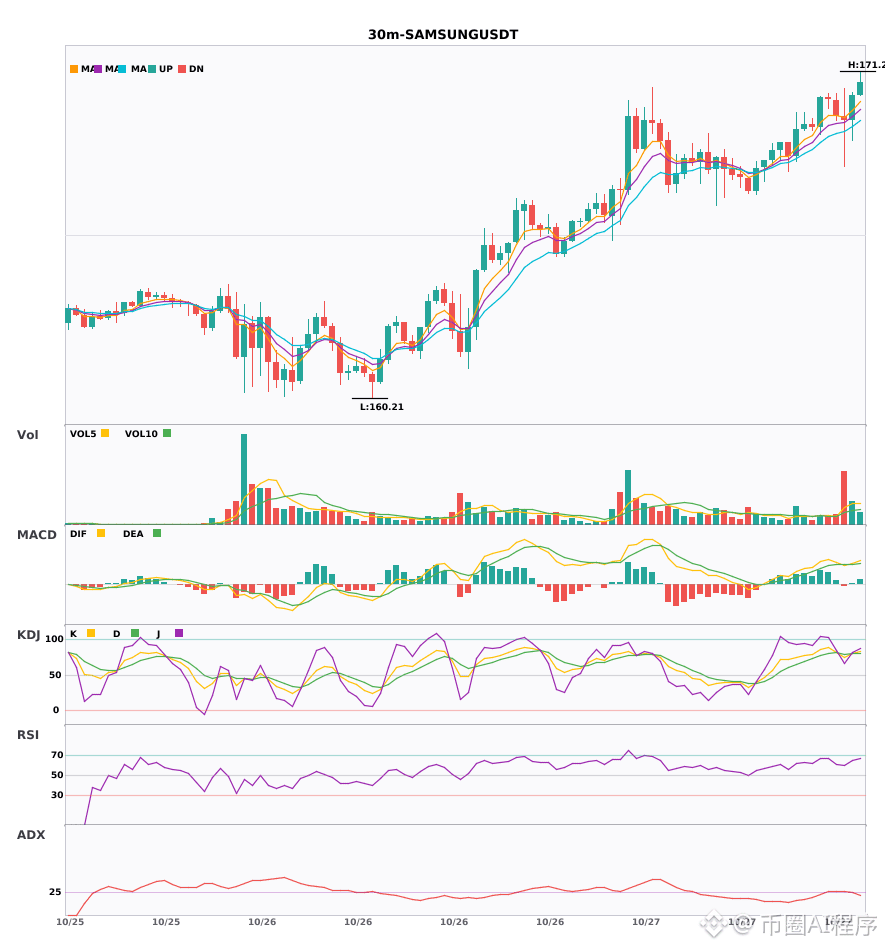
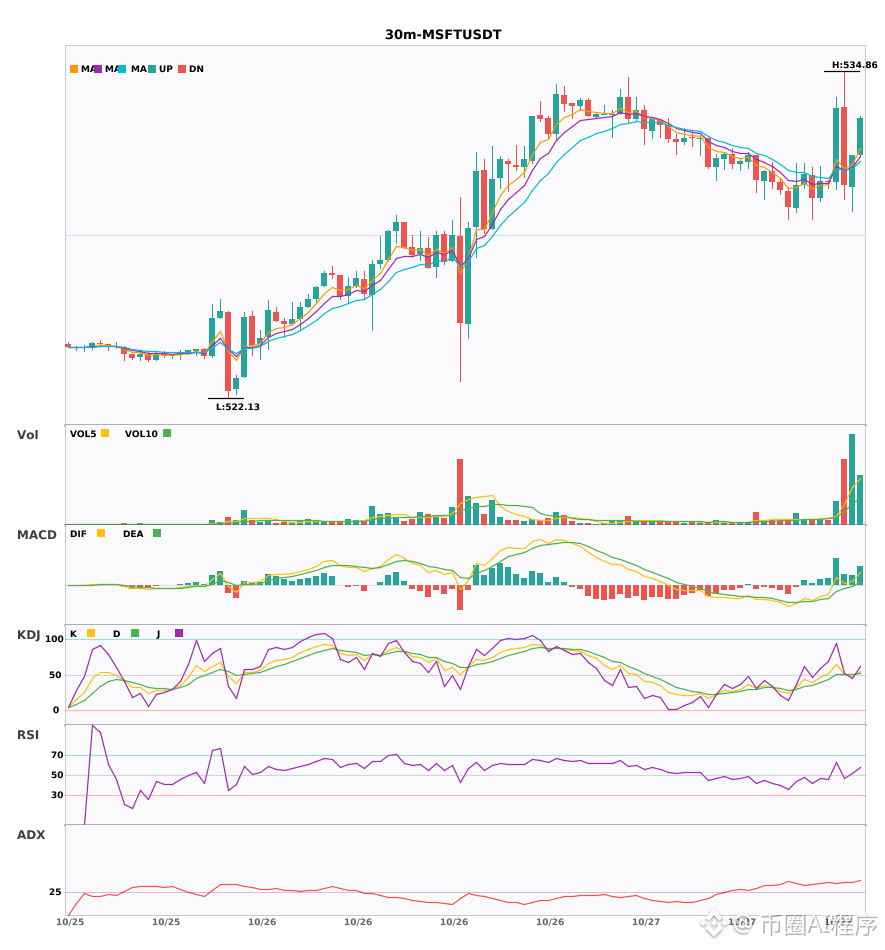
$SAMSUNG / $MSFT 30-minute bullish signals, confirmed 4-hour bullish trend 🔥
════════════════════
🔴 $SAMSUNG 30-minute bullish signal
⚠️ Technical analysis: 4-hour bullish confluence confirmed | 30-minute entry: MACD golden cross above zero, bullish momentum emerging | EMA5 > EMA8 > EMA13, bullish alignment | KDJ golden cross, short-term bullish (K: 80.4, D: 79.5) | Volume surge (4.1x)
📢 Market update: Alibaba, Tencent, and ByteDance seek long-term memory deals with Samsung and SK Hynix - The long-term memory deals highlight the intensifying global competition for AI infrastructure, potentially reshaping tech industry dynamics. The post...
════════════════════
🔴 $MSFT 30-minute bullish signal
⚠️ Technical analysis: 4-hour bullish confluence confirmed | 30-minute entry: MACD remains bullish, trend is strong, momentum is weakening | EMA5 > EMA8 > EMA13, bullish alignment | KDJ death cross, short-term bearish (K: 48.4, D: 50.0) | Volume surge (4.9x)
════════════════════
🔔 Follow for first-hand market alerts 🔔
#多周期共振 #SAMSUNG #MSFT
📌 When trading, pay attention to whether the candlestick pattern meets expectations
════════════════════
🔴 $SAMSUNG 30-minute bullish signal
⚠️ Technical analysis: 4-hour bullish confluence confirmed | 30-minute entry: MACD golden cross above zero, bullish momentum emerging | EMA5 > EMA8 > EMA13, bullish alignment | KDJ golden cross, short-term bullish (K: 80.4, D: 79.5) | Volume surge (4.1x)
📢 Market update: Alibaba, Tencent, and ByteDance seek long-term memory deals with Samsung and SK Hynix - The long-term memory deals highlight the intensifying global competition for AI infrastructure, potentially reshaping tech industry dynamics. The post...
════════════════════
🔴 $MSFT 30-minute bullish signal
⚠️ Technical analysis: 4-hour bullish confluence confirmed | 30-minute entry: MACD remains bullish, trend is strong, momentum is weakening | EMA5 > EMA8 > EMA13, bullish alignment | KDJ death cross, short-term bearish (K: 48.4, D: 50.0) | Volume surge (4.9x)
════════════════════
🔔 Follow for first-hand market alerts 🔔
#多周期共振 #SAMSUNG #MSFT
📌 When trading, pay attention to whether the candlestick pattern meets expectations
1
3
·
--
Article
SAMSUNG is up 3.5%, yet short liquidations outnumber long liquidations 170 to 1SAMSUNG is up about 3.5%, yet around $110,000 in shorts were liquidated, compared with only about $600 in longs—roughly 171 times more shorts.
Price context: Binance around 168.52 (+3.501%), OKX around 168.46 (+3.4385%). About 13 related liquidations.
Price is moving up, yet short liquidations exceed long liquidations by just over 170 times. This looks more like countertrend shorts getting squeezed than a long-side capitulation.
#SAMSUNG #TradFi #爆仓 #USStocks
171 to 1, with shorts getting wiped out first as prices rise—which do you find more convincing: a squeeze of highly leveraged shorts, or a sudden drain of liquidity from the order book?
View live: https://www.coinboss.com/tradfi-liquidations
SAMSUNG is up 3.5%, yet short liquidations outnumber long liquidations 170 to 1
SAMSUNG is up about 3.5%, yet around $110,000 in shorts were liquidated, compared with only about $600 in longs—roughly 171 times more shorts.
Price context: Binance around 168.52 (+3.501%), OKX around 168.46 (+3.4385%). About 13 related liquidations.
Price is moving up, yet short liquidations exceed long liquidations by just over 170 times. This looks more like countertrend shorts getting squeezed than a long-side capitulation.
#SAMSUNG #TradFi #爆仓 #USStocks
171 to 1, with shorts getting wiped out first as prices rise—which do you find more convincing: a squeeze of highly leveraged shorts, or a sudden drain of liquidity from the order book?
View live: https://www.coinboss.com/tradfi-liquidations
2
·
--
Article
SAMSUNG up just over 3.5 points, yet short liquidations were 66 times higher?SAMSUNG saw about $110,000 in short liquidations over the past 24 hours, versus only about $1,700 in long liquidations—a gap of nearly 66 times. The price? Around 167.30 on Binance (+3.636%) and 167.33 on OKX (+3.738%), up just over three and a half points.
Total open interest in futures is around $30.58 million. The gain wasn’t especially sharp, yet shorts were liquidated overwhelmingly more than longs—this looks more like a short squeeze cascade than a two-sided tug-of-war.
#SAMSUNG #TradFi #爆仓 #Samsung
A gain of just over three and a half points triggered 66 times more short liquidations. Do you think this was a cascade of high-leverage short positions getting squeezed, or is the short squeeze just getting started?
View live: https://www.coinboss.com/tradfi-liquidations
SAMSUNG up just over 3.5 points, yet short liquidations were 66 times higher?
SAMSUNG saw about $110,000 in short liquidations over the past 24 hours, versus only about $1,700 in long liquidations—a gap of nearly 66 times. The price? Around 167.30 on Binance (+3.636%) and 167.33 on OKX (+3.738%), up just over three and a half points.
Total open interest in futures is around $30.58 million. The gain wasn’t especially sharp, yet shorts were liquidated overwhelmingly more than longs—this looks more like a short squeeze cascade than a two-sided tug-of-war.
#SAMSUNG #TradFi #爆仓 #Samsung
A gain of just over three and a half points triggered 66 times more short liquidations. Do you think this was a cascade of high-leverage short positions getting squeezed, or is the short squeeze just getting started?
View live: https://www.coinboss.com/tradfi-liquidations
38

·
--
$SAMSUNG #SAMSUNG
Unusual Movement Alert: Long Alert | SAMSUNG
SAMSUNG 15m: 1h bullish activity detected; monitoring. 1h volume is starting to rise.
Key signals: 1h trading volume 10.0x / 4h trading volume 3.0x / strong 1h candle closing higher / 1h above EMA8/20 / GMMA bullish / 24h trading volume 124.2M
1h trading volume: 10.0x
24h trading volume: 124.2M USDT
Funding rate: +0.0069% (longs pay, shorts receive)
Score: 9/12
Key short-term level: Breakout at 170.64
Defense level: 163.93
Upside levels to watch: 185.33 / 202.18
Technical tracking; manage risk carefully.
231

·
--
$SAMSUNG RECLAIMS $196 AFTER DEFENDING CRITICAL ACCUMULATION ZONE! 🟢 🚀
Entry: $193 - $197 ⚡
Target: $202, $210, $220 🚀
Stop Loss: $187 ⚠️
After firmly holding the $180–$185 demand floor, $SAMSUNG is pushing back above $196 with clean momentum. 📌 Buyers stepped up right on schedule, absorbing sell-side pressure and shifting local market structure back in favor of the bulls.
⚡ Order flow is tilting heavy into the bid side as price expands toward upper resistance levels. 📊 If this reclaim holds solid, the runway toward $202 and beyond opens up quickly with minimal friction.
💡 Risk is sharply defined right below the structure at $187, keeping the risk-to-reward ratio stacked for disciplined momentum traders. 💬 Are you placing your bids on this reclaim or waiting for a retest? 👇
⚠️ Not financial advice. Always manage your risk. 🛡️
🏷️ #SAMSUNG #BTR #TUT #Crypto #Breakout
🔥 💎
19
💥 $SAMSUNG BREAKS RESISTANCE WITH FOUR STRAIGHT GREEN CANDLES AS VOLUME EXPLODES! 🚀
Entry: 198.80 - 199.20 ⚡
Target: 200.50 - 202.00 🚀
Four vertical green candles just sliced right through overhead resistance as aggressive buying volume erupts across the order book. 📊 Moving averages are stacked in a textbook bullish alignment, confirming deep market backing behind this expansion phase. ⚡
If buyers hold this breakout momentum above the reclaim level, price action is primed for a swift continuation toward major targets. 💡 Liquidity is stacking rapidly on the bid side as sellers yield control. 💬 Are you capturing this breakout velocity or waiting for a retest of support? 👇
⚠️ Not financial advice. Always manage your risk. 🛡️
🏷️ #SAMSUNG #LongSetup #Breakout #Crypto #Trading
⚡ 💎
12
Log in to explore more content
Join global crypto users on Binance Square
⚡️ Get latest and useful information about crypto.
💬 Trusted by the world’s largest crypto exchange.
👍 Discover real insights from verified creators.
Email / Phone number
Trending Topics
1
#CanMicrosoftDeliverOnAI
391,334 views
3,035 Discussing
2
#CanGoogleDefindItsCore
237,751 views
2,153 Discussing
3
#EarningsSeason
5.9M views
29,116 Discussing
4
#$10.9BBitcoinOptionsExpireFriday
991 views
53 Discussing
5
#ThailandSupremeCourtRulesBitcoinIsProperty
4,767 views
213 Discussing
6
#BitcoinSurpasses$81K
24,542 views
91 Discussing
7
#RobinhoodFalls8.4%AfterItsResults
15,974 views
313 Discussing
8
#KOSPISurges6.63%BackAbove6000
15,094 views
320 Discussing
9
#DatavaultAICantWithdrawBitcoinFromBiconomy
17,733 views
286 Discussing
10
#FOMCWatch
9.3M views
29,638 Discussing