
#marketanalysis2025
marketanalysis2025
353 views
9 Discussing
Hot
Latest

·
--
🚨 BITCOIN AT $80,800: PRE-ELECTION VOLATILITY INCOMING! 🚨
As we approach the opening bell for the week, Bitcoin is consolidating around $80,804 ahead of the U.S. Midterm Elections on November 3rd!
With the macro weekly chart holding strong above structural floors, market indecision is creating a massive liquidity sweep opportunity
Are you accumulation mode or expecting a deeper drop before Nov 3rd? Drop your bias below! 👇
#Bitcoin #CryptoTrading #MarketAnalysis2025 #SmartMoneyConceptsCrypto $BTC
{future}(BTCUSDT)
🚨 BITCOIN AT $80,800: PRE-ELECTION VOLATILITY INCOMING! 🚨
As we approach the opening bell for the week, Bitcoin is consolidating around $80,804 ahead of the U.S. Midterm Elections on November 3rd!
With the macro weekly chart holding strong above structural floors, market indecision is creating a massive liquidity sweep opportunity
Are you accumulation mode or expecting a deeper drop before Nov 3rd? Drop your bias below! 👇
#Bitcoin #CryptoTrading #MarketAnalysis2025 #SmartMoneyConceptsCrypto $BTC
As we approach the opening bell for the week, Bitcoin is consolidating around $80,804 ahead of the U.S. Midterm Elections on November 3rd!
With the macro weekly chart holding strong above structural floors, market indecision is creating a massive liquidity sweep opportunity
Are you accumulation mode or expecting a deeper drop before Nov 3rd? Drop your bias below! 👇
#Bitcoin #CryptoTrading #MarketAnalysis2025 #SmartMoneyConceptsCrypto $BTC
1
149

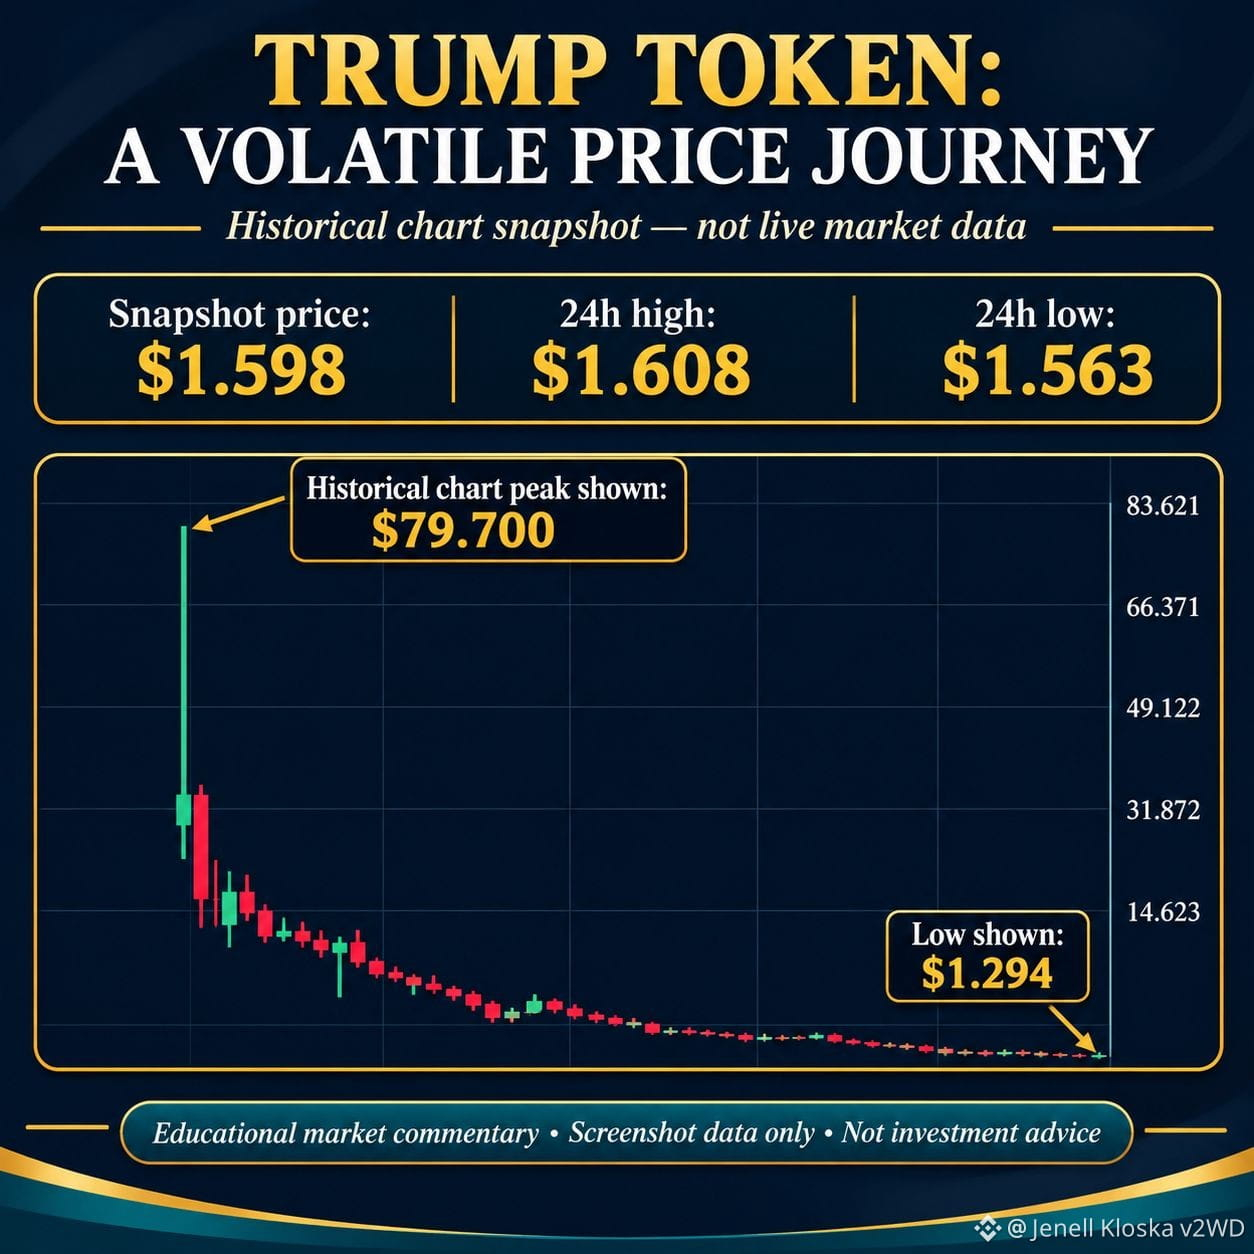
📊 TRUMP Token: A Volatile Price Journey
The TRUMP token chart highlights an interesting example of extreme cryptocurrency market volatility.
According to the supplied Binance screenshot:
📌 Snapshot Price: $1.598
📈 24H High: $1.608
📉 24H Low: $1.563
📊 24H TRUMP Volume: 14.18M
The historical chart shows a sharp initial price spike near $79.70, followed by a prolonged decline. The screenshot also shows a historical low near $1.294.
What Can We Learn?
Cryptocurrency prices can experience extreme volatility.
Historical price increases do not guarantee future gains.
Market volume and price trends should be studied carefully.
Risk awareness is important when learning about crypto markets.
Conclusion: The TRUMP chart is a reminder that cryptocurrency markets can change dramatically over time.
#BinanceSquare #TRUMP #CryptonewswithJack #CryptoMarket #MarketAnalysis2025 #Bitcoin❗ #CryptoEducationCZ
Disclaimer: This is educational commentary based on a supplied historical screenshot. Figures are not verified live prices and this is not financial advice.
📊 TRUMP Token: A Volatile Price Journey
The TRUMP token chart highlights an interesting example of extreme cryptocurrency market volatility.
According to the supplied Binance screenshot:
📌 Snapshot Price: $1.598
📈 24H High: $1.608
📉 24H Low: $1.563
📊 24H TRUMP Volume: 14.18M
The historical chart shows a sharp initial price spike near $79.70, followed by a prolonged decline. The screenshot also shows a historical low near $1.294.
What Can We Learn?
Cryptocurrency prices can experience extreme volatility.
Historical price increases do not guarantee future gains.
Market volume and price trends should be studied carefully.
Risk awareness is important when learning about crypto markets.
Conclusion: The TRUMP chart is a reminder that cryptocurrency markets can change dramatically over time.
#BinanceSquare #TRUMP #CryptonewswithJack #CryptoMarket #MarketAnalysis2025 #Bitcoin❗ #CryptoEducationCZ
Disclaimer: This is educational commentary based on a supplied historical screenshot. Figures are not verified live prices and this is not financial advice.
The TRUMP token chart highlights an interesting example of extreme cryptocurrency market volatility.
According to the supplied Binance screenshot:
📌 Snapshot Price: $1.598
📈 24H High: $1.608
📉 24H Low: $1.563
📊 24H TRUMP Volume: 14.18M
The historical chart shows a sharp initial price spike near $79.70, followed by a prolonged decline. The screenshot also shows a historical low near $1.294.
What Can We Learn?
Cryptocurrency prices can experience extreme volatility.
Historical price increases do not guarantee future gains.
Market volume and price trends should be studied carefully.
Risk awareness is important when learning about crypto markets.
Conclusion: The TRUMP chart is a reminder that cryptocurrency markets can change dramatically over time.
#BinanceSquare #TRUMP #CryptonewswithJack #CryptoMarket #MarketAnalysis2025 #Bitcoin❗ #CryptoEducationCZ
Disclaimer: This is educational commentary based on a supplied historical screenshot. Figures are not verified live prices and this is not financial advice.
289

·
--
IDOL Surges 65% — Is a Pullback Opportunity Developing?
IDOL is trading near $0.013998, up 65.13%, making it one of the strongest performers in the current market snapshot.
After such a sharp rally, chasing price at elevated levels can expose traders to significant volatility. A controlled pullback may offer a more favorable entry.
Trade Setup: Bullish Pullback
EP: $0.01350–$0.01370
TP1: $0.01400
TP2: $0.01430
TP3: $0.01460
SL: $0.01320
Market Structure & Liquidity Analysis
The $0.01350 region is the key support to monitor for a possible liquidity sweep and bullish reaction. A confirmed recovery could open the way toward the next resistance levels.
A sustained move below $0.01320 would invalidate the bullish setup. Avoid chasing the pump and wait for a controlled retest.
#IDOL #CryptoTrading #Altcoins #FuturesTrading #MarketAnalysis2025 #ASICHasReceivedNoPredictionMarketApplications $
IDOL Surges 65% — Is a Pullback Opportunity Developing?
IDOL is trading near $0.013998, up 65.13%, making it one of the strongest performers in the current market snapshot.
After such a sharp rally, chasing price at elevated levels can expose traders to significant volatility. A controlled pullback may offer a more favorable entry.
Trade Setup: Bullish Pullback
EP: $0.01350–$0.01370
TP1: $0.01400
TP2: $0.01430
TP3: $0.01460
SL: $0.01320
Market Structure & Liquidity Analysis
The $0.01350 region is the key support to monitor for a possible liquidity sweep and bullish reaction. A confirmed recovery could open the way toward the next resistance levels.
A sustained move below $0.01320 would invalidate the bullish setup. Avoid chasing the pump and wait for a controlled retest.
#IDOL #CryptoTrading #Altcoins #FuturesTrading #MarketAnalysis2025 #ASICHasReceivedNoPredictionMarketApplications $
IDOL is trading near $0.013998, up 65.13%, making it one of the strongest performers in the current market snapshot.
After such a sharp rally, chasing price at elevated levels can expose traders to significant volatility. A controlled pullback may offer a more favorable entry.
Trade Setup: Bullish Pullback
EP: $0.01350–$0.01370
TP1: $0.01400
TP2: $0.01430
TP3: $0.01460
SL: $0.01320
Market Structure & Liquidity Analysis
The $0.01350 region is the key support to monitor for a possible liquidity sweep and bullish reaction. A confirmed recovery could open the way toward the next resistance levels.
A sustained move below $0.01320 would invalidate the bullish setup. Avoid chasing the pump and wait for a controlled retest.
#IDOL #CryptoTrading #Altcoins #FuturesTrading #MarketAnalysis2025 #ASICHasReceivedNoPredictionMarketApplications $
160
·
--
#TwoAddressesHoldingAbout1.28BUSDTFrozen SOXLUSDT – Bearish Momentum Setup | Trading Analysis
SOXL is showing significant weakness near $86.22, down 14.08%. The sharp decline suggests strong selling pressure, but entering after a large drop can be risky.
EP: $86.50–$87.20
TP1: $85.00
TP2: $83.50
TP3: $82.00
SL: $88.80
A recovery toward the entry zone followed by seller rejection could provide a potential short opportunity. Watch the $85 support area for a liquidity sweep and buyer response. A strong recovery above $88.80 invalidates this setup.
My View: After a major decline, patience is essential. Let the market confirm its next direction.
#SOXL #SemiconductorStocks #SOXLUSDT #TradingSetup #MarketAnalysis2025 $
#TwoAddressesHoldingAbout1.28BUSDTFrozen SOXLUSDT – Bearish Momentum Setup | Trading Analysis
SOXL is showing significant weakness near $86.22, down 14.08%. The sharp decline suggests strong selling pressure, but entering after a large drop can be risky.
EP: $86.50–$87.20
TP1: $85.00
TP2: $83.50
TP3: $82.00
SL: $88.80
A recovery toward the entry zone followed by seller rejection could provide a potential short opportunity. Watch the $85 support area for a liquidity sweep and buyer response. A strong recovery above $88.80 invalidates this setup.
My View: After a major decline, patience is essential. Let the market confirm its next direction.
#SOXL #SemiconductorStocks #SOXLUSDT #TradingSetup #MarketAnalysis2025 $
SOXL is showing significant weakness near $86.22, down 14.08%. The sharp decline suggests strong selling pressure, but entering after a large drop can be risky.
EP: $86.50–$87.20
TP1: $85.00
TP2: $83.50
TP3: $82.00
SL: $88.80
A recovery toward the entry zone followed by seller rejection could provide a potential short opportunity. Watch the $85 support area for a liquidity sweep and buyer response. A strong recovery above $88.80 invalidates this setup.
My View: After a major decline, patience is essential. Let the market confirm its next direction.
#SOXL #SemiconductorStocks #SOXLUSDT #TradingSetup #MarketAnalysis2025 $
115

·
--
Bearish
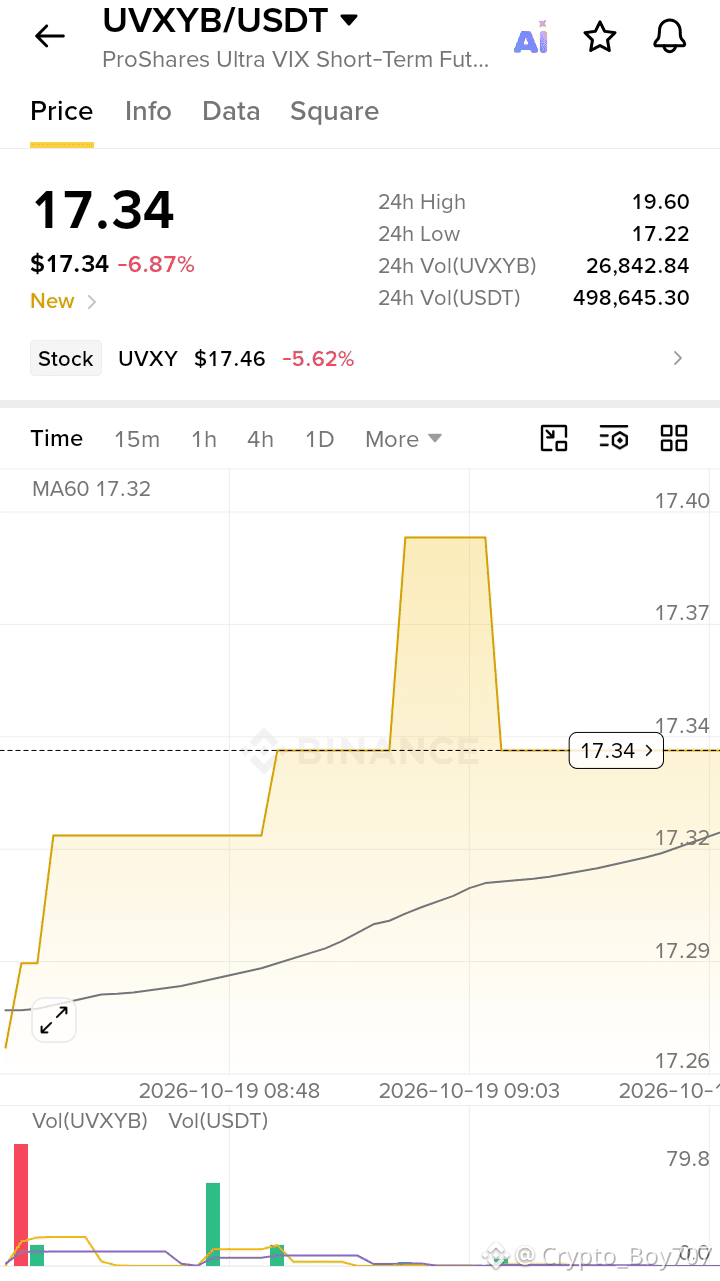
$UVXYB is priced at $17.34, down 6.87% in the last 24 hours. This decline highlights the importance of understanding volatility and market risk before making any trading decisions.
$UVXYB
{spot}(UVXYBUSDT)
#Write2Earrn #UVXYB #MarketAnalysis2025 #RiskManagementRocks
$UVXYB is priced at $17.34, down 6.87% in the last 24 hours. This decline highlights the importance of understanding volatility and market risk before making any trading decisions.
$UVXYB
#Write2Earrn #UVXYB #MarketAnalysis2025 #RiskManagementRocks
$UVXYB
#Write2Earrn #UVXYB #MarketAnalysis2025 #RiskManagementRocks
85

#BitcoinShortTermHoldersReach4.08MBTC
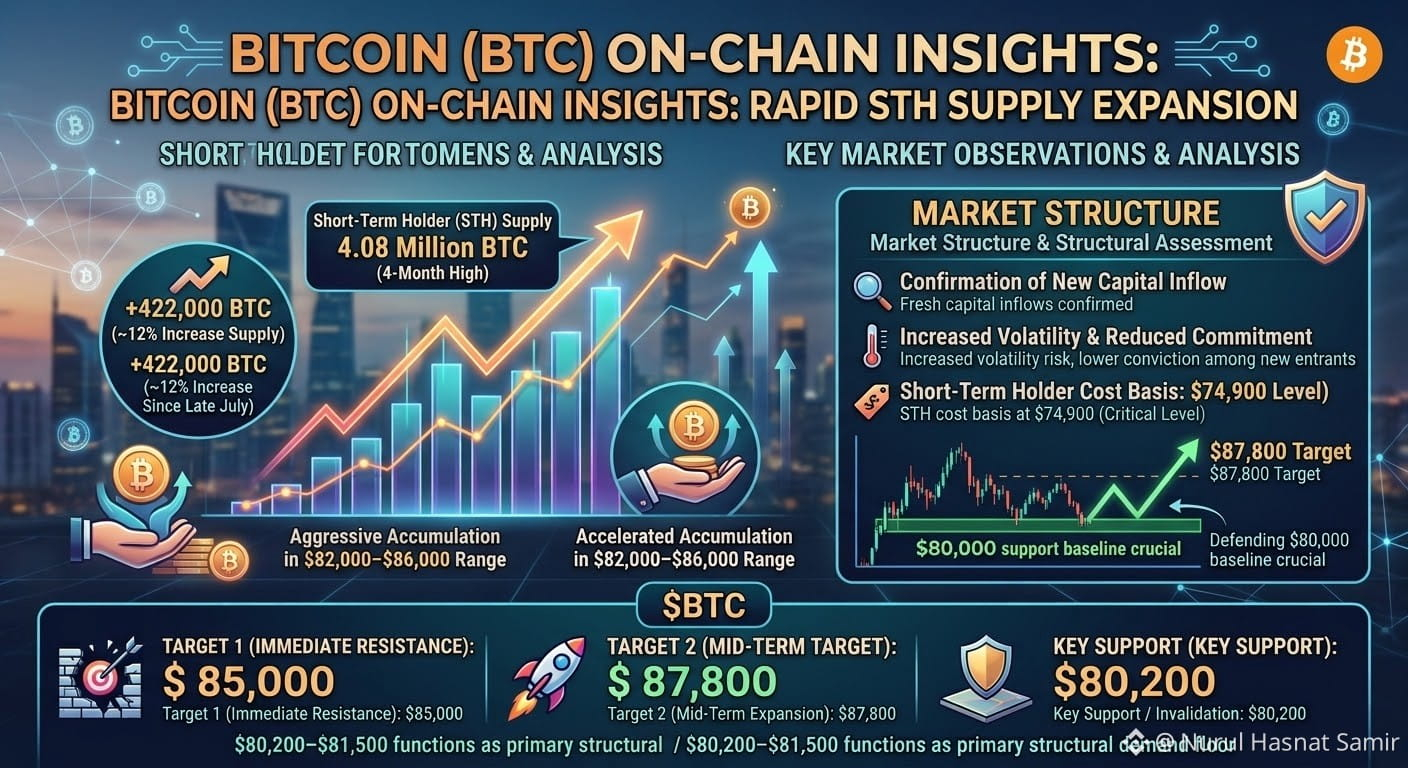
📊 Bitcoin On-Chain Insights: Rapid STH Supply Expansion Signals Volatility Ahead
On-chain metrics reveal a significant shift in market dynamics as Bitcoin Short-Term Holder (STH) supply reaches a fresh four-month high of 4.08 million BTC. Since late July, this cohort has added approximately 422,000 BTC (~12% increase), driven by aggressive buying within the $82,000–$86,000 price corridor.
🔍 Market Dynamics & Structural Risk Assessment
Fresh Capital Inflow: The uptick in STH balance confirms sustained short-term demand from both retail traders and institutional market entrants.
Elasticity & Volatility: Short-Term Holders generally exhibit lower conviction and higher sensitivity to price fluctuations compared to Long-Term Holders (LTH). As the overall market cost basis shifts upward, any sudden dip could narrow profit margins and trigger localized volatility.
Key Cost Basis Alignment: The aggregate STH realized price currently sits near $74,900. To prevent speculative stop-loss cascades and maintain bullish momentum, defending the critical $80,000 baseline remains paramount.
🎯 Key Technical Zones & Trade Benchmarks ($BTC)
Preserving the lower timeframe demand floor at $80,200–$81,500 is essential to prevent recent buyers from going underwater and to fuel the next leg up.
📍 Current Spot Price: ~$83,100
🛡️ Key Support / Invalidation: $80,200 (Critical demand floor to preserve bullish structure)
🎯 Target 1 (Immediate Resistance): $85,000 (Primary supply breakout barrier)
🚀 Target 2 (Mid-Term Target): $87,800 (Structural expansion zone)
$BTC
{spot}(BTCUSDT)
#bitcoin #onchaindata #cryptotrading #MarketAnalysis2025
#BitcoinShortTermHoldersReach4.08MBTC
📊 Bitcoin On-Chain Insights: Rapid STH Supply Expansion Signals Volatility Ahead
On-chain metrics reveal a significant shift in market dynamics as Bitcoin Short-Term Holder (STH) supply reaches a fresh four-month high of 4.08 million BTC. Since late July, this cohort has added approximately 422,000 BTC (~12% increase), driven by aggressive buying within the $82,000–$86,000 price corridor.
🔍 Market Dynamics & Structural Risk Assessment
Fresh Capital Inflow: The uptick in STH balance confirms sustained short-term demand from both retail traders and institutional market entrants.
Elasticity & Volatility: Short-Term Holders generally exhibit lower conviction and higher sensitivity to price fluctuations compared to Long-Term Holders (LTH). As the overall market cost basis shifts upward, any sudden dip could narrow profit margins and trigger localized volatility.
Key Cost Basis Alignment: The aggregate STH realized price currently sits near $74,900. To prevent speculative stop-loss cascades and maintain bullish momentum, defending the critical $80,000 baseline remains paramount.
🎯 Key Technical Zones & Trade Benchmarks ($BTC )
Preserving the lower timeframe demand floor at $80,200–$81,500 is essential to prevent recent buyers from going underwater and to fuel the next leg up.
📍 Current Spot Price: ~$83,100
🛡️ Key Support / Invalidation: $80,200 (Critical demand floor to preserve bullish structure)
🎯 Target 1 (Immediate Resistance): $85,000 (Primary supply breakout barrier)
🚀 Target 2 (Mid-Term Target): $87,800 (Structural expansion zone)
$BTC
#bitcoin #onchaindata #cryptotrading #MarketAnalysis2025
📊 Bitcoin On-Chain Insights: Rapid STH Supply Expansion Signals Volatility Ahead
On-chain metrics reveal a significant shift in market dynamics as Bitcoin Short-Term Holder (STH) supply reaches a fresh four-month high of 4.08 million BTC. Since late July, this cohort has added approximately 422,000 BTC (~12% increase), driven by aggressive buying within the $82,000–$86,000 price corridor.
🔍 Market Dynamics & Structural Risk Assessment
Fresh Capital Inflow: The uptick in STH balance confirms sustained short-term demand from both retail traders and institutional market entrants.
Elasticity & Volatility: Short-Term Holders generally exhibit lower conviction and higher sensitivity to price fluctuations compared to Long-Term Holders (LTH). As the overall market cost basis shifts upward, any sudden dip could narrow profit margins and trigger localized volatility.
Key Cost Basis Alignment: The aggregate STH realized price currently sits near $74,900. To prevent speculative stop-loss cascades and maintain bullish momentum, defending the critical $80,000 baseline remains paramount.
🎯 Key Technical Zones & Trade Benchmarks ($BTC )
Preserving the lower timeframe demand floor at $80,200–$81,500 is essential to prevent recent buyers from going underwater and to fuel the next leg up.
📍 Current Spot Price: ~$83,100
🛡️ Key Support / Invalidation: $80,200 (Critical demand floor to preserve bullish structure)
🎯 Target 1 (Immediate Resistance): $85,000 (Primary supply breakout barrier)
🚀 Target 2 (Mid-Term Target): $87,800 (Structural expansion zone)
$BTC
#bitcoin #onchaindata #cryptotrading #MarketAnalysis2025
2
122
Log in to explore more content
Join global crypto users on Binance Square
⚡️ Get latest and useful information about crypto.
💬 Trusted by the world’s largest crypto exchange.
👍 Discover real insights from verified creators.
Email / Phone number
Trending Topics
1
#USMidterms-WhatAreMarketsExpecting?
131 views
51 Discussing
2
#USOctoberNFP-AreRateCutsStillPossible
192,238 views
1,431 Discussing
3
#AMDBeatsExpectations-AINarrativeContinues
122 views
33 Discussing
4
#BinanceIncidentReport
107,931 views
955 Discussing
5
#BinanceReopensWithdrawalsForMoreAssets
246,740 views
2,069 Discussing
6
#BinanceHourlyDepositsExceedWithdrawals
110,770 views
1,021 Discussing
7
#SouthKoreaRulingPartyLeaderSeeksCryptoTaxDelay
89 views
8 Discussing
8
#BhutanGelephuCentralBankApprovedToHoldDigitalAssets
7 views
2 Discussing
9
#MorganStanleyAmongFirstBanksToUseDTCCTokenization
751 views
34 Discussing
10
#NasdaqRises0.8%AsChipStocksRebound
529 views
21 Discussing