
#lrcx
lrcx
24,329 views
162 Discussing
Hot
Latest

$LRCX SHORT
A trend on the sellers’ side, maintaining control over the current values.
If local pressure persists, quotes may continue moving lower.
➡️Entry point: 294.95
💰Target 1: 294.0414518 (+0.31%)
💰Target 2: 292.9929036 (+0.66%)
💰Target 3: 291.42008131 (+1.20%)
⛔️Stop: 296.6628223 (-0.58%)
⚠️ This is not financial advice. Trade at your own risk. DYOR.
#LRCX #BANKUSDT #EVAAUSDT 📈
$LRCX
$LRCX SHORT
A trend on the sellers’ side, maintaining control over the current values.
If local pressure persists, quotes may continue moving lower.
➡️Entry point: 294.95
💰Target 1: 294.0414518 (+0.31%)
💰Target 2: 292.9929036 (+0.66%)
💰Target 3: 291.42008131 (+1.20%)
⛔️Stop: 296.6628223 (-0.58%)
⚠️ This is not financial advice. Trade at your own risk. DYOR.
#LRCX #BANKUSDT #EVAAUSDT 📈
$LRCX
A trend on the sellers’ side, maintaining control over the current values.
If local pressure persists, quotes may continue moving lower.
➡️Entry point: 294.95
💰Target 1: 294.0414518 (+0.31%)
💰Target 2: 292.9929036 (+0.66%)
💰Target 3: 291.42008131 (+1.20%)
⛔️Stop: 296.6628223 (-0.58%)
⚠️ This is not financial advice. Trade at your own risk. DYOR.
#LRCX #BANKUSDT #EVAAUSDT 📈
$LRCX
26

·
--
$LRCX 24 hours down 3.47%, price 287.25, but the funding rate has dropped to zero; open positions 1542.70 have not fallen significantly. When price falls while the funding rate turns to zero, it marks a silent truce zone between bulls and bears. The last time the funding rate went to zero was in mid-April, after which the market chose a downward direction. The fact that the current positions have not been withdrawn suggests that the long side’s costs are still being absorbed, but the zeroing of the funding rate weakens the ongoing squeeze momentum from the short side. If the price cannot quickly reclaim above 290, this batch of positions will become a stop-loss wall. I’ll wait until the funding rate clearly turns negative or the price breaks below 280 before considering entering a short. I’m observing from the sidelines for now.
Trading tag: #TradFi #链上美股 #LRCX
Where do you think this set of assumptions is most likely to be wrong?
$LRCX 24 hours down 3.47%, price 287.25, but the funding rate has dropped to zero; open positions 1542.70 have not fallen significantly. When price falls while the funding rate turns to zero, it marks a silent truce zone between bulls and bears. The last time the funding rate went to zero was in mid-April, after which the market chose a downward direction. The fact that the current positions have not been withdrawn suggests that the long side’s costs are still being absorbed, but the zeroing of the funding rate weakens the ongoing squeeze momentum from the short side. If the price cannot quickly reclaim above 290, this batch of positions will become a stop-loss wall. I’ll wait until the funding rate clearly turns negative or the price breaks below 280 before considering entering a short. I’m observing from the sidelines for now.
Trading tag: #TradFi #链上美股 #LRCX
Where do you think this set of assumptions is most likely to be wrong?
Trading tag: #TradFi #链上美股 #LRCX
Where do you think this set of assumptions is most likely to be wrong?
24
·
--
$LRCX The past 24 hours saw a 3.47% drop to 287.25, but the contract funding rate remains at 0. Prices are falling while the funding rate has not turned negative—this is a subtle signal.
This suggests that the downward momentum may not be driven by active suppression from futures short positions. A neutral funding rate indicates that the open positions are either watching from the sidelines or closing out more aggressively than they are opening new shorts. Combined with the ratio of open interest at 1542.7 to the 24-hour trading volume, it suggests market leverage is not heavy, and the groundwork for a panic-driven cascade of sell-offs is weak.
Trading tag: #TradFi #链上美股 #LRCX
Where do you think this assessment is most likely to be wrong?
$LRCX The past 24 hours saw a 3.47% drop to 287.25, but the contract funding rate remains at 0. Prices are falling while the funding rate has not turned negative—this is a subtle signal.
This suggests that the downward momentum may not be driven by active suppression from futures short positions. A neutral funding rate indicates that the open positions are either watching from the sidelines or closing out more aggressively than they are opening new shorts. Combined with the ratio of open interest at 1542.7 to the 24-hour trading volume, it suggests market leverage is not heavy, and the groundwork for a panic-driven cascade of sell-offs is weak.
Trading tag: #TradFi #链上美股 #LRCX
Where do you think this assessment is most likely to be wrong?
This suggests that the downward momentum may not be driven by active suppression from futures short positions. A neutral funding rate indicates that the open positions are either watching from the sidelines or closing out more aggressively than they are opening new shorts. Combined with the ratio of open interest at 1542.7 to the 24-hour trading volume, it suggests market leverage is not heavy, and the groundwork for a panic-driven cascade of sell-offs is weak.
Trading tag: #TradFi #链上美股 #LRCX
Where do you think this assessment is most likely to be wrong?
4

·
--
[M1_mag7]
$LRCX 24 hours dropped 5.785%. Price is 297.69. The funding rate is -0.014%, with shorts paying longs. Price is still falling, but OI is only 1248 and on-chain liquidity is average; sell pressure may be driven by Mag7 sector correlation dragging it down. Old dog’s take: negative funding during a downtrend is a signal that shorts are absorbing orders—prone to a short squeeze, but the lack of a bounce now suggests hedging flows or a trend where shorts are dominant.
Trading tag: #BinanceFutures #TradFi #USDⓈM #LRCX #LRCXUSDT $LRCX
[M1_mag7]
$LRCX 24 hours dropped 5.785%. Price is 297.69. The funding rate is -0.014%, with shorts paying longs. Price is still falling, but OI is only 1248 and on-chain liquidity is average; sell pressure may be driven by Mag7 sector correlation dragging it down. Old dog’s take: negative funding during a downtrend is a signal that shorts are absorbing orders—prone to a short squeeze, but the lack of a bounce now suggests hedging flows or a trend where shorts are dominant.
Trading tag: #BinanceFutures #TradFi #USDⓈM #LRCX #LRCXUSDT $LRCX
$LRCX 24 hours dropped 5.785%. Price is 297.69. The funding rate is -0.014%, with shorts paying longs. Price is still falling, but OI is only 1248 and on-chain liquidity is average; sell pressure may be driven by Mag7 sector correlation dragging it down. Old dog’s take: negative funding during a downtrend is a signal that shorts are absorbing orders—prone to a short squeeze, but the lack of a bounce now suggests hedging flows or a trend where shorts are dominant.
Trading tag: #BinanceFutures #TradFi #USDⓈM #LRCX #LRCXUSDT $LRCX
7

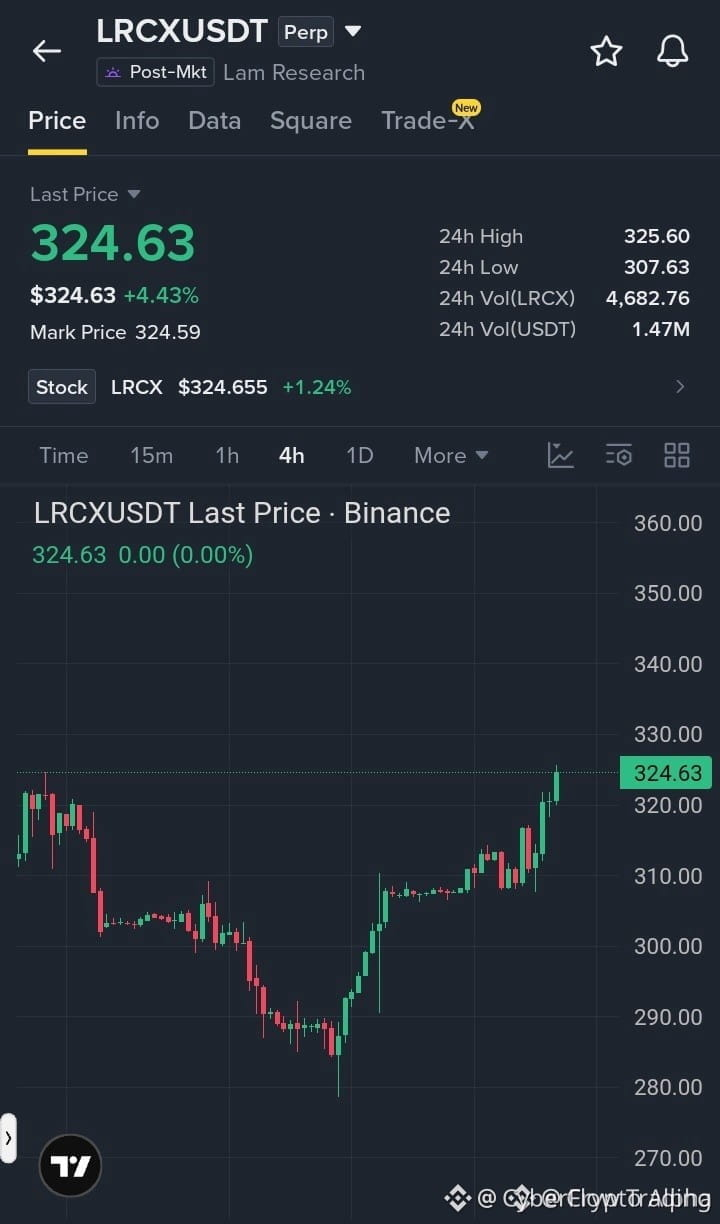
🚀 $LRCX CRUSHES RESISTANCE, EYES $325.60 HIGH! 📈
Entry: 320.00-324.50 ⚡
Target: 330.00 / 340.00 / 350.00 🚀
Stop Loss: 313.00 ⚠️
📊 Buyers have anchored the $310‑$315 support zone and thrust $LRCX up to $324.63, flirting with the 24‑hour high. The 4H chart strings together higher highs and higher lows, a clear liquidity sweep that screams smart‑money aggression. 🦈 Volume is roaring as the price nudges the $325.60 ceiling, primed for a fresh rally. ⚡
💬 Are you loading up before the next breakout or waiting for a pull‑back to lock in tighter risk? 👇
⚠️ Not financial advice. Always manage your risk. 🛡️
🏷️ #LRCX #LongSetup #Breakout #Crypto
🔥 💎
🚀 $LRCX CRUSHES RESISTANCE, EYES $325.60 HIGH! 📈
Entry: 320.00-324.50 ⚡
Target: 330.00 / 340.00 / 350.00 🚀
Stop Loss: 313.00 ⚠️
📊 Buyers have anchored the $310‑$315 support zone and thrust $LRCX up to $324.63, flirting with the 24‑hour high. The 4H chart strings together higher highs and higher lows, a clear liquidity sweep that screams smart‑money aggression. 🦈 Volume is roaring as the price nudges the $325.60 ceiling, primed for a fresh rally. ⚡
💬 Are you loading up before the next breakout or waiting for a pull‑back to lock in tighter risk? 👇
⚠️ Not financial advice. Always manage your risk. 🛡️
🏷️ #LRCX #LongSetup #Breakout #Crypto
🔥 💎
Entry: 320.00-324.50 ⚡
Target: 330.00 / 340.00 / 350.00 🚀
Stop Loss: 313.00 ⚠️
📊 Buyers have anchored the $310‑$315 support zone and thrust $LRCX up to $324.63, flirting with the 24‑hour high. The 4H chart strings together higher highs and higher lows, a clear liquidity sweep that screams smart‑money aggression. 🦈 Volume is roaring as the price nudges the $325.60 ceiling, primed for a fresh rally. ⚡
💬 Are you loading up before the next breakout or waiting for a pull‑back to lock in tighter risk? 👇
⚠️ Not financial advice. Always manage your risk. 🛡️
🏷️ #LRCX #LongSetup #Breakout #Crypto
🔥 💎
10

·
--
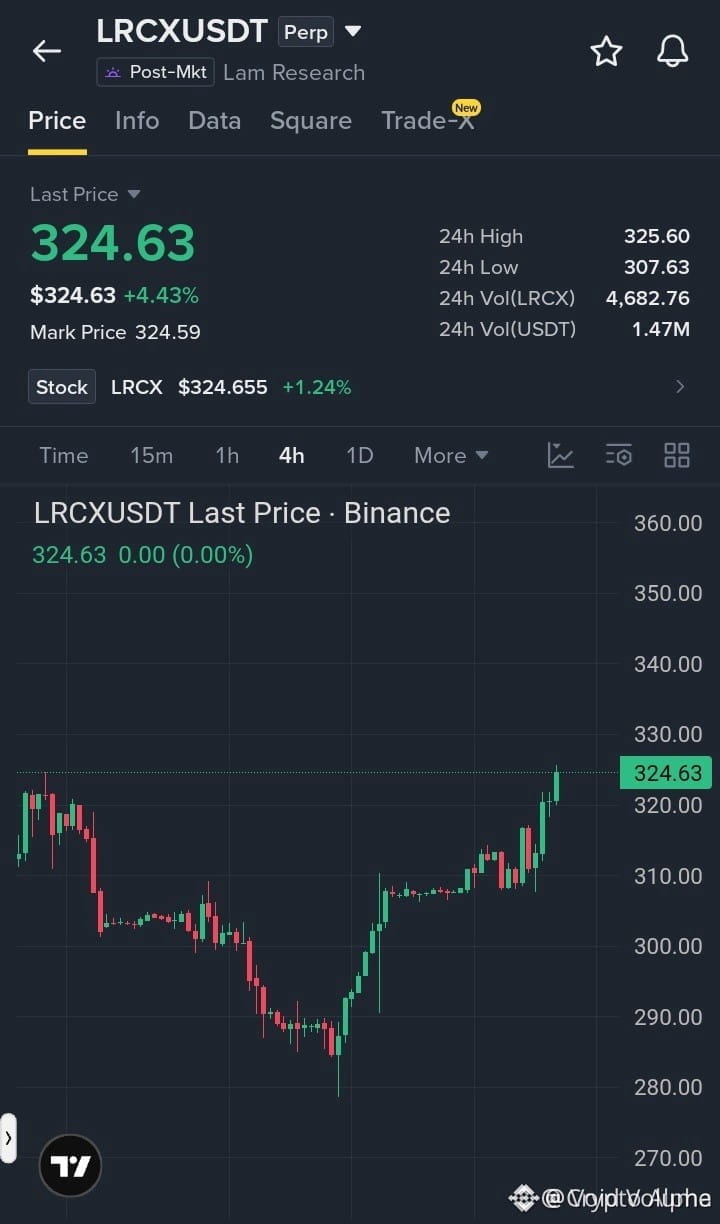
🚀 $LRCX BREAKING THROUGH $325 RESISTANCE WITH HARD MOMENTUM! 🟢
Entry: 320.00-324.50 ⚡
Target: 330.00 🚀
Target: 340.00 🚀
Target: 350.00 🚀
Stop Loss: 313.00 ⚠️
📊 The 4H chart is painting a textbook higher‑high, higher‑low sequence, confirming that smart money is firmly in control above the $310‑$315 demand zone. 🦈 Volume spikes accompany each retest, indicating aggressive liquidity absorption as price nudges the $325.60 24H high. 📈 Buyers are stacking orders, turning the recent $285 pullback into a crisp accumulation phase.
💡 With a tiered TP ladder and a tight SL under the last swing low, the risk‑to‑reward profile is compelling for a swing‑long. 🤔 Are you ready to ride this institutional thrust or waiting for the next liquidity hunt? 👇
⚠️ Not financial advice. Always manage your risk. 🛡️
🏷️ #LRCX #LongSetup #Breakout #Crypto
🔥 💎
🚀 $LRCX BREAKING THROUGH $325 RESISTANCE WITH HARD MOMENTUM! 🟢
Entry: 320.00-324.50 ⚡
Target: 330.00 🚀
Target: 340.00 🚀
Target: 350.00 🚀
Stop Loss: 313.00 ⚠️
📊 The 4H chart is painting a textbook higher‑high, higher‑low sequence, confirming that smart money is firmly in control above the $310‑$315 demand zone. 🦈 Volume spikes accompany each retest, indicating aggressive liquidity absorption as price nudges the $325.60 24H high. 📈 Buyers are stacking orders, turning the recent $285 pullback into a crisp accumulation phase.
💡 With a tiered TP ladder and a tight SL under the last swing low, the risk‑to‑reward profile is compelling for a swing‑long. 🤔 Are you ready to ride this institutional thrust or waiting for the next liquidity hunt? 👇
⚠️ Not financial advice. Always manage your risk. 🛡️
🏷️ #LRCX #LongSetup #Breakout #Crypto
🔥 💎
Entry: 320.00-324.50 ⚡
Target: 330.00 🚀
Target: 340.00 🚀
Target: 350.00 🚀
Stop Loss: 313.00 ⚠️
📊 The 4H chart is painting a textbook higher‑high, higher‑low sequence, confirming that smart money is firmly in control above the $310‑$315 demand zone. 🦈 Volume spikes accompany each retest, indicating aggressive liquidity absorption as price nudges the $325.60 24H high. 📈 Buyers are stacking orders, turning the recent $285 pullback into a crisp accumulation phase.
💡 With a tiered TP ladder and a tight SL under the last swing low, the risk‑to‑reward profile is compelling for a swing‑long. 🤔 Are you ready to ride this institutional thrust or waiting for the next liquidity hunt? 👇
⚠️ Not financial advice. Always manage your risk. 🛡️
🏷️ #LRCX #LongSetup #Breakout #Crypto
🔥 💎
9


·
--
Bullish
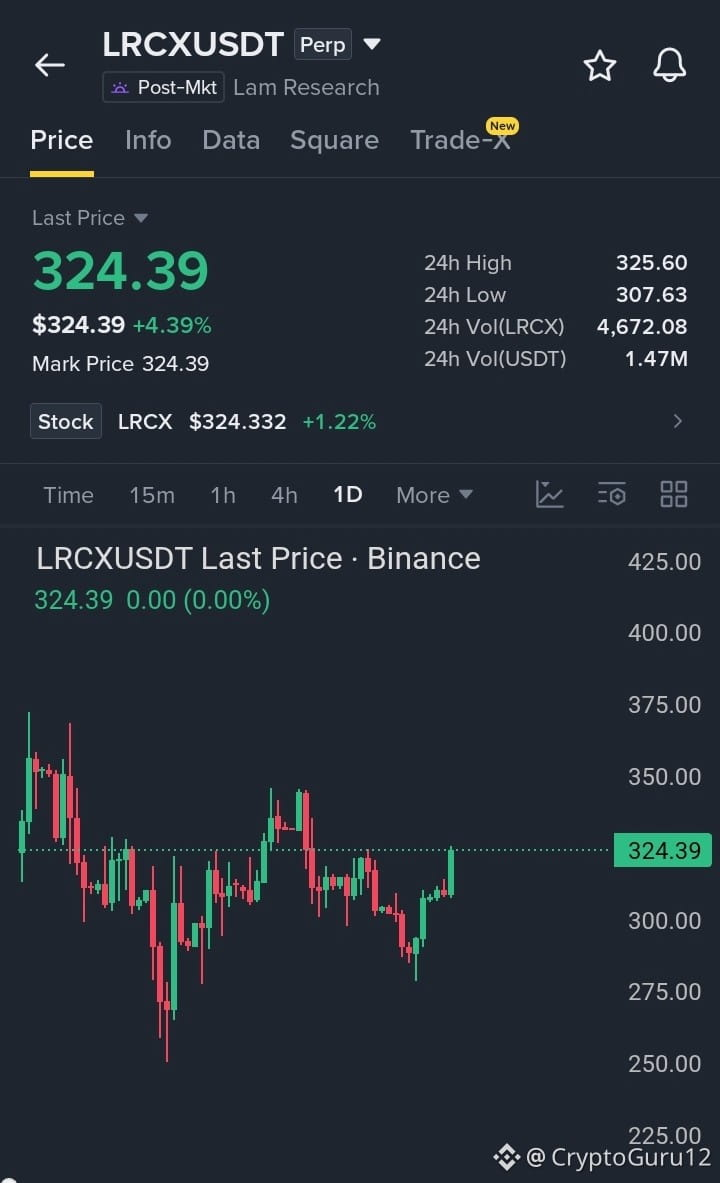
$LRCX ... Buyers Are Reclaiming Key Resistance
#LRCX is showing a strong recovery on the 1D chart, with price pushing back toward the 325 resistance zone. A clean breakout above 326 could trigger another leg higher toward the next major resistance levels.
Entry: 318–325
TP1: 335
TP2: 345
TP3: 350
SL: 307
Long setup — wait for confirmation above resistance and keep risk controlled.
{future}(LRCXUSDT)
$ZEC
{future}(ZECUSDT)
$SOPH
{future}(SOPHUSDT)
$LRCX ... Buyers Are Reclaiming Key Resistance
#LRCX is showing a strong recovery on the 1D chart, with price pushing back toward the 325 resistance zone. A clean breakout above 326 could trigger another leg higher toward the next major resistance levels.
Entry: 318–325
TP1: 335
TP2: 345
TP3: 350
SL: 307
Long setup — wait for confirmation above resistance and keep risk controlled.
$ZEC
$SOPH
#LRCX is showing a strong recovery on the 1D chart, with price pushing back toward the 325 resistance zone. A clean breakout above 326 could trigger another leg higher toward the next major resistance levels.
Entry: 318–325
TP1: 335
TP2: 345
TP3: 350
SL: 307
Long setup — wait for confirmation above resistance and keep risk controlled.
$ZEC
$SOPH
1
223

·
--
Bullish
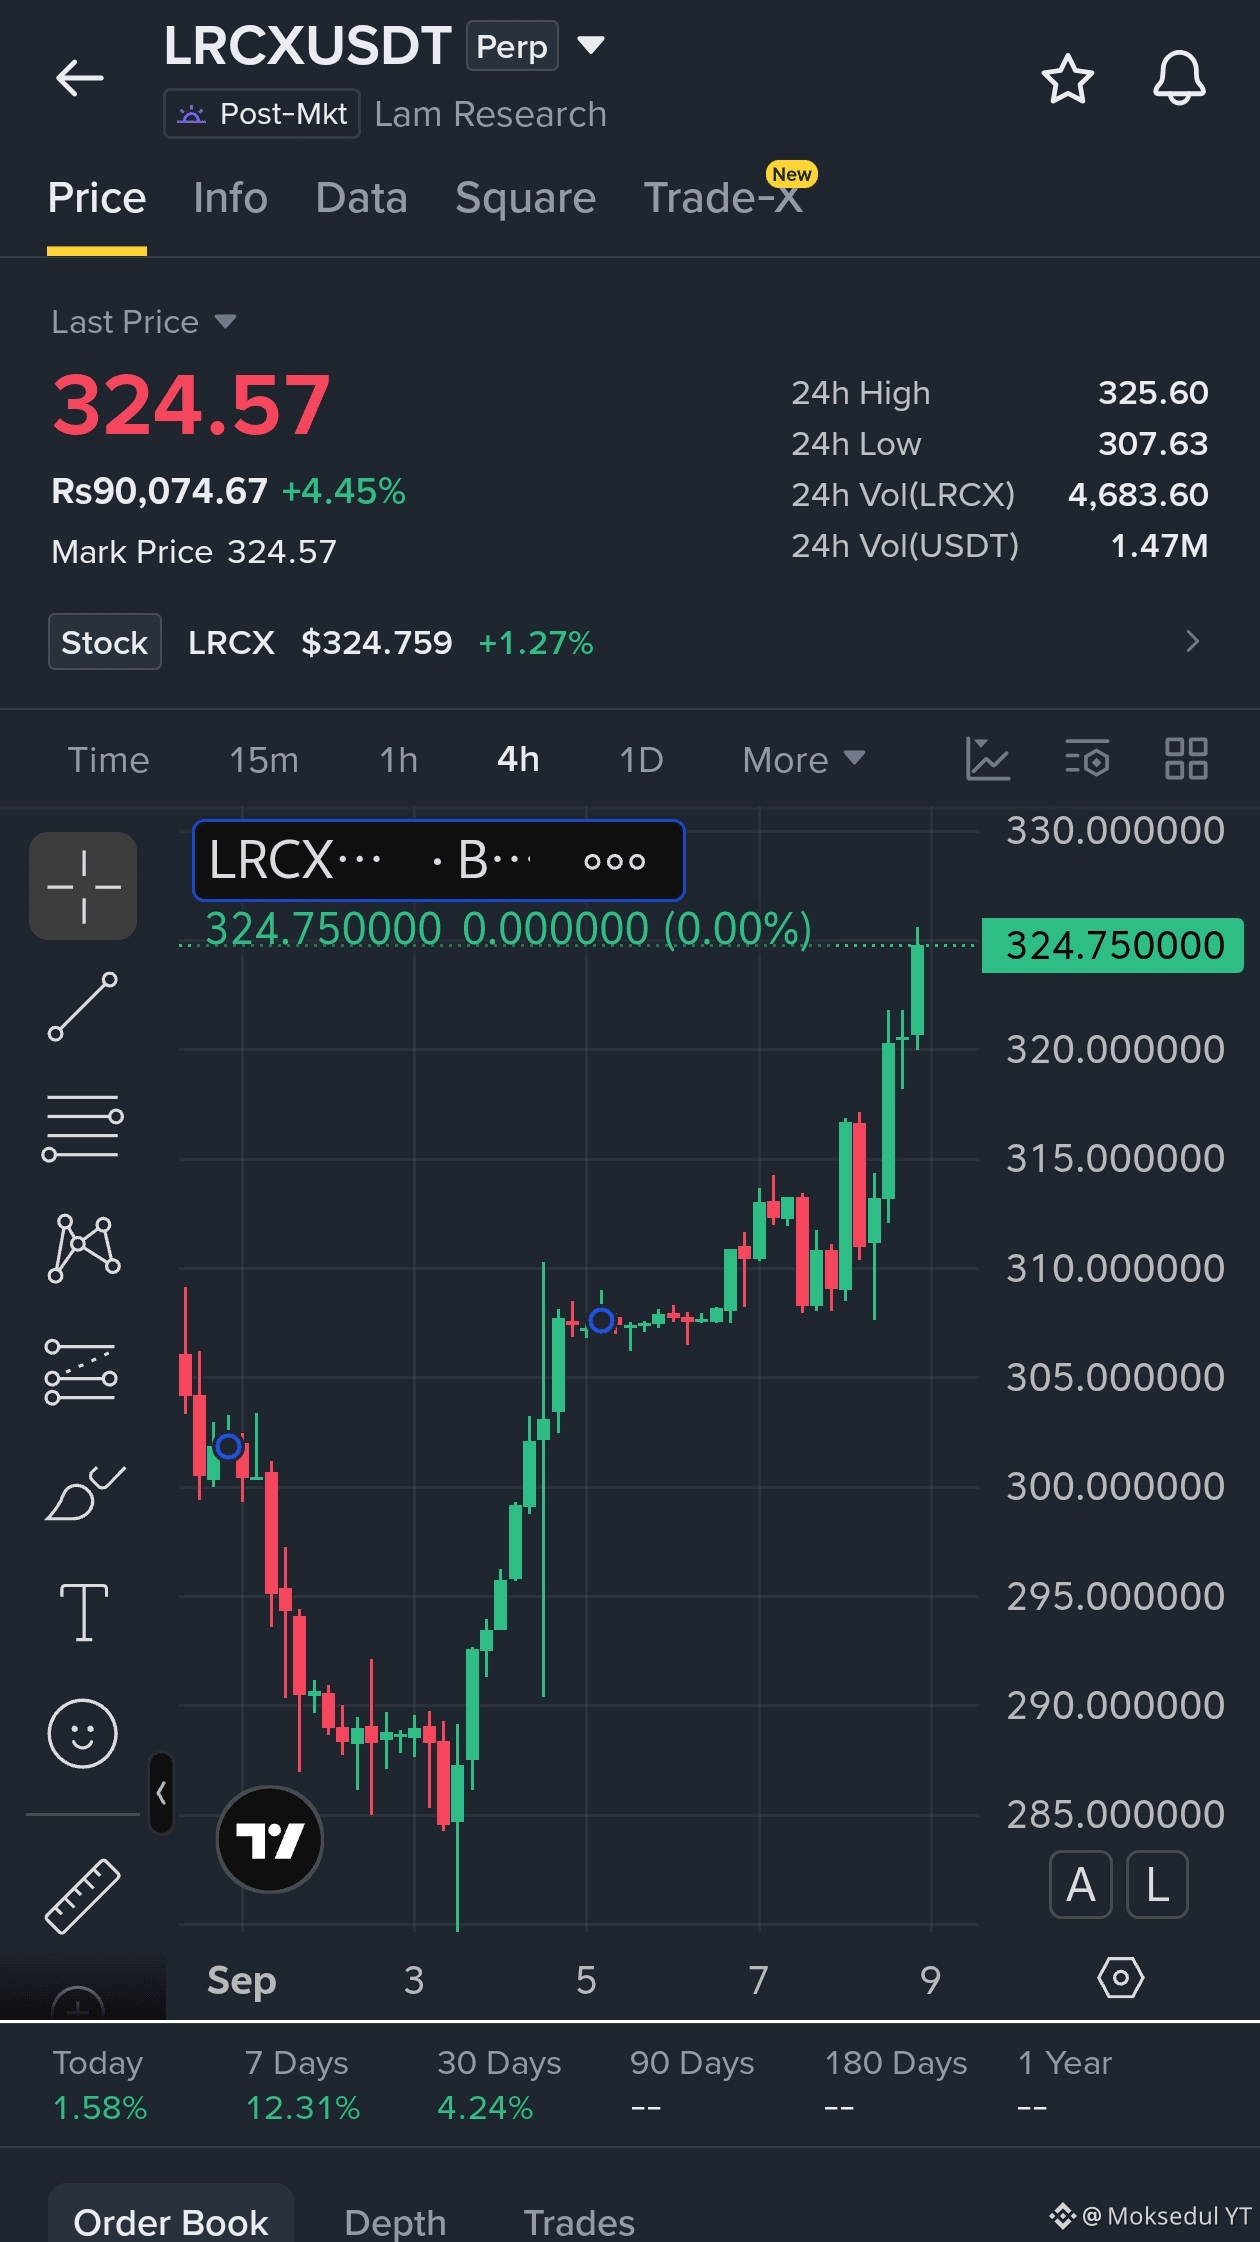
$LRCX ... Bullish Breakout Setup
#LRCX has broken above the consolidation zone and is now trading near $324.57. Price is showing strength after a strong rally from the $307.63 low.
A confirmed move above $325.60 would open the door for further upside.
Entry: $322.00–$324.57
TP1: $326.00
TP2: $330.00
TP3: $335.00
SL: $318.00
Buy and Trade
{future}(LRCXUSDT)
$ZEC
{future}(ZECUSDT)
$BULLA
{future}(BULLAUSDT)
$LRCX ... Bullish Breakout Setup
#LRCX has broken above the consolidation zone and is now trading near $324.57. Price is showing strength after a strong rally from the $307.63 low.
A confirmed move above $325.60 would open the door for further upside.
Entry: $322.00–$324.57
TP1: $326.00
TP2: $330.00
TP3: $335.00
SL: $318.00
Buy and Trade
$ZEC
$BULLA
#LRCX has broken above the consolidation zone and is now trading near $324.57. Price is showing strength after a strong rally from the $307.63 low.
A confirmed move above $325.60 would open the door for further upside.
Entry: $322.00–$324.57
TP1: $326.00
TP2: $330.00
TP3: $335.00
SL: $318.00
Buy and Trade
$ZEC
$BULLA
dabak-0:
❤️❤️
2
3
759

·
--
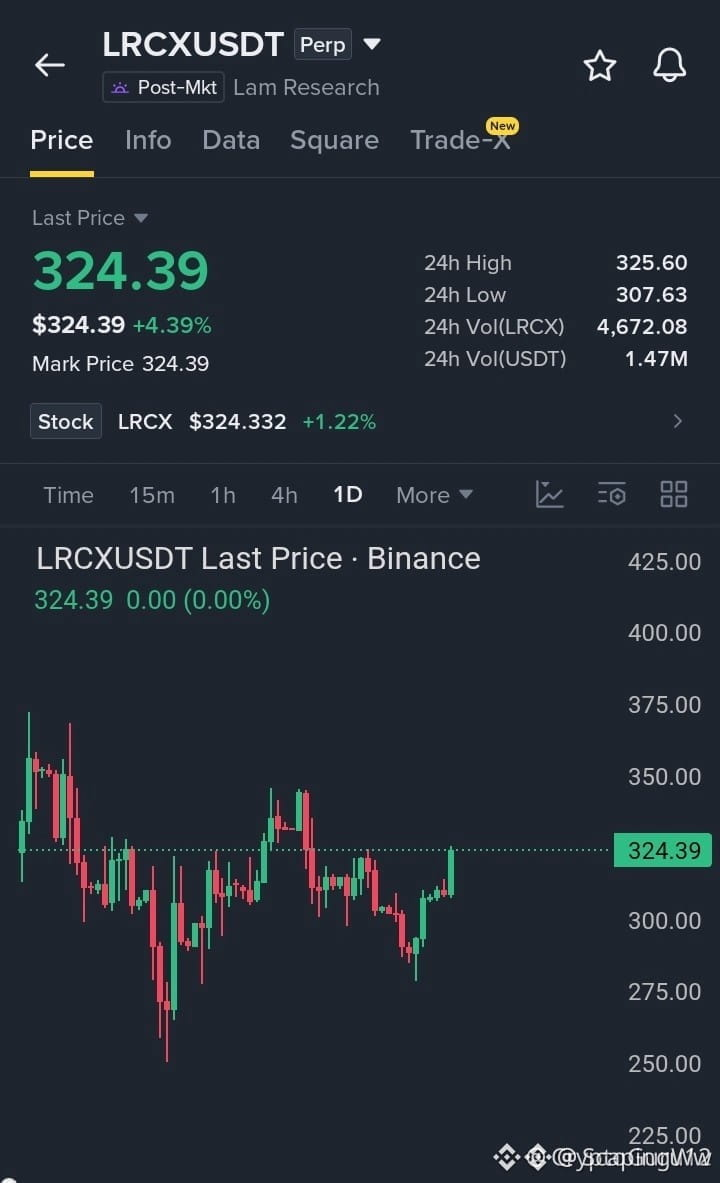
🚀 $LRCX RECLAIMS RESISTANCE, SETTING SIGHT ON 335 BREAKOUT! 🟢
Entry: 318-325 ⚡
Target: 335 🚀
Stop Loss: 307 ⚠️
🦈 Buyers are ripping the 1D chart back into the 325‑zone, swallowing the last sell‑wall like a shark on a blood trail. 📊 The clean break above 326 is the green light for a fresh rally, with volume screaming upside on the daily.
🎯 Our entry window sits between 318 and 325, tight enough to catch the flip but wide enough to ride the wave. Targets at 335, 345 and 350 line up with the next resistance buckets, while a 307 stop caps the downside. 💬 Are you ready to jump in as the price cracks the 326 ceiling? 👇
⚠️ Not financial advice. Always manage your risk. 🛡️
🏷️ #LRCX #LongSetup #Breakout #Crypto
🔥 💎
🚀 $LRCX RECLAIMS RESISTANCE, SETTING SIGHT ON 335 BREAKOUT! 🟢
Entry: 318-325 ⚡
Target: 335 🚀
Stop Loss: 307 ⚠️
🦈 Buyers are ripping the 1D chart back into the 325‑zone, swallowing the last sell‑wall like a shark on a blood trail. 📊 The clean break above 326 is the green light for a fresh rally, with volume screaming upside on the daily.
🎯 Our entry window sits between 318 and 325, tight enough to catch the flip but wide enough to ride the wave. Targets at 335, 345 and 350 line up with the next resistance buckets, while a 307 stop caps the downside. 💬 Are you ready to jump in as the price cracks the 326 ceiling? 👇
⚠️ Not financial advice. Always manage your risk. 🛡️
🏷️ #LRCX #LongSetup #Breakout #Crypto
🔥 💎
Entry: 318-325 ⚡
Target: 335 🚀
Stop Loss: 307 ⚠️
🦈 Buyers are ripping the 1D chart back into the 325‑zone, swallowing the last sell‑wall like a shark on a blood trail. 📊 The clean break above 326 is the green light for a fresh rally, with volume screaming upside on the daily.
🎯 Our entry window sits between 318 and 325, tight enough to catch the flip but wide enough to ride the wave. Targets at 335, 345 and 350 line up with the next resistance buckets, while a 307 stop caps the downside. 💬 Are you ready to jump in as the price cracks the 326 ceiling? 👇
⚠️ Not financial advice. Always manage your risk. 🛡️
🏷️ #LRCX #LongSetup #Breakout #Crypto
🔥 💎
7

·
--
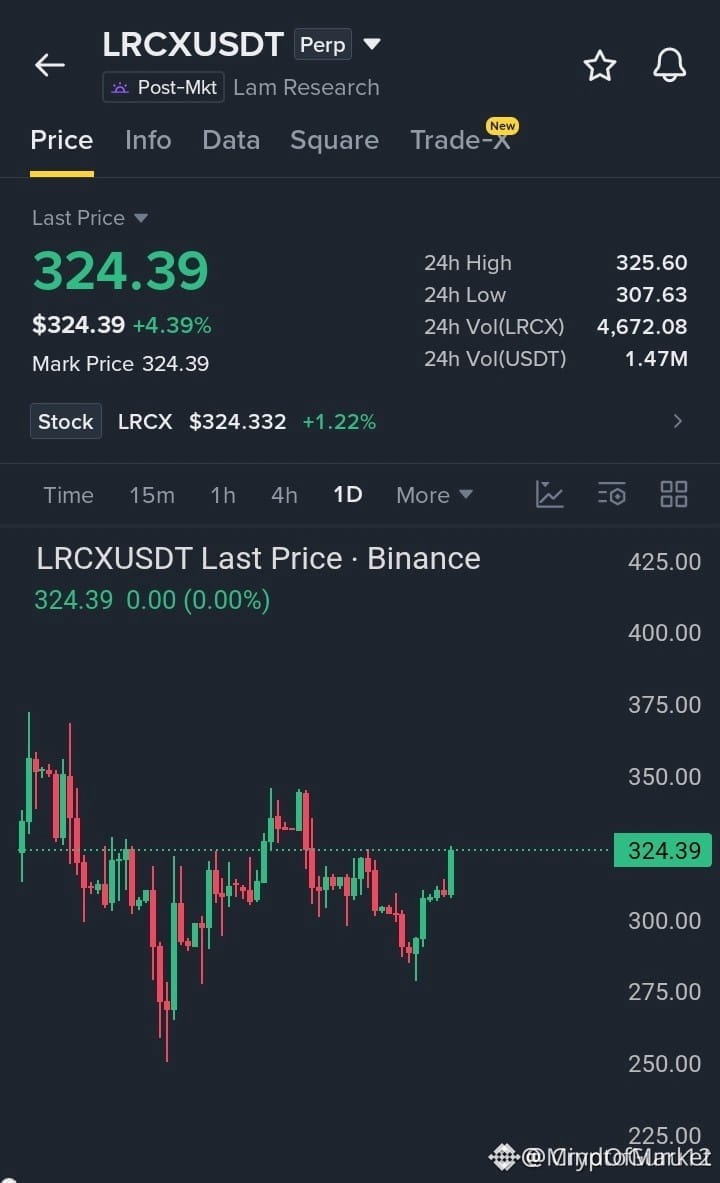
🚀 $LRCX RECLAIMS RESISTANCE, PREPARES FOR NEXT LEG UP! 💥
Entry: 318-325 ⚡
Target: 335/345/350 🚀
Stop Loss: 307 ⚠️
📊 The 1D chart shows smart‑money liquidity being absorbed as price re‑takes the 325 zone, a classic order‑block retest. 🦈 Buyers are re‑establishing control, and the breakout candle above 326 would signal the next institutional thrust. ⚡ A clean move past this level unlocks the 335 target, with further upside to 345 and 350 as the market seeks fresh supply. 📌 Keep risk tight; the SL at 307 protects against a sudden liquidity sweep.
💬 Are you poised to join the reclaim and ride the next upward thrust? 👇
⚠️ Not financial advice. Always manage your risk. 🛡️
🏷️ #LRCX #LongSetup #Breakout #Crypto
🚀 💎
🚀 $LRCX RECLAIMS RESISTANCE, PREPARES FOR NEXT LEG UP! 💥
Entry: 318-325 ⚡
Target: 335/345/350 🚀
Stop Loss: 307 ⚠️
📊 The 1D chart shows smart‑money liquidity being absorbed as price re‑takes the 325 zone, a classic order‑block retest. 🦈 Buyers are re‑establishing control, and the breakout candle above 326 would signal the next institutional thrust. ⚡ A clean move past this level unlocks the 335 target, with further upside to 345 and 350 as the market seeks fresh supply. 📌 Keep risk tight; the SL at 307 protects against a sudden liquidity sweep.
💬 Are you poised to join the reclaim and ride the next upward thrust? 👇
⚠️ Not financial advice. Always manage your risk. 🛡️
🏷️ #LRCX #LongSetup #Breakout #Crypto
🚀 💎
Entry: 318-325 ⚡
Target: 335/345/350 🚀
Stop Loss: 307 ⚠️
📊 The 1D chart shows smart‑money liquidity being absorbed as price re‑takes the 325 zone, a classic order‑block retest. 🦈 Buyers are re‑establishing control, and the breakout candle above 326 would signal the next institutional thrust. ⚡ A clean move past this level unlocks the 335 target, with further upside to 345 and 350 as the market seeks fresh supply. 📌 Keep risk tight; the SL at 307 protects against a sudden liquidity sweep.
💬 Are you poised to join the reclaim and ride the next upward thrust? 👇
⚠️ Not financial advice. Always manage your risk. 🛡️
🏷️ #LRCX #LongSetup #Breakout #Crypto
🚀 💎
1

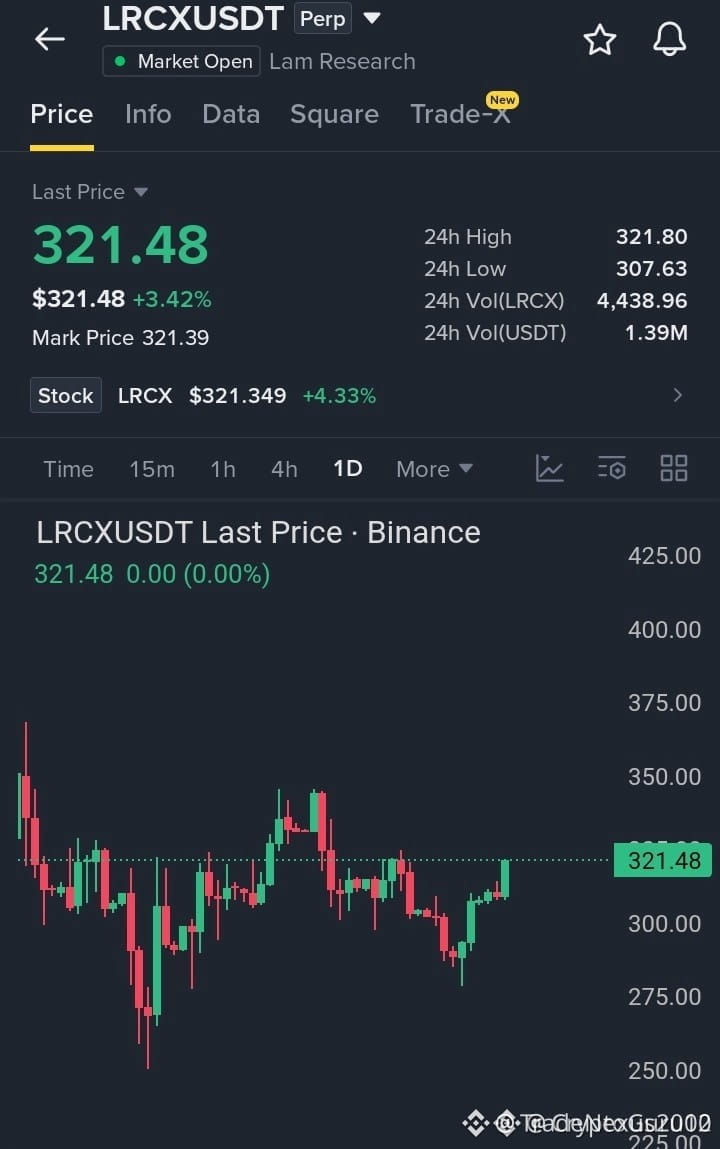
🚨 $LRCX RECLAIMS RESISTANCE, SETTING SIGHT ON 350 RUN! 💥
Entry: 318-322 ⚡
Target: 330 / 340 / 350 🚀
Stop Loss: 309 ⚠️
📊 Buyers have freshly absorbed liquidity around the 285‑300 zone and now thrust $LRCX back above 320, a classic smart‑money reclamation. 🦈 The order block at 318‑322 is now acting as a fresh demand spring, and volume on the 4H chart is expanding with each bullish tick. ⚡ Momentum indicators are turning positive, suggesting a clean continuation toward the 330‑350 corridor. 💡 The risk‑to‑reward profile remains attractive for disciplined longs.
💬 Are you sizing in at the 318‑322 range or waiting for a tighter retest? 👇
⚠️ Not financial advice. Always manage your risk. 🛡️
🏷️ #LRCX #LongSetup #Liquidity #Crypto
🚀 💎
🚨 $LRCX RECLAIMS RESISTANCE, SETTING SIGHT ON 350 RUN! 💥
Entry: 318-322 ⚡
Target: 330 / 340 / 350 🚀
Stop Loss: 309 ⚠️
📊 Buyers have freshly absorbed liquidity around the 285‑300 zone and now thrust $LRCX back above 320, a classic smart‑money reclamation. 🦈 The order block at 318‑322 is now acting as a fresh demand spring, and volume on the 4H chart is expanding with each bullish tick. ⚡ Momentum indicators are turning positive, suggesting a clean continuation toward the 330‑350 corridor. 💡 The risk‑to‑reward profile remains attractive for disciplined longs.
💬 Are you sizing in at the 318‑322 range or waiting for a tighter retest? 👇
⚠️ Not financial advice. Always manage your risk. 🛡️
🏷️ #LRCX #LongSetup #Liquidity #Crypto
🚀 💎
Entry: 318-322 ⚡
Target: 330 / 340 / 350 🚀
Stop Loss: 309 ⚠️
📊 Buyers have freshly absorbed liquidity around the 285‑300 zone and now thrust $LRCX back above 320, a classic smart‑money reclamation. 🦈 The order block at 318‑322 is now acting as a fresh demand spring, and volume on the 4H chart is expanding with each bullish tick. ⚡ Momentum indicators are turning positive, suggesting a clean continuation toward the 330‑350 corridor. 💡 The risk‑to‑reward profile remains attractive for disciplined longs.
💬 Are you sizing in at the 318‑322 range or waiting for a tighter retest? 👇
⚠️ Not financial advice. Always manage your risk. 🛡️
🏷️ #LRCX #LongSetup #Liquidity #Crypto
🚀 💎

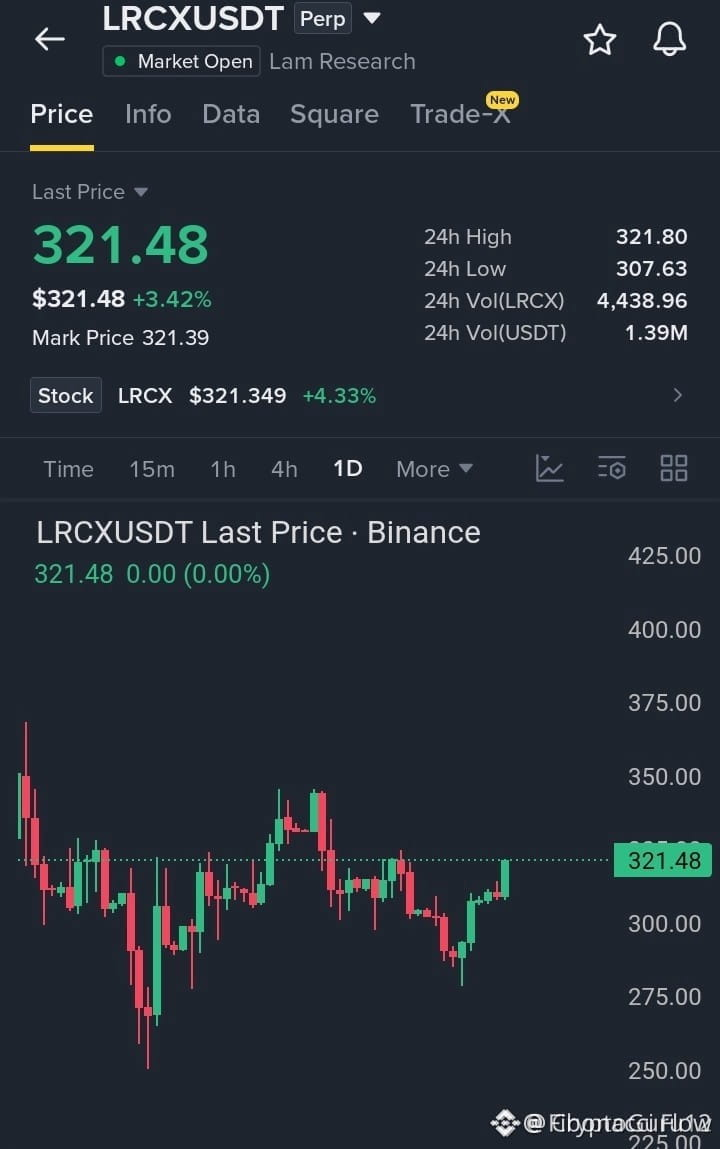
🚀 $LRCX RECLAIMS RESISTANCE, SETTING SIGHT ON $350 RALLY! 🟢
Entry: 318‑322 ⚡
Target: 330‑350 🚀
Stop Loss: 309 ⚠️
🦈 Buyers are snapping up the 320‑zone like a fresh order block, flushing out lingering sell pressure from the 285‑300 cradle. 📊 Volume spikes on the 4H are flashing green, and the RSI is edging past the 55‑mark, signaling a clean momentum lift. ⚡ A breach above 322 could catapult the token into the 340‑350 corridor, where liquidity pools await hungry whales.
💬 Who’s ready to lock in the next wave of upside before the next liquidity sweep? 👇
⚠️ Not financial advice. Always manage your risk. 🛡️
🏷️ #LRCX #LongSetup #Momentum #Crypto #Breakout
🔥 💎
🚀 $LRCX RECLAIMS RESISTANCE, SETTING SIGHT ON $350 RALLY! 🟢
Entry: 318‑322 ⚡
Target: 330‑350 🚀
Stop Loss: 309 ⚠️
🦈 Buyers are snapping up the 320‑zone like a fresh order block, flushing out lingering sell pressure from the 285‑300 cradle. 📊 Volume spikes on the 4H are flashing green, and the RSI is edging past the 55‑mark, signaling a clean momentum lift. ⚡ A breach above 322 could catapult the token into the 340‑350 corridor, where liquidity pools await hungry whales.
💬 Who’s ready to lock in the next wave of upside before the next liquidity sweep? 👇
⚠️ Not financial advice. Always manage your risk. 🛡️
🏷️ #LRCX #LongSetup #Momentum #Crypto #Breakout
🔥 💎
Entry: 318‑322 ⚡
Target: 330‑350 🚀
Stop Loss: 309 ⚠️
🦈 Buyers are snapping up the 320‑zone like a fresh order block, flushing out lingering sell pressure from the 285‑300 cradle. 📊 Volume spikes on the 4H are flashing green, and the RSI is edging past the 55‑mark, signaling a clean momentum lift. ⚡ A breach above 322 could catapult the token into the 340‑350 corridor, where liquidity pools await hungry whales.
💬 Who’s ready to lock in the next wave of upside before the next liquidity sweep? 👇
⚠️ Not financial advice. Always manage your risk. 🛡️
🏷️ #LRCX #LongSetup #Momentum #Crypto #Breakout
🔥 💎
9
·
--
Bullish
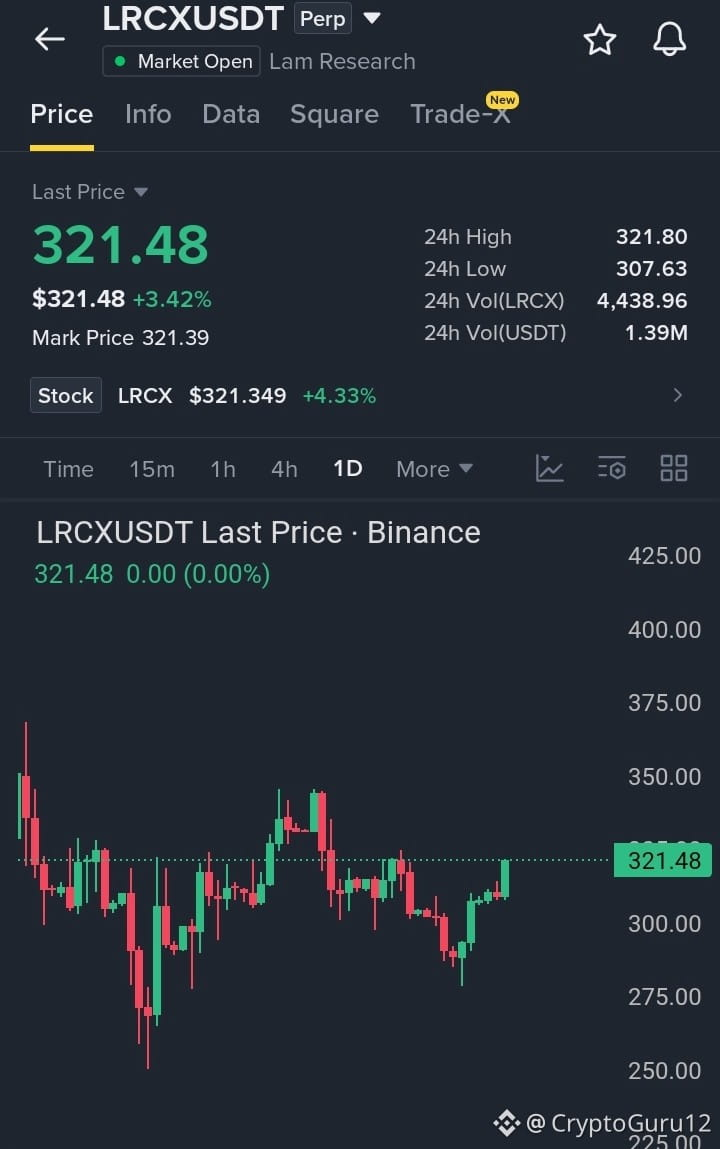
$LRCX ... Buyers Are Reclaiming Key Resistance
#LRCX is pushing back above the 320 area after holding the recent 285–300 support zone. Momentum is improving, and a clean continuation above this level could open the way toward the next resistance zones.
Entry: 318 – 322
Targets: 330 / 340 / 350
SL: 309
Long
{future}(LRCXUSDT)
with proper risk management.
$ZEC
{future}(ZECUSDT)
$SOPH
{future}(SOPHUSDT)
$LRCX ... Buyers Are Reclaiming Key Resistance
#LRCX is pushing back above the 320 area after holding the recent 285–300 support zone. Momentum is improving, and a clean continuation above this level could open the way toward the next resistance zones.
Entry: 318 – 322
Targets: 330 / 340 / 350
SL: 309
Long
with proper risk management.
$ZEC
$SOPH
#LRCX is pushing back above the 320 area after holding the recent 285–300 support zone. Momentum is improving, and a clean continuation above this level could open the way toward the next resistance zones.
Entry: 318 – 322
Targets: 330 / 340 / 350
SL: 309
Long
with proper risk management.
$ZEC
$SOPH
2
497
·
--
[M1_mag7]
$LRCX 24 hours, it’s risen 5 points, with the price quoted at 323.79. On-chain contract open interest is 1397.81, and the funding rate has dropped to zero. A zero funding rate means longs and shorts are currently evenly matched—neither side is paying the other. This balance appears after a single-day 5% upside move, suggesting the rally didn’t trigger a clear squeeze of shorts, and longs haven’t rushed to add positions.
Old dog took a look from this angle: in Mag7, today the on-chain liquidity of the semiconductor equipment leader is kind of interesting. Zero funding rate combined with a sizable rise usually points to one of two possibilities: either the move is driven by natural buying pressure from the spot market, and the derivatives market hasn’t reacted yet; or longs are watching and haven’t dared to keep stacking positions at the current level. Given that the move in $LCRX isn’t small and the funding rate remains completely unchanged, I lean toward the first scenario. This rally may not have reached the stage where derivatives traders collectively chase it with FOMO, and the positioning structure hasn’t broken down yet.
My view is that a spot-driven push is usually healthier than a leverage-driven one. If the price can hold above 320, I’ll take a small long position on a pullback in the 320–322 range. The strongest counterpoint is this: the moment the funding rate turns positive—even just 0.01%—it would mean longs have started paying shorts, and the upward momentum could quickly fade.
Trading tag: #BinanceFutures #TradFi #USDⓈM #LRCX #LRCXUSDT $LRCX
[M1_mag7]
$LRCX 24 hours, it’s risen 5 points, with the price quoted at 323.79. On-chain contract open interest is 1397.81, and the funding rate has dropped to zero. A zero funding rate means longs and shorts are currently evenly matched—neither side is paying the other. This balance appears after a single-day 5% upside move, suggesting the rally didn’t trigger a clear squeeze of shorts, and longs haven’t rushed to add positions.
Old dog took a look from this angle: in Mag7, today the on-chain liquidity of the semiconductor equipment leader is kind of interesting. Zero funding rate combined with a sizable rise usually points to one of two possibilities: either the move is driven by natural buying pressure from the spot market, and the derivatives market hasn’t reacted yet; or longs are watching and haven’t dared to keep stacking positions at the current level. Given that the move in $LCRX isn’t small and the funding rate remains completely unchanged, I lean toward the first scenario. This rally may not have reached the stage where derivatives traders collectively chase it with FOMO, and the positioning structure hasn’t broken down yet.
My view is that a spot-driven push is usually healthier than a leverage-driven one. If the price can hold above 320, I’ll take a small long position on a pullback in the 320–322 range. The strongest counterpoint is this: the moment the funding rate turns positive—even just 0.01%—it would mean longs have started paying shorts, and the upward momentum could quickly fade.
Trading tag: #BinanceFutures #TradFi #USDⓈM #LRCX #LRCXUSDT $LRCX
$LRCX 24 hours, it’s risen 5 points, with the price quoted at 323.79. On-chain contract open interest is 1397.81, and the funding rate has dropped to zero. A zero funding rate means longs and shorts are currently evenly matched—neither side is paying the other. This balance appears after a single-day 5% upside move, suggesting the rally didn’t trigger a clear squeeze of shorts, and longs haven’t rushed to add positions.
Old dog took a look from this angle: in Mag7, today the on-chain liquidity of the semiconductor equipment leader is kind of interesting. Zero funding rate combined with a sizable rise usually points to one of two possibilities: either the move is driven by natural buying pressure from the spot market, and the derivatives market hasn’t reacted yet; or longs are watching and haven’t dared to keep stacking positions at the current level. Given that the move in $LCRX isn’t small and the funding rate remains completely unchanged, I lean toward the first scenario. This rally may not have reached the stage where derivatives traders collectively chase it with FOMO, and the positioning structure hasn’t broken down yet.
My view is that a spot-driven push is usually healthier than a leverage-driven one. If the price can hold above 320, I’ll take a small long position on a pullback in the 320–322 range. The strongest counterpoint is this: the moment the funding rate turns positive—even just 0.01%—it would mean longs have started paying shorts, and the upward momentum could quickly fade.
Trading tag: #BinanceFutures #TradFi #USDⓈM #LRCX #LRCXUSDT $LRCX
4
·
--
$LRCX reports 313.77, up 2.19% over the last 24 hours. Funding is 0, and long/short positioning is temporarily balanced. Political and policy risks such as tariffs or regulatory changes could alter the market; for now, the market is choosing to wait and see, with no extreme one-sided bets. OI 1418.15 shows a slight increase in positioning; if subsequent policy news turns bearish, the price may test the 300 support level. I plan to open a small long position around 310, with a stop-loss at 305, keeping total exposure under 3%. If the price breaks below 300 or funding turns negative, I will consider the setup immediately invalid.
Trading tag: #TradFi #链上美股 #LRCX
Where do you think this set of assumptions is most likely to be wrong?
$LRCX reports 313.77, up 2.19% over the last 24 hours. Funding is 0, and long/short positioning is temporarily balanced. Political and policy risks such as tariffs or regulatory changes could alter the market; for now, the market is choosing to wait and see, with no extreme one-sided bets. OI 1418.15 shows a slight increase in positioning; if subsequent policy news turns bearish, the price may test the 300 support level. I plan to open a small long position around 310, with a stop-loss at 305, keeping total exposure under 3%. If the price breaks below 300 or funding turns negative, I will consider the setup immediately invalid.
Trading tag: #TradFi #链上美股 #LRCX
Where do you think this set of assumptions is most likely to be wrong?
Trading tag: #TradFi #链上美股 #LRCX
Where do you think this set of assumptions is most likely to be wrong?
4
·
--
$LRCX 24 hours rose 2.19% to 313.77, with the funding rate at 0.
The move is mild, and the funding rate is flat, suggesting there are no strong one-way bets. With policy noise during an election year, valuation anchors for semiconductor equipment stocks are becoming unclear—neither bulls nor bears can find strong reasons to push. Trading volume and open interest are also staying at average levels.
The market is waiting for clearer policy signals, such as the specific tariff list for China or the implementation timeline for chip subsidies. Until those signals appear, this low-volatility consolidation may continue.
Trading tag: #TradFi #链上美股 #LRCX
Where do you think this assessment is most likely to be wrong?
$LRCX 24 hours rose 2.19% to 313.77, with the funding rate at 0.
The move is mild, and the funding rate is flat, suggesting there are no strong one-way bets. With policy noise during an election year, valuation anchors for semiconductor equipment stocks are becoming unclear—neither bulls nor bears can find strong reasons to push. Trading volume and open interest are also staying at average levels.
The market is waiting for clearer policy signals, such as the specific tariff list for China or the implementation timeline for chip subsidies. Until those signals appear, this low-volatility consolidation may continue.
Trading tag: #TradFi #链上美股 #LRCX
Where do you think this assessment is most likely to be wrong?
The move is mild, and the funding rate is flat, suggesting there are no strong one-way bets. With policy noise during an election year, valuation anchors for semiconductor equipment stocks are becoming unclear—neither bulls nor bears can find strong reasons to push. Trading volume and open interest are also staying at average levels.
The market is waiting for clearer policy signals, such as the specific tariff list for China or the implementation timeline for chip subsidies. Until those signals appear, this low-volatility consolidation may continue.
Trading tag: #TradFi #链上美股 #LRCX
Where do you think this assessment is most likely to be wrong?
4
·
--
$LRCX 24 hours up 2.192%, price 313.77, but the funding rate is unchanged at 0, and the open position size is only 1,418 lots. This round of gains is independent of the semiconductor sector. The driving force may not be industry fundamentals, but rather the market’s anticipation of a supply-chain reshuffle in advance as geopolitical tensions are being priced in. The key is whether the U.S. tightens export controls on equipment to China, which will directly determine where order flow goes. If the next round of policy statements are mild, the current upside lacks support and the price will quickly fall back. I will cut my loss if it breaks below $300; otherwise, I’ll hold and wait for a policy catalyst.
Trading tag: #TradFi #链上美股 #LRCX
Where do you think this assessment is most likely to be wrong?
$LRCX 24 hours up 2.192%, price 313.77, but the funding rate is unchanged at 0, and the open position size is only 1,418 lots. This round of gains is independent of the semiconductor sector. The driving force may not be industry fundamentals, but rather the market’s anticipation of a supply-chain reshuffle in advance as geopolitical tensions are being priced in. The key is whether the U.S. tightens export controls on equipment to China, which will directly determine where order flow goes. If the next round of policy statements are mild, the current upside lacks support and the price will quickly fall back. I will cut my loss if it breaks below $300; otherwise, I’ll hold and wait for a policy catalyst.
Trading tag: #TradFi #链上美股 #LRCX
Where do you think this assessment is most likely to be wrong?
Trading tag: #TradFi #链上美股 #LRCX
Where do you think this assessment is most likely to be wrong?

·
--
$LRCX reported 310.69, up slightly 0.962% over 24 hours, and the funding rate has returned to zero. The price is inching upward, but a zero funding rate means neither longs nor shorts are paying extra costs, so the market is temporarily balanced and lacks a one-sided driver.
This balance is easy to break. If new macro or industry-level information is introduced, in either direction, it could trigger rapid position adjustments. Conversely, if trading volume expands and the price breaks above 311 or falls below 310 with volume, the current balanced assessment would no longer hold.
Trading tag: #TradFi #链上美股 #LRCX
Where do you think this analysis is most likely wrong?
$LRCX reported 310.69, up slightly 0.962% over 24 hours, and the funding rate has returned to zero. The price is inching upward, but a zero funding rate means neither longs nor shorts are paying extra costs, so the market is temporarily balanced and lacks a one-sided driver.
This balance is easy to break. If new macro or industry-level information is introduced, in either direction, it could trigger rapid position adjustments. Conversely, if trading volume expands and the price breaks above 311 or falls below 310 with volume, the current balanced assessment would no longer hold.
Trading tag: #TradFi #链上美股 #LRCX
Where do you think this analysis is most likely wrong?
This balance is easy to break. If new macro or industry-level information is introduced, in either direction, it could trigger rapid position adjustments. Conversely, if trading volume expands and the price breaks above 311 or falls below 310 with volume, the current balanced assessment would no longer hold.
Trading tag: #TradFi #链上美股 #LRCX
Where do you think this analysis is most likely wrong?
1
·
--
$LRCX 24 hours slightly up 0.96% to 310.69, funding rate neutral at 0.00000000, open interest 1383.83. As an on-chain U.S. stock proxy, the most significant signal right now is the funding rate returning to zero. This usually means long and short forces are balanced, or that market participants are on the sidelines with no clear one-sided crowding. The price is slightly up but volume has not increased, which may reflect the market waiting for a clearer macro-driven signal. I prefer to stay on the sidelines until the funding rate turns positive again and expands.
Trading tag: #TradFi #链上美股 #LRCX
Where do you think this judgment is most likely to be wrong?
$LRCX 24 hours slightly up 0.96% to 310.69, funding rate neutral at 0.00000000, open interest 1383.83. As an on-chain U.S. stock proxy, the most significant signal right now is the funding rate returning to zero. This usually means long and short forces are balanced, or that market participants are on the sidelines with no clear one-sided crowding. The price is slightly up but volume has not increased, which may reflect the market waiting for a clearer macro-driven signal. I prefer to stay on the sidelines until the funding rate turns positive again and expands.
Trading tag: #TradFi #链上美股 #LRCX
Where do you think this judgment is most likely to be wrong?
Trading tag: #TradFi #链上美股 #LRCX
Where do you think this judgment is most likely to be wrong?
2
·
--
$LRCX current price is 310.69, with a 24-hour increase of 0.962%, and the funding rate is exactly 0. Zero funding rates are rare in the contract market, usually meaning that the financing cost for longs and shorts has fallen to zero, and short-term forces are entering an unfrictional game state. With open interest at 1383.83, this balance may indicate that the market is waiting for a directional signal to break the deadlock. The current price is slightly up but accompanied by a zero funding rate, which means the rise was not driven by aggressive long opening; it is more likely a mild adjustment within the position structure.
Trading tag: #TradFi #链上美股 #LRCX
Where do you think this line of reasoning is most likely to be wrong?
$LRCX current price is 310.69, with a 24-hour increase of 0.962%, and the funding rate is exactly 0. Zero funding rates are rare in the contract market, usually meaning that the financing cost for longs and shorts has fallen to zero, and short-term forces are entering an unfrictional game state. With open interest at 1383.83, this balance may indicate that the market is waiting for a directional signal to break the deadlock. The current price is slightly up but accompanied by a zero funding rate, which means the rise was not driven by aggressive long opening; it is more likely a mild adjustment within the position structure.
Trading tag: #TradFi #链上美股 #LRCX
Where do you think this line of reasoning is most likely to be wrong?
Trading tag: #TradFi #链上美股 #LRCX
Where do you think this line of reasoning is most likely to be wrong?
28
Log in to explore more content
Join global crypto users on Binance Square
⚡️ Get latest and useful information about crypto.
💬 Trusted by the world’s largest crypto exchange.
👍 Discover real insights from verified creators.
Email / Phone number
Trending Topics
1
#BitcoinReboundsTo$79K
21,367 views
193 Discussing
2
#BitcoinSpotETFsNetInflow$160M
325 views
37 Discussing
3
#SouthKoreaCryptoTaxDelayPetitionTops50000
12,901 views
364 Discussing
4
#SolanaTransactionV1GoesLiveOnMainnet
7,859 views
245 Discussing
5
#RussianCentralBankFlagsCryptoAsFinancialRisk
7,150 views
238 Discussing
6
#GrayscalePutsXRPAt26.11%InAdvisorPortfolio
19,732 views
335 Discussing
7
#PhiladelphiaSemiconductorIndexFalls5.9%
6,315 views
207 Discussing
8
#SECChairUrgesCongressToAdvanceClarityAct
20,029 views
227 Discussing
9
#FedHikeOddsRiseTo89%
114,940 views
1,248 Discussing
10
#RLUSDSupplyHitsRecord$2.442B
8,163 views
70 Discussing