
#housingbubble
housingbubble
130,028 views
26 Discussing
Hot
Latest

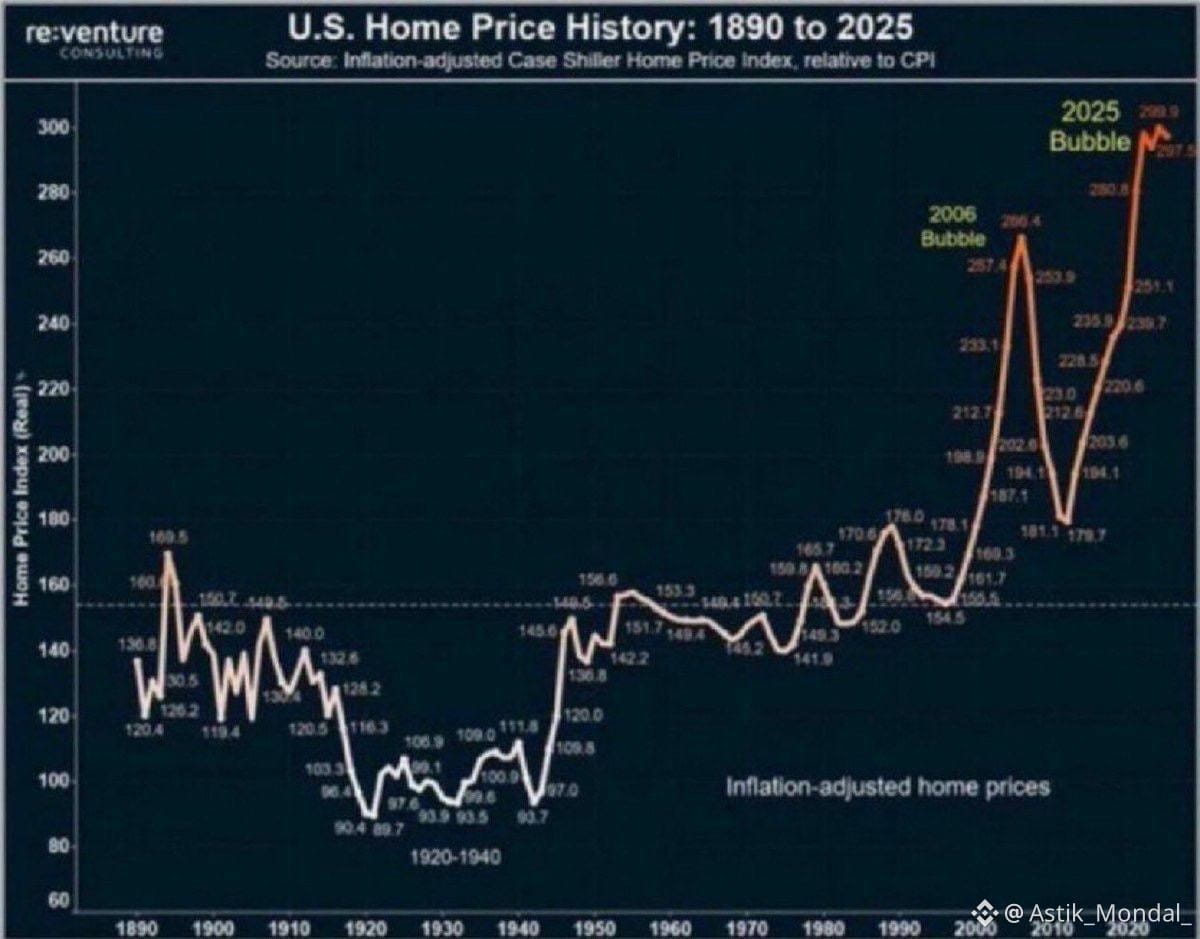
US housing affordability just hit its worst level in 135 years of recorded data. The 2025 bubble is larger than 2006. Larger than anything in this chart going back to 1890.
Look at this chart carefully.
From 1890 to 2020, inflation-adjusted home prices never once sustainably exceeded 270 on this index. Not during the Roaring Twenties. Not during the post-war boom. Not even at the peak of the 2006 bubble that triggered the worst financial crisis since the Great Depression.
The 2025 reading hit nearly 300.
A new all time record. By a significant margin. On 135 years of data.
And 90% of Americans under 40 are feeling it directly.
The price-to-income ratio has climbed to 3.5 times. Monthly payments on a regular home surged 64%. Not from a low base. From prices that were already historically elevated.
This is why home sellers are pulling listings at pandemic-era rates. The gap between what sellers expect and what buyers can afford has never been wider. The market is not clearing. It is freezing.
The Fed cannot cut rates into 5% inflation. Mortgage rates stay elevated. Every month rates stay high is another month the affordability math gets worse for first time buyers.
The generation that grew up watching their parents buy homes in their 20s and 30s is now renting into their 40s in cities they can barely afford.
Employee compensation just hit a 78 year low as a share of corporate income. Corporate profits just hit an all time high share of GDP. The stock market cap to GDP ratio just hit 238%.
Asset owners are winning everything.
Asset seekers cannot get in the door.
The 2025 housing bubble is not a prediction anymore.
It is the label on the chart.
#HousingCrisis #HousingBubble #Affordability #RealEstate #Economy
US housing affordability just hit its worst level in 135 years of recorded data. The 2025 bubble is larger than 2006. Larger than anything in this chart going back to 1890.
Look at this chart carefully.
From 1890 to 2020, inflation-adjusted home prices never once sustainably exceeded 270 on this index. Not during the Roaring Twenties. Not during the post-war boom. Not even at the peak of the 2006 bubble that triggered the worst financial crisis since the Great Depression.
The 2025 reading hit nearly 300.
A new all time record. By a significant margin. On 135 years of data.
And 90% of Americans under 40 are feeling it directly.
The price-to-income ratio has climbed to 3.5 times. Monthly payments on a regular home surged 64%. Not from a low base. From prices that were already historically elevated.
This is why home sellers are pulling listings at pandemic-era rates. The gap between what sellers expect and what buyers can afford has never been wider. The market is not clearing. It is freezing.
The Fed cannot cut rates into 5% inflation. Mortgage rates stay elevated. Every month rates stay high is another month the affordability math gets worse for first time buyers.
The generation that grew up watching their parents buy homes in their 20s and 30s is now renting into their 40s in cities they can barely afford.
Employee compensation just hit a 78 year low as a share of corporate income. Corporate profits just hit an all time high share of GDP. The stock market cap to GDP ratio just hit 238%.
Asset owners are winning everything.
Asset seekers cannot get in the door.
The 2025 housing bubble is not a prediction anymore.
It is the label on the chart.
#HousingCrisis #HousingBubble #Affordability #RealEstate #Economy
Look at this chart carefully.
From 1890 to 2020, inflation-adjusted home prices never once sustainably exceeded 270 on this index. Not during the Roaring Twenties. Not during the post-war boom. Not even at the peak of the 2006 bubble that triggered the worst financial crisis since the Great Depression.
The 2025 reading hit nearly 300.
A new all time record. By a significant margin. On 135 years of data.
And 90% of Americans under 40 are feeling it directly.
The price-to-income ratio has climbed to 3.5 times. Monthly payments on a regular home surged 64%. Not from a low base. From prices that were already historically elevated.
This is why home sellers are pulling listings at pandemic-era rates. The gap between what sellers expect and what buyers can afford has never been wider. The market is not clearing. It is freezing.
The Fed cannot cut rates into 5% inflation. Mortgage rates stay elevated. Every month rates stay high is another month the affordability math gets worse for first time buyers.
The generation that grew up watching their parents buy homes in their 20s and 30s is now renting into their 40s in cities they can barely afford.
Employee compensation just hit a 78 year low as a share of corporate income. Corporate profits just hit an all time high share of GDP. The stock market cap to GDP ratio just hit 238%.
Asset owners are winning everything.
Asset seekers cannot get in the door.
The 2025 housing bubble is not a prediction anymore.
It is the label on the chart.
#HousingCrisis #HousingBubble #Affordability #RealEstate #Economy

10
Log in to explore more content
Join global crypto users on Binance Square
⚡️ Get latest and useful information about crypto.
💬 Trusted by the world’s largest crypto exchange.
👍 Discover real insights from verified creators.
Email / Phone number
Trending Topics
1
#FedRateWatch
1.4M views
6,554 Discussing
2
#ZcashRises6%
41,039 views
571 Discussing
3
#XRPSinks10%
27,691 views
377 Discussing
4
#BitcoinETFsShed$450M
4,658 views
76 Discussing
5
#CircleOpensArcMainnet
13,288 views
258 Discussing
6
#ZcashHoldersBackNU7Upgrade
24,163 views
427 Discussing
7
#MSTRTradingVolumeSurpassesMorganStanley
23,996 views
580 Discussing
8
#BitcoinFalls4%
49,382 views
896 Discussing
9
#SKHynixInTalksToMakeMemoryChipsInUS
20,084 views
358 Discussing
10
#OpenAIDiscussesNewFundingAt$1.2TValuation
4,871 views
57 Discussing