

#gme
gme
6.5M views
2,221 Discussing
GameStop (GME) is currently leading the memecoin sector, capturing the attention of investors and enthusiasts alike. Let's discuss GME and its future as a Solana-based memecoin.
Hot
Latest


·
--
Surge In GME Meme Coin Value On Multiple Blockchain PlatformsAccording to BlockBeats, on May 13, the value of GME meme coins on several blockchain platforms skyrocketed due to the surge in GameStop's US stock. Specifically, the GME coin on the Solana blockchain saw a 24-hour increase of 1518%, with a temporary price of 0.008322 USD. Similarly, the GME coin on the Ethereum blockchain experienced a 24-hour increase of 93,492%, with a temporary price of 0.058565 USD. Lastly, the GME coin on the Base blockchain saw a 24-hour increase of 322%, with a temporary price of 0.02981 USD.
This sudden increase in the value of GME meme coins across multiple blockchain platforms is directly linked to the surge in GameStop's US stock. The correlation between the stock market and the value of meme coins is a clear indication of the influence traditional financial markets can have on the digital currency landscape. However, it's important to note that the prices mentioned are temporary and can fluctuate due to the volatile nature of digital currencies.
Surge In GME Meme Coin Value On Multiple Blockchain Platforms
According to BlockBeats, on May 13, the value of GME meme coins on several blockchain platforms skyrocketed due to the surge in GameStop's US stock. Specifically, the GME coin on the Solana blockchain saw a 24-hour increase of 1518%, with a temporary price of 0.008322 USD. Similarly, the GME coin on the Ethereum blockchain experienced a 24-hour increase of 93,492%, with a temporary price of 0.058565 USD. Lastly, the GME coin on the Base blockchain saw a 24-hour increase of 322%, with a temporary price of 0.02981 USD.
This sudden increase in the value of GME meme coins across multiple blockchain platforms is directly linked to the surge in GameStop's US stock. The correlation between the stock market and the value of meme coins is a clear indication of the influence traditional financial markets can have on the digital currency landscape. However, it's important to note that the prices mentioned are temporary and can fluctuate due to the volatile nature of digital currencies.
This sudden increase in the value of GME meme coins across multiple blockchain platforms is directly linked to the surge in GameStop's US stock. The correlation between the stock market and the value of meme coins is a clear indication of the influence traditional financial markets can have on the digital currency landscape. However, it's important to note that the prices mentioned are temporary and can fluctuate due to the volatile nature of digital currencies.
3
1
15
20.2k

·
--
#GME GameStop CEO talks about robots turning against humanity
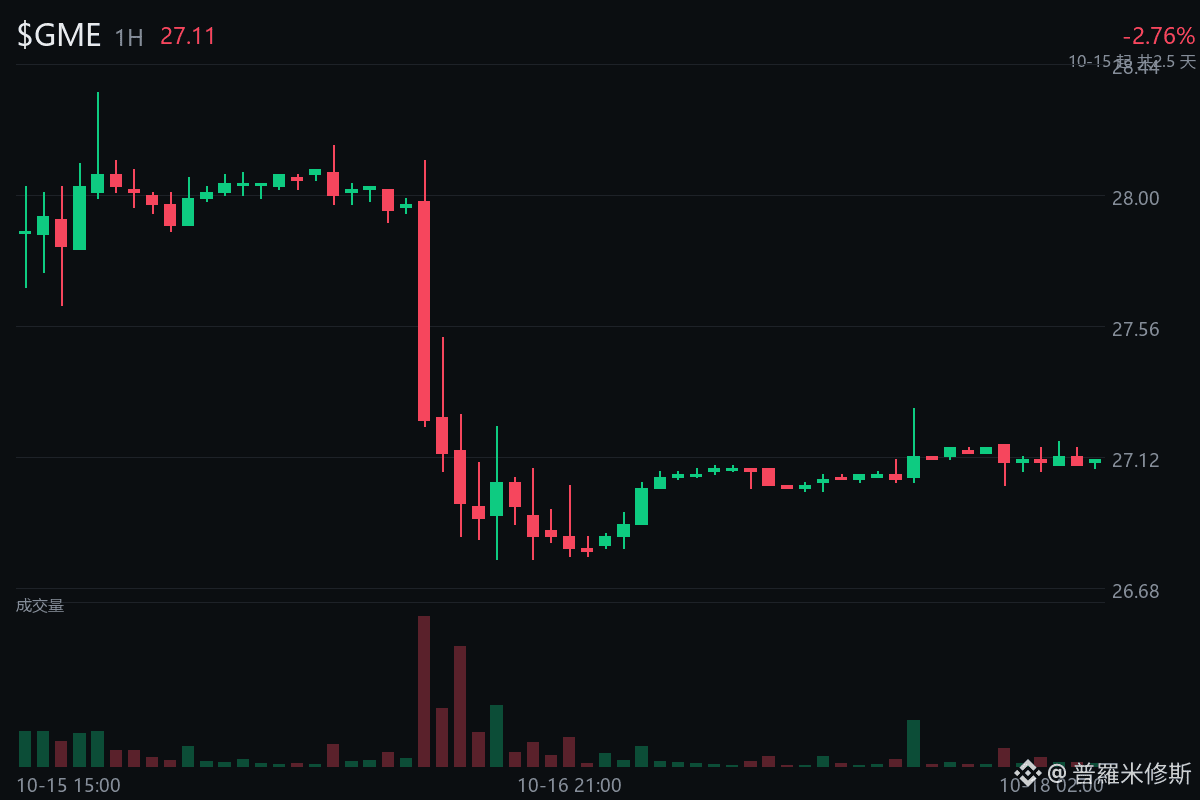
GameStop CEO Ryan Cohen said 3 hours ago that humans might attack smarter robots, adding, "Could this turn into World War III? I don't know." $GME is now at 27.1, up just 0.22% in 24 hours, with trading volume of around 500,000.
My first reaction: a video game retailer's CEO talking about robots attacking humans has little to do with the company's own business. It feels more like he’s building up his personal image than making any real move on the business front.
The market hasn't taken it seriously either. This tiny move suggests nobody cares.
My take: listen, but don't treat it as good news. If the company actually uses this topic to talk about an AI transformation, or reports meaningful figures in its earnings, then I'll change my tune.
78

·
--
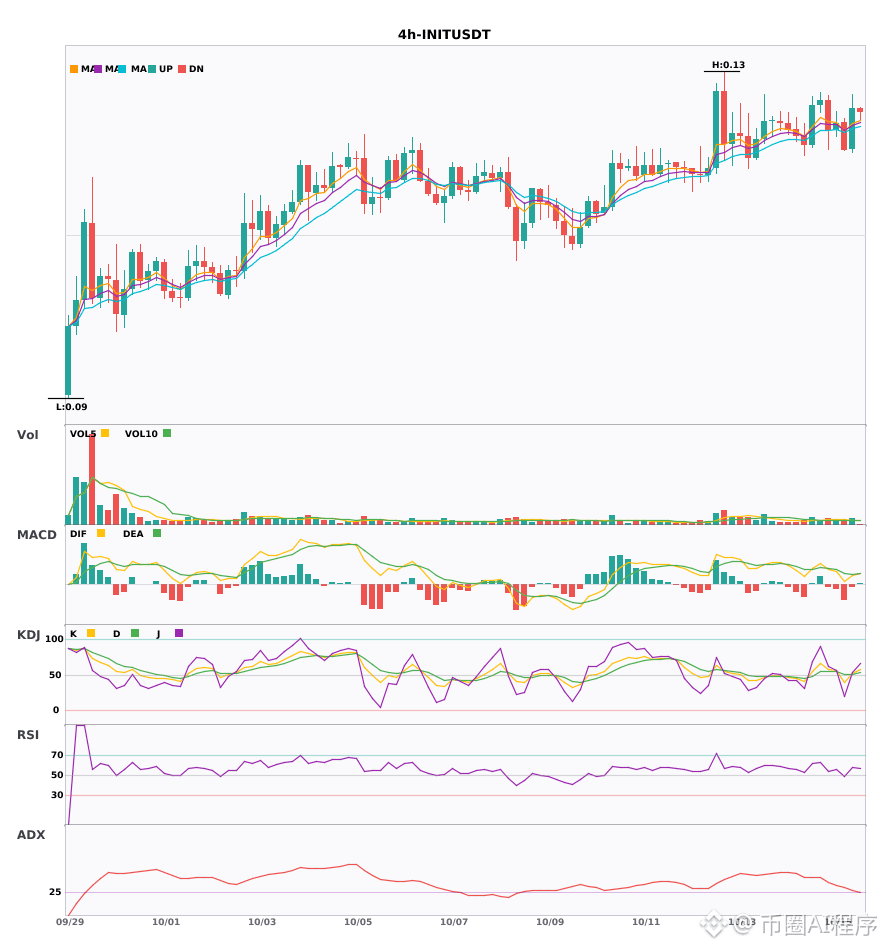
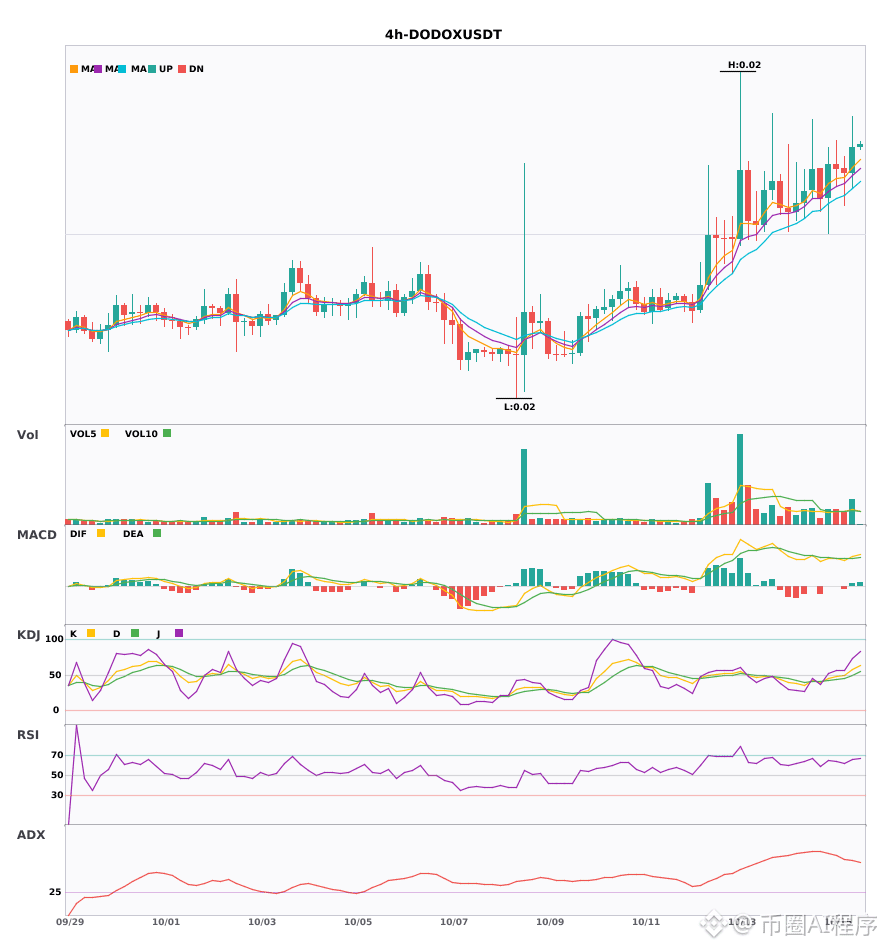
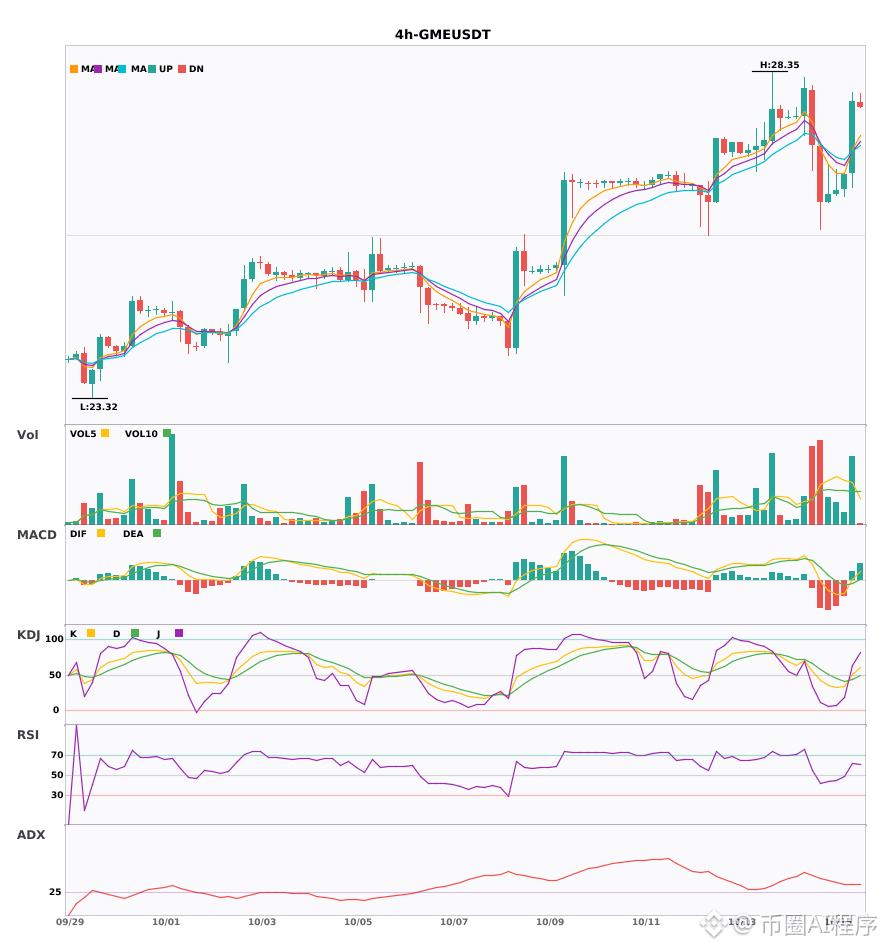
$INIT / $DODOX / $GME 24-hour bullish + daily bullish alignment, multi-timeframe resonance turns bullish 🔥
════════════════════
🔴 $INIT 4-hour bullish signal
⚠️ Technical analysis: Daily bullish resonance confirmed | 4-hour entry: EMA5 crosses above EMA8, short-term trend turns bullish | KDJ golden cross, short-term bullish (K: 51.7, D: 50.8) | Normal volume (1.5x)
════════════════════
🔴 $DODOX 4-hour bullish signal
⚠️ Technical analysis: Daily bullish resonance confirmed | 4-hour entry: MACD golden cross above zero, bullish momentum released | EMA5 > EMA8 > EMA13, bullish alignment | Trading volume increases (1.8x)
════════════════════
🔴 $GME 4-hour bullish signal
⚠️ Technical analysis: Daily bullish resonance confirmed | 4-hour entry: MACD golden cross above zero, bullish momentum released | EMA5 crosses above EMA8, short-term trend turns bullish | KDJ golden cross, short-term bullish (K: 50.2, D: 43.9) | Trading volume increases (2.0x)
════════════════════
🔔 Follow for first-hand market updates 🔔
#多周期共振 #INIT #DODOX #GME
📌 When trading, pay attention to whether the candlestick patterns confirm the signal
════════════════════
🔴 $INIT 4-hour bullish signal
⚠️ Technical analysis: Daily bullish resonance confirmed | 4-hour entry: EMA5 crosses above EMA8, short-term trend turns bullish | KDJ golden cross, short-term bullish (K: 51.7, D: 50.8) | Normal volume (1.5x)
════════════════════
🔴 $DODOX 4-hour bullish signal
⚠️ Technical analysis: Daily bullish resonance confirmed | 4-hour entry: MACD golden cross above zero, bullish momentum released | EMA5 > EMA8 > EMA13, bullish alignment | Trading volume increases (1.8x)
════════════════════
🔴 $GME 4-hour bullish signal
⚠️ Technical analysis: Daily bullish resonance confirmed | 4-hour entry: MACD golden cross above zero, bullish momentum released | EMA5 crosses above EMA8, short-term trend turns bullish | KDJ golden cross, short-term bullish (K: 50.2, D: 43.9) | Trading volume increases (2.0x)
════════════════════
🔔 Follow for first-hand market updates 🔔
#多周期共振 #INIT #DODOX #GME
📌 When trading, pay attention to whether the candlestick patterns confirm the signal
18

·
--
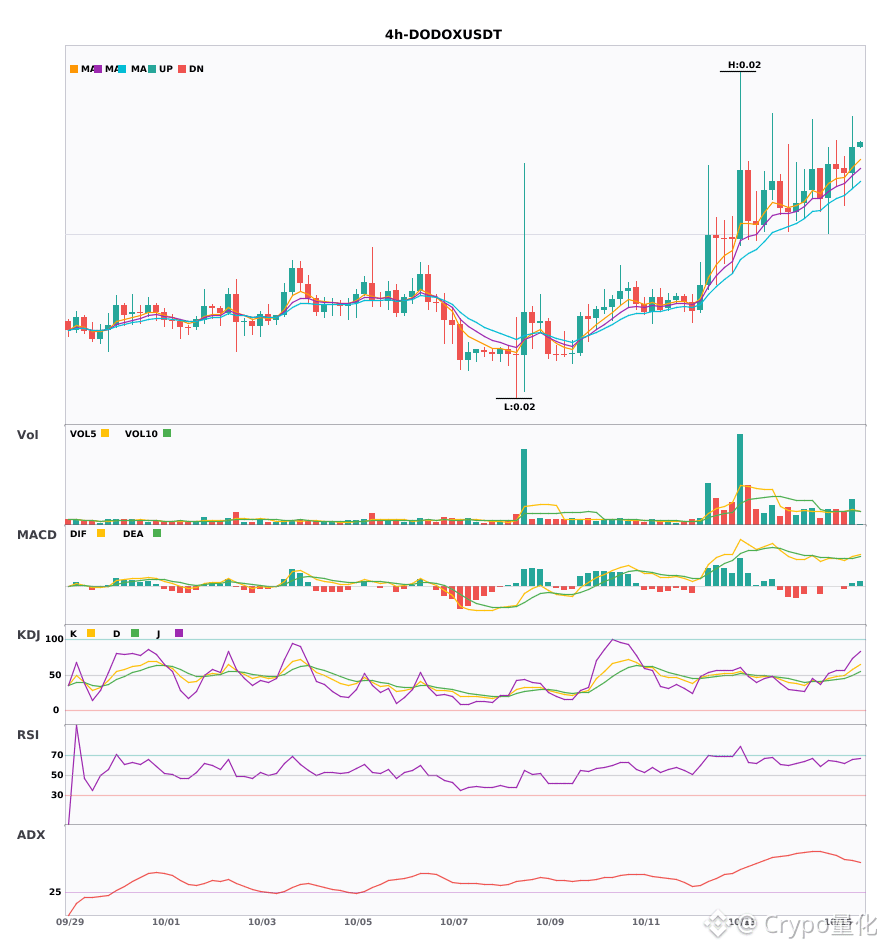
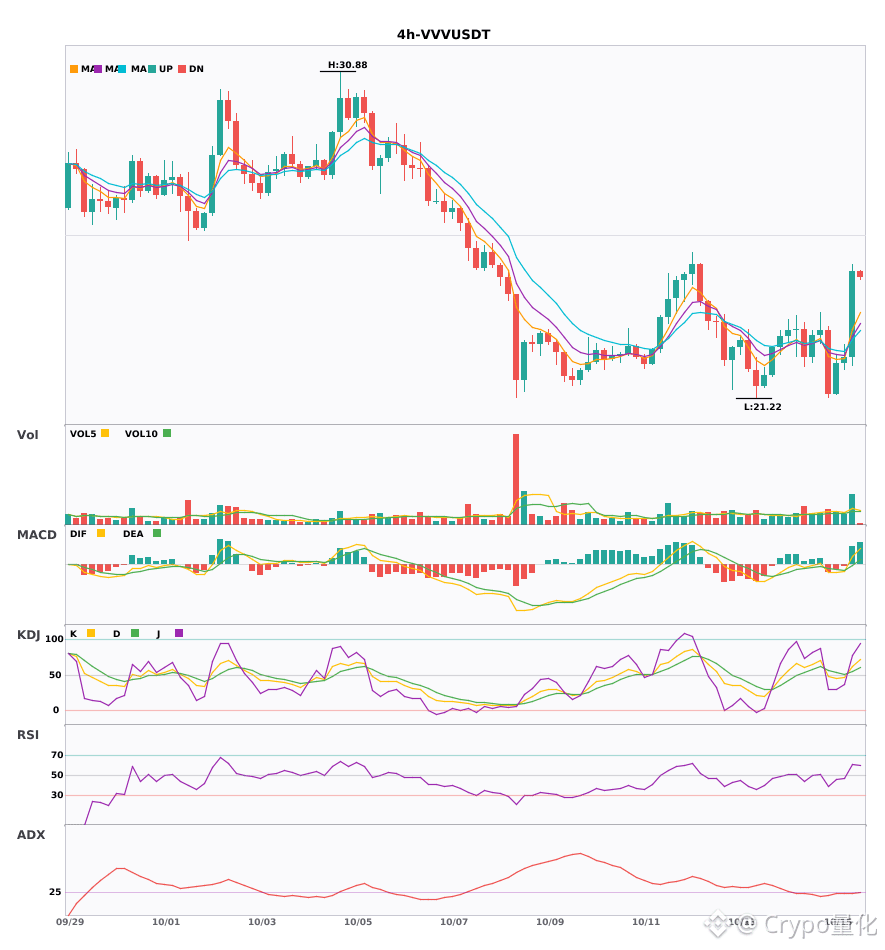
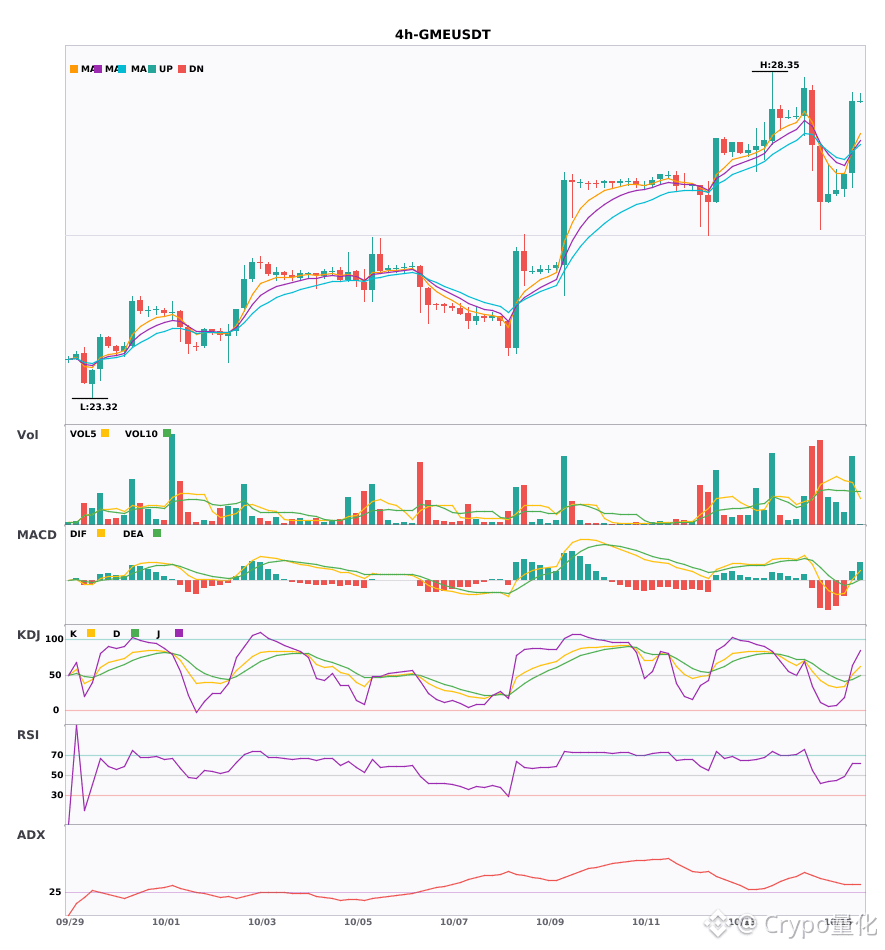
$DODOX / $VVV / $GME 4-hour confluence turns bullish, with bullish signals appearing simultaneously 🔥
════════════════════
🔴 $DODOX 4-hour bullish signal
⚠️ Technical analysis: ADX(58) indicates a very strong trend (beware of an overheated pullback) | MACD bullish crossover above zero, releasing bullish momentum | EMA5 > EMA8 > EMA13, bullish alignment | Volume up (1.8x)
════════════════════
🔴 $VVV 4-hour bullish signal
⚠️ Technical analysis: ADX(26) indicates a trend is forming; opportunity to participate | MACD bullish crossover above zero, releasing bullish momentum | EMA5 crosses above EMA8, short-term outlook turns bullish | KDJ bullish crossover, short-term outlook bullish (K: 62.2, D: 54.5) | Volume up (2.2x)
════════════════════
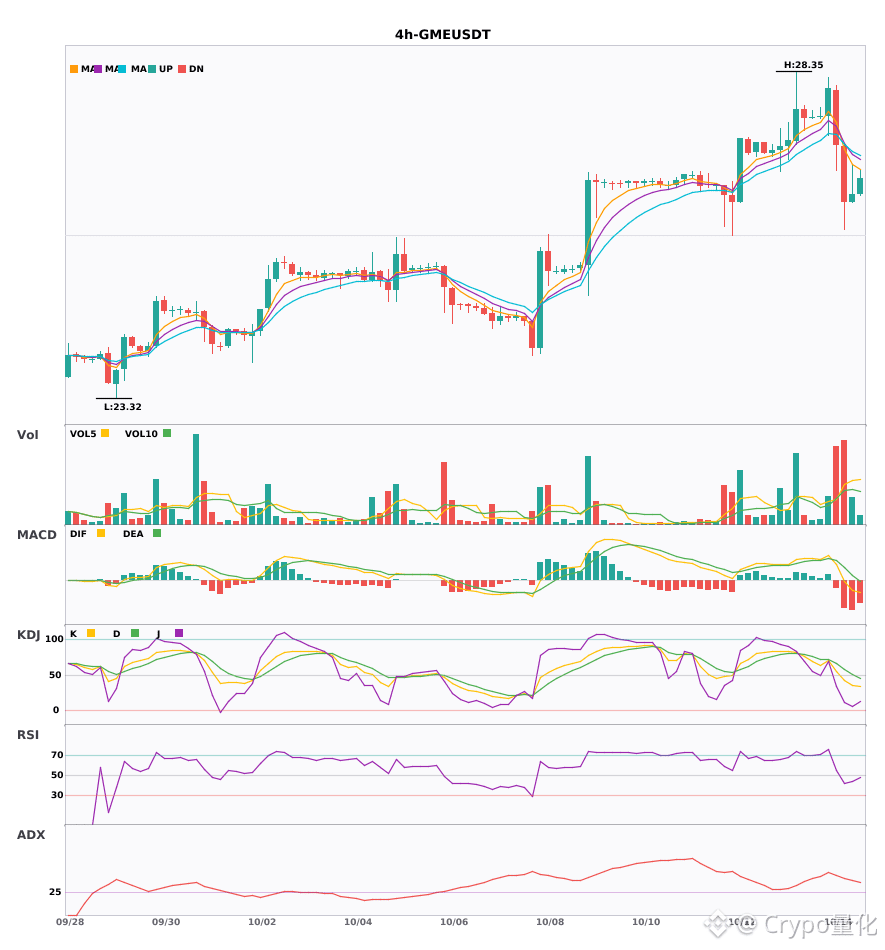
🔴 $GME 4-hour bullish signal
⚠️ Technical analysis: ADX(36) indicates a clear trending market | MACD bullish crossover above zero, releasing bullish momentum | EMA5 crosses above EMA8, short-term outlook turns bullish | KDJ bullish crossover, short-term outlook bullish (K: 50.2, D: 43.9) | Volume up (2.0x)
════════════════════
🔔 Follow for real-time market updates 🔔
#技术分析 #DODOX #VVV #GME
📌 When trading, check whether the candlestick pattern confirms the signal
════════════════════
🔴 $DODOX 4-hour bullish signal
⚠️ Technical analysis: ADX(58) indicates a very strong trend (beware of an overheated pullback) | MACD bullish crossover above zero, releasing bullish momentum | EMA5 > EMA8 > EMA13, bullish alignment | Volume up (1.8x)
════════════════════
🔴 $VVV 4-hour bullish signal
⚠️ Technical analysis: ADX(26) indicates a trend is forming; opportunity to participate | MACD bullish crossover above zero, releasing bullish momentum | EMA5 crosses above EMA8, short-term outlook turns bullish | KDJ bullish crossover, short-term outlook bullish (K: 62.2, D: 54.5) | Volume up (2.2x)
════════════════════
🔴 $GME 4-hour bullish signal
⚠️ Technical analysis: ADX(36) indicates a clear trending market | MACD bullish crossover above zero, releasing bullish momentum | EMA5 crosses above EMA8, short-term outlook turns bullish | KDJ bullish crossover, short-term outlook bullish (K: 50.2, D: 43.9) | Volume up (2.0x)
════════════════════
🔔 Follow for real-time market updates 🔔
#技术分析 #DODOX #VVV #GME
📌 When trading, check whether the candlestick pattern confirms the signal
16
·
--
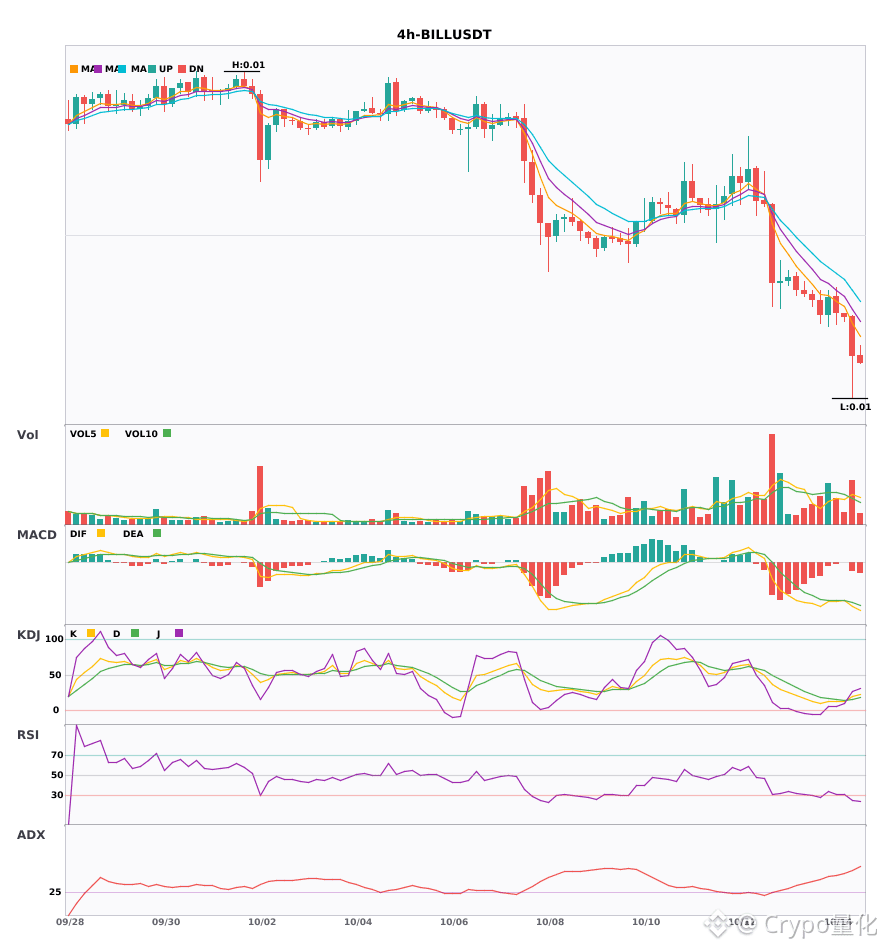
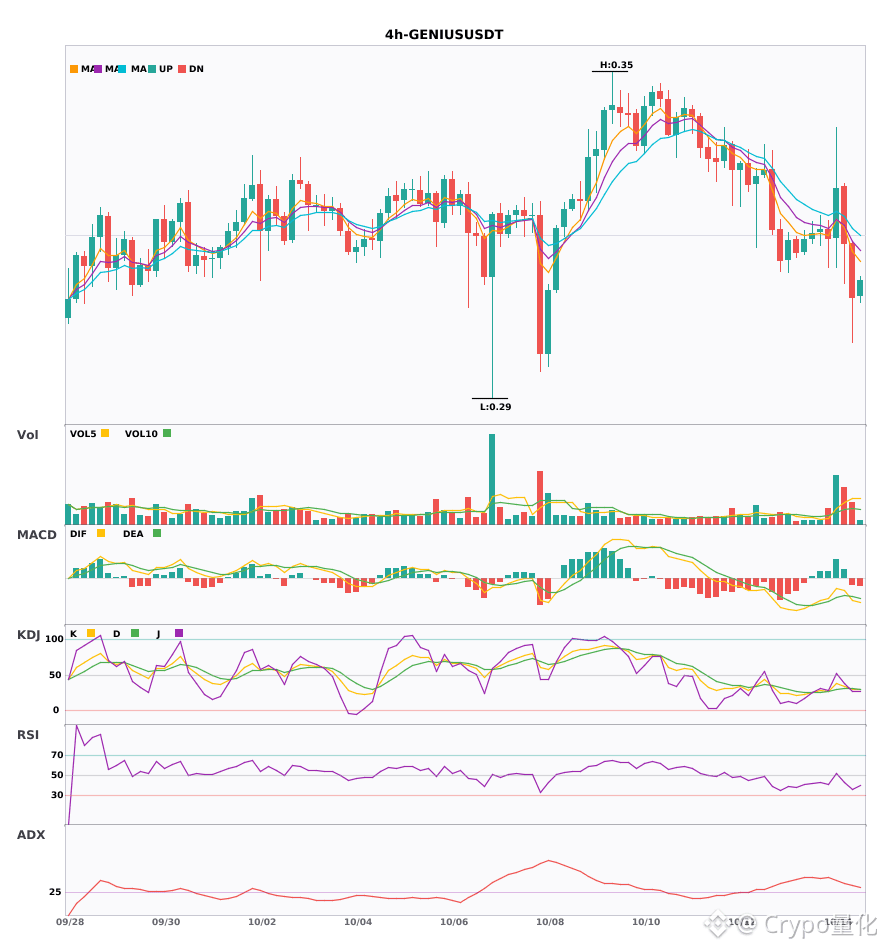
$BILL / $GENIUS / $GME : Technical indicators are weakening across the 4-hour timeframe; beware of risk 🔥
════════════════════
🟢 $BILL 4-hour bearish signal
⚠️ Technicals: ADX(55), an extremely strong trend (watch for an overheated pullback) | MACD bearish crossover below zero; bearish momentum accelerating | EMA5 < EMA8 < EMA13, bearish alignment | KDJ bullish crossover, short-term outlook bullish (K: 19.7, D: 16.2) | Volume up (1.7x)
════════════════════
🟢 $GENIUS 4-hour bearish signal
⚠️ Technicals: ADX(34), a clear trending market | MACD bearish crossover below zero; bearish momentum accelerating | EMA5 < EMA8 < EMA13, bearish alignment | KDJ bearish crossover, short-term outlook bearish (K: 29.2, D: 30.6) | Volume up (2.5x)
════════════════════
🟢 $GME 4-hour bearish signal
⚠️ Technicals: ADX(40), a clear trending market | MACD is bearish; trend is weak, momentum is strengthening | EMA5 < EMA8 < EMA13, bearish alignment | Volume up (2.5x)
════════════════════
🔔 Follow for real-time market updates 🔔
#技术分析 #BILL #GENIUS #GME
📌 When trading, check whether the candlestick pattern confirms the signal
════════════════════
🟢 $BILL 4-hour bearish signal
⚠️ Technicals: ADX(55), an extremely strong trend (watch for an overheated pullback) | MACD bearish crossover below zero; bearish momentum accelerating | EMA5 < EMA8 < EMA13, bearish alignment | KDJ bullish crossover, short-term outlook bullish (K: 19.7, D: 16.2) | Volume up (1.7x)
════════════════════
🟢 $GENIUS 4-hour bearish signal
⚠️ Technicals: ADX(34), a clear trending market | MACD bearish crossover below zero; bearish momentum accelerating | EMA5 < EMA8 < EMA13, bearish alignment | KDJ bearish crossover, short-term outlook bearish (K: 29.2, D: 30.6) | Volume up (2.5x)
════════════════════
🟢 $GME 4-hour bearish signal
⚠️ Technicals: ADX(40), a clear trending market | MACD is bearish; trend is weak, momentum is strengthening | EMA5 < EMA8 < EMA13, bearish alignment | Volume up (2.5x)
════════════════════
🔔 Follow for real-time market updates 🔔
#技术分析 #BILL #GENIUS #GME
📌 When trading, check whether the candlestick pattern confirms the signal
29


> SEC-13D
> COHEN RYAN RAISES GAMESTOP STAKE TO 9.1% (13D/A)
> $GME
#GME
> SEC-13D
> COHEN RYAN RAISES GAMESTOP STAKE TO 9.1% (13D/A)
> $GME
#GME
> COHEN RYAN RAISES GAMESTOP STAKE TO 9.1% (13D/A)
> $GME
#GME
77

·
--
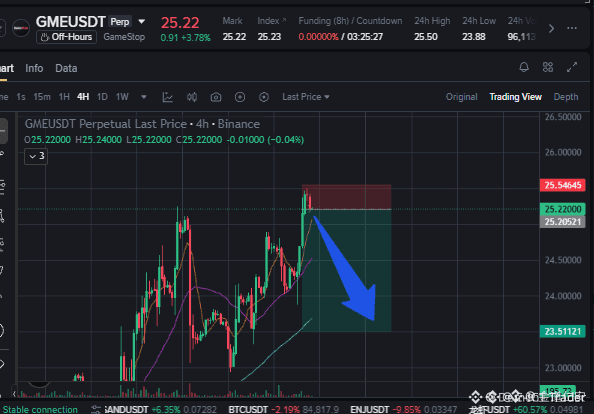
🚨 $GME SHOWS INSTITUTIONAL REJECTION AS RELIEF BOUNCE EXHAUSTS INTO SUPPLY! 📉
Entry: 25.1 - 25.3 🔻
Target: 24.7 - 24.4 - 23.8 📉
Stop Loss: 25.7 ⚠️
Smart money is stepping in to absorb buying pressure on $GME as the corrective bounce runs into immediate supply. 🔍 Institutional sellers are reclaiming short-term structure control around this pivot, signaling clear demand exhaustion.
If buyers fail to defend this lower high, the lack of structural support opens up an efficient path down toward key liquidity pools below. 📊 Risk parameters remain tight as distribution unfolds. 💬 Are you taking the short continuation here, or waiting for a final liquidity sweep? 👇
⚠️ Not financial advice. Always manage your risk. 🛡️
🏷️ #GME #ShortSetup #MarketStructure #Bearish #Crypto
🐻 📉
12

·
--
$GME falls to $23.41, down 6.135% in 24 hours; the funding rate has dropped to zero, with open interest of 55,000 contracts. Zero funding means neither side—longs or shorts—pays the other, so the market stalls here. A drop of around 6% usually triggers inflows of risk-hedging capital, but the funding rate doesn’t move at all, suggesting even hedging orders aren’t coming in; liquidity may be standing by at the sidelines.
This signal is based on a divergence between price and funding rate: prices are falling, but the cost of capital isn’t rising. The selling pressure may not be coming from contract shorts initiating new positions; it could instead be spot holders reducing exposure. Retail shares like this (e.g., $GME ) are extremely sensitive to sentiment. In a zero-funding environment, the decline looks more like a snapshot of the market’s overall risk appetite shrinking rather than company-specific bad news. Conversely, if suddenly meme-stock speculation news pushes the funding rate back positive, longs would start accumulating cost pressure.
The strongest counter-evidence is a sudden reversal in retail sentiment. If a new round of GameStop calls spreads on social media, or if a broader rebound in risk appetite in the U.S. stock market lifts the meme-stock segment, $GME could bounce quickly and the funding rate could turn positive. My invalidation conditions are: price moves back above $24 and holds for at least 12 hours, or the funding rate breaks above 0.0001.
Trading tag: #TradFi #链上美股 #GME
Where do you think this framework is most likely to be wrong?
53

·
--
Over the past 24 hours, $GME is down 6.062%, and the price has fallen to 23.4. The old dog glanced at the funding rate on the perpetual contract—it sits steadily at 0. This combination is kind of interesting: with the price falling, neither longs nor shorts have to pay each other.
A zero funding rate usually signals a fragile balance at some price level, or simply the dead stillness left after liquidity is drained. Breaking it down, a 0 rate directly rules out two common scenarios: it’s not that longs are overcrowded and paying shorts, and it’s not that shorts are piled in enough to pay longs in reverse. Coupled with the open interest of 55336.04 and roughly 4.48 million in volume, the data points to a stalemate with no clear direction. The price drop didn’t trigger a big push from the shorts, and there’s no sign that longs are stubbornly holding under negative-funding conditions.
From the cycle position, this zero-funding plus slow-bid selloff pattern often isn’t the start of a new trend. More often, it’s the late stage of a consolidation period—the market is waiting for some external force to break the balance.
So my take is very straightforward: $GME is currently in directionless “trash time.” Going long or short both have a tendency to get slapped back and forth. If the market expects it to rebound by following some AI narrative from the U.S. semiconductor sector, then first it has to ask how much on-exchange capital is actually willing to do work under this zero funding rate. I won’t guess the next leg higher, because there’s no counterpart/confirmation from other tokens in the data. Betting everything on a liquidity-dried-up asset has too low a win rate. The old dog’s choice is observation—absolutely no touching.
If you really want to play, wait for two signals: either (1) the funding rate turns positive and price breaks below 22 with increased volume—then shorts may start to push, and you could consider a small short position in the move; or (2) the funding rate turns negative and a single bullish candle reclaims 24 or above—that would hint at a short squeeze, and then you could consider going long.
Where could this view be wrong? If there’s a situation where $GME’s funding stays near zero for a long time, but the price keeps grinding down and volume keeps shrinking, that would suggest even the stalemate can’t be maintained—the sell-off would become the main theme, and my “wait for external force to break the deadlock” thesis would fail. That would be a different, weaker kind of move, needing re-evaluation.
Trading tag: #BinanceFutures #TradFi #USDⓈM #GME #GMEUSDT $GME
Over the past 24 hours, $GME is down 6.062%, and the price has fallen to 23.4. The old dog glanced at the funding rate on the perpetual contract—it sits steadily at 0. This combination is kind of interesting: with the price falling, neither longs nor shorts have to pay each other.
A zero funding rate usually signals a fragile balance at some price level, or simply the dead stillness left after liquidity is drained. Breaking it down, a 0 rate directly rules out two common scenarios: it’s not that longs are overcrowded and paying shorts, and it’s not that shorts are piled in enough to pay longs in reverse. Coupled with the open interest of 55336.04 and roughly 4.48 million in volume, the data points to a stalemate with no clear direction. The price drop didn’t trigger a big push from the shorts, and there’s no sign that longs are stubbornly holding under negative-funding conditions.
From the cycle position, this zero-funding plus slow-bid selloff pattern often isn’t the start of a new trend. More often, it’s the late stage of a consolidation period—the market is waiting for some external force to break the balance.
So my take is very straightforward: $GME is currently in directionless “trash time.” Going long or short both have a tendency to get slapped back and forth. If the market expects it to rebound by following some AI narrative from the U.S. semiconductor sector, then first it has to ask how much on-exchange capital is actually willing to do work under this zero funding rate. I won’t guess the next leg higher, because there’s no counterpart/confirmation from other tokens in the data. Betting everything on a liquidity-dried-up asset has too low a win rate. The old dog’s choice is observation—absolutely no touching.
If you really want to play, wait for two signals: either (1) the funding rate turns positive and price breaks below 22 with increased volume—then shorts may start to push, and you could consider a small short position in the move; or (2) the funding rate turns negative and a single bullish candle reclaims 24 or above—that would hint at a short squeeze, and then you could consider going long.
Where could this view be wrong? If there’s a situation where $GME ’s funding stays near zero for a long time, but the price keeps grinding down and volume keeps shrinking, that would suggest even the stalemate can’t be maintained—the sell-off would become the main theme, and my “wait for external force to break the deadlock” thesis would fail. That would be a different, weaker kind of move, needing re-evaluation.
Trading tag: #BinanceFutures #TradFi #USDⓈM #GME #GMEUSDT $GME
16

·
--
📈 Naiseg Strategy Sharing
━━━━━━━━━━━━━━━━
💰 Coin: GMEUSDT
🟢 Direction: Long (buy)
📊 Signal: Buy
⭐ Confidence: 67%
📈 Trend: Uptrend
━━━━━━━━━━━━━━━━
💎 Current Price: 23.45
🔴 Resistance Levels: [25.242612, 25.25]
🟢 Support Levels: [23.235388, 22.13]
━━━━━━━━━━━━━━━━
📝 Analysis: The drop is -6.0% + RSI is relatively low + near the lower Bollinger Band track, so the probability of a rebound is high
━━━━━━━━━━━━━━━━
📅 2026.09.26 05:06 | For reference only and does not constitute investment advice
#GME #加密货币 #合约交易 #奈斯哥 #quantitative trading
━━━━━━━━━━━━━━━━
💰 Coin: GMEUSDT
🟢 Direction: Long (buy)
📊 Signal: Buy
⭐ Confidence: 67%
📈 Trend: Uptrend
━━━━━━━━━━━━━━━━
💎 Current Price: 23.45
🔴 Resistance Levels: [25.242612, 25.25]
🟢 Support Levels: [23.235388, 22.13]
━━━━━━━━━━━━━━━━
📝 Analysis: The drop is -6.0% + RSI is relatively low + near the lower Bollinger Band track, so the probability of a rebound is high
━━━━━━━━━━━━━━━━
📅 2026.09.26 05:06 | For reference only and does not constitute investment advice
#GME #加密货币 #合约交易 #奈斯哥 #quantitative trading
20

🚨 $GME PRE-MARKET DOWN 12% — BULLS ARE BLEEDING OUT
The pre-market tape is painting a nasty picture for $GME longs. Twelve percent shaved off in early action — that's not a dip, that's distribution. 📊 Derivatives flow shows leveraged longs getting flushed while patient capital steps into the offering. 🌊
This slide carries real weight. The speed of today's drop tells me momentum sellers have seized the narrative, and any bounce needs to reclaim the prior imbalance to shift the structure.
If this is a liquidity sweep, we could see a snapback — but only for the brave. If it's distribution, lower prices are just the opening act. 💬 Which side do you think controls the tape?
⚠️ Not financial advice. Always manage your risk. 🛡️
🏷️ #GME #PreMarket #ShortSetup #MemeStock #Derivatives
🐻 📉
95

Article
Short-term bias: Neutral/BearishSupport: ~$17.80–$18.00Resistance: ~$19.50–$20.50, then ~$22A recla🔴 Short-term bias: Neutral/Bearish
Support: ~$17.80–$18.00Resistance: ~$19.50–$20.50, then ~$22A reclaim of $20–$22 with strong volume would improve the technical picture.A break below $17.80 could expose the stock to further downside.
🔎 What is moving GME?
GameStop's fundamentals have improved: Q1 2026 revenue increased 14% to $835.3M, while operating income reached $143.3M. The company also authorized a $2B share-repurchase program.
However, the recent $1.4B debt-for-equity swap has raised concerns about potential dilution and contributed to selling pressure.
🎯 Bottom line
#GME is currently high-risk and technically weak. Bulls need to reclaim the $20–$22 zone to show meaningful recovery. Holding around $18 is important; losing the recent low near $17.80 would be a bearish signal.
Short-term bias: Neutral/BearishSupport: ~$17.80–$18.00Resistance: ~$19.50–$20.50, then ~$22A recla
🔴 Short-term bias: Neutral/Bearish
Support: ~$17.80–$18.00Resistance: ~$19.50–$20.50, then ~$22A reclaim of $20–$22 with strong volume would improve the technical picture.A break below $17.80 could expose the stock to further downside.
🔎 What is moving GME?
GameStop's fundamentals have improved: Q1 2026 revenue increased 14% to $835.3M, while operating income reached $143.3M. The company also authorized a $2B share-repurchase program.
However, the recent $1.4B debt-for-equity swap has raised concerns about potential dilution and contributed to selling pressure.
🎯 Bottom line
#GME is currently high-risk and technically weak. Bulls need to reclaim the $20–$22 zone to show meaningful recovery. Holding around $18 is important; losing the recent low near $17.80 would be a bearish signal.
141

·
--
🚨 $GME PLUMMETS 10% ON $1.4B DILUTION DEAL — $18.70 SUPPORT IN THE CROSSHAIRS 💣
Entry: Breakdown below 18.70 ⚡
📉 A $1.4B debt-for-equity swap is a textbook dilution event — the kind of structural print that forces smart money to reprice risk instantly. The 10% breakdown into $18.70 shows sellers own the tape, and that level is now the trade's fulcrum.
If that floor cracks, expect the liquidity sweep below to accelerate fast. 📊 Meanwhile, $VIC and $BICO are absorbing the same risk-off shadow — correlation tightens during stress events. 💡
The real question is whether buyers defend $18.70 or let the market take the liquidity. 💬 Are you holding the support or waiting for the sweep below? 👇
⚠️ Not financial advice. Always manage your risk. 🛡️
🏷️ #GME #BearishSetup #Dilution #RiskOff #Crypto
🐻 📉
99

·
--
$GME 24h It only rose 1.165%, current price 18.23, and the funding rate is zero. The Trump tariff news has been everywhere, but this stock hasn’t shown anything like proper volatility—neither bulls nor bears are making moves. My view is that the tariff narrative simply hasn’t reached this meme stock at all; with funding rate at zero, no one wants to pay the cost, and my position is only 37,000 as well. The counter-argument: if tariffs truly deteriorate, stocks like this should get flushed out first. The invalidation condition is breaking below 18.02; the previous close is also around here, so I’ll exit immediately. If it holds above 18.23 and the funding rate turns positive, I’ll try a long again; stop loss goes below 18.02.
Trading tag: #TradFi #链上美股 #GME
Where do you think this set of judgment is most likely to be wrong?
Trading tag: #TradFi #链上美股 #GME
Where do you think this set of judgment is most likely to be wrong?
41

·
--
$GMEUSDT, the opportunity is here! The current price is consolidating at a low level. The 15-minute chart shows a clear upward trend. Although the 4-hour chart has dipped somewhat, overall it is still in a low range. The positioning of funds suggests that new short positions have entered, and the big-money long/short trend is declining. Go bold and long—risks are controllable!#GME# #Trading Master#
$GMEUSDT, the opportunity is here! The current price is consolidating at a low level. The 15-minute chart shows a clear upward trend. Although the 4-hour chart has dipped somewhat, overall it is still in a low range. The positioning of funds suggests that new short positions have entered, and the big-money long/short trend is declining. Go bold and long—risks are controllable!#GME# #Trading Master#
108

·
--
Bullish
$GME will be remaining in a strong uptrend, bullish momentum stays intact immediately open long 🟢 position #GME keep long 👇👇 target 23.50
{future}(GMEUSDT)
i am also watching $MON & $SQQQ
$GME will be remaining in a strong uptrend, bullish momentum stays intact immediately open long 🟢 position #GME keep long 👇👇 target 23.50
i am also watching $MON & $SQQQ
i am also watching $MON & $SQQQ
58

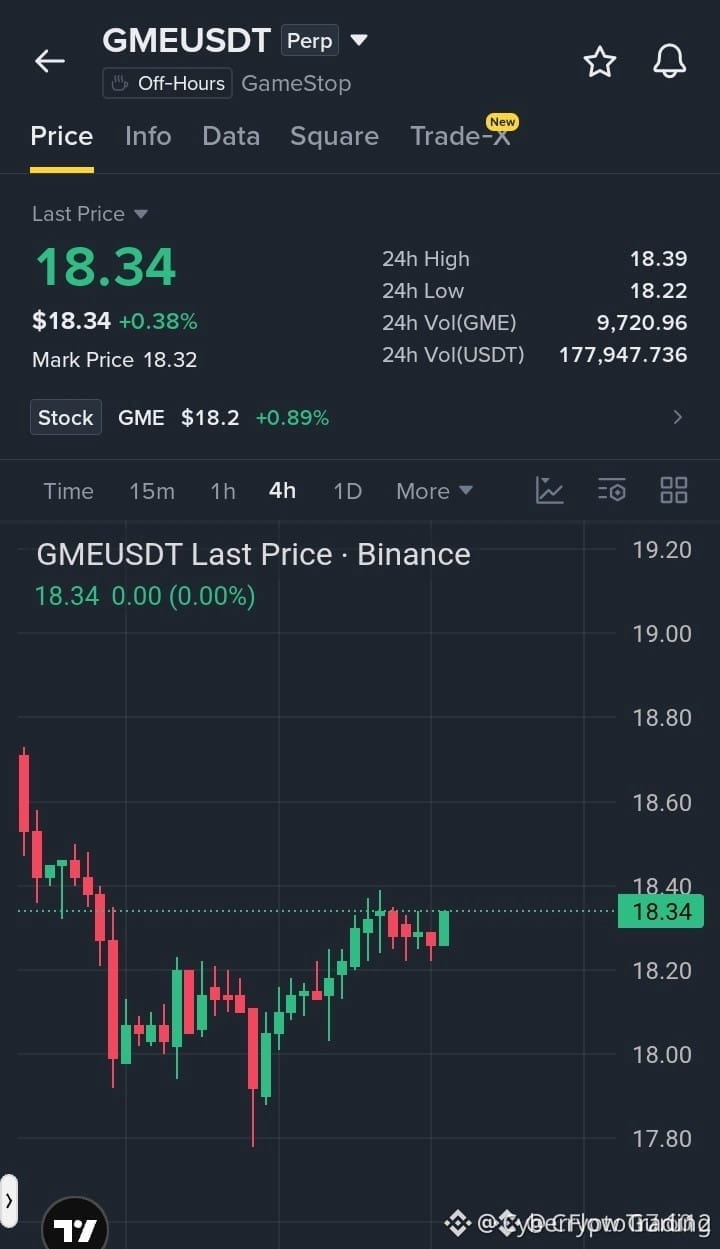
💥 $GME PRESSING $18.40 RESISTANCE AS HIGHER LOWS SIGNAL AN EXPLOSIVE BREAKOUT! 📈
Entry: 18.25 - 18.40 ⚡
Target: 18.60 - 19.00 🚀
Stop Loss: 18.05 ⚠️
Buyers have firmly defended the $17.80–$18.00 demand pocket, churning out a crisp sequence of higher lows on the 4-hour chart. 📊 Momentum is coiling hard against the $18.40 ceiling, hinting that sellers are running out of ammo to stall this expansion.
💡 A decisive close above resistance opens a clear runway toward $19.00 as resting overhead liquidity gets swept. Meanwhile, keep an eye on momentum plays like $TUT and $KAITO for correlated order flow across the board. 🌊
💬 Are you bidding this breakout before the squeeze begins, or waiting for a confirmed retest? 👇
⚠️ Not financial advice. Always manage your risk. 🛡️
🏷️ #GME #Breakout #Crypto #Trading
⚡ 💎
14
·
--
$GME Now 21.13, the last 24 hours are up 5.65%. Funding rate is 0, with 56,000 open contracts. With this kind of rise, it looks more like traders driven by geopolitical event speculation testing the waters—not a long-biased move led by bulls.
Single-signal read: Price is rising, but the funding rate is zero, meaning neither side is willing to pay the cost to add positions. This suggests the rally lacks sustained buy-side support and looks more like quick in-and-out short-term game trading.
Strong counter-evidence: If geopolitical tensions quickly ease, this event-based trading logic could instantly stop working and the price could give back gains directly.
Trading tag: #TradFi #链上美股 #GME
Where do you think this assessment is most likely wrong?
35

·
--
🚨 $GME HITS FIRST TARGET, SMART MONEY RECHARGING! 🦈
The demand block at $GME 's recent low has been aggressively defended, swallowing sell orders and signaling a smart‑money accumulation zone. 📊 Volume spikes on the 1‑hour chart confirm the liquidity sweep, while the price now respects the prior swing high as a fresh bullish order block.
A modest pullback to the 4‑hour support could offer a clean entry, with the next upside target aligned with the prior resistance cluster. 🔍 Expect the market to test the next liquidity pool before any major retracement. 📈
💬 Are you positioning for the next upward thrust or waiting for a deeper liquidity hunt?
⚠️ Not financial advice. Always manage your risk. 🛡️
🏷️ #GME #LongSetup #LiquiditySweep #SmartMoney #Crypto
🔥 💎
20

🚀 $GME SURFACES WITH A SURPRISE LIQUIDITY SWEEP! 🦈
📊 Smart money is dragging $GME into a tight liquidity pocket, snapping the last sell wall with a clean sweep. ⚡ The 4‑hour volume surge and a bullish divergence on the RSI signal that buyers are re‑charging the order block.
🌊 With the order flow turning aggressive, the next swing could flip the recent dip into a fresh rally, especially if the whales lock in positions above the current price. 🦈
💬 Do you see the next wave of buying pressure breaking higher or a trap waiting below? 👇
⚠️ Not financial advice. Always manage your risk. 🛡️
🏷️ #GME #SmartMoney #Momentum #Crypto
🦈 🚀
35

🚨 $GME PIONEERS ON-CHAIN STOCK PAIRING WITH AN $11M INITIAL LIQUIDITY EXPANSION! 🦈
Smart money order flow is testing a novel paradigm as $GME pairs community meme volatility directly with tokenized equity liquidity. 📊 Initial price action swept liquidity up to an $11M market cap before retracing into the $7.1M structural demand area on $8.7M in total volume.
💡 This dual-driven framework diverts transaction fees straight back into underlying stock token treasuries, creating a structural bridge between traditional equity momentum and speculative on-chain velocity. 🔍 As initial positioning settles, institutional eyes are watching whether this treasury-backed mechanism can sustain long-term order flow baseline stability.
💬 Do you view direct equity-paired liquidity pools as the next structural evolution for speculative assets, or is this just temporary narrative rotation? 👇
⚠️ Not financial advice. Always manage your risk. 🛡️
🏷️ #GME #MarketStructure #Crypto #DeFi #Tokenization
🎯 🦈
21
Log in to explore more content
Join global crypto users on Binance Square
⚡️ Get latest and useful information about crypto.
💬 Trusted by the world’s largest crypto exchange.
👍 Discover real insights from verified creators.
Email / Phone number
Trending Topics
1
#CanMicrosoftDeliverOnAI
89,912 views
795 Discussing
2
#CanGoogleDefindItsCore
44,004 views
579 Discussing
3
#FOMCWatch
9.1M views
28,008 Discussing
4
#EthereumDropsBelow$2300
11,230 views
161 Discussing
5
#BitcoinSlipsBelow$80KAgain
31,404 views
124 Discussing
6
#ThailandLaunchesWORPTStablecoinToQRPaymentApp
64,516 views
812 Discussing
7
#StrategySkipsBitcoinPurchasesSpends$205MOnSTRCBuybacks
12,151 views
99 Discussing
8
#BitmineAdds10452ETH
111,189 views
1,224 Discussing
9
#SouthKoreaConsidersEducationTaxOnCryptoExchanges
67,776 views
859 Discussing
10
#OCCUrgesCommunityBanksToEnterStablecoinPayments
45,010 views
610 Discussing