
#criptofacil
criptofacil
22,880 views
73 Discussing
Hot
Latest
·
--
💡 What is a Japanese candlestick?
If you're just starting out in crypto, this is the first thing you need to understand 👇
When you see a chart filled with green and red bars, you're looking at Japanese candlesticks.
📌 Simple explanation:
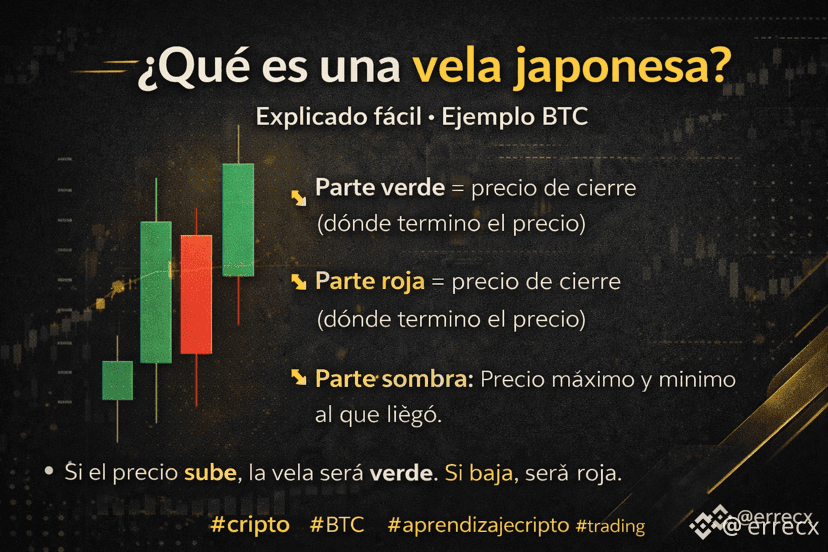
🟢 Green candle
→ The price went up (closed higher than it opened)
🔴 Red candle
→ The price went down (closed lower than it opened)
🕯️ Parts of a candle:
• Body: opening and closing prices
• Upper wick: highest price
• Lower wick: lowest price
📊 Example with BTC:
If BTC opens at 40,000 and closes at 41,000 → green candle
If it opens at 41,000 and closes at 40,500 → red candle
👉 Understanding this is the first step to reading any chart.
📩 In the next post, you'll learn about support and resistance, explained just as easily.
$BTC
#TradingBasico
#BinanceSquare
#AprendeCripto
#CriptoFacil
💡 What is a Japanese candlestick?
If you're just starting out in crypto, this is the first thing you need to understand 👇
When you see a chart filled with green and red bars, you're looking at Japanese candlesticks.
📌 Simple explanation:
🟢 Green candle
→ The price went up (closed higher than it opened)
🔴 Red candle
→ The price went down (closed lower than it opened)
🕯️ Parts of a candle:
• Body: opening and closing prices
• Upper wick: highest price
• Lower wick: lowest price
📊 Example with BTC:
If BTC opens at 40,000 and closes at 41,000 → green candle
If it opens at 41,000 and closes at 40,500 → red candle
👉 Understanding this is the first step to reading any chart.
📩 In the next post, you'll learn about support and resistance, explained just as easily.
$BTC
#TradingBasico
#BinanceSquare
#AprendeCripto
#CriptoFacil
If you're just starting out in crypto, this is the first thing you need to understand 👇
When you see a chart filled with green and red bars, you're looking at Japanese candlesticks.
📌 Simple explanation:
🟢 Green candle
→ The price went up (closed higher than it opened)
🔴 Red candle
→ The price went down (closed lower than it opened)
🕯️ Parts of a candle:
• Body: opening and closing prices
• Upper wick: highest price
• Lower wick: lowest price
📊 Example with BTC:
If BTC opens at 40,000 and closes at 41,000 → green candle
If it opens at 41,000 and closes at 40,500 → red candle
👉 Understanding this is the first step to reading any chart.
📩 In the next post, you'll learn about support and resistance, explained just as easily.
$BTC
#TradingBasico
#BinanceSquare
#AprendeCripto
#CriptoFacil
3
316
Log in to explore more content
Join global crypto users on Binance Square
⚡️ Get latest and useful information about crypto.
💬 Trusted by the world’s largest crypto exchange.
👍 Discover real insights from verified creators.
Email / Phone number
Trending Topics
1
#BTCRebounds80K
456 views
101 Discussing
2
#Binance98PercentReplenished
2,401 views
224 Discussing
3
#USMidterms-WhatAreMarketsExpecting?
211,214 views
1,658 Discussing
4
#USOctoberNFP-AreRateCutsStillPossible
320,689 views
2,547 Discussing
5
#AMDBeatsExpectations-AINarrativeContinues
57,381 views
632 Discussing
6
#CircleQ3Revenue865M
10,848 views
317 Discussing
7
#BinanceIncidentReport
388,655 views
1,909 Discussing
8
#USStocksOpenHigherAsDowGains1.9%
588 views
40 Discussing
9
#ADPUSPrivateEmployersAdd86000JobsInOctober
241 views
22 Discussing
10
#FrenchAssemblyPassesSelfCustodiedCryptoReportingAmendment
310 views
12 Discussing