
#bitcoinspotetfspost$201mnetoutflowforthirdstraightday
bitcoinspotetfspost$201mnetoutflowforthirdstraightday
Hot
Latest

·
--

Article
Why Is Bitcoin Down Today? BTC Slips Below $75,000 as IBIT Drives 78% of a $2.1 Billion ETF ExitBitcoin changed hands at $74,561 at 08:53 UTC on Nov. 10, back below the $75,000 handle. Spot Bitcoin ETFs bled money in six of their last seven sessions, and the October inflation report lands at 13:30 UTC.
The 24-hour change is almost flat, up 0.2%, so the headline understates the damage. BTC is 2.8% below its Nov. 3 close, 10.1% lower over 30 days, and 40.9% under the October 2025 record of $126,080, according to CoinGecko. The overnight low was $73,999.
Price: $74,561 at 08:53 UTC, 24-hour range of $73,999 to $75,477.
Flows: the seven sessions through Nov. 9 produced a net $2.13 billion of redemptions across US spot Bitcoin funds, per Farside Investors.
Concentration: BlackRock’s IBIT accounted for $1.66 billion, or 77.9%, of that total.
Catalyst: October CPI is scheduled for 08:30 ET, after September’s 3.7% annual print.
The tape at 08:53 UTC
The last time Bitcoin printed a daily close this low was Aug. 21, on CoinGecko’s daily series. It has spent the past three weeks grinding lower from an Oct. 22 close of $84,082, and the bounce toward $80,443 on Nov. 5 lasted a single session before sellers took it back to $76,006.
Market capitalization sits at $1.499 trillion on $24.58 billion of 24-hour volume. The $1,478-wide overnight range is narrow against the moves of the past fortnight, and the price is holding a corridor between two widely watched averages.
What changed today is positioning, not the narrative. Bitcoin is now below its 50-week average and above its 200-day average, squeezed into a band roughly $2,500 wide. That is a decision point, and the CPI print lands inside it.
Six Redemptions in Seven Sessions, and One Fund Behind Most of Them
Farside’s daily fund-level data shows the exit is not spread evenly across the twelve US spot Bitcoin products. BlackRock’s IBIT has carried almost four-fifths of it.
Session IBIT FBTC ARKB GBTC BITB Rest Total
Oct. 30 -233.7 -201.0 -129.5 -53.3 -25.7 0.0 -643.2
Nov. 2 -405.3 6.7 0.0 0.0 0.0 0.0 -398.6
Nov. 3 -95.0 6.8 0.0 0.0 21.9 -49.3 -115.6
Nov. 4 -201.2 236.7 19.9 0.0 15.2 4.0 74.6
Nov. 5 -105.0 -199.9 -18.9 -49.9 0.0 -56.5 -430.2
Nov. 6 -403.0 42.8 -20.1 -11.1 -20.5 0.0 -411.9
Nov. 9 -213.2 0.0 -9.9 0.0 0.0 22.1 -201.0
Seven sessions -1,656.4 -107.9 -158.5 -114.3 -9.1 -79.7 -2,125.9
Figures in US$ millions; negative is net redemption. “Rest” covers MSBT, BTC, EZBC, HODL and BTCO. Source: Farside Investors, daily fund flows through Nov. 9.
Read the FBTC column before drawing conclusions from the total. Fidelity’s fund took in $236.7 million on Nov. 4 and another $42.8 million on Nov. 6, and its seven-session net is a modest -$107.9 million. ARKB lost $158.5 million and GBTC $114.3 million. Neither is a stampede.
IBIT is the outlier. It shed money on all seven sessions, including a $403.0 million redemption on Nov. 6 and $405.3 million on Nov. 2. A fund that size bleeding $1.66 billion in seven sessions reads more like a large allocator trimming or unwinding a position than like retail capitulation.
The usual shape of a retail exit shows up in the smaller, more expensive products first. Those funds are close to flat over the same stretch.
What $2.13 Billion Is in Bitcoin
At the average daily close across those seven sessions, $76,691, the net redemption equals roughly 27,700 BTC. That is more than twice the 13,597 BTC MARA Holdings disclosed selling to retire debt earlier today. IBIT’s own share works out to about 21,600 BTC.
Set it against the cumulative $55.57 billion of net inflows the US spot Bitcoin complex has absorbed since January 2024. Seven sessions just removed 3.8% of that. Meaningful, not structural.
A 40% drawdown from the record is too large to pin on one bad fortnight of ETF accounting. The more likely weight sits with the marginal buyer that arrived through these funds in 2025 and has now stopped arriving.
The distinction matters for anyone trying to read the next month. A 3.8% trim can reverse in two good sessions. A change in the marginal buyer is a slower problem.
Two Averages Now Bracket a Falling Price
The chart below plots daily closes from Oct. 11 to Nov. 10 against the 50-week average, currently $75,667. Bitcoin closed below it on Nov. 9 and stayed below it overnight, extending the break that began when it
Three levels matter, all computed from CoinGecko daily closes through Nov. 9 using simple moving averages:
Support at $73,158 is the 200-day average. A daily close beneath it would put the Aug. 21 close of $73,021 and the August consolidation back in play. That is the invalidation for any recovery thesis built on the long-term trend.
Resistance at $75,667 is the 350-day, or 50-week, average. A close above it would neutralise last week’s breakdown and shift focus back to $78,590, the 20-day average.
Momentum is soft but not washed out. The 14-day relative strength index on the same series reads 35.2, still above the 30 threshold conventionally used to mark oversold conditions.
That combination, price under the long average with RSI just above oversold, is why the next two daily closes matter more than the last ten. Sellers have room to push toward $73,158 without producing a single technical extreme.
The 13:30 UTC Print That Sets the Next Move
The Bureau of Labor Statistics publishes October CPI at 08:30 ET, 13:30 UTC, according to the BLS release calendar. September set the bar high.
The BLS reported that “the index for gasoline rose 9.1 percent in September, accounting for over half of the monthly all items increase,” and that “the energy index increased 5.2 percent over the month.”
The agency added that “the all items index rose 3.7 percent for the 12 months ending September, a larger increase than the 3.4-percent increase reported for the 12 months ending in August.” Core inflation came in at 0.3% monthly and 2.6% annually, per the September release.
The monthly path has been uneven, which is why one print can move rate expectations quickly.
Month Mar Apr May Jun Jul Aug Sep
All items, m/m 0.9% 0.6% 0.5% -0.4% 0.1% 0.4% 0.6%
Core, m/m 0.2% 0.4% 0.2% 0.0% 0.2% 0.3% 0.3%
Source: BLS Consumer Price Index, seasonally adjusted monthly changes.
September’s acceleration came mostly from energy. Gasoline rose 9.1% on the month and energy 5.2%, with the energy index up 20.4% over the year. Core inflation, the part the rate path actually tracks, has run between 0.0% and 0.4% a month since March, and the September print pushed Bitcoin below $82,000 when it landed on Oct. 14.
Three outcomes are worth pre-defining, each with its own trigger rather than a forecast:
Core at 0.2% or lower. The disinflation argument survives, front-end yields would have room to fall, and the setup favours a reclaim attempt at $75,667. Invalidation: a close back under $73,999.
Core at 0.3%. The base case on the September trend. Expect the corridor between $73,158 and $75,667 to hold into the US afternoon, with direction decided by ETF flow data after the close.
Core at 0.4% or higher. A third consecutive upside surprise would harden the case for tighter policy. The 200-day average at $73,158 becomes the line in the sand, and a close below it opens the August range.
Treat each of those as a conditional path, not a prediction. The evidence available today does not establish that ETFs are causing the decline; it shows redemptions and price falling in the same window, with the direction of causation unresolved.
The Case That Flows Are Following Price, Not Leading It
ETF flow data is reported with a lag and reflects orders placed the previous session. When Bitcoin drops 5% in a day, the redemptions printed the next morning are partly a reaction to that drop, not its cause. That is the strongest argument against reading the $2.13 billion as a forward-looking signal.
The Nov. 4 session makes the point. FBTC pulled in $236.7 million and the complex as a whole took in $74.6 million while price rose to a $77,385 close. Bitcoin then fell to $80,443 the next session on a $430.2 million outflow. Flows and price have moved together for a fortnight without a clear leader.
There is also the composition problem. A redemption from IBIT can be a basis-trade unwind, a model-portfolio rebalance, or an allocator trimming a position that is still up on the year. None of those require a directional view on Bitcoin, and none show up in the flow number.
Attributing a $9,521 slide from the Oct. 22 close to one fund’s redemptions is the kind of causal claim the data cannot support.
What the flows do show, without interpretation, is that the largest and cheapest US spot vehicle has been a net seller for seven consecutive sessions while its main competitors have not. Whatever the cause, that is where the marginal supply is coming from.
What Would Flip the Read
Two consecutive sessions of net inflows across the complex would be the first clean break in the pattern, and IBIT specifically turning positive would matter more than the aggregate. On price, a daily close back above $75,667 would neutralise the 50-week breakdown; a close below $73,158 would confirm it.
After today, the next scheduled test is the November CPI report on Dec. 10. Between the two, the flow data at the close is the only high-frequency input that speaks to who is actually selling.#BitcoinSpotETFsPost$201MNetOutflowForThirdStraightDay #BitcoinFiveWeeklyLosses #CPITestsDecemberRateOutlook
Why Is Bitcoin Down Today? BTC Slips Below $75,000 as IBIT Drives 78% of a $2.1 Billion ETF Exit
Bitcoin changed hands at $74,561 at 08:53 UTC on Nov. 10, back below the $75,000 handle. Spot Bitcoin ETFs bled money in six of their last seven sessions, and the October inflation report lands at 13:30 UTC.
The 24-hour change is almost flat, up 0.2%, so the headline understates the damage. BTC is 2.8% below its Nov. 3 close, 10.1% lower over 30 days, and 40.9% under the October 2025 record of $126,080, according to CoinGecko. The overnight low was $73,999.
Price: $74,561 at 08:53 UTC, 24-hour range of $73,999 to $75,477.
Flows: the seven sessions through Nov. 9 produced a net $2.13 billion of redemptions across US spot Bitcoin funds, per Farside Investors.
Concentration: BlackRock’s IBIT accounted for $1.66 billion, or 77.9%, of that total.
Catalyst: October CPI is scheduled for 08:30 ET, after September’s 3.7% annual print.
The tape at 08:53 UTC
The last time Bitcoin printed a daily close this low was Aug. 21, on CoinGecko’s daily series. It has spent the past three weeks grinding lower from an Oct. 22 close of $84,082, and the bounce toward $80,443 on Nov. 5 lasted a single session before sellers took it back to $76,006.
Market capitalization sits at $1.499 trillion on $24.58 billion of 24-hour volume. The $1,478-wide overnight range is narrow against the moves of the past fortnight, and the price is holding a corridor between two widely watched averages.
What changed today is positioning, not the narrative. Bitcoin is now below its 50-week average and above its 200-day average, squeezed into a band roughly $2,500 wide. That is a decision point, and the CPI print lands inside it.
Six Redemptions in Seven Sessions, and One Fund Behind Most of Them
Farside’s daily fund-level data shows the exit is not spread evenly across the twelve US spot Bitcoin products. BlackRock’s IBIT has carried almost four-fifths of it.
Session IBIT FBTC ARKB GBTC BITB Rest Total
Oct. 30 -233.7 -201.0 -129.5 -53.3 -25.7 0.0 -643.2
Nov. 2 -405.3 6.7 0.0 0.0 0.0 0.0 -398.6
Nov. 3 -95.0 6.8 0.0 0.0 21.9 -49.3 -115.6
Nov. 4 -201.2 236.7 19.9 0.0 15.2 4.0 74.6
Nov. 5 -105.0 -199.9 -18.9 -49.9 0.0 -56.5 -430.2
Nov. 6 -403.0 42.8 -20.1 -11.1 -20.5 0.0 -411.9
Nov. 9 -213.2 0.0 -9.9 0.0 0.0 22.1 -201.0
Seven sessions -1,656.4 -107.9 -158.5 -114.3 -9.1 -79.7 -2,125.9
Figures in US$ millions; negative is net redemption. “Rest” covers MSBT, BTC, EZBC, HODL and BTCO. Source: Farside Investors, daily fund flows through Nov. 9.
Read the FBTC column before drawing conclusions from the total. Fidelity’s fund took in $236.7 million on Nov. 4 and another $42.8 million on Nov. 6, and its seven-session net is a modest -$107.9 million. ARKB lost $158.5 million and GBTC $114.3 million. Neither is a stampede.
IBIT is the outlier. It shed money on all seven sessions, including a $403.0 million redemption on Nov. 6 and $405.3 million on Nov. 2. A fund that size bleeding $1.66 billion in seven sessions reads more like a large allocator trimming or unwinding a position than like retail capitulation.
The usual shape of a retail exit shows up in the smaller, more expensive products first. Those funds are close to flat over the same stretch.
What $2.13 Billion Is in Bitcoin
At the average daily close across those seven sessions, $76,691, the net redemption equals roughly 27,700 BTC. That is more than twice the 13,597 BTC MARA Holdings disclosed selling to retire debt earlier today. IBIT’s own share works out to about 21,600 BTC.
Set it against the cumulative $55.57 billion of net inflows the US spot Bitcoin complex has absorbed since January 2024. Seven sessions just removed 3.8% of that. Meaningful, not structural.
A 40% drawdown from the record is too large to pin on one bad fortnight of ETF accounting. The more likely weight sits with the marginal buyer that arrived through these funds in 2025 and has now stopped arriving.
The distinction matters for anyone trying to read the next month. A 3.8% trim can reverse in two good sessions. A change in the marginal buyer is a slower problem.
Two Averages Now Bracket a Falling Price
The chart below plots daily closes from Oct. 11 to Nov. 10 against the 50-week average, currently $75,667. Bitcoin closed below it on Nov. 9 and stayed below it overnight, extending the break that began when it
Three levels matter, all computed from CoinGecko daily closes through Nov. 9 using simple moving averages:
Support at $73,158 is the 200-day average. A daily close beneath it would put the Aug. 21 close of $73,021 and the August consolidation back in play. That is the invalidation for any recovery thesis built on the long-term trend.
Resistance at $75,667 is the 350-day, or 50-week, average. A close above it would neutralise last week’s breakdown and shift focus back to $78,590, the 20-day average.
Momentum is soft but not washed out. The 14-day relative strength index on the same series reads 35.2, still above the 30 threshold conventionally used to mark oversold conditions.
That combination, price under the long average with RSI just above oversold, is why the next two daily closes matter more than the last ten. Sellers have room to push toward $73,158 without producing a single technical extreme.
The 13:30 UTC Print That Sets the Next Move
The Bureau of Labor Statistics publishes October CPI at 08:30 ET, 13:30 UTC, according to the BLS release calendar. September set the bar high.
The BLS reported that “the index for gasoline rose 9.1 percent in September, accounting for over half of the monthly all items increase,” and that “the energy index increased 5.2 percent over the month.”
The agency added that “the all items index rose 3.7 percent for the 12 months ending September, a larger increase than the 3.4-percent increase reported for the 12 months ending in August.” Core inflation came in at 0.3% monthly and 2.6% annually, per the September release.
The monthly path has been uneven, which is why one print can move rate expectations quickly.
Month Mar Apr May Jun Jul Aug Sep
All items, m/m 0.9% 0.6% 0.5% -0.4% 0.1% 0.4% 0.6%
Core, m/m 0.2% 0.4% 0.2% 0.0% 0.2% 0.3% 0.3%
Source: BLS Consumer Price Index, seasonally adjusted monthly changes.
September’s acceleration came mostly from energy. Gasoline rose 9.1% on the month and energy 5.2%, with the energy index up 20.4% over the year. Core inflation, the part the rate path actually tracks, has run between 0.0% and 0.4% a month since March, and the September print pushed Bitcoin below $82,000 when it landed on Oct. 14.
Three outcomes are worth pre-defining, each with its own trigger rather than a forecast:
Core at 0.2% or lower. The disinflation argument survives, front-end yields would have room to fall, and the setup favours a reclaim attempt at $75,667. Invalidation: a close back under $73,999.
Core at 0.3%. The base case on the September trend. Expect the corridor between $73,158 and $75,667 to hold into the US afternoon, with direction decided by ETF flow data after the close.
Core at 0.4% or higher. A third consecutive upside surprise would harden the case for tighter policy. The 200-day average at $73,158 becomes the line in the sand, and a close below it opens the August range.
Treat each of those as a conditional path, not a prediction. The evidence available today does not establish that ETFs are causing the decline; it shows redemptions and price falling in the same window, with the direction of causation unresolved.
The Case That Flows Are Following Price, Not Leading It
ETF flow data is reported with a lag and reflects orders placed the previous session. When Bitcoin drops 5% in a day, the redemptions printed the next morning are partly a reaction to that drop, not its cause. That is the strongest argument against reading the $2.13 billion as a forward-looking signal.
The Nov. 4 session makes the point. FBTC pulled in $236.7 million and the complex as a whole took in $74.6 million while price rose to a $77,385 close. Bitcoin then fell to $80,443 the next session on a $430.2 million outflow. Flows and price have moved together for a fortnight without a clear leader.
There is also the composition problem. A redemption from IBIT can be a basis-trade unwind, a model-portfolio rebalance, or an allocator trimming a position that is still up on the year. None of those require a directional view on Bitcoin, and none show up in the flow number.
Attributing a $9,521 slide from the Oct. 22 close to one fund’s redemptions is the kind of causal claim the data cannot support.
What the flows do show, without interpretation, is that the largest and cheapest US spot vehicle has been a net seller for seven consecutive sessions while its main competitors have not. Whatever the cause, that is where the marginal supply is coming from.
What Would Flip the Read
Two consecutive sessions of net inflows across the complex would be the first clean break in the pattern, and IBIT specifically turning positive would matter more than the aggregate. On price, a daily close back above $75,667 would neutralise the 50-week breakdown; a close below $73,158 would confirm it.
After today, the next scheduled test is the November CPI report on Dec. 10. Between the two, the flow data at the close is the only high-frequency input that speaks to who is actually selling.#BitcoinSpotETFsPost$201MNetOutflowForThirdStraightDay #BitcoinFiveWeeklyLosses #CPITestsDecemberRateOutlook
The 24-hour change is almost flat, up 0.2%, so the headline understates the damage. BTC is 2.8% below its Nov. 3 close, 10.1% lower over 30 days, and 40.9% under the October 2025 record of $126,080, according to CoinGecko. The overnight low was $73,999.
Price: $74,561 at 08:53 UTC, 24-hour range of $73,999 to $75,477.
Flows: the seven sessions through Nov. 9 produced a net $2.13 billion of redemptions across US spot Bitcoin funds, per Farside Investors.
Concentration: BlackRock’s IBIT accounted for $1.66 billion, or 77.9%, of that total.
Catalyst: October CPI is scheduled for 08:30 ET, after September’s 3.7% annual print.
The tape at 08:53 UTC
The last time Bitcoin printed a daily close this low was Aug. 21, on CoinGecko’s daily series. It has spent the past three weeks grinding lower from an Oct. 22 close of $84,082, and the bounce toward $80,443 on Nov. 5 lasted a single session before sellers took it back to $76,006.
Market capitalization sits at $1.499 trillion on $24.58 billion of 24-hour volume. The $1,478-wide overnight range is narrow against the moves of the past fortnight, and the price is holding a corridor between two widely watched averages.
What changed today is positioning, not the narrative. Bitcoin is now below its 50-week average and above its 200-day average, squeezed into a band roughly $2,500 wide. That is a decision point, and the CPI print lands inside it.
Six Redemptions in Seven Sessions, and One Fund Behind Most of Them
Farside’s daily fund-level data shows the exit is not spread evenly across the twelve US spot Bitcoin products. BlackRock’s IBIT has carried almost four-fifths of it.
Session IBIT FBTC ARKB GBTC BITB Rest Total
Oct. 30 -233.7 -201.0 -129.5 -53.3 -25.7 0.0 -643.2
Nov. 2 -405.3 6.7 0.0 0.0 0.0 0.0 -398.6
Nov. 3 -95.0 6.8 0.0 0.0 21.9 -49.3 -115.6
Nov. 4 -201.2 236.7 19.9 0.0 15.2 4.0 74.6
Nov. 5 -105.0 -199.9 -18.9 -49.9 0.0 -56.5 -430.2
Nov. 6 -403.0 42.8 -20.1 -11.1 -20.5 0.0 -411.9
Nov. 9 -213.2 0.0 -9.9 0.0 0.0 22.1 -201.0
Seven sessions -1,656.4 -107.9 -158.5 -114.3 -9.1 -79.7 -2,125.9
Figures in US$ millions; negative is net redemption. “Rest” covers MSBT, BTC, EZBC, HODL and BTCO. Source: Farside Investors, daily fund flows through Nov. 9.
Read the FBTC column before drawing conclusions from the total. Fidelity’s fund took in $236.7 million on Nov. 4 and another $42.8 million on Nov. 6, and its seven-session net is a modest -$107.9 million. ARKB lost $158.5 million and GBTC $114.3 million. Neither is a stampede.
IBIT is the outlier. It shed money on all seven sessions, including a $403.0 million redemption on Nov. 6 and $405.3 million on Nov. 2. A fund that size bleeding $1.66 billion in seven sessions reads more like a large allocator trimming or unwinding a position than like retail capitulation.
The usual shape of a retail exit shows up in the smaller, more expensive products first. Those funds are close to flat over the same stretch.
What $2.13 Billion Is in Bitcoin
At the average daily close across those seven sessions, $76,691, the net redemption equals roughly 27,700 BTC. That is more than twice the 13,597 BTC MARA Holdings disclosed selling to retire debt earlier today. IBIT’s own share works out to about 21,600 BTC.
Set it against the cumulative $55.57 billion of net inflows the US spot Bitcoin complex has absorbed since January 2024. Seven sessions just removed 3.8% of that. Meaningful, not structural.
A 40% drawdown from the record is too large to pin on one bad fortnight of ETF accounting. The more likely weight sits with the marginal buyer that arrived through these funds in 2025 and has now stopped arriving.
The distinction matters for anyone trying to read the next month. A 3.8% trim can reverse in two good sessions. A change in the marginal buyer is a slower problem.
Two Averages Now Bracket a Falling Price
The chart below plots daily closes from Oct. 11 to Nov. 10 against the 50-week average, currently $75,667. Bitcoin closed below it on Nov. 9 and stayed below it overnight, extending the break that began when it
Three levels matter, all computed from CoinGecko daily closes through Nov. 9 using simple moving averages:
Support at $73,158 is the 200-day average. A daily close beneath it would put the Aug. 21 close of $73,021 and the August consolidation back in play. That is the invalidation for any recovery thesis built on the long-term trend.
Resistance at $75,667 is the 350-day, or 50-week, average. A close above it would neutralise last week’s breakdown and shift focus back to $78,590, the 20-day average.
Momentum is soft but not washed out. The 14-day relative strength index on the same series reads 35.2, still above the 30 threshold conventionally used to mark oversold conditions.
That combination, price under the long average with RSI just above oversold, is why the next two daily closes matter more than the last ten. Sellers have room to push toward $73,158 without producing a single technical extreme.
The 13:30 UTC Print That Sets the Next Move
The Bureau of Labor Statistics publishes October CPI at 08:30 ET, 13:30 UTC, according to the BLS release calendar. September set the bar high.
The BLS reported that “the index for gasoline rose 9.1 percent in September, accounting for over half of the monthly all items increase,” and that “the energy index increased 5.2 percent over the month.”
The agency added that “the all items index rose 3.7 percent for the 12 months ending September, a larger increase than the 3.4-percent increase reported for the 12 months ending in August.” Core inflation came in at 0.3% monthly and 2.6% annually, per the September release.
The monthly path has been uneven, which is why one print can move rate expectations quickly.
Month Mar Apr May Jun Jul Aug Sep
All items, m/m 0.9% 0.6% 0.5% -0.4% 0.1% 0.4% 0.6%
Core, m/m 0.2% 0.4% 0.2% 0.0% 0.2% 0.3% 0.3%
Source: BLS Consumer Price Index, seasonally adjusted monthly changes.
September’s acceleration came mostly from energy. Gasoline rose 9.1% on the month and energy 5.2%, with the energy index up 20.4% over the year. Core inflation, the part the rate path actually tracks, has run between 0.0% and 0.4% a month since March, and the September print pushed Bitcoin below $82,000 when it landed on Oct. 14.
Three outcomes are worth pre-defining, each with its own trigger rather than a forecast:
Core at 0.2% or lower. The disinflation argument survives, front-end yields would have room to fall, and the setup favours a reclaim attempt at $75,667. Invalidation: a close back under $73,999.
Core at 0.3%. The base case on the September trend. Expect the corridor between $73,158 and $75,667 to hold into the US afternoon, with direction decided by ETF flow data after the close.
Core at 0.4% or higher. A third consecutive upside surprise would harden the case for tighter policy. The 200-day average at $73,158 becomes the line in the sand, and a close below it opens the August range.
Treat each of those as a conditional path, not a prediction. The evidence available today does not establish that ETFs are causing the decline; it shows redemptions and price falling in the same window, with the direction of causation unresolved.
The Case That Flows Are Following Price, Not Leading It
ETF flow data is reported with a lag and reflects orders placed the previous session. When Bitcoin drops 5% in a day, the redemptions printed the next morning are partly a reaction to that drop, not its cause. That is the strongest argument against reading the $2.13 billion as a forward-looking signal.
The Nov. 4 session makes the point. FBTC pulled in $236.7 million and the complex as a whole took in $74.6 million while price rose to a $77,385 close. Bitcoin then fell to $80,443 the next session on a $430.2 million outflow. Flows and price have moved together for a fortnight without a clear leader.
There is also the composition problem. A redemption from IBIT can be a basis-trade unwind, a model-portfolio rebalance, or an allocator trimming a position that is still up on the year. None of those require a directional view on Bitcoin, and none show up in the flow number.
Attributing a $9,521 slide from the Oct. 22 close to one fund’s redemptions is the kind of causal claim the data cannot support.
What the flows do show, without interpretation, is that the largest and cheapest US spot vehicle has been a net seller for seven consecutive sessions while its main competitors have not. Whatever the cause, that is where the marginal supply is coming from.
What Would Flip the Read
Two consecutive sessions of net inflows across the complex would be the first clean break in the pattern, and IBIT specifically turning positive would matter more than the aggregate. On price, a daily close back above $75,667 would neutralise the 50-week breakdown; a close below $73,158 would confirm it.
After today, the next scheduled test is the November CPI report on Dec. 10. Between the two, the flow data at the close is the only high-frequency input that speaks to who is actually selling.#BitcoinSpotETFsPost$201MNetOutflowForThirdStraightDay #BitcoinFiveWeeklyLosses #CPITestsDecemberRateOutlook
BTC-1.62%
BLKUS+0.21%
177


🏦 BITCOIN ETF OUTFLOWS — INSTITUTIONAL DEMAND UNDER THE LENS!
Three consecutive days of reported net outflows deserve attention.
ETF flows can provide useful insight into institutional positioning, but they are only one part of the market picture.
I would monitor:
📊 Whether outflows continue
💰 Total ETF assets
📈 Bitcoin's price reaction
💧 Exchange liquidity
🐋 Broader investor activity
If outflows continue while price weakens, traders may become more cautious.
But one flow trend should never replace technical confirmation.
Follow the data, not the emotion.
#BitcoinSpotETFsPost201MNetOutflowForThirdStrai#BitcoinSpotETFsPost$201MNetOutflowForThirdStraightDay
$ETH $SOL $XRP
🏦 BITCOIN ETF OUTFLOWS — INSTITUTIONAL DEMAND UNDER THE LENS!
Three consecutive days of reported net outflows deserve attention.
ETF flows can provide useful insight into institutional positioning, but they are only one part of the market picture.
I would monitor:
📊 Whether outflows continue
💰 Total ETF assets
📈 Bitcoin's price reaction
💧 Exchange liquidity
🐋 Broader investor activity
If outflows continue while price weakens, traders may become more cautious.
But one flow trend should never replace technical confirmation.
Follow the data, not the emotion.
#BitcoinSpotETFsPost201MNetOutflowForThirdStrai#BitcoinSpotETFsPost$201MNetOutflowForThirdStraightDay
$ETH $SOL $XRP
Three consecutive days of reported net outflows deserve attention.
ETF flows can provide useful insight into institutional positioning, but they are only one part of the market picture.
I would monitor:
📊 Whether outflows continue
💰 Total ETF assets
📈 Bitcoin's price reaction
💧 Exchange liquidity
🐋 Broader investor activity
If outflows continue while price weakens, traders may become more cautious.
But one flow trend should never replace technical confirmation.
Follow the data, not the emotion.
#BitcoinSpotETFsPost201MNetOutflowForThirdStrai#BitcoinSpotETFsPost$201MNetOutflowForThirdStraightDay
$ETH $SOL $XRP
41

⚡ Bitcoin Faces a Liquidity and Confidence Test!
Three consecutive days of ETF outflows highlight cautious investor sentiment. With macroeconomic uncertainty and interest-rate expectations influencing markets, Bitcoin needs stronger spot demand to support a sustained recovery.
$BTC $ETH $SOL $AVAX #BitcoinSpotETFsPost$201MNetOutflowForThirdStraightDay
⚡ Bitcoin Faces a Liquidity and Confidence Test!
Three consecutive days of ETF outflows highlight cautious investor sentiment. With macroeconomic uncertainty and interest-rate expectations influencing markets, Bitcoin needs stronger spot demand to support a sustained recovery.
$BTC $ETH $SOL $AVAX #BitcoinSpotETFsPost$201MNetOutflowForThirdStraightDay
Three consecutive days of ETF outflows highlight cautious investor sentiment. With macroeconomic uncertainty and interest-rate expectations influencing markets, Bitcoin needs stronger spot demand to support a sustained recovery.
$BTC $ETH $SOL $AVAX #BitcoinSpotETFsPost$201MNetOutflowForThirdStraightDay
43

BITCOIN ETF BLOODBATH! $201 MILLION OUTFLOW — BLACKROCK'S IBIT LEADS THE SELLING!Institutional investors are sending another warning signal to the crypto market!
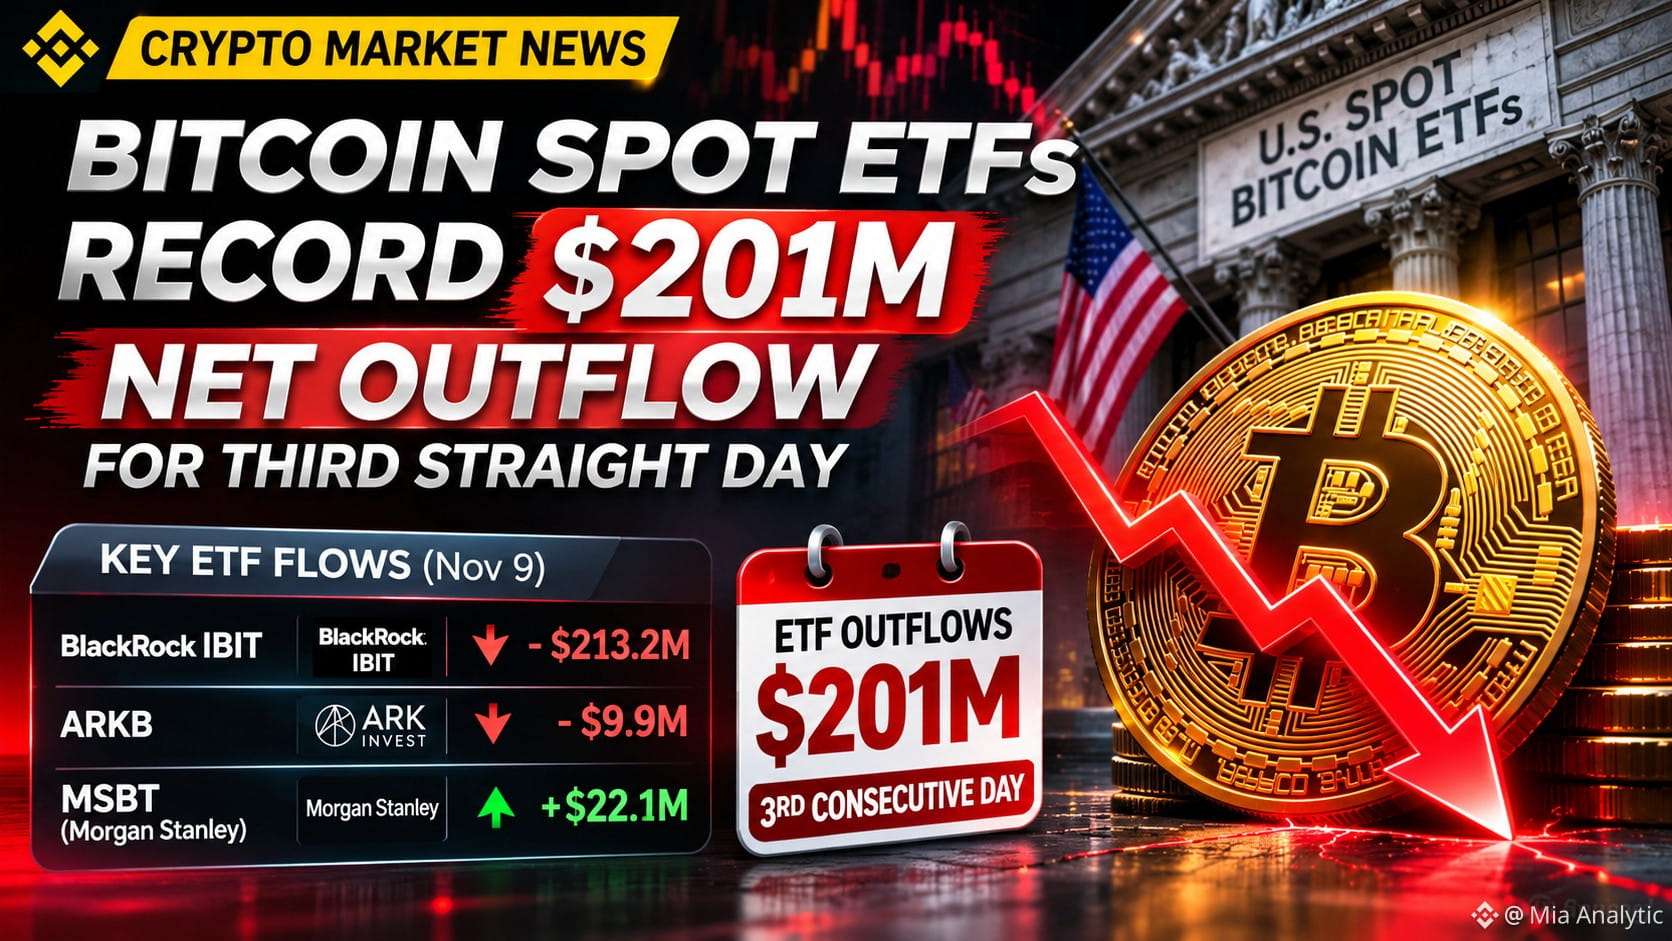
U.S. Spot Bitcoin ETFs recorded approximately $201 million in net outflows on November 9, marking their third consecutive trading day of withdrawals.
And the biggest surprise? BlackRock's IBIT alone experienced approximately $213.2 million in outflows!
🏦 WHAT'S HAPPENING WITH INSTITUTIONAL MONEY?
🔴 Total BTC ETF outflows: $201 million
🔴 BlackRock IBIT: $213.2 million outflows
🔴 ARKB: $9.9 million outflows
🟢 Morgan Stanley MSBT: $22.1 million inflows
IBIT has now recorded seven consecutive trading sessions of withdrawals, totaling approximately $1.66 billion.
The institutional demand that previously supported Bitcoin is showing signs of weakness.
🐻 COULD BITCOIN FALL TOWARD $64,000?
Bitcoin recently traded around $74,200, struggling to regain stronger bullish momentum.
If ETF withdrawals continue and buying demand remains weak, another downside move cannot be ruled out.
A deeper correction toward $64,000 is a bearish scenario to watch, not a confirmed price target.
⚠️ Heavy selling could also trigger leveraged long liquidations, increasing short-term volatility.
📊 WHAT SHOULD CRYPTO TRADERS DO NOW?
1️⃣ Avoid emotional trading: Don't panic-sell or blindly chase a falling market.
2️⃣ Manage your risk: Use appropriate stop-loss levels and avoid excessive leverage.
3️⃣ Consider gradual accumulation: If you're investing long term, consider spreading entries rather than investing everything at once.
4️⃣ Watch ETF flows: Sustained positive inflows could provide an important signal that institutional demand is returning.
🔥 MY MARKET TAKE
I'm watching Bitcoin carefully.
The current ETF outflows are concerning, but they don't automatically mean the bull market is over. Morgan Stanley's inflow also shows that institutional activity isn't moving in just one direction.
The next major signals will be Bitcoin's ability to hold support, ETF flow recovery, and broader market sentiment.
💬 THE BIG QUESTION:
Will Bitcoin defend the $74K region, or are we heading toward $64K next?
Are you buying the dip, holding your positions, or waiting for confirmation?
👇 Drop your thoughts in the comments!
$BTC $ETH $INIT
#BitcoinSpotETFsPost$201MNetOutflowForThirdStraightDay
#BitcoinETFs #CryptoMarket #BitcoinCrash #CryptoTrading
{spot}(INITUSDT)
{spot}(ETHUSDT)
{spot}(BTCUSDT)
BITCOIN ETF BLOODBATH! $201 MILLION OUTFLOW — BLACKROCK'S IBIT LEADS THE SELLING!
Institutional investors are sending another warning signal to the crypto market!
U.S. Spot Bitcoin ETFs recorded approximately $201 million in net outflows on November 9, marking their third consecutive trading day of withdrawals.
And the biggest surprise? BlackRock's IBIT alone experienced approximately $213.2 million in outflows!
🏦 WHAT'S HAPPENING WITH INSTITUTIONAL MONEY?
🔴 Total BTC ETF outflows: $201 million
🔴 BlackRock IBIT: $213.2 million outflows
🔴 ARKB: $9.9 million outflows
🟢 Morgan Stanley MSBT: $22.1 million inflows
IBIT has now recorded seven consecutive trading sessions of withdrawals, totaling approximately $1.66 billion.
The institutional demand that previously supported Bitcoin is showing signs of weakness.
🐻 COULD BITCOIN FALL TOWARD $64,000?
Bitcoin recently traded around $74,200, struggling to regain stronger bullish momentum.
If ETF withdrawals continue and buying demand remains weak, another downside move cannot be ruled out.
A deeper correction toward $64,000 is a bearish scenario to watch, not a confirmed price target.
⚠️ Heavy selling could also trigger leveraged long liquidations, increasing short-term volatility.
📊 WHAT SHOULD CRYPTO TRADERS DO NOW?
1️⃣ Avoid emotional trading: Don't panic-sell or blindly chase a falling market.
2️⃣ Manage your risk: Use appropriate stop-loss levels and avoid excessive leverage.
3️⃣ Consider gradual accumulation: If you're investing long term, consider spreading entries rather than investing everything at once.
4️⃣ Watch ETF flows: Sustained positive inflows could provide an important signal that institutional demand is returning.
🔥 MY MARKET TAKE
I'm watching Bitcoin carefully.
The current ETF outflows are concerning, but they don't automatically mean the bull market is over. Morgan Stanley's inflow also shows that institutional activity isn't moving in just one direction.
The next major signals will be Bitcoin's ability to hold support, ETF flow recovery, and broader market sentiment.
💬 THE BIG QUESTION:
Will Bitcoin defend the $74K region, or are we heading toward $64K next?
Are you buying the dip, holding your positions, or waiting for confirmation?
👇 Drop your thoughts in the comments!
$BTC $ETH $INIT
#BitcoinSpotETFsPost$201MNetOutflowForThirdStraightDay
#BitcoinETFs #CryptoMarket #BitcoinCrash #CryptoTrading
U.S. Spot Bitcoin ETFs recorded approximately $201 million in net outflows on November 9, marking their third consecutive trading day of withdrawals.
And the biggest surprise? BlackRock's IBIT alone experienced approximately $213.2 million in outflows!
🏦 WHAT'S HAPPENING WITH INSTITUTIONAL MONEY?
🔴 Total BTC ETF outflows: $201 million
🔴 BlackRock IBIT: $213.2 million outflows
🔴 ARKB: $9.9 million outflows
🟢 Morgan Stanley MSBT: $22.1 million inflows
IBIT has now recorded seven consecutive trading sessions of withdrawals, totaling approximately $1.66 billion.
The institutional demand that previously supported Bitcoin is showing signs of weakness.
🐻 COULD BITCOIN FALL TOWARD $64,000?
Bitcoin recently traded around $74,200, struggling to regain stronger bullish momentum.
If ETF withdrawals continue and buying demand remains weak, another downside move cannot be ruled out.
A deeper correction toward $64,000 is a bearish scenario to watch, not a confirmed price target.
⚠️ Heavy selling could also trigger leveraged long liquidations, increasing short-term volatility.
📊 WHAT SHOULD CRYPTO TRADERS DO NOW?
1️⃣ Avoid emotional trading: Don't panic-sell or blindly chase a falling market.
2️⃣ Manage your risk: Use appropriate stop-loss levels and avoid excessive leverage.
3️⃣ Consider gradual accumulation: If you're investing long term, consider spreading entries rather than investing everything at once.
4️⃣ Watch ETF flows: Sustained positive inflows could provide an important signal that institutional demand is returning.
🔥 MY MARKET TAKE
I'm watching Bitcoin carefully.
The current ETF outflows are concerning, but they don't automatically mean the bull market is over. Morgan Stanley's inflow also shows that institutional activity isn't moving in just one direction.
The next major signals will be Bitcoin's ability to hold support, ETF flow recovery, and broader market sentiment.
💬 THE BIG QUESTION:
Will Bitcoin defend the $74K region, or are we heading toward $64K next?
Are you buying the dip, holding your positions, or waiting for confirmation?
👇 Drop your thoughts in the comments!
$BTC $ETH $INIT
#BitcoinSpotETFsPost$201MNetOutflowForThirdStraightDay
#BitcoinETFs #CryptoMarket #BitcoinCrash #CryptoTrading
253
BITCOIN SPOT ETFs: $201M NET OUTFLOW — 3RD STRAIGHT DAY!🚨 BITCOIN SPOT ETFs: $201M NET OUTFLOW — 3RD STRAIGHT DAY!
Institutional money is leaving continuously — everyone is scared before CPI?
Bitcoin Spot ETFs posted a net outflow for the THIRD straight day. Total: $201M+ in a single day.
And the biggest hit came from BlackRock:
BlackRock Outflows (Yesterday):
- IBIT (Bitcoin ETF): -$213.23M
- ETHA (Ethereum ETF): -$118.28M / $119.3M
- Both combined: -$332.5M in a single session!
Why Is Money Flowing Out?
1. CPI FEAR — Today 8:30 AM ET (6:30 PM PKT) October CPI is coming
2. Fed HIKE Fear — 80%+ chance of a 25 bps hike in December
3. 3 Days Of Continuous Selling — Institutions are reducing risk, in wait & watch mode
What Does It Mean?
When money flows out of ETFs, it means Wall Street’s big players are selling BTC — they are reducing exposure before seeing the CPI result.
If CPI Comes HOT (0.4%+):
- More outflow will come
- BTC can go further down
If CPI Comes SOFT (0.1%):
- This same outflow will turn into INFLOW tomorrow
- BTC will see a sharp bounce
This 3-day outflow is not panic — it’s a WAIT for CPI.
What’s your plan?
🔴 = Sold before CPI, I am safe
🟢 = This is the dip, I am BUYING
#BitcoinSpotETFsPost$201MNetOutflowForThirdStraightDay
#ETFs #blackRock
#Bitcoin
#cpi
$BTC $ETH $IBIT.ETF
BITCOIN SPOT ETFs: $201M NET OUTFLOW — 3RD STRAIGHT DAY!
🚨 BITCOIN SPOT ETFs: $201M NET OUTFLOW — 3RD STRAIGHT DAY!
Institutional money is leaving continuously — everyone is scared before CPI?
Bitcoin Spot ETFs posted a net outflow for the THIRD straight day. Total: $201M+ in a single day.
And the biggest hit came from BlackRock:
BlackRock Outflows (Yesterday):
- IBIT (Bitcoin ETF): -$213.23M
- ETHA (Ethereum ETF): -$118.28M / $119.3M
- Both combined: -$332.5M in a single session!
Why Is Money Flowing Out?
1. CPI FEAR — Today 8:30 AM ET (6:30 PM PKT) October CPI is coming
2. Fed HIKE Fear — 80%+ chance of a 25 bps hike in December
3. 3 Days Of Continuous Selling — Institutions are reducing risk, in wait & watch mode
What Does It Mean?
When money flows out of ETFs, it means Wall Street’s big players are selling BTC — they are reducing exposure before seeing the CPI result.
If CPI Comes HOT (0.4%+):
- More outflow will come
- BTC can go further down
If CPI Comes SOFT (0.1%):
- This same outflow will turn into INFLOW tomorrow
- BTC will see a sharp bounce
This 3-day outflow is not panic — it’s a WAIT for CPI.
What’s your plan?
🔴 = Sold before CPI, I am safe
🟢 = This is the dip, I am BUYING
#BitcoinSpotETFsPost$201MNetOutflowForThirdStraightDay
#ETFs #blackRock
#Bitcoin
#cpi
$BTC $ETH $IBIT.ETF
Institutional money is leaving continuously — everyone is scared before CPI?
Bitcoin Spot ETFs posted a net outflow for the THIRD straight day. Total: $201M+ in a single day.
And the biggest hit came from BlackRock:
BlackRock Outflows (Yesterday):
- IBIT (Bitcoin ETF): -$213.23M
- ETHA (Ethereum ETF): -$118.28M / $119.3M
- Both combined: -$332.5M in a single session!
Why Is Money Flowing Out?
1. CPI FEAR — Today 8:30 AM ET (6:30 PM PKT) October CPI is coming
2. Fed HIKE Fear — 80%+ chance of a 25 bps hike in December
3. 3 Days Of Continuous Selling — Institutions are reducing risk, in wait & watch mode
What Does It Mean?
When money flows out of ETFs, it means Wall Street’s big players are selling BTC — they are reducing exposure before seeing the CPI result.
If CPI Comes HOT (0.4%+):
- More outflow will come
- BTC can go further down
If CPI Comes SOFT (0.1%):
- This same outflow will turn into INFLOW tomorrow
- BTC will see a sharp bounce
This 3-day outflow is not panic — it’s a WAIT for CPI.
What’s your plan?
🔴 = Sold before CPI, I am safe
🟢 = This is the dip, I am BUYING
#BitcoinSpotETFsPost$201MNetOutflowForThirdStraightDay
#ETFs #blackRock
#Bitcoin
#cpi
$BTC $ETH $IBIT.ETF
74

·
--
Bearish
#BitcoinSpotETFsPost$201MNetOutflowForThirdStraightDay
🚨 Bitcoin Spot ETFs Record $201M Outflow for Third Straight Day
U.S. spot Bitcoin ETFs recorded approximately $201 million in net outflows on Nov. 9, marking the third consecutive trading day of withdrawals.
BlackRock’s IBIT led the outflows with $213.2M, while ARKB saw $9.9M leave the fund. Morgan Stanley’s MSBT was the main positive exception, attracting about $22.1M.
The key point for traders is the persistence of the selling pressure, not simply the $201M figure. ETF flows are an important indicator of institutional demand, so continued net withdrawals can weigh on sentiment and reduce a major source of spot-market buying pressure.
However, Monday’s outflow was smaller than the previous session, suggesting the pace of withdrawals has moderated. Traders will be watching whether ETF flows stabilize or extend the streak in the coming sessions.
Bottom line: The current ETF flow picture remains cautious/bearish, but one should watch the next few sessions before treating the trend as a decisive shift in institutional positioning.
#Bitcoin #BTC #BitcoinETF #CryptoMarket
$AKE $BARD $TST
{future}(TSTUSDT)
{future}(BARDUSDT)
{future}(AKEUSDT)
#BitcoinSpotETFsPost$201MNetOutflowForThirdStraightDay
🚨 Bitcoin Spot ETFs Record $201M Outflow for Third Straight Day
U.S. spot Bitcoin ETFs recorded approximately $201 million in net outflows on Nov. 9, marking the third consecutive trading day of withdrawals.
BlackRock’s IBIT led the outflows with $213.2M, while ARKB saw $9.9M leave the fund. Morgan Stanley’s MSBT was the main positive exception, attracting about $22.1M.
The key point for traders is the persistence of the selling pressure, not simply the $201M figure. ETF flows are an important indicator of institutional demand, so continued net withdrawals can weigh on sentiment and reduce a major source of spot-market buying pressure.
However, Monday’s outflow was smaller than the previous session, suggesting the pace of withdrawals has moderated. Traders will be watching whether ETF flows stabilize or extend the streak in the coming sessions.
Bottom line: The current ETF flow picture remains cautious/bearish, but one should watch the next few sessions before treating the trend as a decisive shift in institutional positioning.
#Bitcoin #BTC #BitcoinETF #CryptoMarket
$AKE $BARD $TST
🚨 Bitcoin Spot ETFs Record $201M Outflow for Third Straight Day
U.S. spot Bitcoin ETFs recorded approximately $201 million in net outflows on Nov. 9, marking the third consecutive trading day of withdrawals.
BlackRock’s IBIT led the outflows with $213.2M, while ARKB saw $9.9M leave the fund. Morgan Stanley’s MSBT was the main positive exception, attracting about $22.1M.
The key point for traders is the persistence of the selling pressure, not simply the $201M figure. ETF flows are an important indicator of institutional demand, so continued net withdrawals can weigh on sentiment and reduce a major source of spot-market buying pressure.
However, Monday’s outflow was smaller than the previous session, suggesting the pace of withdrawals has moderated. Traders will be watching whether ETF flows stabilize or extend the streak in the coming sessions.
Bottom line: The current ETF flow picture remains cautious/bearish, but one should watch the next few sessions before treating the trend as a decisive shift in institutional positioning.
#Bitcoin #BTC #BitcoinETF #CryptoMarket
$AKE $BARD $TST
122

·
--

Article
Bitcoin ETF Outflows Hit $201M as Fear Index Holds at 32 Ahead of CPIYou’ve probably felt the tension this week. Bitcoin is grinding near $74,200 after another round of heavy liquidations, the Fear & Greed Index is stuck at 32, and the institutional flows that once seemed like a one-way street have flipped hard the other way. Spot Bitcoin ETFs just posted another $201 million net outflow on Monday, led by BlackRock’s IBIT shedding $213 million on its seventh consecutive red day. For leveraged desks and longer-term holders alike, the setup is uncomfortable: short-term price action is being driven by product redemptions even as on-chain smart money keeps buying.
This isn’t the clean post-halving rally many expected. It’s a market where ETF flow data is currently overriding accumulation signals, creating a clear positioning conflict right as the CPI print lands.
Why This Matters Right Now
The numbers are straightforward and not particularly pretty. US spot Bitcoin ETFs lost $201 million on November 9. IBIT alone accounted for more than the total, with only Morgan Stanley’s smaller MSBT showing modest inflows. Over the past week the category has bled more than $1.2 billion. BlackRock’s fund has now seen roughly $1.66 billion leave since late October. That’s real money leaving the most liquid institutional vehicle.
Sentiment matches the flows. The Crypto Fear & Greed Index sits at 32 — solidly in “Fear” territory. It has hovered in this zone for days after recent sessions saw liquidations exceed $1.1 billion. Open interest remains elevated, funding rates are still positive in the 0.007–0.01% range per 8 hours, and the bias of liquidations has leaned long. Traders are still carrying exposure, but the margin for error is thin.
Meanwhile the Fed’s next move is still being priced with high odds of another hike in the nearer term. That macro backdrop has made risk assets more sensitive to any inflation surprise. The CPI number today is the immediate catalyst. A hotter print would reinforce the rate-hike narrative and likely pressure Bitcoin further; a softer one could give the market temporary breathing room. Either way, the ETF selling has already set a cautious tone.
What stands out to me is the divergence. Retail wallets have contracted while larger “smart money” addresses have continued to add. Strategy (formerly MicroStrategy) just disclosed another 1,036 BTC purchase at an average near $79,000. Corporate treasury buying is still happening even as the product vehicles that many institutions use are seeing redemptions. That tension is the story.
Technical & On-Chain View
Price action has been choppy. Bitcoin is trading below recent support levels that mattered, with the 200-day moving average not far below as a potential floor. The range around $73,500–$76,000 has become the near-term battlefield. Funding remaining modestly positive while open interest stays high suggests leveraged longs have not fully capitulated, which leaves the market vulnerable to further long liquidations if price dips.
On-chain the picture is more nuanced. Smaller wallets have been reducing exposure — the classic retail contraction that often accompanies fear. At the same time, accumulation by larger addresses has continued. Roughly 14,200 BTC appear to have moved into smart-money cohorts even as ETFs lost over $1.2 billion on a weekly basis. That kind of divergence is worth watching. It doesn’t guarantee a bottom, but it does suggest that the selling pressure is concentrated in the ETF wrapper rather than across the entire holder base.
The positive funding and elevated open interest keep the market two-sided. A sharp move either direction can still force significant liquidations. Right now the path of least resistance appears to be lower until the ETF outflows slow or reverse.
Fundamental and Treasury Dynamics
ETF flows have become the dominant short-term price driver for a reason. These products represent the cleanest on-ramp for traditional capital. When they see sustained redemptions, it removes a key source of demand and can amplify any risk-off move. BlackRock’s IBIT has been the primary source of the recent selling, which matters because of its size and the signaling effect it carries.
Contrast that with Strategy’s ongoing purchases. Buying another 1,036 BTC at roughly $79,000 while the market sits near $74,000 shows a different time horizon. Treasury vehicles and long-term corporate holders are still treating Bitcoin as a strategic reserve asset. Product flows and treasury flows are not the same thing, and the current period is highlighting the difference.
Tokenomics remain supportive in the longer frame — fixed supply, ongoing institutional interest, and a maturing derivatives market. But none of that overrides the near-term reality that ETF redemptions are extracting liquidity from the market at a meaningful pace. The data suggests institutional product holders are reducing exposure faster than the broader on-chain base is accumulating.
Risks, Opportunities, and Practical Positioning
The immediate risk is clear: another leg lower if CPI disappoints and the ETF outflows continue. Liquidation clusters below current prices mean a break of recent lows could accelerate. Persistent positive funding also means any downside move still has fuel from crowded longs.
On the opportunity side, the divergence between ETF selling and smart-money accumulation is worth tracking. If the outflows moderate after the CPI event and larger addresses continue adding, the setup becomes more constructive for medium-term holders. Strategy’s buying at higher average prices than the current spot level is a reminder that some of the largest players are still comfortable adding on weakness.
For practical purposes, leveraged desks face the tighter constraints. Elevated open interest and the multi-session ETF streak raise the cost of being wrong on direction. Spot and longer-horizon investors can afford to look through the noise more easily, but even they should acknowledge that flow data is currently the louder signal.
A simple comparison of the two flows:
Metric
Recent Reading
Implication
Spot BTC ETF net flow
–$201M (Mon), >$1.2B weekly
Product selling pressure
Strategy latest buy
+1,036 BTC @ ~$79k
Treasury accumulation continues
Smart-money addresses
+~14,200 BTC (recent window)
On-chain buying vs product outflow
Fear & Greed
32 (Fear)
Cautious positioning
The conflict is real. ETF redemptions are setting the short-term tone while on-chain and treasury buyers keep accumulating. That tension usually resolves one way or the other after a catalyst like today’s CPI.
Looking ahead, the market doesn’t need perfection. It needs the ETF bleeding to slow and for the next macro print not to reinforce the higher-for-longer narrative too aggressively. Until then, the data is telling a story of institutional product caution colliding with longer-term conviction. Traders who respect both signals — and size accordingly — will be better positioned than those who treat either one as the whole picture.
#CPITestsDecemberRateOutlook #BitcoinFiveWeeklyLosses #BitcoinSpotETFsPost$201MNetOutflowForThirdStraightDay $BTC
{spot}(BTCUSDT)
Bitcoin ETF Outflows Hit $201M as Fear Index Holds at 32 Ahead of CPI
You’ve probably felt the tension this week. Bitcoin is grinding near $74,200 after another round of heavy liquidations, the Fear & Greed Index is stuck at 32, and the institutional flows that once seemed like a one-way street have flipped hard the other way. Spot Bitcoin ETFs just posted another $201 million net outflow on Monday, led by BlackRock’s IBIT shedding $213 million on its seventh consecutive red day. For leveraged desks and longer-term holders alike, the setup is uncomfortable: short-term price action is being driven by product redemptions even as on-chain smart money keeps buying.
This isn’t the clean post-halving rally many expected. It’s a market where ETF flow data is currently overriding accumulation signals, creating a clear positioning conflict right as the CPI print lands.
Why This Matters Right Now
The numbers are straightforward and not particularly pretty. US spot Bitcoin ETFs lost $201 million on November 9. IBIT alone accounted for more than the total, with only Morgan Stanley’s smaller MSBT showing modest inflows. Over the past week the category has bled more than $1.2 billion. BlackRock’s fund has now seen roughly $1.66 billion leave since late October. That’s real money leaving the most liquid institutional vehicle.
Sentiment matches the flows. The Crypto Fear & Greed Index sits at 32 — solidly in “Fear” territory. It has hovered in this zone for days after recent sessions saw liquidations exceed $1.1 billion. Open interest remains elevated, funding rates are still positive in the 0.007–0.01% range per 8 hours, and the bias of liquidations has leaned long. Traders are still carrying exposure, but the margin for error is thin.
Meanwhile the Fed’s next move is still being priced with high odds of another hike in the nearer term. That macro backdrop has made risk assets more sensitive to any inflation surprise. The CPI number today is the immediate catalyst. A hotter print would reinforce the rate-hike narrative and likely pressure Bitcoin further; a softer one could give the market temporary breathing room. Either way, the ETF selling has already set a cautious tone.
What stands out to me is the divergence. Retail wallets have contracted while larger “smart money” addresses have continued to add. Strategy (formerly MicroStrategy) just disclosed another 1,036 BTC purchase at an average near $79,000. Corporate treasury buying is still happening even as the product vehicles that many institutions use are seeing redemptions. That tension is the story.
Technical & On-Chain View
Price action has been choppy. Bitcoin is trading below recent support levels that mattered, with the 200-day moving average not far below as a potential floor. The range around $73,500–$76,000 has become the near-term battlefield. Funding remaining modestly positive while open interest stays high suggests leveraged longs have not fully capitulated, which leaves the market vulnerable to further long liquidations if price dips.
On-chain the picture is more nuanced. Smaller wallets have been reducing exposure — the classic retail contraction that often accompanies fear. At the same time, accumulation by larger addresses has continued. Roughly 14,200 BTC appear to have moved into smart-money cohorts even as ETFs lost over $1.2 billion on a weekly basis. That kind of divergence is worth watching. It doesn’t guarantee a bottom, but it does suggest that the selling pressure is concentrated in the ETF wrapper rather than across the entire holder base.
The positive funding and elevated open interest keep the market two-sided. A sharp move either direction can still force significant liquidations. Right now the path of least resistance appears to be lower until the ETF outflows slow or reverse.
Fundamental and Treasury Dynamics
ETF flows have become the dominant short-term price driver for a reason. These products represent the cleanest on-ramp for traditional capital. When they see sustained redemptions, it removes a key source of demand and can amplify any risk-off move. BlackRock’s IBIT has been the primary source of the recent selling, which matters because of its size and the signaling effect it carries.
Contrast that with Strategy’s ongoing purchases. Buying another 1,036 BTC at roughly $79,000 while the market sits near $74,000 shows a different time horizon. Treasury vehicles and long-term corporate holders are still treating Bitcoin as a strategic reserve asset. Product flows and treasury flows are not the same thing, and the current period is highlighting the difference.
Tokenomics remain supportive in the longer frame — fixed supply, ongoing institutional interest, and a maturing derivatives market. But none of that overrides the near-term reality that ETF redemptions are extracting liquidity from the market at a meaningful pace. The data suggests institutional product holders are reducing exposure faster than the broader on-chain base is accumulating.
Risks, Opportunities, and Practical Positioning
The immediate risk is clear: another leg lower if CPI disappoints and the ETF outflows continue. Liquidation clusters below current prices mean a break of recent lows could accelerate. Persistent positive funding also means any downside move still has fuel from crowded longs.
On the opportunity side, the divergence between ETF selling and smart-money accumulation is worth tracking. If the outflows moderate after the CPI event and larger addresses continue adding, the setup becomes more constructive for medium-term holders. Strategy’s buying at higher average prices than the current spot level is a reminder that some of the largest players are still comfortable adding on weakness.
For practical purposes, leveraged desks face the tighter constraints. Elevated open interest and the multi-session ETF streak raise the cost of being wrong on direction. Spot and longer-horizon investors can afford to look through the noise more easily, but even they should acknowledge that flow data is currently the louder signal.
A simple comparison of the two flows:
Metric
Recent Reading
Implication
Spot BTC ETF net flow
–$201M (Mon), >$1.2B weekly
Product selling pressure
Strategy latest buy
+1,036 BTC @ ~$79k
Treasury accumulation continues
Smart-money addresses
+~14,200 BTC (recent window)
On-chain buying vs product outflow
Fear & Greed
32 (Fear)
Cautious positioning
The conflict is real. ETF redemptions are setting the short-term tone while on-chain and treasury buyers keep accumulating. That tension usually resolves one way or the other after a catalyst like today’s CPI.
Looking ahead, the market doesn’t need perfection. It needs the ETF bleeding to slow and for the next macro print not to reinforce the higher-for-longer narrative too aggressively. Until then, the data is telling a story of institutional product caution colliding with longer-term conviction. Traders who respect both signals — and size accordingly — will be better positioned than those who treat either one as the whole picture.
#CPITestsDecemberRateOutlook #BitcoinFiveWeeklyLosses #BitcoinSpotETFsPost$201MNetOutflowForThirdStraightDay $BTC
This isn’t the clean post-halving rally many expected. It’s a market where ETF flow data is currently overriding accumulation signals, creating a clear positioning conflict right as the CPI print lands.
Why This Matters Right Now
The numbers are straightforward and not particularly pretty. US spot Bitcoin ETFs lost $201 million on November 9. IBIT alone accounted for more than the total, with only Morgan Stanley’s smaller MSBT showing modest inflows. Over the past week the category has bled more than $1.2 billion. BlackRock’s fund has now seen roughly $1.66 billion leave since late October. That’s real money leaving the most liquid institutional vehicle.
Sentiment matches the flows. The Crypto Fear & Greed Index sits at 32 — solidly in “Fear” territory. It has hovered in this zone for days after recent sessions saw liquidations exceed $1.1 billion. Open interest remains elevated, funding rates are still positive in the 0.007–0.01% range per 8 hours, and the bias of liquidations has leaned long. Traders are still carrying exposure, but the margin for error is thin.
Meanwhile the Fed’s next move is still being priced with high odds of another hike in the nearer term. That macro backdrop has made risk assets more sensitive to any inflation surprise. The CPI number today is the immediate catalyst. A hotter print would reinforce the rate-hike narrative and likely pressure Bitcoin further; a softer one could give the market temporary breathing room. Either way, the ETF selling has already set a cautious tone.
What stands out to me is the divergence. Retail wallets have contracted while larger “smart money” addresses have continued to add. Strategy (formerly MicroStrategy) just disclosed another 1,036 BTC purchase at an average near $79,000. Corporate treasury buying is still happening even as the product vehicles that many institutions use are seeing redemptions. That tension is the story.
Technical & On-Chain View
Price action has been choppy. Bitcoin is trading below recent support levels that mattered, with the 200-day moving average not far below as a potential floor. The range around $73,500–$76,000 has become the near-term battlefield. Funding remaining modestly positive while open interest stays high suggests leveraged longs have not fully capitulated, which leaves the market vulnerable to further long liquidations if price dips.
On-chain the picture is more nuanced. Smaller wallets have been reducing exposure — the classic retail contraction that often accompanies fear. At the same time, accumulation by larger addresses has continued. Roughly 14,200 BTC appear to have moved into smart-money cohorts even as ETFs lost over $1.2 billion on a weekly basis. That kind of divergence is worth watching. It doesn’t guarantee a bottom, but it does suggest that the selling pressure is concentrated in the ETF wrapper rather than across the entire holder base.
The positive funding and elevated open interest keep the market two-sided. A sharp move either direction can still force significant liquidations. Right now the path of least resistance appears to be lower until the ETF outflows slow or reverse.
Fundamental and Treasury Dynamics
ETF flows have become the dominant short-term price driver for a reason. These products represent the cleanest on-ramp for traditional capital. When they see sustained redemptions, it removes a key source of demand and can amplify any risk-off move. BlackRock’s IBIT has been the primary source of the recent selling, which matters because of its size and the signaling effect it carries.
Contrast that with Strategy’s ongoing purchases. Buying another 1,036 BTC at roughly $79,000 while the market sits near $74,000 shows a different time horizon. Treasury vehicles and long-term corporate holders are still treating Bitcoin as a strategic reserve asset. Product flows and treasury flows are not the same thing, and the current period is highlighting the difference.
Tokenomics remain supportive in the longer frame — fixed supply, ongoing institutional interest, and a maturing derivatives market. But none of that overrides the near-term reality that ETF redemptions are extracting liquidity from the market at a meaningful pace. The data suggests institutional product holders are reducing exposure faster than the broader on-chain base is accumulating.
Risks, Opportunities, and Practical Positioning
The immediate risk is clear: another leg lower if CPI disappoints and the ETF outflows continue. Liquidation clusters below current prices mean a break of recent lows could accelerate. Persistent positive funding also means any downside move still has fuel from crowded longs.
On the opportunity side, the divergence between ETF selling and smart-money accumulation is worth tracking. If the outflows moderate after the CPI event and larger addresses continue adding, the setup becomes more constructive for medium-term holders. Strategy’s buying at higher average prices than the current spot level is a reminder that some of the largest players are still comfortable adding on weakness.
For practical purposes, leveraged desks face the tighter constraints. Elevated open interest and the multi-session ETF streak raise the cost of being wrong on direction. Spot and longer-horizon investors can afford to look through the noise more easily, but even they should acknowledge that flow data is currently the louder signal.
A simple comparison of the two flows:
Metric
Recent Reading
Implication
Spot BTC ETF net flow
–$201M (Mon), >$1.2B weekly
Product selling pressure
Strategy latest buy
+1,036 BTC @ ~$79k
Treasury accumulation continues
Smart-money addresses
+~14,200 BTC (recent window)
On-chain buying vs product outflow
Fear & Greed
32 (Fear)
Cautious positioning
The conflict is real. ETF redemptions are setting the short-term tone while on-chain and treasury buyers keep accumulating. That tension usually resolves one way or the other after a catalyst like today’s CPI.
Looking ahead, the market doesn’t need perfection. It needs the ETF bleeding to slow and for the next macro print not to reinforce the higher-for-longer narrative too aggressively. Until then, the data is telling a story of institutional product caution colliding with longer-term conviction. Traders who respect both signals — and size accordingly — will be better positioned than those who treat either one as the whole picture.
#CPITestsDecemberRateOutlook #BitcoinFiveWeeklyLosses #BitcoinSpotETFsPost$201MNetOutflowForThirdStraightDay $BTC
عمسوس:
112
789
47
60
789

·
--
Bullish
Partly True
#BitcoinSpotETFsPost$201MNetOutflowForThirdStraightDay
🚨 BITCOIN SLIPS BELOW $75K AS IBIT DRIVES 78% OF $2.1B SPOT ETF OUTFLOWS AHEAD OF U.S. CPI! 📉📊
Bitcoin ($BTC) is currently trading around $74,561 after dipping to an overnight low of $73,999, extending a three-week corrective channel down 10.1% over the last 30 days and 40.9% off its October 2025 all-time high ($126,080).
With $2.13 Billion pulled from U.S. Spot Bitcoin ETFs across six of the last seven sessions, all eyes now turn to the October U.S. CPI release (13:30 UTC) to determine whether price holds its 200-day moving average or breaks into a deeper structural correction.
📌 ETF Flow Breakdown: IBIT Institutional De-Risking vs. Retail Holding
The $2.13 Billion net outflow across the U.S. spot Bitcoin ETF complex shows high institutional concentration:
🏦 BlackRock’s IBIT Leads Outflows: IBIT alone accounted for $1.66 Billion (77.9%) of total net redemptions over the 7-session stretch, including massive single-day outflows of $405.3M (Nov 2) and $403.0M (Nov 6).
🛡️ Competitors Hold Relatively Steady: Fidelity’s FBTC logged a modest net exit of -$107.9M (cushioned by +$236.7M on Nov 4), while ARKB (-$158.5M) and GBTC (-$114.3M) saw routine rebalancing.
$INIT
{future}(INITUSDT)
📉 Key Technical Levels: Bracketed Between Two Major Moving Averages
Bitcoin is currently squeezed inside a tight $2,500 decision band:
🚧 Resistance ($75,667): The 50-week (350-day) simple moving average. A daily close above this level neutralizes last week's breakdown and re-opens targets toward the 20-day SMA ($78,590).
$HYPE
{future}(HYPEUSDT)
🛡️ Critical Support ($73,158): The 200-day simple moving average. A daily close beneath $73,158 invalidates recovery setups and risks retesting the August consolidation floor (~$73,021).
📊 RSI Check: The 14-day RSI sits at 35.2—momentum is soft, but not yet oversold (<30), leaving sellers technical room to test $73,158.
$ONE
{future}(ONEUSDT)
#NvidiaInvestigatesAfterHuang’sAffairApology #BitcoinFiveWeeklyLosses #CPI数据 #Binance
#BitcoinSpotETFsPost$201MNetOutflowForThirdStraightDay
🚨 BITCOIN SLIPS BELOW $75K AS IBIT DRIVES 78% OF $2.1B SPOT ETF OUTFLOWS AHEAD OF U.S. CPI! 📉📊
Bitcoin ($BTC) is currently trading around $74,561 after dipping to an overnight low of $73,999, extending a three-week corrective channel down 10.1% over the last 30 days and 40.9% off its October 2025 all-time high ($126,080).
With $2.13 Billion pulled from U.S. Spot Bitcoin ETFs across six of the last seven sessions, all eyes now turn to the October U.S. CPI release (13:30 UTC) to determine whether price holds its 200-day moving average or breaks into a deeper structural correction.
📌 ETF Flow Breakdown: IBIT Institutional De-Risking vs. Retail Holding
The $2.13 Billion net outflow across the U.S. spot Bitcoin ETF complex shows high institutional concentration:
🏦 BlackRock’s IBIT Leads Outflows: IBIT alone accounted for $1.66 Billion (77.9%) of total net redemptions over the 7-session stretch, including massive single-day outflows of $405.3M (Nov 2) and $403.0M (Nov 6).
🛡️ Competitors Hold Relatively Steady: Fidelity’s FBTC logged a modest net exit of -$107.9M (cushioned by +$236.7M on Nov 4), while ARKB (-$158.5M) and GBTC (-$114.3M) saw routine rebalancing.
$INIT
📉 Key Technical Levels: Bracketed Between Two Major Moving Averages
Bitcoin is currently squeezed inside a tight $2,500 decision band:
🚧 Resistance ($75,667): The 50-week (350-day) simple moving average. A daily close above this level neutralizes last week's breakdown and re-opens targets toward the 20-day SMA ($78,590).
$HYPE
🛡️ Critical Support ($73,158): The 200-day simple moving average. A daily close beneath $73,158 invalidates recovery setups and risks retesting the August consolidation floor (~$73,021).
📊 RSI Check: The 14-day RSI sits at 35.2—momentum is soft, but not yet oversold (<30), leaving sellers technical room to test $73,158.
$ONE
#NvidiaInvestigatesAfterHuang’sAffairApology #BitcoinFiveWeeklyLosses #CPI数据 #Binance
🚨 BITCOIN SLIPS BELOW $75K AS IBIT DRIVES 78% OF $2.1B SPOT ETF OUTFLOWS AHEAD OF U.S. CPI! 📉📊
Bitcoin ($BTC) is currently trading around $74,561 after dipping to an overnight low of $73,999, extending a three-week corrective channel down 10.1% over the last 30 days and 40.9% off its October 2025 all-time high ($126,080).
With $2.13 Billion pulled from U.S. Spot Bitcoin ETFs across six of the last seven sessions, all eyes now turn to the October U.S. CPI release (13:30 UTC) to determine whether price holds its 200-day moving average or breaks into a deeper structural correction.
📌 ETF Flow Breakdown: IBIT Institutional De-Risking vs. Retail Holding
The $2.13 Billion net outflow across the U.S. spot Bitcoin ETF complex shows high institutional concentration:
🏦 BlackRock’s IBIT Leads Outflows: IBIT alone accounted for $1.66 Billion (77.9%) of total net redemptions over the 7-session stretch, including massive single-day outflows of $405.3M (Nov 2) and $403.0M (Nov 6).
🛡️ Competitors Hold Relatively Steady: Fidelity’s FBTC logged a modest net exit of -$107.9M (cushioned by +$236.7M on Nov 4), while ARKB (-$158.5M) and GBTC (-$114.3M) saw routine rebalancing.
$INIT
📉 Key Technical Levels: Bracketed Between Two Major Moving Averages
Bitcoin is currently squeezed inside a tight $2,500 decision band:
🚧 Resistance ($75,667): The 50-week (350-day) simple moving average. A daily close above this level neutralizes last week's breakdown and re-opens targets toward the 20-day SMA ($78,590).
$HYPE
🛡️ Critical Support ($73,158): The 200-day simple moving average. A daily close beneath $73,158 invalidates recovery setups and risks retesting the August consolidation floor (~$73,021).
📊 RSI Check: The 14-day RSI sits at 35.2—momentum is soft, but not yet oversold (<30), leaving sellers technical room to test $73,158.
$ONE
#NvidiaInvestigatesAfterHuang’sAffairApology #BitcoinFiveWeeklyLosses #CPI数据 #Binance

1
372
📉 Bitcoin ETFs Record Third Consecutive Day of Outflows!
US spot Bitcoin ETFs recorded $201 million in net withdrawals on November 9. The continued outflows highlight cautious institutional sentiment as investors reassess crypto market exposure. $BTC $ETH $BNB #BitcoinSpotETFsPost$201MNetOutflowForThirdStraightDay
📉 Bitcoin ETFs Record Third Consecutive Day of Outflows!
US spot Bitcoin ETFs recorded $201 million in net withdrawals on November 9. The continued outflows highlight cautious institutional sentiment as investors reassess crypto market exposure. $BTC $ETH $BNB #BitcoinSpotETFsPost$201MNetOutflowForThirdStraightDay
US spot Bitcoin ETFs recorded $201 million in net withdrawals on November 9. The continued outflows highlight cautious institutional sentiment as investors reassess crypto market exposure. $BTC $ETH $BNB #BitcoinSpotETFsPost$201MNetOutflowForThirdStraightDay
51
🏦 BlackRock Leads the ETF Outflow Story!
BlackRock's IBIT recorded approximately $213.2 million in daily withdrawals, exceeding the overall market's net outflow. Meanwhile, Morgan Stanley's MSBT attracted fresh capital. ETF flows remain mixed. $BTC $ETH $SOL #BitcoinSpotETFsPost$201MNetOutflowForThirdStraightDay
🏦 BlackRock Leads the ETF Outflow Story!
BlackRock's IBIT recorded approximately $213.2 million in daily withdrawals, exceeding the overall market's net outflow. Meanwhile, Morgan Stanley's MSBT attracted fresh capital. ETF flows remain mixed. $BTC $ETH $SOL #BitcoinSpotETFsPost$201MNetOutflowForThirdStraightDay
BlackRock's IBIT recorded approximately $213.2 million in daily withdrawals, exceeding the overall market's net outflow. Meanwhile, Morgan Stanley's MSBT attracted fresh capital. ETF flows remain mixed. $BTC $ETH $SOL #BitcoinSpotETFsPost$201MNetOutflowForThirdStraightDay
54

·
--
BITCOIN ETF OUTFLOWS HIT $201 MILLION — THREE STRAIGHT DAYS OF SELLING PRESSURE
Bitcoin institutional demand is facing another warning signal as US spot Bitcoin ETFs recorded $201 million in net outflows on November 9, marking the third consecutive trading day of withdrawals.
BlackRock’s IBIT led the outflows with approximately $213.2 million, while Morgan Stanley’s MSBT attracted around $22.1 million in fresh capital.
Why does this matter?
Three consecutive outflow sessions suggest institutional appetite is cooling. However, ETF withdrawals do not automatically mean Bitcoin's long-term bullish outlook is over.
The wider crypto market is also showing caution, with Binance's market overview reporting a Fear & Greed Index of 28 (Fear).
What to watch next:
- Whether ETF outflows continue or reverse
- Whether BlackRock IBIT sees fresh inflows
- Whether Bitcoin can regain stronger buying momentum
- Whether institutional demand returns across major funds
{future}(BTCUSDT)
The big question: Is this temporary institutional profit-taking, or the beginning of a deeper Bitcoin correction?
#BitcoinSpotETFsPost$201MNetOutflowForThirdStraightDay
BITCOIN ETF OUTFLOWS HIT $201 MILLION — THREE STRAIGHT DAYS OF SELLING PRESSURE
Bitcoin institutional demand is facing another warning signal as US spot Bitcoin ETFs recorded $201 million in net outflows on November 9, marking the third consecutive trading day of withdrawals.
BlackRock’s IBIT led the outflows with approximately $213.2 million, while Morgan Stanley’s MSBT attracted around $22.1 million in fresh capital.
Why does this matter?
Three consecutive outflow sessions suggest institutional appetite is cooling. However, ETF withdrawals do not automatically mean Bitcoin's long-term bullish outlook is over.
The wider crypto market is also showing caution, with Binance's market overview reporting a Fear & Greed Index of 28 (Fear).
What to watch next:
- Whether ETF outflows continue or reverse
- Whether BlackRock IBIT sees fresh inflows
- Whether Bitcoin can regain stronger buying momentum
- Whether institutional demand returns across major funds
The big question: Is this temporary institutional profit-taking, or the beginning of a deeper Bitcoin correction?
#BitcoinSpotETFsPost$201MNetOutflowForThirdStraightDay
Bitcoin institutional demand is facing another warning signal as US spot Bitcoin ETFs recorded $201 million in net outflows on November 9, marking the third consecutive trading day of withdrawals.
BlackRock’s IBIT led the outflows with approximately $213.2 million, while Morgan Stanley’s MSBT attracted around $22.1 million in fresh capital.
Why does this matter?
Three consecutive outflow sessions suggest institutional appetite is cooling. However, ETF withdrawals do not automatically mean Bitcoin's long-term bullish outlook is over.
The wider crypto market is also showing caution, with Binance's market overview reporting a Fear & Greed Index of 28 (Fear).
What to watch next:
- Whether ETF outflows continue or reverse
- Whether BlackRock IBIT sees fresh inflows
- Whether Bitcoin can regain stronger buying momentum
- Whether institutional demand returns across major funds
The big question: Is this temporary institutional profit-taking, or the beginning of a deeper Bitcoin correction?
#BitcoinSpotETFsPost$201MNetOutflowForThirdStraightDay

BTC-1.62%
BLKUS+0.21%
112

Partly True
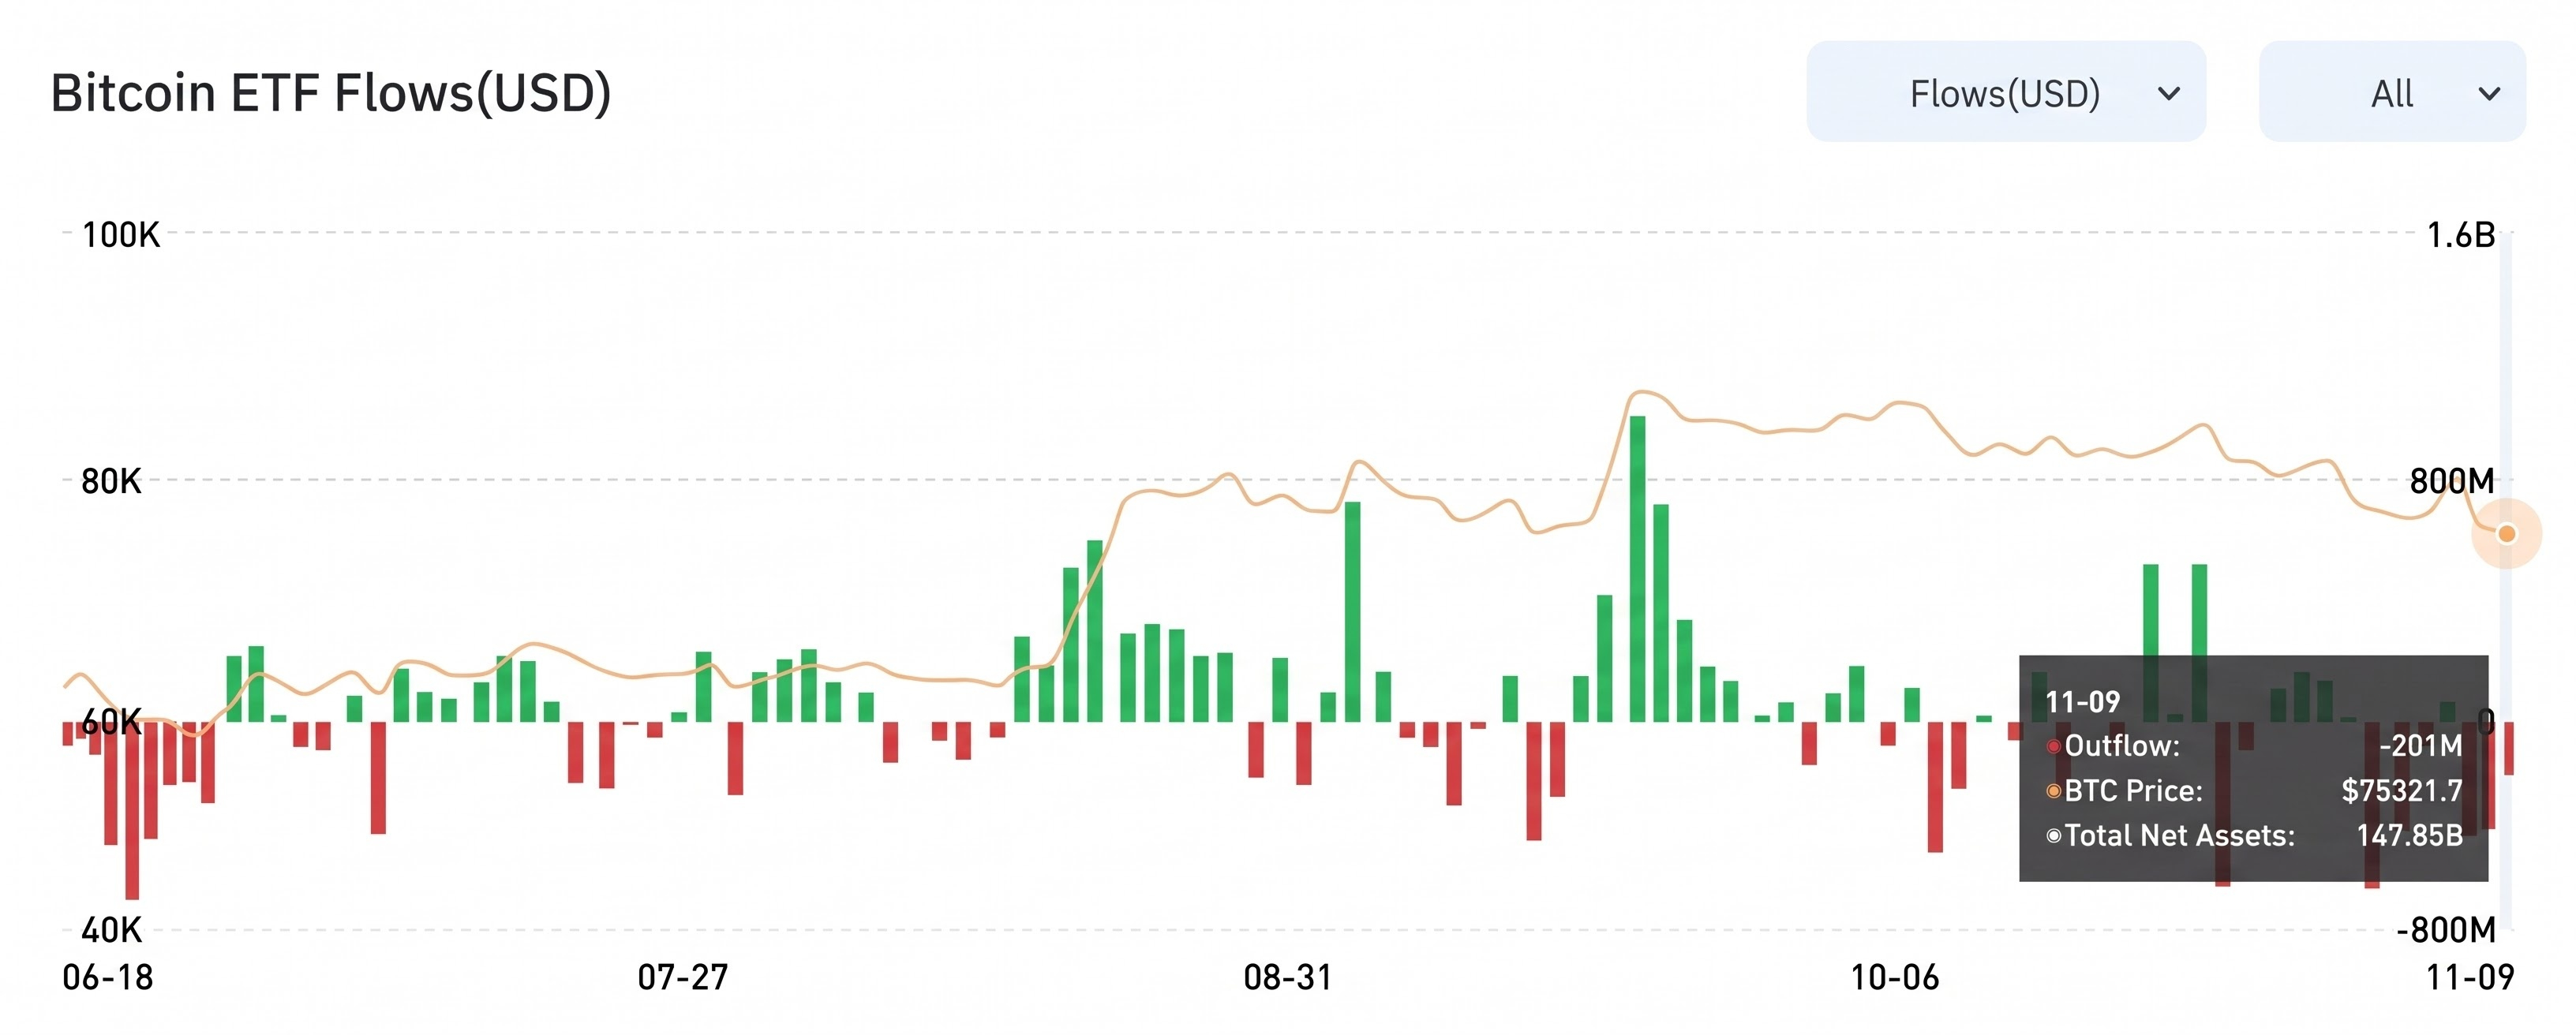
Article
Bitcoin Spot ETFs Post $201M Net Outflow For Third Straight DayThe institutional tide is shifting! 🚨 For the third consecutive day, US Spot Bitcoin ETFs have recorded capital flight, with a massive $201 million exiting the market on November 9.
Here is the exact data breakdown:
📉 Daily Net Outflow: -$201M
💰 BTC Price: $75,321.7
💼 Total Net Assets: $147.85B
What Does This Mean for Traders?
Three straight days of red show institutional players are cooling off. With major funds like BlackRock's IBIT driving the withdrawals, it signals aggressive profit-taking and portfolio rebalancing as Bitcoin holds near the $75K mark.
Is a Dump Imminent?
Don't panic yet. ETF flows are only one piece of the puzzle. While a $201M daily drop is notable, the staggering $147.85B in total ETF net assets provides a heavy structural floor. Retail volume, on-chain metrics, and macro conditions are still heavily in play.
My Trading Gameplan:
I am closely monitoring the $75K support zone. If this outflow trend extends into a fourth day, expect elevated short-term volatility. Keep your leverage low, manage risk strictly, and trade the chart—not just the headline news.
Are you buying the dip or waiting for confirmation? Drop your thoughts below! 👇
$BTC $SOXL $MVLL
{future}(MVLLUSDT)
{future}(SOXLUSDT)
{future}(BTCUSDT)
#BitcoinSpotETFsPost$201MNetOutflowForThirdStraightDay #bitcoin #cryptotrading #BitcoinETFs #BinanceSquare
Bitcoin Spot ETFs Post $201M Net Outflow For Third Straight Day
The institutional tide is shifting! 🚨 For the third consecutive day, US Spot Bitcoin ETFs have recorded capital flight, with a massive $201 million exiting the market on November 9.
Here is the exact data breakdown:
📉 Daily Net Outflow: -$201M
💰 BTC Price: $75,321.7
💼 Total Net Assets: $147.85B
What Does This Mean for Traders?
Three straight days of red show institutional players are cooling off. With major funds like BlackRock's IBIT driving the withdrawals, it signals aggressive profit-taking and portfolio rebalancing as Bitcoin holds near the $75K mark.
Is a Dump Imminent?
Don't panic yet. ETF flows are only one piece of the puzzle. While a $201M daily drop is notable, the staggering $147.85B in total ETF net assets provides a heavy structural floor. Retail volume, on-chain metrics, and macro conditions are still heavily in play.
My Trading Gameplan:
I am closely monitoring the $75K support zone. If this outflow trend extends into a fourth day, expect elevated short-term volatility. Keep your leverage low, manage risk strictly, and trade the chart—not just the headline news.
Are you buying the dip or waiting for confirmation? Drop your thoughts below! 👇
$BTC $SOXL $MVLL
#BitcoinSpotETFsPost$201MNetOutflowForThirdStraightDay #bitcoin #cryptotrading #BitcoinETFs #BinanceSquare
Here is the exact data breakdown:
📉 Daily Net Outflow: -$201M
💰 BTC Price: $75,321.7
💼 Total Net Assets: $147.85B
What Does This Mean for Traders?
Three straight days of red show institutional players are cooling off. With major funds like BlackRock's IBIT driving the withdrawals, it signals aggressive profit-taking and portfolio rebalancing as Bitcoin holds near the $75K mark.
Is a Dump Imminent?
Don't panic yet. ETF flows are only one piece of the puzzle. While a $201M daily drop is notable, the staggering $147.85B in total ETF net assets provides a heavy structural floor. Retail volume, on-chain metrics, and macro conditions are still heavily in play.
My Trading Gameplan:
I am closely monitoring the $75K support zone. If this outflow trend extends into a fourth day, expect elevated short-term volatility. Keep your leverage low, manage risk strictly, and trade the chart—not just the headline news.
Are you buying the dip or waiting for confirmation? Drop your thoughts below! 👇
$BTC $SOXL $MVLL
#BitcoinSpotETFsPost$201MNetOutflowForThirdStraightDay #bitcoin #cryptotrading #BitcoinETFs #BinanceSquare
1
349

·
--
Bearish
It’s over, folks! 📉 Bitcoin Spot ETFs just “evaporated” another $201 million, marking three straight days of heavy outflows.
What a buzzkill! Even BlackRock’s “big brother,” IBIT, saw a record $213 million in net outflows in a single day, while Morgan Stanley just can’t keep carrying the load.
With selling like this, the million-dollar question is: will BTC break below 64k?
Looking at sentiment right now, the bears are roaring while the bulls are running for cover. If money keeps fleeing these whale-sized funds, a retest of the 64k zone is entirely possible, wiping out highly leveraged Long positions.
What should traders do right now?
1. Close the app and go to sleep: Don’t get trigger-happy, or you might end up with nothing.
2. Set a stop-loss: Protect your money first.
3. DCA your way through it: If you believe in the future, split your capital and accumulate gradually.
Note: This is not financial advice!
#BitcoinSpotETFsPost$201MNetOutflowForThirdStraightDay #BitcoinETFs #CryptoMarket #BitcoinCrash #CryptoTrading #VINHTOCDO
👉 Click below to trade and support me:
$BTC
{spot}(BTCUSDT)
$ETH
{spot}(ETHUSDT)
$INIT
{future}(INITUSDT)
It’s over, folks! 📉 Bitcoin Spot ETFs just “evaporated” another $201 million, marking three straight days of heavy outflows.
What a buzzkill! Even BlackRock’s “big brother,” IBIT, saw a record $213 million in net outflows in a single day, while Morgan Stanley just can’t keep carrying the load.
With selling like this, the million-dollar question is: will BTC break below 64k?
Looking at sentiment right now, the bears are roaring while the bulls are running for cover. If money keeps fleeing these whale-sized funds, a retest of the 64k zone is entirely possible, wiping out highly leveraged Long positions.
What should traders do right now?
1. Close the app and go to sleep: Don’t get trigger-happy, or you might end up with nothing.
2. Set a stop-loss: Protect your money first.
3. DCA your way through it: If you believe in the future, split your capital and accumulate gradually.
Note: This is not financial advice!
#BitcoinSpotETFsPost$201MNetOutflowForThirdStraightDay #BitcoinETFs #CryptoMarket #BitcoinCrash #CryptoTrading #VINHTOCDO
👉 Click below to trade and support me:
$BTC
$ETH
$INIT
What a buzzkill! Even BlackRock’s “big brother,” IBIT, saw a record $213 million in net outflows in a single day, while Morgan Stanley just can’t keep carrying the load.
With selling like this, the million-dollar question is: will BTC break below 64k?
Looking at sentiment right now, the bears are roaring while the bulls are running for cover. If money keeps fleeing these whale-sized funds, a retest of the 64k zone is entirely possible, wiping out highly leveraged Long positions.
What should traders do right now?
1. Close the app and go to sleep: Don’t get trigger-happy, or you might end up with nothing.
2. Set a stop-loss: Protect your money first.
3. DCA your way through it: If you believe in the future, split your capital and accumulate gradually.
Note: This is not financial advice!
#BitcoinSpotETFsPost$201MNetOutflowForThirdStraightDay #BitcoinETFs #CryptoMarket #BitcoinCrash #CryptoTrading #VINHTOCDO
👉 Click below to trade and support me:
$BTC
$ETH
$INIT
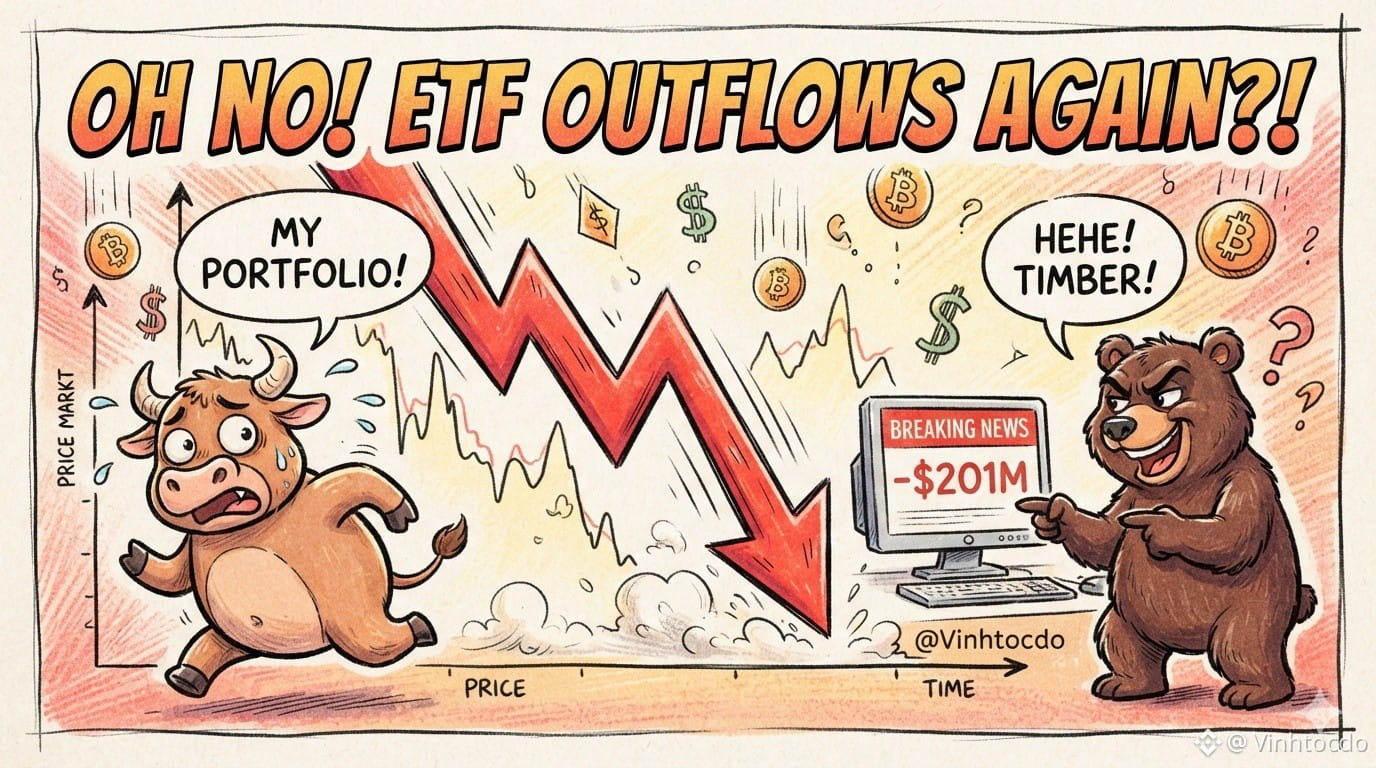
3
1.2k
💡 ETF Flows Are an Important Bitcoin Signal!
Spot Bitcoin ETFs provide insight into investor demand, but daily withdrawals do not automatically mean long-term confidence has disappeared. Watch whether institutional flows stabilize in the coming sessions.
$BTC $BNB $ETH $ADA #BitcoinSpotETFsPost$201MNetOutflowForThirdStraightDay
💡 ETF Flows Are an Important Bitcoin Signal!
Spot Bitcoin ETFs provide insight into investor demand, but daily withdrawals do not automatically mean long-term confidence has disappeared. Watch whether institutional flows stabilize in the coming sessions.
$BTC $BNB $ETH $ADA #BitcoinSpotETFsPost$201MNetOutflowForThirdStraightDay
Spot Bitcoin ETFs provide insight into investor demand, but daily withdrawals do not automatically mean long-term confidence has disappeared. Watch whether institutional flows stabilize in the coming sessions.
$BTC $BNB $ETH $ADA #BitcoinSpotETFsPost$201MNetOutflowForThirdStraightDay
19

·
--

Article
MarketThe crypto market is bleeding... Bitcoin breaks below $75,000, and altcoins follow! [1]
Crypto markets are experiencing a sharp and sudden downturn, with Bitcoin (BTC) falling below the $75,000 mark to around $74,000. The market has lost more than $1 billion due to forced liquidations of futures contracts in just 24 hours. [1, 2, 3, 4]
Market
The crypto market is bleeding... Bitcoin breaks below $75,000, and altcoins follow! [1]
Crypto markets are experiencing a sharp and sudden downturn, with Bitcoin (BTC) falling below the $75,000 mark to around $74,000. The market has lost more than $1 billion due to forced liquidations of futures contracts in just 24 hours. [1, 2, 3, 4]
Crypto markets are experiencing a sharp and sudden downturn, with Bitcoin (BTC) falling below the $75,000 mark to around $74,000. The market has lost more than $1 billion due to forced liquidations of futures contracts in just 24 hours. [1, 2, 3, 4]
1
255

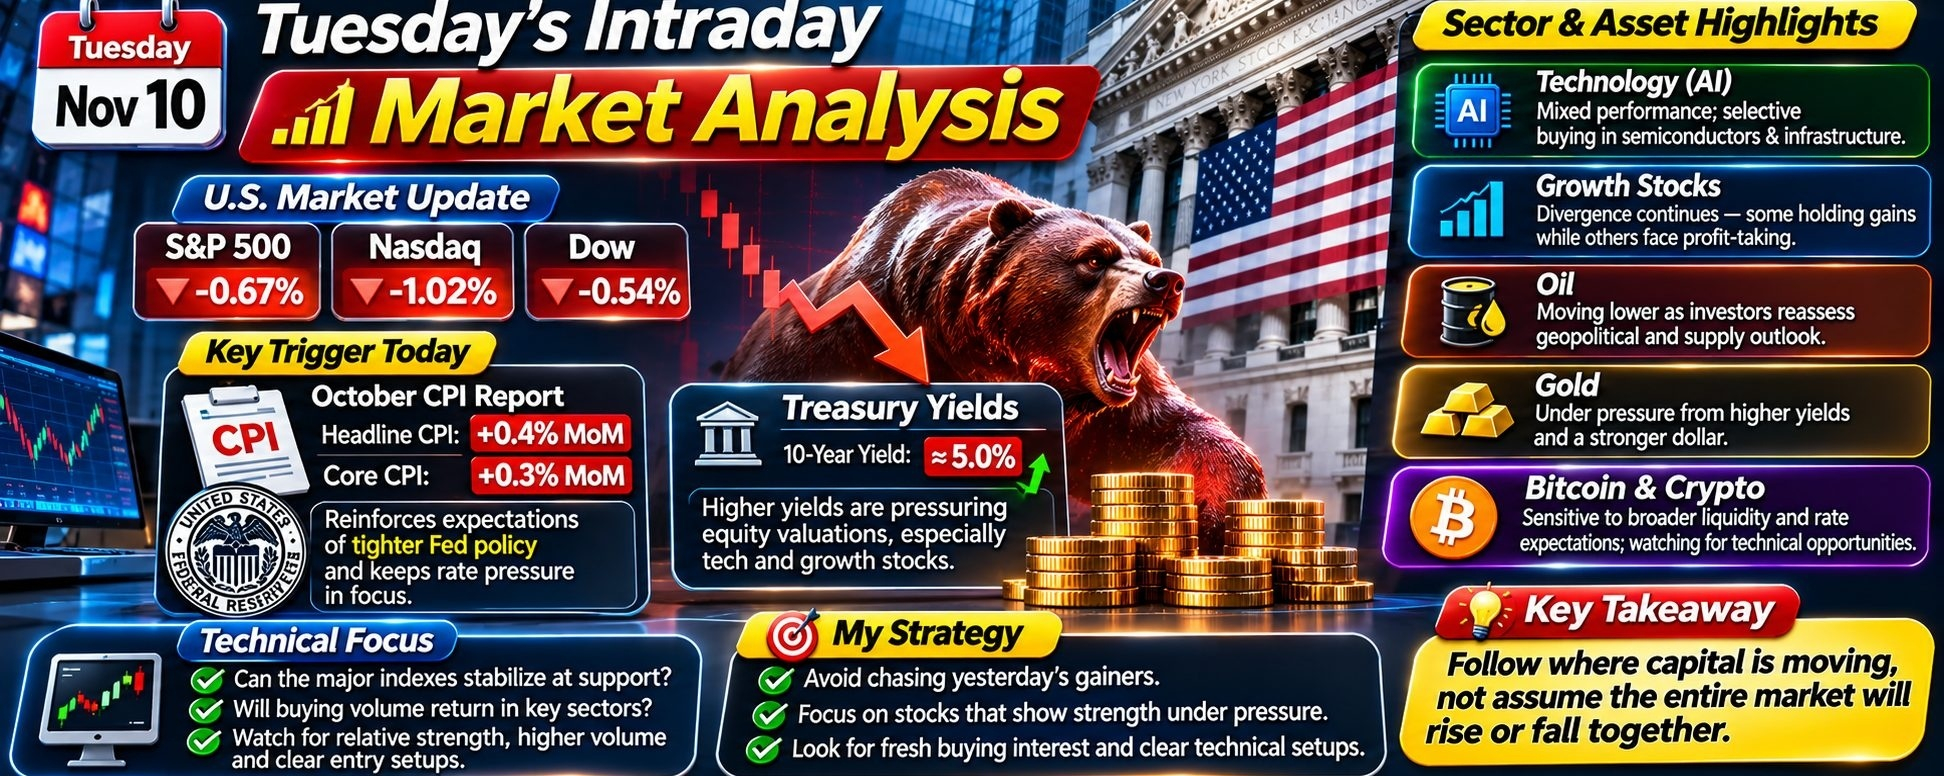
Article
Bitcoin, Tech Stocks & Gold Under Pressure: Where Is Smart Money Moving?📊Tuesday's Intraday Market Analysis — November 10
We're now well into Tuesday's U.S. trading session, and the market is showing a noticeable change in momentum compared with yesterday's strong rally. The major indexes are facing renewed selling pressure, while capital is becoming increasingly selective across technology, industrial, and other growth-oriented sectors.
📉 *The key development this morning is the October CPI report.* Headline inflation increased 0.4% month over month, while core inflation rose 0.3%. These figures have reinforced expectations of tighter Federal Reserve policy and pushed Treasury yields higher. The 10-year Treasury yield has approached 5%, creating additional pressure on equity valuations, particularly among technology and growth stocks.
Following Monday's substantial gains, the S&P 500, Nasdaq, and Dow have moved lower during today's session. However, I don't believe we should interpret this weakness as an automatic reversal of yesterday's recovery. What we're seeing is a market reassessing its direction after a strong rebound, with investors becoming more sensitive to economic data and interest rate expectations.
📈 *The most interesting development is the divergence within the technology sector.* Artificial intelligence remains a major investment theme, but the market is no longer moving uniformly. Some semiconductor and infrastructure-related stocks are attracting buying interest, while others are facing profit-taking. This tells me that capital hasn't necessarily abandoned the technology sector; instead, investors are becoming more selective about valuations, earnings prospects, and near-term catalysts.
We're also seeing similar differences among smaller growth companies. Some stocks that rallied sharply yesterday are now pulling back, while others continue to hold their gains or move higher. This distinction is important because it helps us identify where buying interest remains active despite broader market pressure.
💰 *From a technical perspective, my primary focus is on the sustainability of buying momentum.* After yesterday's strong advance, I want to see whether the major indexes can stabilize near their morning support levels and whether leading sectors can attract renewed buying volume.
If the S&P 500 and Nasdaq recover their intraday losses while market participation improves, that would strengthen the case for a continued rebound. However, if the indexes repeatedly fail to recover and selling pressure expands across sectors, I would prefer to remain selective rather than chase stocks into uncertain conditions.
For individual stock opportunities, we're looking for three things: relative strength against the broader market, meaningful trading volume, and a clear technical entry structure. A stock that holds its support while the broader market declines often deserves closer attention than one that rises sharply but cannot maintain its gains.
🛢️ *Outside the stock market, oil prices are moving lower as investors reassess geopolitical developments and global supply expectations.* Gold is also facing pressure from higher Treasury yields and a stronger dollar. These movements suggest that today's financial markets are being influenced by a combination of monetary policy expectations, geopolitical developments, and changing investor risk appetite.
Bitcoin and other cryptocurrencies are also sensitive to these broader liquidity conditions. We will continue monitoring the digital asset market for opportunities in both directions, particularly when technical momentum and trading volume provide clearer confirmation.
🎯 *My strategy for the remainder of today's session is straightforward:* I'm not interested in chasing yesterday's strongest performers simply because they delivered impressive gains. I want to see which areas of the market can maintain strength under today's pressure and whether fresh buying interest develops as the session progresses.
Our analyst team is actively evaluating potential U.S. stock opportunities. If we identify a favorable technical setup, we will share a specific trading recommendation with the group.
📈 *The most important thing right now is to follow where capital is moving, rather than assume the entire market will rise or fall together.*
Thank you, everyone. Stay focused on today's market developments, and I'll continue sharing our trading observations as new opportunities emerge.
#US-IranTalksFuelStrongStockMarketRebound #CryptoLiquidationsReach$1.16BIn24Hours #BitcoinSpotETFsPost$201MNetOutflowForThirdStraightDay #US
Bitcoin, Tech Stocks & Gold Under Pressure: Where Is Smart Money Moving?
📊Tuesday's Intraday Market Analysis — November 10
We're now well into Tuesday's U.S. trading session, and the market is showing a noticeable change in momentum compared with yesterday's strong rally. The major indexes are facing renewed selling pressure, while capital is becoming increasingly selective across technology, industrial, and other growth-oriented sectors.
📉 *The key development this morning is the October CPI report.* Headline inflation increased 0.4% month over month, while core inflation rose 0.3%. These figures have reinforced expectations of tighter Federal Reserve policy and pushed Treasury yields higher. The 10-year Treasury yield has approached 5%, creating additional pressure on equity valuations, particularly among technology and growth stocks.
Following Monday's substantial gains, the S&P 500, Nasdaq, and Dow have moved lower during today's session. However, I don't believe we should interpret this weakness as an automatic reversal of yesterday's recovery. What we're seeing is a market reassessing its direction after a strong rebound, with investors becoming more sensitive to economic data and interest rate expectations.
📈 *The most interesting development is the divergence within the technology sector.* Artificial intelligence remains a major investment theme, but the market is no longer moving uniformly. Some semiconductor and infrastructure-related stocks are attracting buying interest, while others are facing profit-taking. This tells me that capital hasn't necessarily abandoned the technology sector; instead, investors are becoming more selective about valuations, earnings prospects, and near-term catalysts.
We're also seeing similar differences among smaller growth companies. Some stocks that rallied sharply yesterday are now pulling back, while others continue to hold their gains or move higher. This distinction is important because it helps us identify where buying interest remains active despite broader market pressure.
💰 *From a technical perspective, my primary focus is on the sustainability of buying momentum.* After yesterday's strong advance, I want to see whether the major indexes can stabilize near their morning support levels and whether leading sectors can attract renewed buying volume.
If the S&P 500 and Nasdaq recover their intraday losses while market participation improves, that would strengthen the case for a continued rebound. However, if the indexes repeatedly fail to recover and selling pressure expands across sectors, I would prefer to remain selective rather than chase stocks into uncertain conditions.
For individual stock opportunities, we're looking for three things: relative strength against the broader market, meaningful trading volume, and a clear technical entry structure. A stock that holds its support while the broader market declines often deserves closer attention than one that rises sharply but cannot maintain its gains.
🛢️ *Outside the stock market, oil prices are moving lower as investors reassess geopolitical developments and global supply expectations.* Gold is also facing pressure from higher Treasury yields and a stronger dollar. These movements suggest that today's financial markets are being influenced by a combination of monetary policy expectations, geopolitical developments, and changing investor risk appetite.
Bitcoin and other cryptocurrencies are also sensitive to these broader liquidity conditions. We will continue monitoring the digital asset market for opportunities in both directions, particularly when technical momentum and trading volume provide clearer confirmation.
🎯 *My strategy for the remainder of today's session is straightforward:* I'm not interested in chasing yesterday's strongest performers simply because they delivered impressive gains. I want to see which areas of the market can maintain strength under today's pressure and whether fresh buying interest develops as the session progresses.
Our analyst team is actively evaluating potential U.S. stock opportunities. If we identify a favorable technical setup, we will share a specific trading recommendation with the group.
📈 *The most important thing right now is to follow where capital is moving, rather than assume the entire market will rise or fall together.*
Thank you, everyone. Stay focused on today's market developments, and I'll continue sharing our trading observations as new opportunities emerge.
#US-IranTalksFuelStrongStockMarketRebound #CryptoLiquidationsReach$1.16BIn24Hours #BitcoinSpotETFsPost$201MNetOutflowForThirdStraightDay #US
We're now well into Tuesday's U.S. trading session, and the market is showing a noticeable change in momentum compared with yesterday's strong rally. The major indexes are facing renewed selling pressure, while capital is becoming increasingly selective across technology, industrial, and other growth-oriented sectors.
📉 *The key development this morning is the October CPI report.* Headline inflation increased 0.4% month over month, while core inflation rose 0.3%. These figures have reinforced expectations of tighter Federal Reserve policy and pushed Treasury yields higher. The 10-year Treasury yield has approached 5%, creating additional pressure on equity valuations, particularly among technology and growth stocks.
Following Monday's substantial gains, the S&P 500, Nasdaq, and Dow have moved lower during today's session. However, I don't believe we should interpret this weakness as an automatic reversal of yesterday's recovery. What we're seeing is a market reassessing its direction after a strong rebound, with investors becoming more sensitive to economic data and interest rate expectations.
📈 *The most interesting development is the divergence within the technology sector.* Artificial intelligence remains a major investment theme, but the market is no longer moving uniformly. Some semiconductor and infrastructure-related stocks are attracting buying interest, while others are facing profit-taking. This tells me that capital hasn't necessarily abandoned the technology sector; instead, investors are becoming more selective about valuations, earnings prospects, and near-term catalysts.
We're also seeing similar differences among smaller growth companies. Some stocks that rallied sharply yesterday are now pulling back, while others continue to hold their gains or move higher. This distinction is important because it helps us identify where buying interest remains active despite broader market pressure.
💰 *From a technical perspective, my primary focus is on the sustainability of buying momentum.* After yesterday's strong advance, I want to see whether the major indexes can stabilize near their morning support levels and whether leading sectors can attract renewed buying volume.
If the S&P 500 and Nasdaq recover their intraday losses while market participation improves, that would strengthen the case for a continued rebound. However, if the indexes repeatedly fail to recover and selling pressure expands across sectors, I would prefer to remain selective rather than chase stocks into uncertain conditions.
For individual stock opportunities, we're looking for three things: relative strength against the broader market, meaningful trading volume, and a clear technical entry structure. A stock that holds its support while the broader market declines often deserves closer attention than one that rises sharply but cannot maintain its gains.
🛢️ *Outside the stock market, oil prices are moving lower as investors reassess geopolitical developments and global supply expectations.* Gold is also facing pressure from higher Treasury yields and a stronger dollar. These movements suggest that today's financial markets are being influenced by a combination of monetary policy expectations, geopolitical developments, and changing investor risk appetite.
Bitcoin and other cryptocurrencies are also sensitive to these broader liquidity conditions. We will continue monitoring the digital asset market for opportunities in both directions, particularly when technical momentum and trading volume provide clearer confirmation.
🎯 *My strategy for the remainder of today's session is straightforward:* I'm not interested in chasing yesterday's strongest performers simply because they delivered impressive gains. I want to see which areas of the market can maintain strength under today's pressure and whether fresh buying interest develops as the session progresses.
Our analyst team is actively evaluating potential U.S. stock opportunities. If we identify a favorable technical setup, we will share a specific trading recommendation with the group.
📈 *The most important thing right now is to follow where capital is moving, rather than assume the entire market will rise or fall together.*
Thank you, everyone. Stay focused on today's market developments, and I'll continue sharing our trading observations as new opportunities emerge.
#US-IranTalksFuelStrongStockMarketRebound #CryptoLiquidationsReach$1.16BIn24Hours #BitcoinSpotETFsPost$201MNetOutflowForThirdStraightDay #US
506


Article
Crypto Market at a Crossroads: Bitcoin Faces Selling Pressure as Regulationntroduction
The cryptocurrency market is entering another challenging period as Bitcoin and major digital assets face renewed selling pressure, regulatory uncertainty and growing concerns about cybersecurity. After briefly recovering above $80,000 earlier in November, Bitcoin experienced a sharp reversal, reminding investors that the crypto market remains highly sensitive to economic developments, political changes and institutional investment flows.
The latest market developments raise an important question: Is this another temporary correction, or could the cryptocurrency industry be entering a longer period of uncertainty?
Bitcoin Struggles as Market Confidence Weakens
Bitcoin has experienced significant volatility following the latest US political developments. According to Reuters, Bitcoin dropped to approximately $73,708 on November 8, reaching its lowest level since August. Ethereum also suffered losses, falling to approximately $2,223.
Market concerns include uncertainty surrounding future US cryptocurrency regulations, institutional investment flows and cybersecurity risks.
Bitcoin's recovery above $80,000 earlier in November was short-lived. The reversal demonstrates how quickly market sentiment can change when investors become concerned about economic and political conditions.
What Should Investors Watch Next?
Several developments could influence cryptocurrency prices and investor confidence during the coming weeks:
US inflation Inflation figures could influence Federal Reserve policy and demand for riskier assets.Bitcoin ETF flows: Institutional fund inflows and outflows can provide useful information about investor demand.Cryptocurrency regulation: Changes in US regulatory policy could influence the business environment for exchanges and blockchain companies.Exchange security: Investors will be watching how major platforms respond to cybersecurity threats.Stablecoin adoption: Payment activity and institutional use could become important indicators of long-term industry growth.
Conclusion: Volatility Today, Opportunity or Risk Tomorrow?
The cryptocurrency market is facing a complicated combination of political uncertainty, economic pressure and security concerns. Bitcoin remains the industry's most closely watched asset, but the future of crypto will not depend on Bitcoin's price alone.
Stablecoins, tokenized financial assets, blockchain payments and institutional adoption could play increasingly important roles in shaping the next phase of the digital economy.
For investors, the current environment requires patience, research and disciplined risk management. Short-term price movements can create opportunities, but they also carry substantial risks.
The next major chapter of cryptocurrency may be determined not only by market speculation, but also by whether the industry can deliver security, transparency, regulatory clarity and real-world financial utility.
Disclaimer: This article is for informational and educational purposes only. It is not financial or investment advice. Cryptocurrency investments involve substantial risk, including the possibility of losing all invested capital.
#MarketMoves #HotCPIDecemberHikePriced #AnthropicRejectsIPODelayValuationinQuestion #CanNvidiaEarningsEaseMarketConcerns? #BitcoinSpotETFsPost$201MNetOutflowForThirdStraightDay
Crypto Market at a Crossroads: Bitcoin Faces Selling Pressure as Regulation
ntroduction
The cryptocurrency market is entering another challenging period as Bitcoin and major digital assets face renewed selling pressure, regulatory uncertainty and growing concerns about cybersecurity. After briefly recovering above $80,000 earlier in November, Bitcoin experienced a sharp reversal, reminding investors that the crypto market remains highly sensitive to economic developments, political changes and institutional investment flows.
The latest market developments raise an important question: Is this another temporary correction, or could the cryptocurrency industry be entering a longer period of uncertainty?
Bitcoin Struggles as Market Confidence Weakens
Bitcoin has experienced significant volatility following the latest US political developments. According to Reuters, Bitcoin dropped to approximately $73,708 on November 8, reaching its lowest level since August. Ethereum also suffered losses, falling to approximately $2,223.
Market concerns include uncertainty surrounding future US cryptocurrency regulations, institutional investment flows and cybersecurity risks.
Bitcoin's recovery above $80,000 earlier in November was short-lived. The reversal demonstrates how quickly market sentiment can change when investors become concerned about economic and political conditions.
What Should Investors Watch Next?
Several developments could influence cryptocurrency prices and investor confidence during the coming weeks:
US inflation Inflation figures could influence Federal Reserve policy and demand for riskier assets.Bitcoin ETF flows: Institutional fund inflows and outflows can provide useful information about investor demand.Cryptocurrency regulation: Changes in US regulatory policy could influence the business environment for exchanges and blockchain companies.Exchange security: Investors will be watching how major platforms respond to cybersecurity threats.Stablecoin adoption: Payment activity and institutional use could become important indicators of long-term industry growth.
Conclusion: Volatility Today, Opportunity or Risk Tomorrow?
The cryptocurrency market is facing a complicated combination of political uncertainty, economic pressure and security concerns. Bitcoin remains the industry's most closely watched asset, but the future of crypto will not depend on Bitcoin's price alone.
Stablecoins, tokenized financial assets, blockchain payments and institutional adoption could play increasingly important roles in shaping the next phase of the digital economy.
For investors, the current environment requires patience, research and disciplined risk management. Short-term price movements can create opportunities, but they also carry substantial risks.
The next major chapter of cryptocurrency may be determined not only by market speculation, but also by whether the industry can deliver security, transparency, regulatory clarity and real-world financial utility.
Disclaimer: This article is for informational and educational purposes only. It is not financial or investment advice. Cryptocurrency investments involve substantial risk, including the possibility of losing all invested capital.
#MarketMoves #HotCPIDecemberHikePriced #AnthropicRejectsIPODelayValuationinQuestion #CanNvidiaEarningsEaseMarketConcerns? #BitcoinSpotETFsPost$201MNetOutflowForThirdStraightDay
The cryptocurrency market is entering another challenging period as Bitcoin and major digital assets face renewed selling pressure, regulatory uncertainty and growing concerns about cybersecurity. After briefly recovering above $80,000 earlier in November, Bitcoin experienced a sharp reversal, reminding investors that the crypto market remains highly sensitive to economic developments, political changes and institutional investment flows.
The latest market developments raise an important question: Is this another temporary correction, or could the cryptocurrency industry be entering a longer period of uncertainty?
Bitcoin Struggles as Market Confidence Weakens
Bitcoin has experienced significant volatility following the latest US political developments. According to Reuters, Bitcoin dropped to approximately $73,708 on November 8, reaching its lowest level since August. Ethereum also suffered losses, falling to approximately $2,223.
Market concerns include uncertainty surrounding future US cryptocurrency regulations, institutional investment flows and cybersecurity risks.
Bitcoin's recovery above $80,000 earlier in November was short-lived. The reversal demonstrates how quickly market sentiment can change when investors become concerned about economic and political conditions.
What Should Investors Watch Next?
Several developments could influence cryptocurrency prices and investor confidence during the coming weeks:
US inflation Inflation figures could influence Federal Reserve policy and demand for riskier assets.Bitcoin ETF flows: Institutional fund inflows and outflows can provide useful information about investor demand.Cryptocurrency regulation: Changes in US regulatory policy could influence the business environment for exchanges and blockchain companies.Exchange security: Investors will be watching how major platforms respond to cybersecurity threats.Stablecoin adoption: Payment activity and institutional use could become important indicators of long-term industry growth.
Conclusion: Volatility Today, Opportunity or Risk Tomorrow?
The cryptocurrency market is facing a complicated combination of political uncertainty, economic pressure and security concerns. Bitcoin remains the industry's most closely watched asset, but the future of crypto will not depend on Bitcoin's price alone.
Stablecoins, tokenized financial assets, blockchain payments and institutional adoption could play increasingly important roles in shaping the next phase of the digital economy.
For investors, the current environment requires patience, research and disciplined risk management. Short-term price movements can create opportunities, but they also carry substantial risks.
The next major chapter of cryptocurrency may be determined not only by market speculation, but also by whether the industry can deliver security, transparency, regulatory clarity and real-world financial utility.
Disclaimer: This article is for informational and educational purposes only. It is not financial or investment advice. Cryptocurrency investments involve substantial risk, including the possibility of losing all invested capital.
#MarketMoves #HotCPIDecemberHikePriced #AnthropicRejectsIPODelayValuationinQuestion #CanNvidiaEarningsEaseMarketConcerns? #BitcoinSpotETFsPost$201MNetOutflowForThirdStraightDay
1
30
$TRUMP
{spot}(TRUMPUSDT)
SHORT 1.140–1.145
Stop loss: 1.160
Target: 1.120
Target: 1.100
Target: 1.080
Three important observations:
Lower highs: Sellers are maintaining control of the larger trend.
Resistance rejection: The 1.14–1.15 region has experienced selling pressure.
Consolidation: Price is moving sideways after a significant decline, without a confirmed bullish reversal.
4. When should you avoid SHORT?
If a 1H candle closes above 1.150 and price successfully retests that level, bearish momentum may weaken.
Potential bullish targets:
1.160
1.180
1.200
Do not continue holding a short if the invalidation level is reached.
mportant support and resistance
Level
Price
Strong resistance
1.150
Resistance
1.140–1.145
Current price
1.135
Support 1
1.120
Support 2
1.100
Support 3
1.080
#Trump's #CryptoLiquidationsReach$1.16BIn24Hours #BitcoinSpotETFsPost$201MNetOutflowForThirdStraightDay #BitcoinFiveWeeklyLosses #ADPWeeklyEstimateShowsUSPrivatePayrollsUp19750
$TRUMP
SHORT 1.140–1.145
Stop loss: 1.160
Target: 1.120
Target: 1.100
Target: 1.080
Three important observations:
Lower highs: Sellers are maintaining control of the larger trend.
Resistance rejection: The 1.14–1.15 region has experienced selling pressure.
Consolidation: Price is moving sideways after a significant decline, without a confirmed bullish reversal.
4. When should you avoid SHORT?
If a 1H candle closes above 1.150 and price successfully retests that level, bearish momentum may weaken.
Potential bullish targets:
1.160
1.180
1.200
Do not continue holding a short if the invalidation level is reached.
mportant support and resistance
Level
Price
Strong resistance
1.150
Resistance
1.140–1.145
Current price
1.135
Support 1
1.120
Support 2
1.100
Support 3
1.080
#Trump's #CryptoLiquidationsReach$1.16BIn24Hours #BitcoinSpotETFsPost$201MNetOutflowForThirdStraightDay #BitcoinFiveWeeklyLosses #ADPWeeklyEstimateShowsUSPrivatePayrollsUp19750
SHORT 1.140–1.145
Stop loss: 1.160
Target: 1.120
Target: 1.100
Target: 1.080
Three important observations:
Lower highs: Sellers are maintaining control of the larger trend.
Resistance rejection: The 1.14–1.15 region has experienced selling pressure.
Consolidation: Price is moving sideways after a significant decline, without a confirmed bullish reversal.
4. When should you avoid SHORT?
If a 1H candle closes above 1.150 and price successfully retests that level, bearish momentum may weaken.
Potential bullish targets:
1.160
1.180
1.200
Do not continue holding a short if the invalidation level is reached.
mportant support and resistance
Level
Price
Strong resistance
1.150
Resistance
1.140–1.145
Current price
1.135
Support 1
1.120
Support 2
1.100
Support 3
1.080
#Trump's #CryptoLiquidationsReach$1.16BIn24Hours #BitcoinSpotETFsPost$201MNetOutflowForThirdStraightDay #BitcoinFiveWeeklyLosses #ADPWeeklyEstimateShowsUSPrivatePayrollsUp19750
1
33

·
--
Bearish
$BTC
{future}(BTCUSDT)
🚨HIVE adds 79 #BTC to treasury as Riot and CleanSpark sell reserves.#BitcoinSpotETFsPost$201MNetOutflowForThirdStraightDay
$BTC
🚨HIVE adds 79 #BTC to treasury as Riot and CleanSpark sell reserves.#BitcoinSpotETFsPost$201MNetOutflowForThirdStraightDay
🚨HIVE adds 79 #BTC to treasury as Riot and CleanSpark sell reserves.#BitcoinSpotETFsPost$201MNetOutflowForThirdStraightDay

41

·
--
Bearish
Expecting a brutal drop on $BTC
If this trendline breaks
#HotCPIDecemberHikePriced #BitcoinSpotETFsPost$201MNetOutflowForThirdStraightDay
Expecting a brutal drop on $BTC
If this trendline breaks
#HotCPIDecemberHikePriced #BitcoinSpotETFsPost$201MNetOutflowForThirdStraightDay
If this trendline breaks
#HotCPIDecemberHikePriced #BitcoinSpotETFsPost$201MNetOutflowForThirdStraightDay
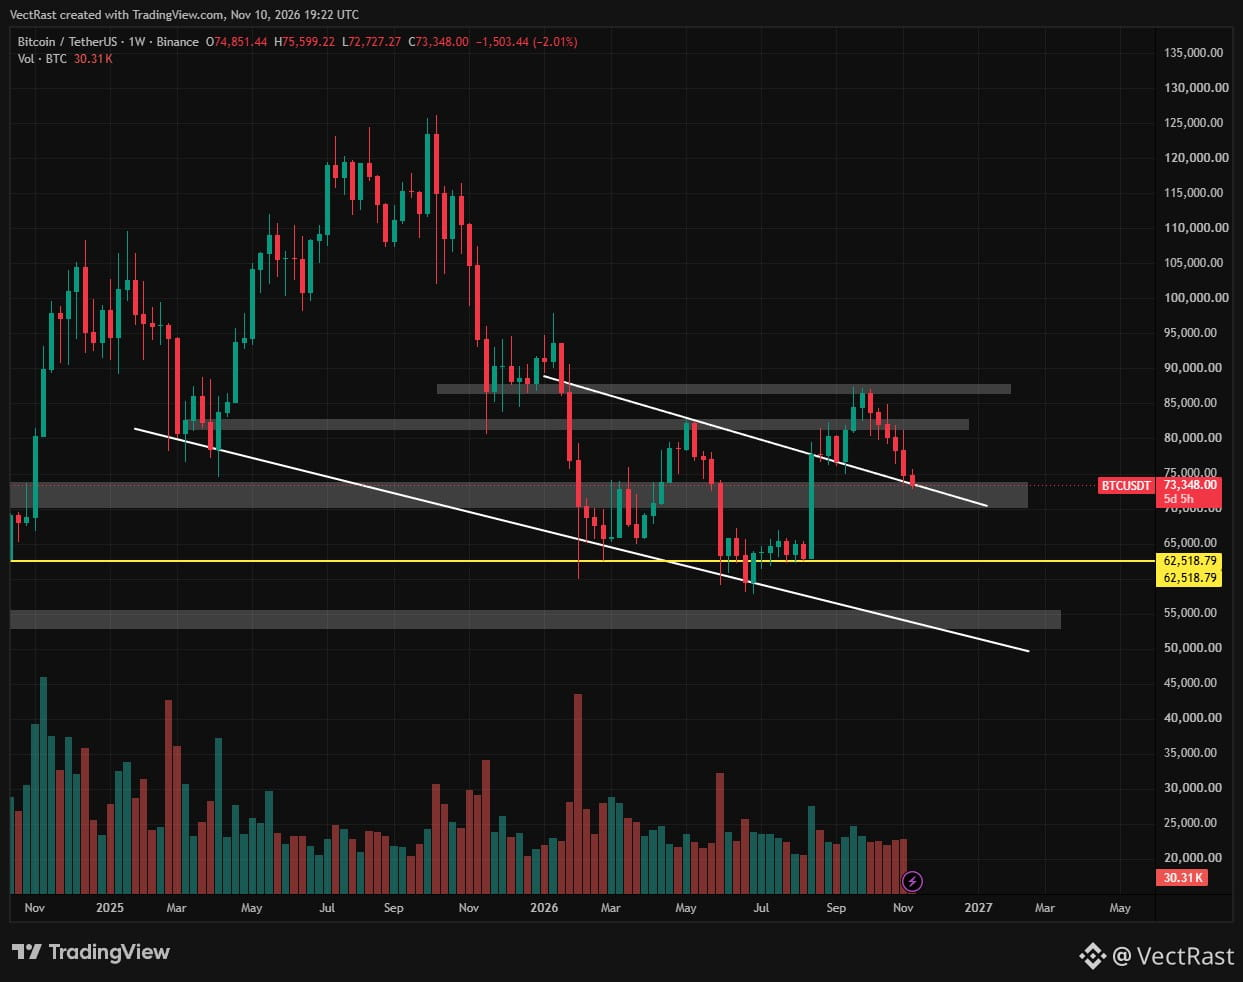
80
Log in to explore more content
Join global crypto users on Binance Square
⚡️ Get latest and useful information about crypto.
💬 Trusted by the world’s largest crypto exchange.
👍 Discover real insights from verified creators.
Email / Phone number
Trending Topics
1
#HotCPIDecemberHikePriced
40,579 views
758 Discussing
2
#AnthropicRejectsIPODelayValuationinQuestion
175,625 views
1,586 Discussing
3
#NvidiaInvestigatesAfterHuang’sAffairApology
446,169 views
3,049 Discussing
4
#CanNvidiaEarningsEaseMarketConcerns?
22,427 views
416 Discussing
5
#ADPWeeklyEstimateShowsUSPrivatePayrollsUp19750
8,910 views
202 Discussing
6
#US-IranTalksFuelStrongStockMarketRebound
98,107 views
560 Discussing
7
#BitcoinFiveWeeklyLosses
462,101 views
3,187 Discussing
8
#AIChipSlumpNasdaq
254,652 views
1,797 Discussing
9
#BitcoinSpotETFsPost$201MNetOutflowForThirdStraightDay
1,590 views
30 Discussing
10
#CryptoLiquidationsReach$1.16BIn24Hours
64,223 views
84 Discussing