

#bitcoinfallstoaround
bitcoinfallstoaround
81 views
18 Discussing
Hot
Latest

·
--
Here's what happened when $BTC started rolling over last week and most traders still treated it like a gift.
The pain is not the red candle itself. It is not knowing when a dip stops being a dip and becomes a trend change, and the people who averaged down into every flush are the ones sitting on underwater positions right now.
This was not a random dump. Yields did the actual work. With the US 10-year at a 19-year high and the 30-year the highest since 2004, liquidity left risk assets while Fear and Greed sat at 73. That is greed sitting there while price was already falling. Most people watching the chart never connected those two things.
They were still hunting entries in $USDT pairs as if the backdrop had not shifted. Fed October hike odds at 69 percent is not a footnote. It is the kind of pressure that can keep $BTC bleeding even when every support line looks obvious.
The lesson from this stretch is uncomfortable. Markets do not wait for you to feel scared. They roll over while sentiment is still greedy, and that is when the real damage gets done.
Where do you think this goes from here?
#BitcoinFallsToAround #BitcoinFallsBelow #US10YTreasuryYieldHits19YearHigh
Here's what happened when $BTC started rolling over last week and most traders still treated it like a gift.
The pain is not the red candle itself. It is not knowing when a dip stops being a dip and becomes a trend change, and the people who averaged down into every flush are the ones sitting on underwater positions right now.
This was not a random dump. Yields did the actual work. With the US 10-year at a 19-year high and the 30-year the highest since 2004, liquidity left risk assets while Fear and Greed sat at 73. That is greed sitting there while price was already falling. Most people watching the chart never connected those two things.
They were still hunting entries in $USDT pairs as if the backdrop had not shifted. Fed October hike odds at 69 percent is not a footnote. It is the kind of pressure that can keep $BTC bleeding even when every support line looks obvious.
The lesson from this stretch is uncomfortable. Markets do not wait for you to feel scared. They roll over while sentiment is still greedy, and that is when the real damage gets done.
Where do you think this goes from here?
#BitcoinFallsToAround #BitcoinFallsBelow #US10YTreasuryYieldHits19YearHigh
The pain is not the red candle itself. It is not knowing when a dip stops being a dip and becomes a trend change, and the people who averaged down into every flush are the ones sitting on underwater positions right now.
This was not a random dump. Yields did the actual work. With the US 10-year at a 19-year high and the 30-year the highest since 2004, liquidity left risk assets while Fear and Greed sat at 73. That is greed sitting there while price was already falling. Most people watching the chart never connected those two things.
They were still hunting entries in $USDT pairs as if the backdrop had not shifted. Fed October hike odds at 69 percent is not a footnote. It is the kind of pressure that can keep $BTC bleeding even when every support line looks obvious.
The lesson from this stretch is uncomfortable. Markets do not wait for you to feel scared. They roll over while sentiment is still greedy, and that is when the real damage gets done.
Where do you think this goes from here?
#BitcoinFallsToAround #BitcoinFallsBelow #US10YTreasuryYieldHits19YearHigh

11
·
--
If you are still panic selling your spot bags every time the market takes a sudden dip, stop now.
Watching green candles flip red overnight triggers instant anxiety, but dumping near major support usually means buying back higher later. Most retail traders lose capital simply because they let short-term volatility dictate their long-term strategy.
The bear camp is actively celebrating as $BTC slips under key psychological levels, arguing that broader macroeconomic headwinds will trigger a much deeper liquidity flush. From their viewpoint, holding $USDT and waiting on the sidelines is the only rational play right now.
Yet looking closely at order book depth, these aggressive pullbacks look more like routine shakeouts designed to clear overleveraged positions before the next leg up. Smart money consistently builds positions during peak market fear while impatient hands rush for the exit.
Are you treating this drop as a prime accumulation zone, or do you think the bleed continues?
#BitcoinFallsBelow #BitcoinFallsToAround
If you are still panic selling your spot bags every time the market takes a sudden dip, stop now.
Watching green candles flip red overnight triggers instant anxiety, but dumping near major support usually means buying back higher later. Most retail traders lose capital simply because they let short-term volatility dictate their long-term strategy.
The bear camp is actively celebrating as $BTC slips under key psychological levels, arguing that broader macroeconomic headwinds will trigger a much deeper liquidity flush. From their viewpoint, holding $USDT and waiting on the sidelines is the only rational play right now.
Yet looking closely at order book depth, these aggressive pullbacks look more like routine shakeouts designed to clear overleveraged positions before the next leg up. Smart money consistently builds positions during peak market fear while impatient hands rush for the exit.
Are you treating this drop as a prime accumulation zone, or do you think the bleed continues?
#BitcoinFallsBelow #BitcoinFallsToAround
Watching green candles flip red overnight triggers instant anxiety, but dumping near major support usually means buying back higher later. Most retail traders lose capital simply because they let short-term volatility dictate their long-term strategy.
The bear camp is actively celebrating as $BTC slips under key psychological levels, arguing that broader macroeconomic headwinds will trigger a much deeper liquidity flush. From their viewpoint, holding $USDT and waiting on the sidelines is the only rational play right now.
Yet looking closely at order book depth, these aggressive pullbacks look more like routine shakeouts designed to clear overleveraged positions before the next leg up. Smart money consistently builds positions during peak market fear while impatient hands rush for the exit.
Are you treating this drop as a prime accumulation zone, or do you think the bleed continues?
#BitcoinFallsBelow #BitcoinFallsToAround

7

everyone thinks buying every $btc dip is free money but actually that's the fastest way to get chopped when greed is still sitting at 73.
the pain is real. you think you've found the bottom, you load up, then it dumps another 5% and you're underwater watching $usdt dominance climb while your portfolio bleeds.
ngl this drop is a textbook case of what happens when people refuse to wait for fear. we saw this exact movie last cycle when yields started ripping. traders kept calling bottoms on $btc every few thousand dollars down and got wrecked each time.
the real bounce only came after actual panic, not while everyone was still greed-posting and searching $fil like the party was still going. macro is not your friend here. 10 year yields at 19 year highs and fed hike odds climbing is not a buy the dip environment no matter how many times you've been rewarded for it before.
this isn't the time to be a hero catching knives. ser the market is still greedy and that's usually when the bleed isn't done.
where do you think this actually finds a floor from here?
#BitcoinFallsToAround #BitcoinFallsBelow #US10YTreasuryYieldHits19YearHigh
everyone thinks buying every $btc dip is free money but actually that's the fastest way to get chopped when greed is still sitting at 73.
the pain is real. you think you've found the bottom, you load up, then it dumps another 5% and you're underwater watching $usdt dominance climb while your portfolio bleeds.
ngl this drop is a textbook case of what happens when people refuse to wait for fear. we saw this exact movie last cycle when yields started ripping. traders kept calling bottoms on $btc every few thousand dollars down and got wrecked each time.
the real bounce only came after actual panic, not while everyone was still greed-posting and searching $fil like the party was still going. macro is not your friend here. 10 year yields at 19 year highs and fed hike odds climbing is not a buy the dip environment no matter how many times you've been rewarded for it before.
this isn't the time to be a hero catching knives. ser the market is still greedy and that's usually when the bleed isn't done.
where do you think this actually finds a floor from here?
#BitcoinFallsToAround #BitcoinFallsBelow #US10YTreasuryYieldHits19YearHigh
the pain is real. you think you've found the bottom, you load up, then it dumps another 5% and you're underwater watching $usdt dominance climb while your portfolio bleeds.
ngl this drop is a textbook case of what happens when people refuse to wait for fear. we saw this exact movie last cycle when yields started ripping. traders kept calling bottoms on $btc every few thousand dollars down and got wrecked each time.
the real bounce only came after actual panic, not while everyone was still greed-posting and searching $fil like the party was still going. macro is not your friend here. 10 year yields at 19 year highs and fed hike odds climbing is not a buy the dip environment no matter how many times you've been rewarded for it before.
this isn't the time to be a hero catching knives. ser the market is still greedy and that's usually when the bleed isn't done.
where do you think this actually finds a floor from here?
#BitcoinFallsToAround #BitcoinFallsBelow #US10YTreasuryYieldHits19YearHigh

17

Bitcoin experienced a notable price drop, hovering around the $84,600 mark this week. This movement signals potential shifts in market sentiment and investor confidence. While such fluctuations are common in the volatile crypto space, it's crucial to analyze the underlying factors driving this decline. Traders and analysts are closely watching key support and resistance levels to gauge future price action. The market is currently assessing whether this is a temporary correction or the beginning of a more significant trend. Understanding the broader macroeconomic influences and on-chain data will be essential for navigating these turbulent times.
Disclaimer: This content is for informational purposes only and does not constitute investment advice.
#BitcoinFallsToAround$84,600ThisWeek $BTC
Bitcoin experienced a notable price drop, hovering around the $84,600 mark this week. This movement signals potential shifts in market sentiment and investor confidence. While such fluctuations are common in the volatile crypto space, it's crucial to analyze the underlying factors driving this decline. Traders and analysts are closely watching key support and resistance levels to gauge future price action. The market is currently assessing whether this is a temporary correction or the beginning of a more significant trend. Understanding the broader macroeconomic influences and on-chain data will be essential for navigating these turbulent times.
Disclaimer: This content is for informational purposes only and does not constitute investment advice.
#BitcoinFallsToAround$84,600ThisWeek $BTC
Disclaimer: This content is for informational purposes only and does not constitute investment advice.
#BitcoinFallsToAround$84,600ThisWeek $BTC
1
7

·
--
BTC returns to around 844,000|Hot search 846,000 isn’t a new support|I’ll first wait for the flows to move in the same direction as the price
My stance is cautious: I won’t treat a hot search that says “it fell to around 84.6万” as a confirmed bottom. On Binance Plaza, #BitcoinFallsToAround$84,600ThisWeek is indeed being discussed right now, and the Most Searched (six-hour) leaderboard also shows BTC. This reflects what price range the market is talking about, not a trading signal, and certainly not an official confirmation of support. When writing, I checked KuCoin BTC/USDT spot is about $84,437; in the past 24 hours the high was $84,923, the low was $82,868, and the change is about +0.16%. So “back to around 84.6万 this week” describes a zone—but intraday it has already probed down to around 82.9万. If you only watch the headline, you’ll miss the clear lower wick and volatility.
On the funding/flow side, don’t rush to slap the label “institutional buyers taking the dip” on this rebound. Farside’s daily tally for U.S. spot Bitcoin ETFs: as of Sep 24, the total net inflow is temporarily 28.10 million USD, updated from the 15.20 million USD I checked earlier this morning. However, the IBIT row still lacks a full horizontal figure; that’s not the same as zero, and it’s not appropriate to directly compare it with the complete data from prior days. The full rows on Sep 21/22/23 were 999 million, 714.7 million, and 346.9 million USD, respectively—which shows there was indeed relatively strong buying earlier, but it doesn’t automatically mean every pullback today will receive the same level of support. Farside also warns the table’s automatic updates may be incorrect; ultimately, you should continue to watch for missing figures to be filled in and for issuer data to be updated. On the U.S. Treasury side, the Sep 24 closing yield curve shows the 10-year yield at 5.18%, which is 7 bps higher than on the 23rd. With financing costs and risk-free yields rising, valuations of risk assets may get compressed—but that doesn’t mean BTC moves in the opposite direction to U.S. Treasuries every minute.
I see 84,900—85,000 as the near-term pressure zone that needs to hold and regain strength, while around 82,868 is the newly appeared 24-hour low reference—not a promise that price will be held up there again. If it just spikes to 85,000 and quickly falls back, it suggests the rebound may still be just a range mean-reversion. If, after ETF missing entries are filled, the data still shows net inflows—and the price continuously closes above 85,000, with cautious judgment then having grounds to be upgraded. Conversely, if it breaks below 82,800 and keeps closing below that level, I’ll overturn the short-term “repair” view; I won’t find excuses for short-term mistakes by saying “long-term it’s still good.” There’s also no necessary causal link between increased hot-search discussion and price rising.
If I were trading this myself, I wouldn’t participate right now. I’d only consider conditional spot long entries, and absolutely no high leverage. Only if, after the ETF missing entries are filled, it still shows net inflows—and BTC prints two consecutive full 15-minute candlesticks closing above 85,000, while pullbacks hold 84,750—85,000—I would use up to 0.3% of total funds for the first entry. Then if it reaches 85,600 I’d cut the position in half; and if it reaches 86,400—86,600 I’d close the remaining position. If after entry, the 15-minute close falls back below 84,300, I’d cut the position in half first; if it touches 83,800 I’d execute a hard stop-loss and fully close all positions. If before triggering it breaks below 82,800 first, the entire plan is void—pause and observe again. I won’t chase shorts or claim filled trades/profits prematurely. If either price or data doesn’t cooperate, the cash stays as capital earmarked for the position.
#BitcoinFallsToAround$84,600ThisWeek #BTC
The above is only my personal market observation and does not constitute investment advice.
BTC returns to around 844,000|Hot search 846,000 isn’t a new support|I’ll first wait for the flows to move in the same direction as the price
My stance is cautious: I won’t treat a hot search that says “it fell to around 84.6万” as a confirmed bottom. On Binance Plaza, #BitcoinFallsToAround$84,600ThisWeek is indeed being discussed right now, and the Most Searched (six-hour) leaderboard also shows BTC. This reflects what price range the market is talking about, not a trading signal, and certainly not an official confirmation of support. When writing, I checked KuCoin BTC/USDT spot is about $84,437; in the past 24 hours the high was $84,923, the low was $82,868, and the change is about +0.16%. So “back to around 84.6万 this week” describes a zone—but intraday it has already probed down to around 82.9万. If you only watch the headline, you’ll miss the clear lower wick and volatility.
On the funding/flow side, don’t rush to slap the label “institutional buyers taking the dip” on this rebound. Farside’s daily tally for U.S. spot Bitcoin ETFs: as of Sep 24, the total net inflow is temporarily 28.10 million USD, updated from the 15.20 million USD I checked earlier this morning. However, the IBIT row still lacks a full horizontal figure; that’s not the same as zero, and it’s not appropriate to directly compare it with the complete data from prior days. The full rows on Sep 21/22/23 were 999 million, 714.7 million, and 346.9 million USD, respectively—which shows there was indeed relatively strong buying earlier, but it doesn’t automatically mean every pullback today will receive the same level of support. Farside also warns the table’s automatic updates may be incorrect; ultimately, you should continue to watch for missing figures to be filled in and for issuer data to be updated. On the U.S. Treasury side, the Sep 24 closing yield curve shows the 10-year yield at 5.18%, which is 7 bps higher than on the 23rd. With financing costs and risk-free yields rising, valuations of risk assets may get compressed—but that doesn’t mean BTC moves in the opposite direction to U.S. Treasuries every minute.
I see 84,900—85,000 as the near-term pressure zone that needs to hold and regain strength, while around 82,868 is the newly appeared 24-hour low reference—not a promise that price will be held up there again. If it just spikes to 85,000 and quickly falls back, it suggests the rebound may still be just a range mean-reversion. If, after ETF missing entries are filled, the data still shows net inflows—and the price continuously closes above 85,000, with cautious judgment then having grounds to be upgraded. Conversely, if it breaks below 82,800 and keeps closing below that level, I’ll overturn the short-term “repair” view; I won’t find excuses for short-term mistakes by saying “long-term it’s still good.” There’s also no necessary causal link between increased hot-search discussion and price rising.
If I were trading this myself, I wouldn’t participate right now. I’d only consider conditional spot long entries, and absolutely no high leverage. Only if, after the ETF missing entries are filled, it still shows net inflows—and BTC prints two consecutive full 15-minute candlesticks closing above 85,000, while pullbacks hold 84,750—85,000—I would use up to 0.3% of total funds for the first entry. Then if it reaches 85,600 I’d cut the position in half; and if it reaches 86,400—86,600 I’d close the remaining position. If after entry, the 15-minute close falls back below 84,300, I’d cut the position in half first; if it touches 83,800 I’d execute a hard stop-loss and fully close all positions. If before triggering it breaks below 82,800 first, the entire plan is void—pause and observe again. I won’t chase shorts or claim filled trades/profits prematurely. If either price or data doesn’t cooperate, the cash stays as capital earmarked for the position.
#BitcoinFallsToAround$84,600ThisWeek #BTC
The above is only my personal market observation and does not constitute investment advice.
My stance is cautious: I won’t treat a hot search that says “it fell to around 84.6万” as a confirmed bottom. On Binance Plaza, #BitcoinFallsToAround$84,600ThisWeek is indeed being discussed right now, and the Most Searched (six-hour) leaderboard also shows BTC. This reflects what price range the market is talking about, not a trading signal, and certainly not an official confirmation of support. When writing, I checked KuCoin BTC/USDT spot is about $84,437; in the past 24 hours the high was $84,923, the low was $82,868, and the change is about +0.16%. So “back to around 84.6万 this week” describes a zone—but intraday it has already probed down to around 82.9万. If you only watch the headline, you’ll miss the clear lower wick and volatility.
On the funding/flow side, don’t rush to slap the label “institutional buyers taking the dip” on this rebound. Farside’s daily tally for U.S. spot Bitcoin ETFs: as of Sep 24, the total net inflow is temporarily 28.10 million USD, updated from the 15.20 million USD I checked earlier this morning. However, the IBIT row still lacks a full horizontal figure; that’s not the same as zero, and it’s not appropriate to directly compare it with the complete data from prior days. The full rows on Sep 21/22/23 were 999 million, 714.7 million, and 346.9 million USD, respectively—which shows there was indeed relatively strong buying earlier, but it doesn’t automatically mean every pullback today will receive the same level of support. Farside also warns the table’s automatic updates may be incorrect; ultimately, you should continue to watch for missing figures to be filled in and for issuer data to be updated. On the U.S. Treasury side, the Sep 24 closing yield curve shows the 10-year yield at 5.18%, which is 7 bps higher than on the 23rd. With financing costs and risk-free yields rising, valuations of risk assets may get compressed—but that doesn’t mean BTC moves in the opposite direction to U.S. Treasuries every minute.
I see 84,900—85,000 as the near-term pressure zone that needs to hold and regain strength, while around 82,868 is the newly appeared 24-hour low reference—not a promise that price will be held up there again. If it just spikes to 85,000 and quickly falls back, it suggests the rebound may still be just a range mean-reversion. If, after ETF missing entries are filled, the data still shows net inflows—and the price continuously closes above 85,000, with cautious judgment then having grounds to be upgraded. Conversely, if it breaks below 82,800 and keeps closing below that level, I’ll overturn the short-term “repair” view; I won’t find excuses for short-term mistakes by saying “long-term it’s still good.” There’s also no necessary causal link between increased hot-search discussion and price rising.
If I were trading this myself, I wouldn’t participate right now. I’d only consider conditional spot long entries, and absolutely no high leverage. Only if, after the ETF missing entries are filled, it still shows net inflows—and BTC prints two consecutive full 15-minute candlesticks closing above 85,000, while pullbacks hold 84,750—85,000—I would use up to 0.3% of total funds for the first entry. Then if it reaches 85,600 I’d cut the position in half; and if it reaches 86,400—86,600 I’d close the remaining position. If after entry, the 15-minute close falls back below 84,300, I’d cut the position in half first; if it touches 83,800 I’d execute a hard stop-loss and fully close all positions. If before triggering it breaks below 82,800 first, the entire plan is void—pause and observe again. I won’t chase shorts or claim filled trades/profits prematurely. If either price or data doesn’t cooperate, the cash stays as capital earmarked for the position.
#BitcoinFallsToAround$84,600ThisWeek #BTC
The above is only my personal market observation and does not constitute investment advice.

3

·
--
Bitcoin falls this week to around $84,600, down about 10% from the previous week. Market analysis shows that the main reasons include stronger expectations of Federal Reserve rate hikes and a reduction in institutional investors’ holdings data. The data indicates that institutions net sold about 150,000 bitcoins. In addition, overall liquidity in the cryptocurrency market has contracted, with trading volume down by about 25%. Investors should closely monitor global economic data and changes in regulatory policies.#BitcoinFallsToAround$84,600ThisWeek
Bitcoin falls this week to around $84,600, down about 10% from the previous week. Market analysis shows that the main reasons include stronger expectations of Federal Reserve rate hikes and a reduction in institutional investors’ holdings data. The data indicates that institutions net sold about 150,000 bitcoins. In addition, overall liquidity in the cryptocurrency market has contracted, with trading volume down by about 25%. Investors should closely monitor global economic data and changes in regulatory policies.#BitcoinFallsToAround$84,600ThisWeek
Have you noticed how every single dip gets labeled as the start of a bear market the second sentiment gets slightly overheated?
Most traders keep panic-selling their positions at the exact bottom simply because they mistake local liquidity flushes for structural trend reversals. They buy high when euphoria takes over, then dump right into institutional bids the moment the chart prints a red candle.
Look at how $BTC behaves whenever leverage gets wiped out across major derivatives pairs. Spot volume stays remarkably resilient while late longs get liquidated, transferring supply directly from weak hands to patient accumulators. Even when pairs like $ETC or $FIL see correlated pullbacks, the underlying market structure rarely breaks on these rapid downward wicks.
Treating these pullbacks as catastrophic breakdowns rather than healthy resets is why retail consistently underperforms during sustained momentum phases. When open interest resets and funding rates normalize, the market simply creates a cleaner runway for the next leg up.
Where do you think this goes from here?
#BitcoinFallsBelow #BitcoinFallsToAround
Have you noticed how every single dip gets labeled as the start of a bear market the second sentiment gets slightly overheated?
Most traders keep panic-selling their positions at the exact bottom simply because they mistake local liquidity flushes for structural trend reversals. They buy high when euphoria takes over, then dump right into institutional bids the moment the chart prints a red candle.
Look at how $BTC behaves whenever leverage gets wiped out across major derivatives pairs. Spot volume stays remarkably resilient while late longs get liquidated, transferring supply directly from weak hands to patient accumulators. Even when pairs like $ETC or $FIL see correlated pullbacks, the underlying market structure rarely breaks on these rapid downward wicks.
Treating these pullbacks as catastrophic breakdowns rather than healthy resets is why retail consistently underperforms during sustained momentum phases. When open interest resets and funding rates normalize, the market simply creates a cleaner runway for the next leg up.
Where do you think this goes from here?
#BitcoinFallsBelow #BitcoinFallsToAround
Most traders keep panic-selling their positions at the exact bottom simply because they mistake local liquidity flushes for structural trend reversals. They buy high when euphoria takes over, then dump right into institutional bids the moment the chart prints a red candle.
Look at how $BTC behaves whenever leverage gets wiped out across major derivatives pairs. Spot volume stays remarkably resilient while late longs get liquidated, transferring supply directly from weak hands to patient accumulators. Even when pairs like $ETC or $FIL see correlated pullbacks, the underlying market structure rarely breaks on these rapid downward wicks.
Treating these pullbacks as catastrophic breakdowns rather than healthy resets is why retail consistently underperforms during sustained momentum phases. When open interest resets and funding rates normalize, the market simply creates a cleaner runway for the next leg up.
Where do you think this goes from here?
#BitcoinFallsBelow #BitcoinFallsToAround

31

#BitcoinFallsToAround $84,600This Week
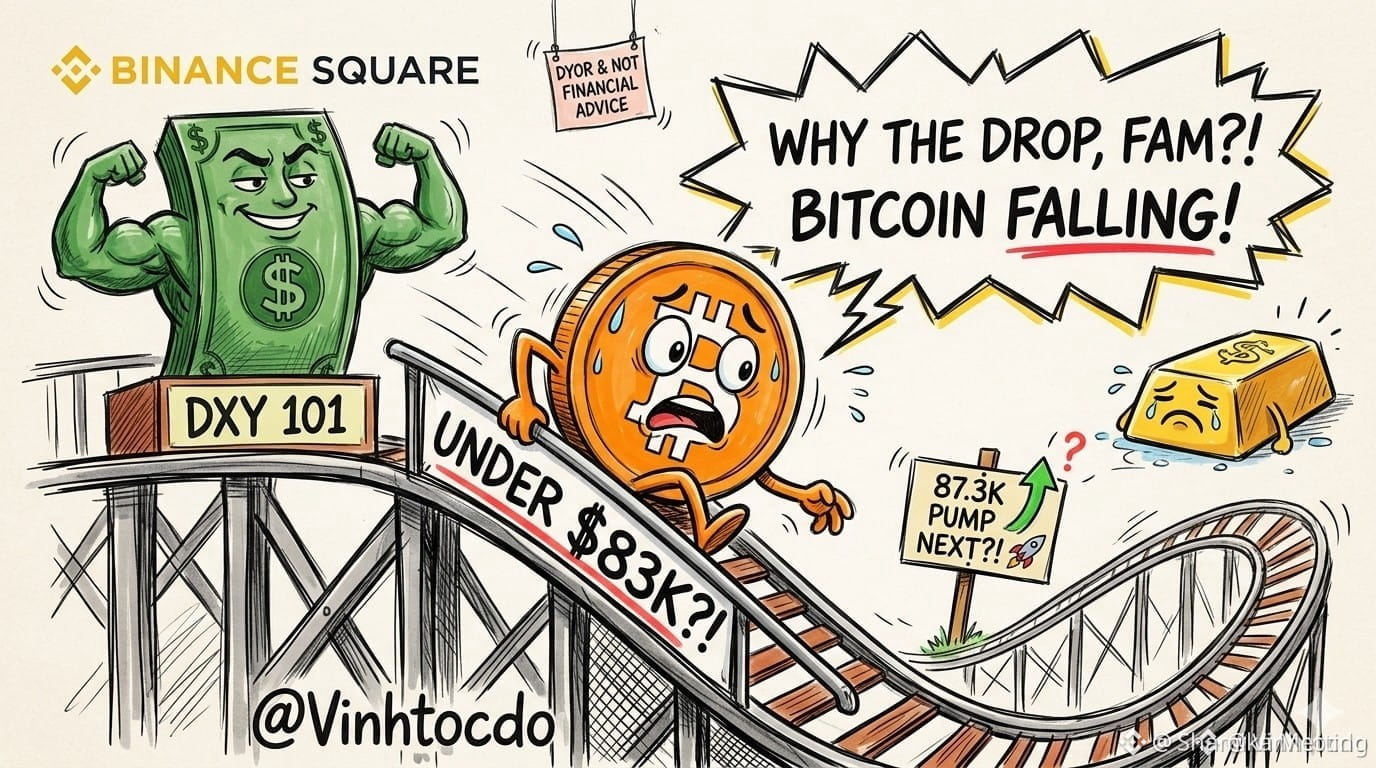
📉 Oh no... #BitcoinFallsToAround$84,600 this week! In fact, it has just dropped below $83k! 😱
Why this drop, buddy? 🤷♂️
The US Dollar Index (DXY) surged back to 101 thanks to the Fed’s hawkish tone, putting pressure on all high-risk assets! Even gold is crying. 😭
Can we bounce back to $87.3k? 🚀
Crypto is a crazy, fast roller-coaster game, so any rebound is always possible once the dollar calms down. Keep your eyes on the target!
What should traders do?
1️⃣ Stay calm and watch DXY. 📊
2️⃣ Set your stop-loss. 🛡️
3️⃣ Do your own research (DYOR)! This is not financial advice! 👀
Please follow along
$BTC
{future}(BTCUSDT)
$ETH
{future}(ETHUSDT)
$BNB
{future}(BNBUSDT)
#bitcoin #CryptoDipping #DXY #CryptoNews
#BitcoinFallsToAround $84,600This Week
📉 Oh no... #BitcoinFallsToAround$84,600 this week! In fact, it has just dropped below $83k! 😱
Why this drop, buddy? 🤷♂️
The US Dollar Index (DXY) surged back to 101 thanks to the Fed’s hawkish tone, putting pressure on all high-risk assets! Even gold is crying. 😭
Can we bounce back to $87.3k? 🚀
Crypto is a crazy, fast roller-coaster game, so any rebound is always possible once the dollar calms down. Keep your eyes on the target!
What should traders do?
1️⃣ Stay calm and watch DXY. 📊
2️⃣ Set your stop-loss. 🛡️
3️⃣ Do your own research (DYOR)! This is not financial advice! 👀
Please follow along
$BTC
$ETH
$BNB
#bitcoin #CryptoDipping #DXY #CryptoNews
📉 Oh no... #BitcoinFallsToAround$84,600 this week! In fact, it has just dropped below $83k! 😱
Why this drop, buddy? 🤷♂️
The US Dollar Index (DXY) surged back to 101 thanks to the Fed’s hawkish tone, putting pressure on all high-risk assets! Even gold is crying. 😭
Can we bounce back to $87.3k? 🚀
Crypto is a crazy, fast roller-coaster game, so any rebound is always possible once the dollar calms down. Keep your eyes on the target!
What should traders do?
1️⃣ Stay calm and watch DXY. 📊
2️⃣ Set your stop-loss. 🛡️
3️⃣ Do your own research (DYOR)! This is not financial advice! 👀
Please follow along
$BTC
$ETH
$BNB
#bitcoin #CryptoDipping #DXY #CryptoNews
1
42
Log in to explore more content
Join global crypto users on Binance Square
⚡️ Get latest and useful information about crypto.
💬 Trusted by the world’s largest crypto exchange.
👍 Discover real insights from verified creators.
Email / Phone number
Trending Topics
1
#BitcoinSpotETFsNetInflow$191M
1,657 views
105 Discussing
2
#CFTCUpdatesGuidanceOnTokenizedAssets
15,051 views
683 Discussing
3
#BitgetSays$352MAffectedInHack
4,011 views
56 Discussing
4
#BinanceWillListHyperliquid(HYPE)
206,080 views
3,271 Discussing
5
#BrazilOrdersReportingOf$10KSelfCustodyTransfers
1,663 views
43 Discussing
6
#FedProposesRulesForBankIssuedStablecoins
15,681 views
477 Discussing
7
#OndoFinanceSoughtSaleAfterFoundersDeath
9,678 views
300 Discussing
8
#FedOctoberRateHikeOddsRiseTo69.7%
83,286 views
1,431 Discussing
9
#BitcoinFallsBelow$83,000
5,286 views
19 Discussing
10
#BitcoinFallsToAround$84,600ThisWeek
0 views
0 Discussing