
#bitcoin
bitcoin
349.3M views
855,566 Discussing
Hot
Latest

·
--
Verified
🚨"𝗕𝗧𝗖 𝗪𝗔𝗥𝗡𝗜𝗡𝗚": DON'T RUSH TO BUY — ANOTHER DROP TOWARD $50K IS POSSIBLE! ⚠️
Bitcoin's sell-off has intensified, with BTC falling below the important $60,000 mark on November 20 for the first time since July.
📉 WHAT THE MARKET DATA SHOWS:
• BTC traded around $59,381 on November 20.
• The June low sits near $58,500.
• Glassnode identifies $53,700 as Bitcoin's realized price — another important level to monitor.
• Ethereum also came under pressure, trading near $1,648.91 in Reuters' report.
⚠️ WHY IS THE MARKET UNDER PRESSURE?
Concerns over AI-related stock valuations, rising borrowing costs and uncertainty around future Fed policy have weighed on risk assets, including cryptocurrencies.
🔍 WHAT COULD HAPPEN NEXT?
A sustained move below the June low could bring the $53.7K realized-price level into focus. On the other hand, reclaiming $60K could help improve short-term sentiment.
A deeper decline is possible, but a recovery cannot be ruled out either.
💬 Will BTC defend the June low and bounce, or could the market test $53.7K next? 👀
$BTC - $UP - $KERNEL
{future}(BTCUSDT)
{alpha}(560x000008d2175f9aeaddb2430c26f8a6f73c5a0000)
{future}(KERNELUSDT)
#BTC #Bitcoin #CryptoMarket
#CanBTCReboundAfterFallingBelow60K?
"Do you think BTC could drop toward $50K"!?⚡
🚨"𝗕𝗧𝗖 𝗪𝗔𝗥𝗡𝗜𝗡𝗚": DON'T RUSH TO BUY — ANOTHER DROP TOWARD $50K IS POSSIBLE! ⚠️
Bitcoin's sell-off has intensified, with BTC falling below the important $60,000 mark on November 20 for the first time since July.
📉 WHAT THE MARKET DATA SHOWS:
• BTC traded around $59,381 on November 20.
• The June low sits near $58,500.
• Glassnode identifies $53,700 as Bitcoin's realized price — another important level to monitor.
• Ethereum also came under pressure, trading near $1,648.91 in Reuters' report.
⚠️ WHY IS THE MARKET UNDER PRESSURE?
Concerns over AI-related stock valuations, rising borrowing costs and uncertainty around future Fed policy have weighed on risk assets, including cryptocurrencies.
🔍 WHAT COULD HAPPEN NEXT?
A sustained move below the June low could bring the $53.7K realized-price level into focus. On the other hand, reclaiming $60K could help improve short-term sentiment.
A deeper decline is possible, but a recovery cannot be ruled out either.
💬 Will BTC defend the June low and bounce, or could the market test $53.7K next? 👀
$BTC - $UP - $KERNEL
#BTC #Bitcoin #CryptoMarket
#CanBTCReboundAfterFallingBelow60K?
"Do you think BTC could drop toward $50K"!?⚡
Bitcoin's sell-off has intensified, with BTC falling below the important $60,000 mark on November 20 for the first time since July.
📉 WHAT THE MARKET DATA SHOWS:
• BTC traded around $59,381 on November 20.
• The June low sits near $58,500.
• Glassnode identifies $53,700 as Bitcoin's realized price — another important level to monitor.
• Ethereum also came under pressure, trading near $1,648.91 in Reuters' report.
⚠️ WHY IS THE MARKET UNDER PRESSURE?
Concerns over AI-related stock valuations, rising borrowing costs and uncertainty around future Fed policy have weighed on risk assets, including cryptocurrencies.
🔍 WHAT COULD HAPPEN NEXT?
A sustained move below the June low could bring the $53.7K realized-price level into focus. On the other hand, reclaiming $60K could help improve short-term sentiment.
A deeper decline is possible, but a recovery cannot be ruled out either.
💬 Will BTC defend the June low and bounce, or could the market test $53.7K next? 👀
$BTC - $UP - $KERNEL
#BTC #Bitcoin #CryptoMarket
#CanBTCReboundAfterFallingBelow60K?
"Do you think BTC could drop toward $50K"!?⚡
🟢 Yes, — $50K Possible!📉
🔴 No, — Recovery Ahead? 🚀
20 hr(s) left
1
1.9k

·
--
🪙 Robert Kiyosaki once again views the market crash as a buying opportunity: amid Bitcoin dropping below $60,000 (down to around $58,200, losing 31% over the past month) and gold and silver wiping out roughly $1 trillion in six hours following Federal Reserve signals of potential further rate hikes, the Rich Dad Poor Dad author stated that he is most excited about the BTC drop and is waiting for the right moment to buy more. He blames the sell-off on the incompetence of the Fed, issues within the banking sector and bond markets, and the U.S. national debt approaching $40.6 trillion, arguing that Bitcoin's hard cap of 21 million coins makes it a unique asset with strong long-term upside.
Meanwhile, market opinions remain divided. Some analysts, including Ash Crypto, see November as a potentially strong entry point, pointing to historical cycle bottoms following U.S. midterm elections, the likely completion of pre-IPO sell-offs ahead of major listings like SpaceX and Anthropic, growing bank holdings in spot Bitcoin ETFs (around 1.24 million BTC), falling oil prices, and improving U.S. manufacturing data. At the same time, veteran trader Peter Brandt urges caution, noting that every major Bitcoin bull cycle has historically ended with a correction of at least 75%.
#BTC #BITCOIN #ETF #CanBTCReboundAfterFallingBelow60K? $BTC $SPCX $ANTB
{spot}(ANTBUSDT)
{future}(SPCXUSDT)
{future}(BTCUSDT)
🪙 Robert Kiyosaki once again views the market crash as a buying opportunity: amid Bitcoin dropping below $60,000 (down to around $58,200, losing 31% over the past month) and gold and silver wiping out roughly $1 trillion in six hours following Federal Reserve signals of potential further rate hikes, the Rich Dad Poor Dad author stated that he is most excited about the BTC drop and is waiting for the right moment to buy more. He blames the sell-off on the incompetence of the Fed, issues within the banking sector and bond markets, and the U.S. national debt approaching $40.6 trillion, arguing that Bitcoin's hard cap of 21 million coins makes it a unique asset with strong long-term upside.
Meanwhile, market opinions remain divided. Some analysts, including Ash Crypto, see November as a potentially strong entry point, pointing to historical cycle bottoms following U.S. midterm elections, the likely completion of pre-IPO sell-offs ahead of major listings like SpaceX and Anthropic, growing bank holdings in spot Bitcoin ETFs (around 1.24 million BTC), falling oil prices, and improving U.S. manufacturing data. At the same time, veteran trader Peter Brandt urges caution, noting that every major Bitcoin bull cycle has historically ended with a correction of at least 75%.
#BTC #BITCOIN #ETF #CanBTCReboundAfterFallingBelow60K? $BTC $SPCX $ANTB
Meanwhile, market opinions remain divided. Some analysts, including Ash Crypto, see November as a potentially strong entry point, pointing to historical cycle bottoms following U.S. midterm elections, the likely completion of pre-IPO sell-offs ahead of major listings like SpaceX and Anthropic, growing bank holdings in spot Bitcoin ETFs (around 1.24 million BTC), falling oil prices, and improving U.S. manufacturing data. At the same time, veteran trader Peter Brandt urges caution, noting that every major Bitcoin bull cycle has historically ended with a correction of at least 75%.
#BTC #BITCOIN #ETF #CanBTCReboundAfterFallingBelow60K? $BTC $SPCX $ANTB
300


·
--
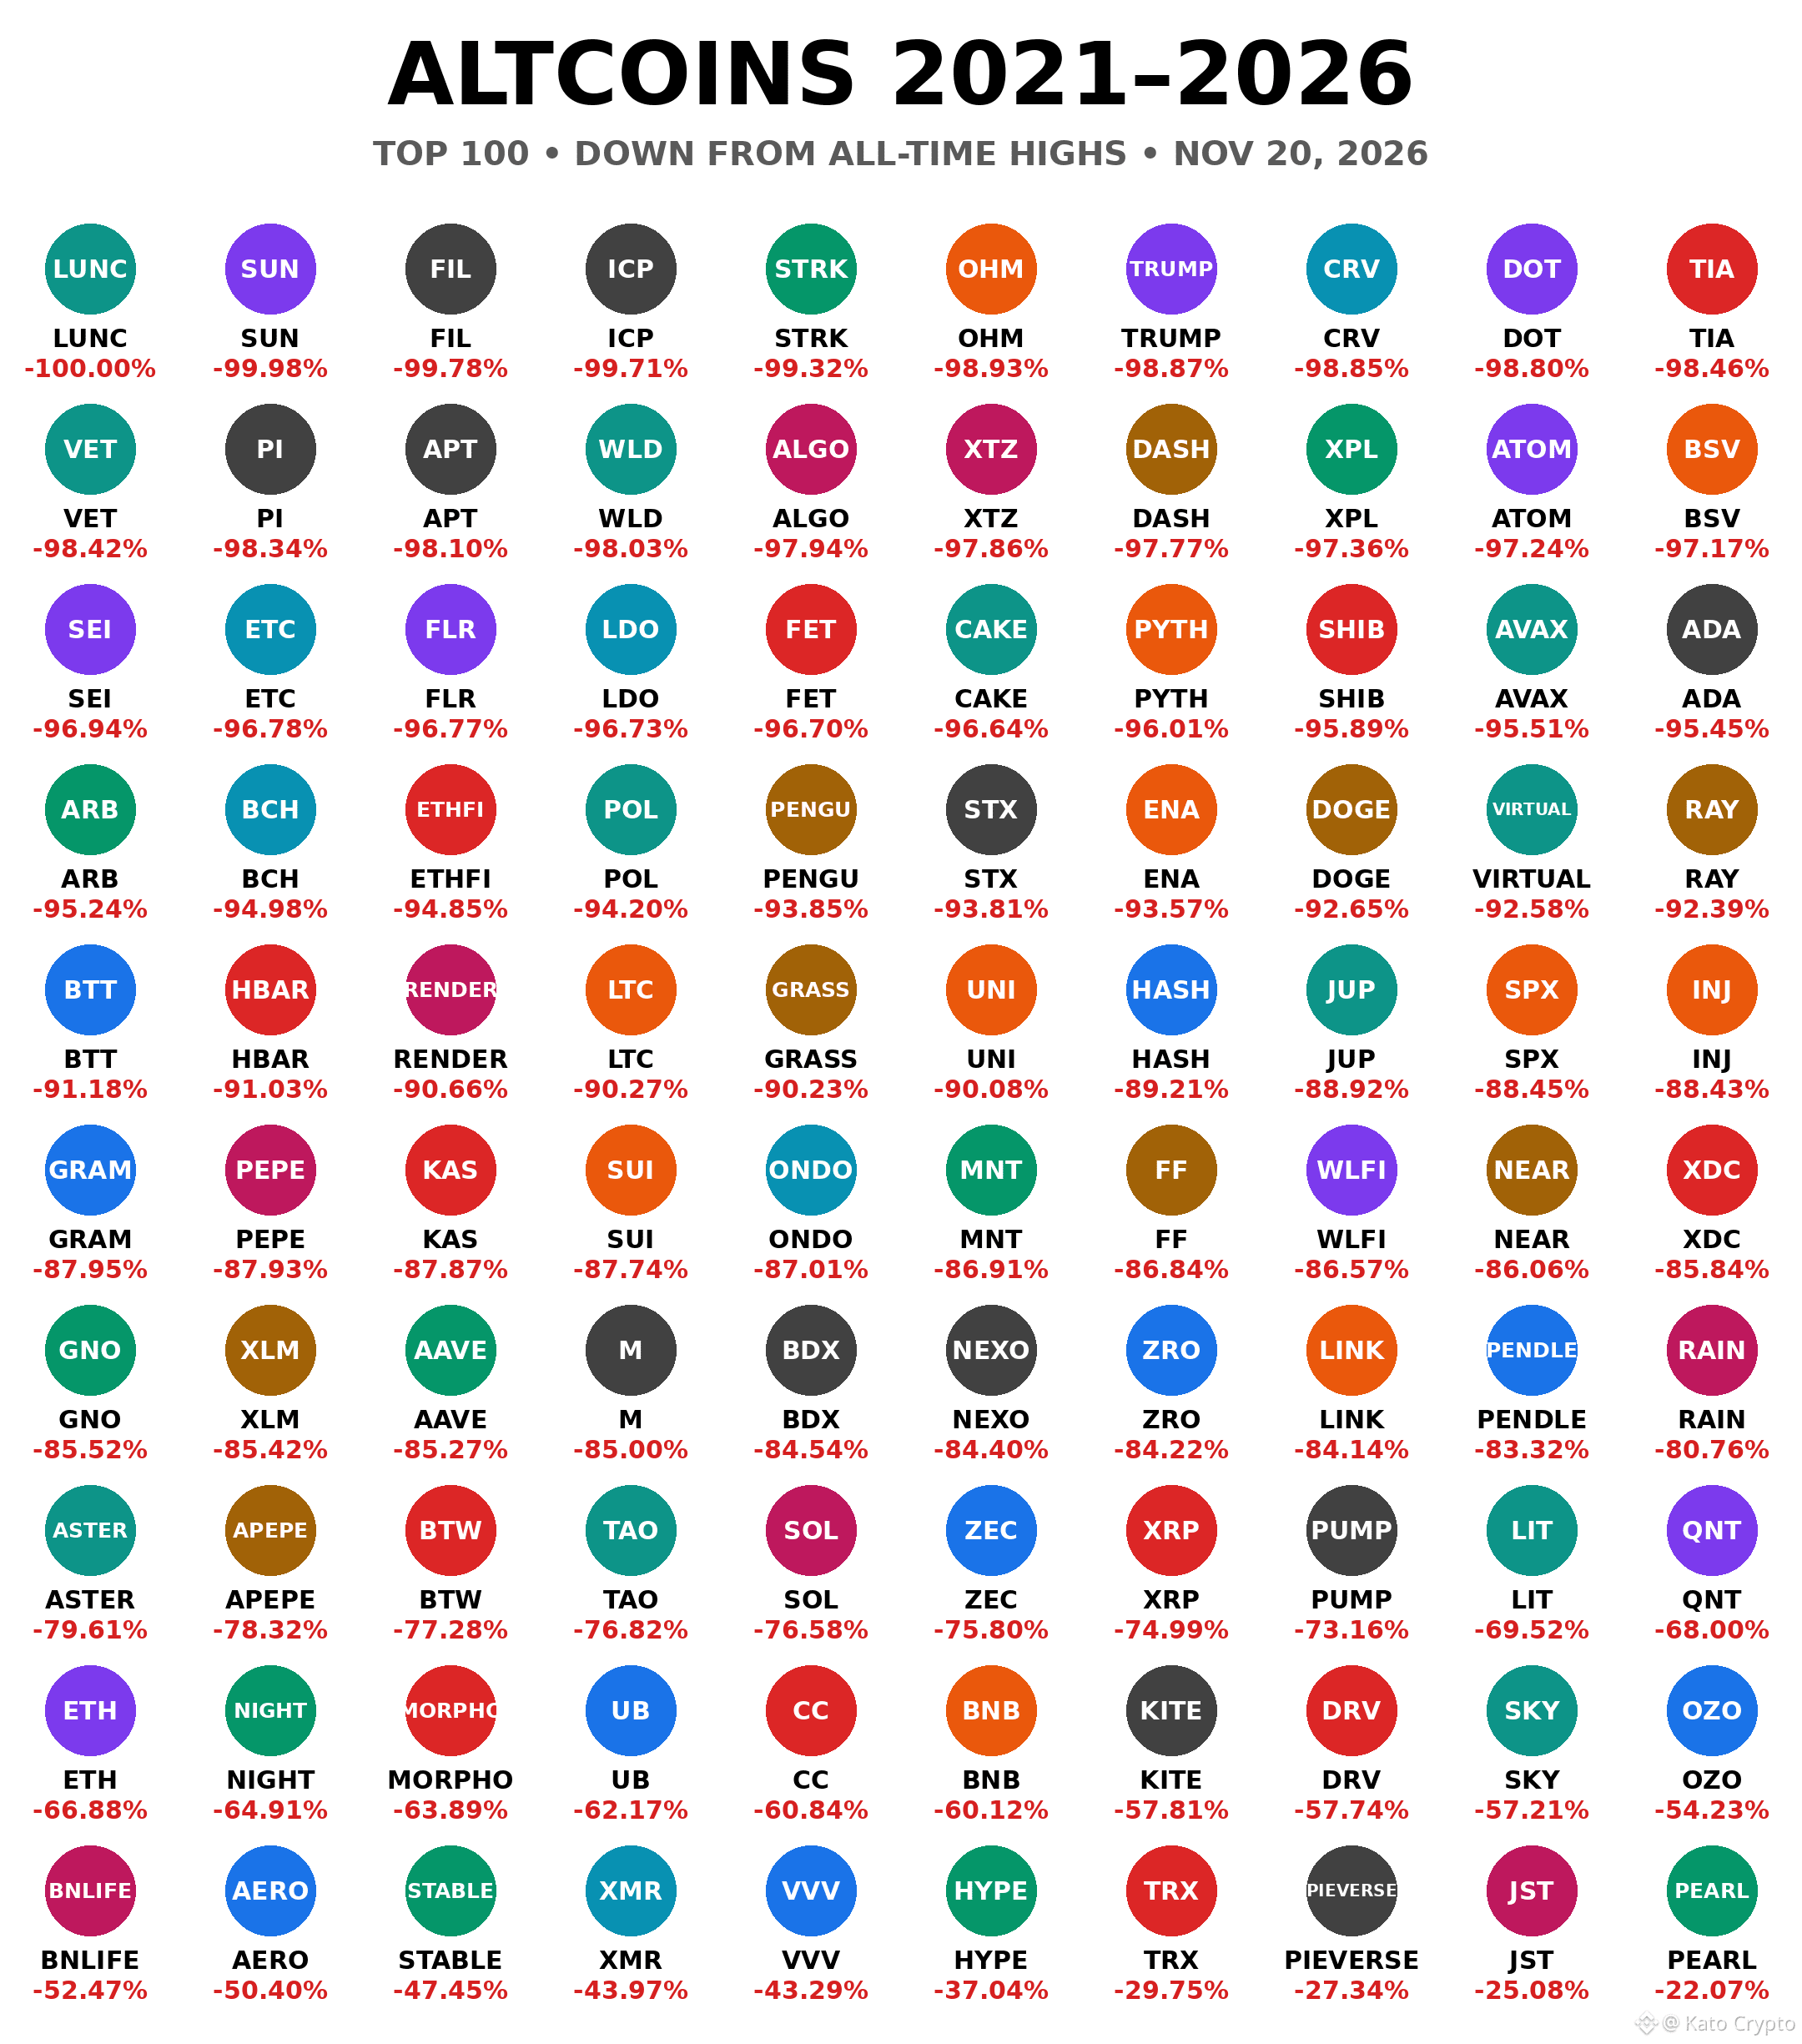
📉 ALTCOINS 2021–2026: I CHECKED ALL 100. THE MEDIAN COIN IS DOWN 88% FROM ITS PEAK.
Tonight I ran the numbers on the top 100 altcoins by market cap, current price vs all-time high. This is not a bear market chart. This is a crime scene. 👇
THE DAMAGE
🔹 Median drawdown: -88.2% from ATH
🔹 46 of 100 coins are down 90% or more
🔹 31 of 100 are down 95% or more
🔹 Only 8 of 100 kept more than half their value
THE WORST
🔹 $FIL -99.78%, ICP -99.71%, DOT -98.80%, ADA -95.45%
🔹 Even the giants bled: ETH -66.88%, SOL -76.58%, XRP -74.99%
STILL STANDING
🔹 TRX -29.75%, HYPE -37.04%, XMR -43.97%
🔹 Notice the pattern? Revenue, real users, or a decade of survival. Everything else got recycled.
HONEST PART
⚠️ Down 95% does not mean cheap. Most of these names still carry unlocks, dead volume, or a narrative that already left.
⚠️ A coin that fell 99% can still fall another 90% from here. Ask any 2021 bag holder.
An ATH is a moment, not a promise. If you never take profit, the market takes it back for you.
Which bag from this list are you still holding? Drop the ticker 👇
📌 Sharing personal opinions only, not financial advice or a recommendation to buy/sell. Crypto is highly risky; DYOR and you are solely responsible. No coin promotion.
$FIL #Altcoins #Crypto #Bitcoin #Binance
📉 ALTCOINS 2021–2026: I CHECKED ALL 100. THE MEDIAN COIN IS DOWN 88% FROM ITS PEAK.
Tonight I ran the numbers on the top 100 altcoins by market cap, current price vs all-time high. This is not a bear market chart. This is a crime scene. 👇
THE DAMAGE
🔹 Median drawdown: -88.2% from ATH
🔹 46 of 100 coins are down 90% or more
🔹 31 of 100 are down 95% or more
🔹 Only 8 of 100 kept more than half their value
THE WORST
🔹 $FIL -99.78%, ICP -99.71%, DOT -98.80%, ADA -95.45%
🔹 Even the giants bled: ETH -66.88%, SOL -76.58%, XRP -74.99%
STILL STANDING
🔹 TRX -29.75%, HYPE -37.04%, XMR -43.97%
🔹 Notice the pattern? Revenue, real users, or a decade of survival. Everything else got recycled.
HONEST PART
⚠️ Down 95% does not mean cheap. Most of these names still carry unlocks, dead volume, or a narrative that already left.
⚠️ A coin that fell 99% can still fall another 90% from here. Ask any 2021 bag holder.
An ATH is a moment, not a promise. If you never take profit, the market takes it back for you.
Which bag from this list are you still holding? Drop the ticker 👇
📌 Sharing personal opinions only, not financial advice or a recommendation to buy/sell. Crypto is highly risky; DYOR and you are solely responsible. No coin promotion.
$FIL #Altcoins #Crypto #Bitcoin #Binance
Tonight I ran the numbers on the top 100 altcoins by market cap, current price vs all-time high. This is not a bear market chart. This is a crime scene. 👇
THE DAMAGE
🔹 Median drawdown: -88.2% from ATH
🔹 46 of 100 coins are down 90% or more
🔹 31 of 100 are down 95% or more
🔹 Only 8 of 100 kept more than half their value
THE WORST
🔹 $FIL -99.78%, ICP -99.71%, DOT -98.80%, ADA -95.45%
🔹 Even the giants bled: ETH -66.88%, SOL -76.58%, XRP -74.99%
STILL STANDING
🔹 TRX -29.75%, HYPE -37.04%, XMR -43.97%
🔹 Notice the pattern? Revenue, real users, or a decade of survival. Everything else got recycled.
HONEST PART
⚠️ Down 95% does not mean cheap. Most of these names still carry unlocks, dead volume, or a narrative that already left.
⚠️ A coin that fell 99% can still fall another 90% from here. Ask any 2021 bag holder.
An ATH is a moment, not a promise. If you never take profit, the market takes it back for you.
Which bag from this list are you still holding? Drop the ticker 👇
📌 Sharing personal opinions only, not financial advice or a recommendation to buy/sell. Crypto is highly risky; DYOR and you are solely responsible. No coin promotion.
$FIL #Altcoins #Crypto #Bitcoin #Binance
MerlinM6:
cuando cae todo el mercado no me preocupo ,si cayera la cripto que holdeo si me preocupaba , ahora es momento de comprar casi cualquier cripto ..
5
11
18.4k

Verified
$BTC Below $60K Is a Warning Most Traders Are Ignoring!
Bitcoin broke $60,000 for the first time since July and sits near $59,500.
Down ~8.5% this week, with a seventh straight weekly loss on the way
Triggers: record $541M IBIT outflow, Fed hike bets, and an AI stock selloff
$553M liquidated in one hour, with Fear & Greed at 11 (extreme fear)
The 2026 low is $58,566, and BTC is now ~53% below its record
👨🏻💻 My take: a bounce is possible. Extreme fear and oversold readings often come before relief rallies. But there’s no bottom signal yet. I need a daily close back above $62K, the estimated mining cost, before I trust a rebound. Below $58.5K, I’d expect more pain. Don’t catch the knife, and keep size small!
#BTC #Bitcoin
#canbtcreboundafterfallingbelow60k?
$BTC Below $60K Is a Warning Most Traders Are Ignoring!
Bitcoin broke $60,000 for the first time since July and sits near $59,500.
Down ~8.5% this week, with a seventh straight weekly loss on the way
Triggers: record $541M IBIT outflow, Fed hike bets, and an AI stock selloff
$553M liquidated in one hour, with Fear & Greed at 11 (extreme fear)
The 2026 low is $58,566, and BTC is now ~53% below its record
👨🏻💻 My take: a bounce is possible. Extreme fear and oversold readings often come before relief rallies. But there’s no bottom signal yet. I need a daily close back above $62K, the estimated mining cost, before I trust a rebound. Below $58.5K, I’d expect more pain. Don’t catch the knife, and keep size small!
#BTC #Bitcoin
#canbtcreboundafterfallingbelow60k?
Bitcoin broke $60,000 for the first time since July and sits near $59,500.
Down ~8.5% this week, with a seventh straight weekly loss on the way
Triggers: record $541M IBIT outflow, Fed hike bets, and an AI stock selloff
$553M liquidated in one hour, with Fear & Greed at 11 (extreme fear)
The 2026 low is $58,566, and BTC is now ~53% below its record
👨🏻💻 My take: a bounce is possible. Extreme fear and oversold readings often come before relief rallies. But there’s no bottom signal yet. I need a daily close back above $62K, the estimated mining cost, before I trust a rebound. Below $58.5K, I’d expect more pain. Don’t catch the knife, and keep size small!
#BTC #Bitcoin
#canbtcreboundafterfallingbelow60k?
SpaVodka:
Thanks. The number I am watching next is that long to short ratio: if it starts falling while price holds above 57,700, the selling is getting exhausted.
8
20
66.7k

·
--
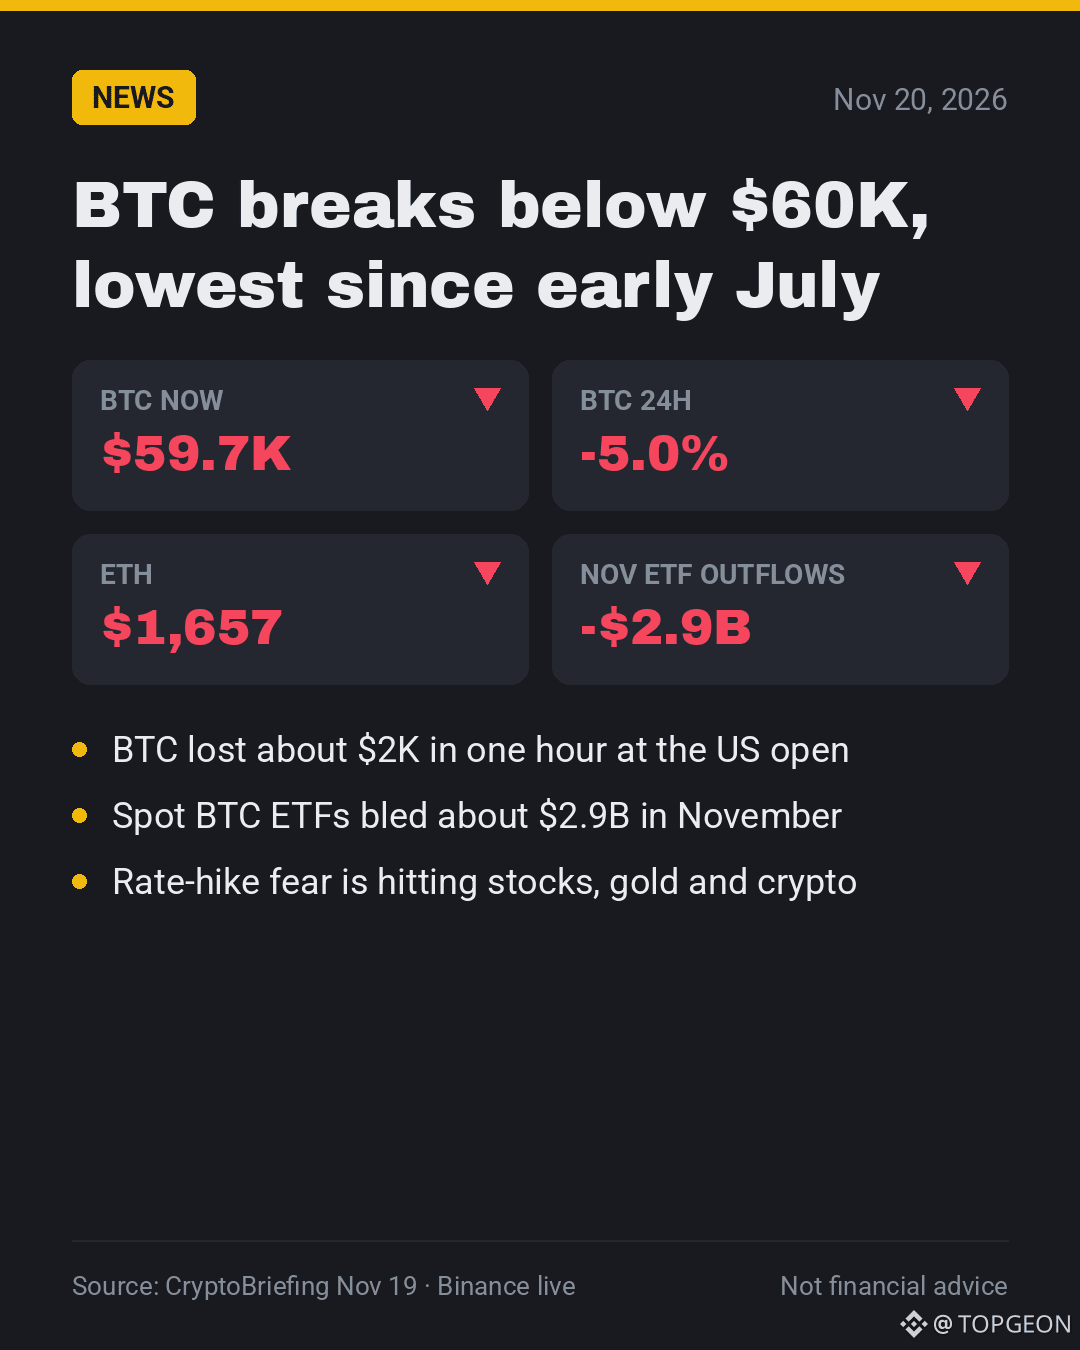
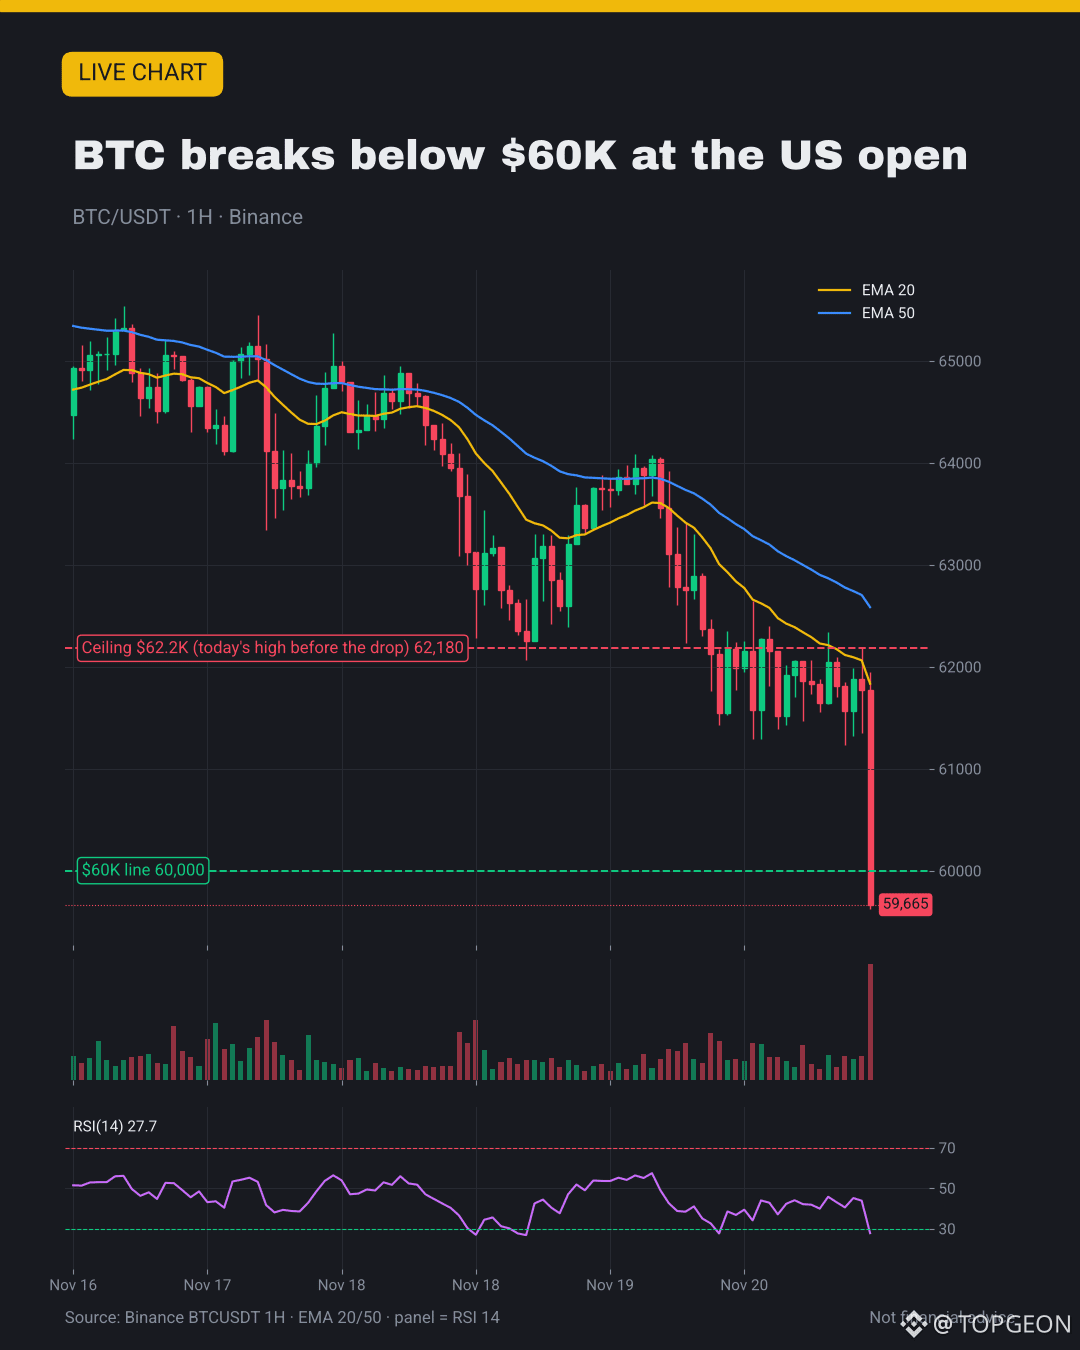
🚨 $BTC just broke below $60K, its lowest since early July.
📰 The drop hit fast, right as US markets opened.
🤔 Why it matters: big funds keep selling, spot ETFs lost $2.9B this month.
👀 What to watch: $62.2K, today's high before the drop, is now the ceiling.
🎯 My take: until it's back above $60K, bounces will likely get sold.
💬 Panic dip or a gift? 👇
#BTCBelow$62KAmidHikeFearsAndShiftToAnthropic #Bitcoin #BitcoinETF
🚨 $BTC just broke below $60K, its lowest since early July.
📰 The drop hit fast, right as US markets opened.
🤔 Why it matters: big funds keep selling, spot ETFs lost $2.9B this month.
👀 What to watch: $62.2K, today's high before the drop, is now the ceiling.
🎯 My take: until it's back above $60K, bounces will likely get sold.
💬 Panic dip or a gift? 👇
#BTCBelow$62KAmidHikeFearsAndShiftToAnthropic #Bitcoin #BitcoinETF
📰 The drop hit fast, right as US markets opened.
🤔 Why it matters: big funds keep selling, spot ETFs lost $2.9B this month.
👀 What to watch: $62.2K, today's high before the drop, is now the ceiling.
🎯 My take: until it's back above $60K, bounces will likely get sold.
💬 Panic dip or a gift? 👇
#BTCBelow$62KAmidHikeFearsAndShiftToAnthropic #Bitcoin #BitcoinETF
1
1.1k

·
--
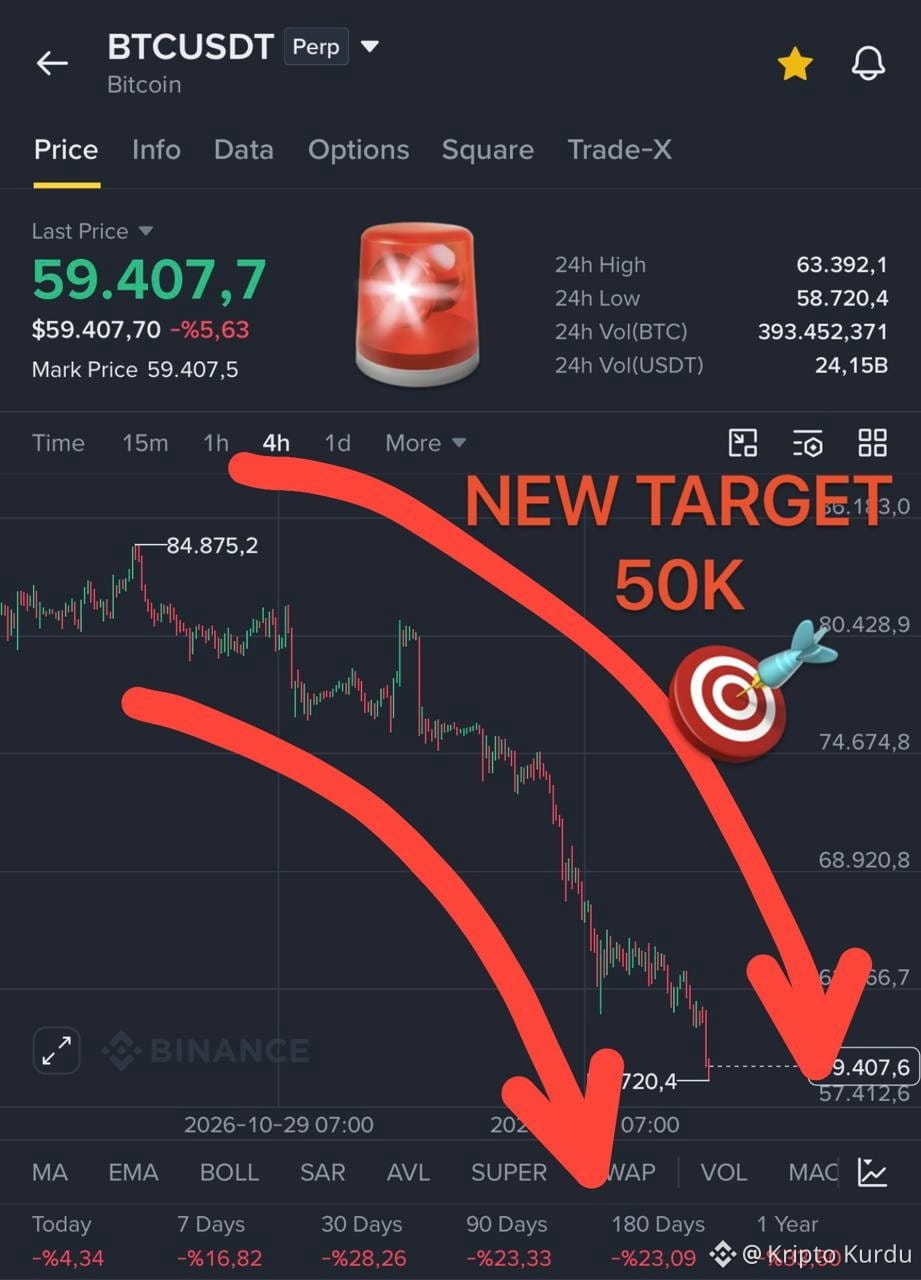
$BTC NEW TARGET 50K! A MAJOR DROP IS COMING DUE TO THE SNOWBALL EFFECT!
#Bitcoin has just dipped below the $60,000 level. This is a level it hasn’t seen since July. The big issue is that this time, the 60K support level showed no resistance at all. It was breached just like any other barrier. #canbtcreboundafterfallingbelow60k?
We’ve now hit a low of approximately $58,800. At the same time, Strategy’s losses have exceeded 20%, totaling over 14 billion.
We all know what this means. The S&P is falling. Companies holding Bitcoin are nearing bankruptcy. Global assets are declining, and interest rate hikes are on the horizon.
All these negative factors keep piling up. I hope the $50,000 level will now act as a support for us, but right now, things are looking really bad. My expectation is as shown in the chart.
DYOR!
$BTC NEW TARGET 50K! A MAJOR DROP IS COMING DUE TO THE SNOWBALL EFFECT!
#Bitcoin has just dipped below the $60,000 level. This is a level it hasn’t seen since July. The big issue is that this time, the 60K support level showed no resistance at all. It was breached just like any other barrier. #canbtcreboundafterfallingbelow60k?
We’ve now hit a low of approximately $58,800. At the same time, Strategy’s losses have exceeded 20%, totaling over 14 billion.
We all know what this means. The S&P is falling. Companies holding Bitcoin are nearing bankruptcy. Global assets are declining, and interest rate hikes are on the horizon.
All these negative factors keep piling up. I hope the $50,000 level will now act as a support for us, but right now, things are looking really bad. My expectation is as shown in the chart.
DYOR!
#Bitcoin has just dipped below the $60,000 level. This is a level it hasn’t seen since July. The big issue is that this time, the 60K support level showed no resistance at all. It was breached just like any other barrier. #canbtcreboundafterfallingbelow60k?
We’ve now hit a low of approximately $58,800. At the same time, Strategy’s losses have exceeded 20%, totaling over 14 billion.
We all know what this means. The S&P is falling. Companies holding Bitcoin are nearing bankruptcy. Global assets are declining, and interest rate hikes are on the horizon.
All these negative factors keep piling up. I hope the $50,000 level will now act as a support for us, but right now, things are looking really bad. My expectation is as shown in the chart.
DYOR!
golden_heart1111 金心:
Hi
31
2
82
128.4k

·
--
Bullish
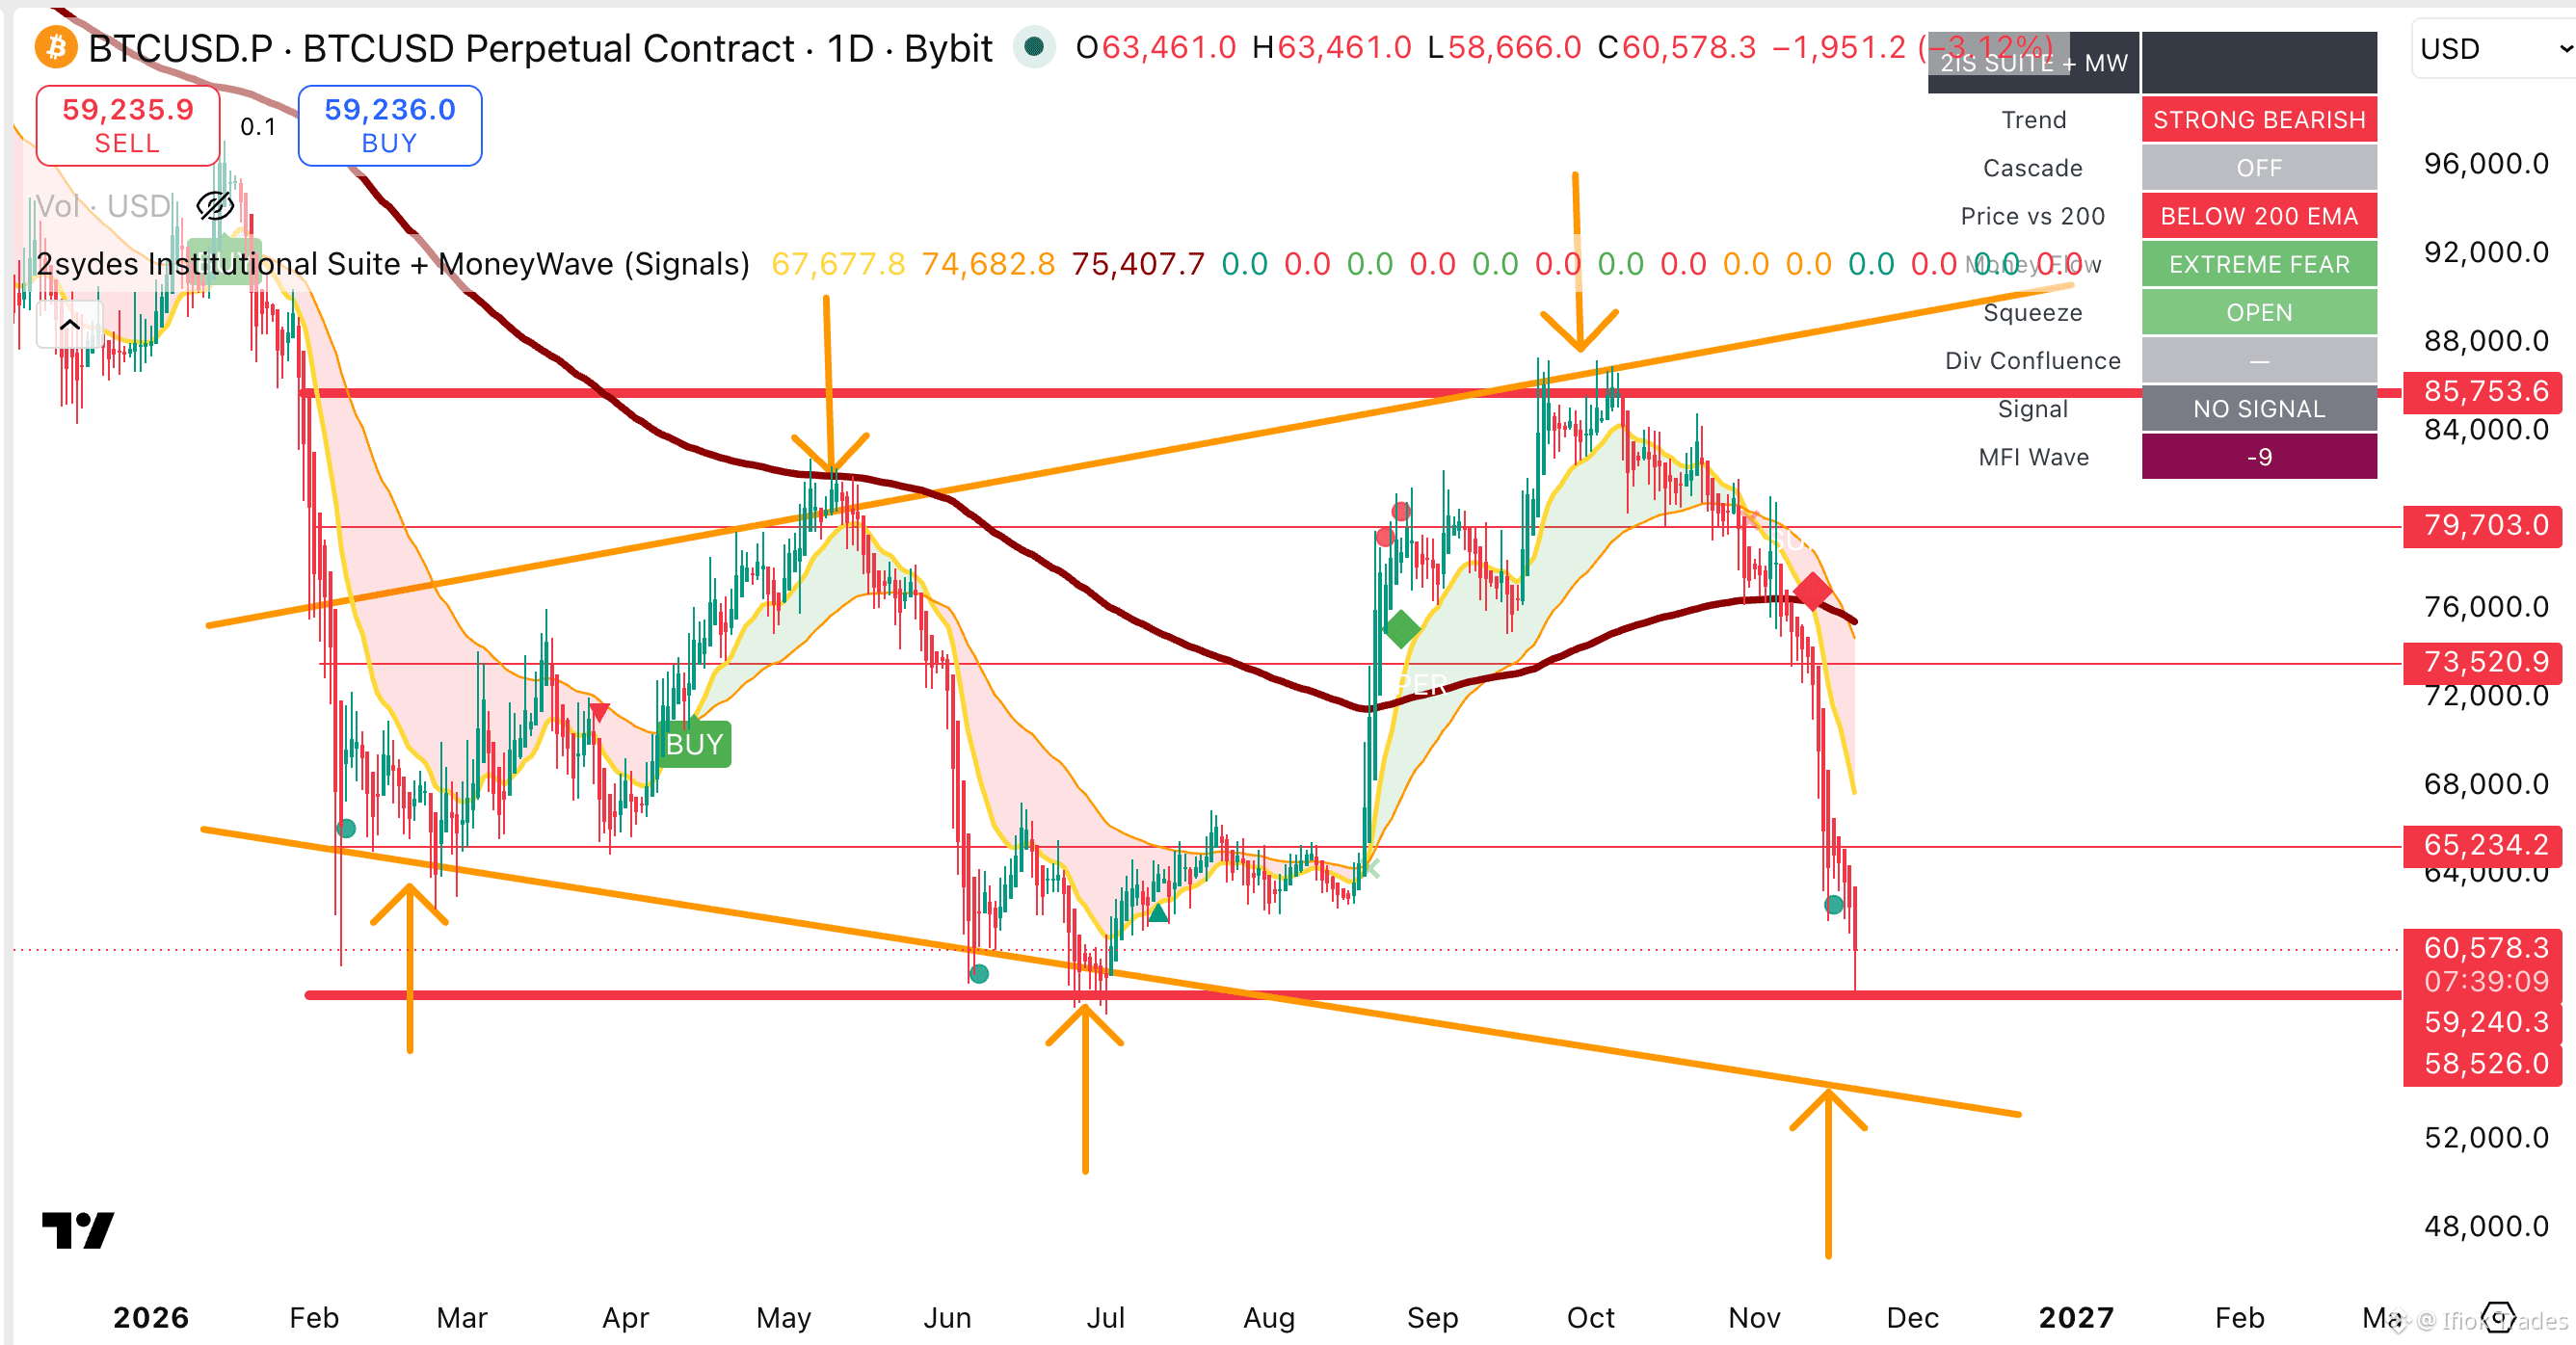
🚨 $BTC — $58,500 RANGE BOTTOM HIT! 🎯
Remember my earlier analysis at $64K?
Bitcoin has now tested the $58,500 support almost perfectly!
But here's the twist... 👀
🟢 2Sydes BOTTOM DOT is flashing!
😱 EXTREME FEAR
🔴 STRONG BEARISH trend
🎯 $58,500 holds → $65K–$73.5K recovery possible.
🔻 Breaks → $53K–$54K next?
Is this the bottom or another trap?
See what others miss. Trade with intelligence.
#BTC #Bitcoin #2Sydes
🚨 $BTC — $58,500 RANGE BOTTOM HIT! 🎯
Remember my earlier analysis at $64K?
Bitcoin has now tested the $58,500 support almost perfectly!
But here's the twist... 👀
🟢 2Sydes BOTTOM DOT is flashing!
😱 EXTREME FEAR
🔴 STRONG BEARISH trend
🎯 $58,500 holds → $65K–$73.5K recovery possible.
🔻 Breaks → $53K–$54K next?
Is this the bottom or another trap?
See what others miss. Trade with intelligence.
#BTC #Bitcoin #2Sydes
Remember my earlier analysis at $64K?
Bitcoin has now tested the $58,500 support almost perfectly!
But here's the twist... 👀
🟢 2Sydes BOTTOM DOT is flashing!
😱 EXTREME FEAR
🔴 STRONG BEARISH trend
🎯 $58,500 holds → $65K–$73.5K recovery possible.
🔻 Breaks → $53K–$54K next?
Is this the bottom or another trap?
See what others miss. Trade with intelligence.
#BTC #Bitcoin #2Sydes
Ifiok Trades
·
--
Bearish$BTC — WHAT IF THIS CRASH IS PART OF A MUCH BIGGER PATTERN?
Bitcoin has plunged from $85,750 to $64,000, wiping out weeks of gains. But zoom out. 👀
TWO interesting possibilities are emerging:
🔥RANGE-BOUND: BTC could be rotating between $58,526 support and $85,750 resistance.
🔥 BROADENING TRIANGLE: What looks like a crash could be another leg of an expanding volatility pattern.
What does 2Sydes say?
🔴 Bearish trend
🔴 Below 200 EMA
EXTREME FEAR
🎯 $58,526 is the level I'm watching.
If it holds, another major recovery becomes possible. If it breaks, the bearish case strengthens.
Are we witnessing the beginning of a deeper crash or one of Bitcoin's biggest shakeouts? Which one do you see?
#BTC #bitcoin #2Sydes
Bitcoin has plunged from $85,750 to $64,000, wiping out weeks of gains. But zoom out. 👀
TWO interesting possibilities are emerging:
🔥RANGE-BOUND: BTC could be rotating between $58,526 support and $85,750 resistance.
🔥 BROADENING TRIANGLE: What looks like a crash could be another leg of an expanding volatility pattern.
What does 2Sydes say?
🔴 Bearish trend
🔴 Below 200 EMA
EXTREME FEAR
🎯 $58,526 is the level I'm watching.
If it holds, another major recovery becomes possible. If it breaks, the bearish case strengthens.
Are we witnessing the beginning of a deeper crash or one of Bitcoin's biggest shakeouts? Which one do you see?
#BTC #bitcoin #2Sydes
Hamna Mujeeb:
yeah we just hope
7
2
4.2k

Partly True
🚨 $BTC BROKE $62K! DOUBLE BOTTOM FAILED 👀
Yesterday I said if $62K breaks, the pattern fails. It broke. #Bitcoin hit $58500 its lowest since July. That's 25% down from the $81.8K peak in October.
#BTCBelow$62KAmidHikeFearsAndShiftToAnthropic
Two things hit at once. Fed officials keep talking about bigger rate hikes. And on Anthropic's debut day, tech stocks fell 2% and crypto went down with them. Some say investors sold crypto to buy ANT, but there's no clear proof yet.
$770M in longs got wiped out.
My take: $62K is now resistance. If we can't reclaim it fast, $58–59K is the next stop. I'm setting up new trades.
Capitulation, or just the start? DYOR!
🚨 $BTC BROKE $62K! DOUBLE BOTTOM FAILED 👀
Yesterday I said if $62K breaks, the pattern fails. It broke. #Bitcoin hit $58500 its lowest since July. That's 25% down from the $81.8K peak in October.
#BTCBelow$62KAmidHikeFearsAndShiftToAnthropic
Two things hit at once. Fed officials keep talking about bigger rate hikes. And on Anthropic's debut day, tech stocks fell 2% and crypto went down with them. Some say investors sold crypto to buy ANT, but there's no clear proof yet.
$770M in longs got wiped out.
My take: $62K is now resistance. If we can't reclaim it fast, $58–59K is the next stop. I'm setting up new trades.
Capitulation, or just the start? DYOR!
Yesterday I said if $62K breaks, the pattern fails. It broke. #Bitcoin hit $58500 its lowest since July. That's 25% down from the $81.8K peak in October.
#BTCBelow$62KAmidHikeFearsAndShiftToAnthropic
Two things hit at once. Fed officials keep talking about bigger rate hikes. And on Anthropic's debut day, tech stocks fell 2% and crypto went down with them. Some say investors sold crypto to buy ANT, but there's no clear proof yet.
$770M in longs got wiped out.
My take: $62K is now resistance. If we can't reclaim it fast, $58–59K is the next stop. I'm setting up new trades.
Capitulation, or just the start? DYOR!

Anibal_BTC:
SI BITCOIN CIERRA 468.4, LIDERA.
Durante las últimas 13 semanas, Nvidia y Bitcoin han seguido una trayectoria similar, considerando sus cierres semanales🙋♂️
7
1
51
59.9k


Article
"Peter Brandt Warns Bitcoin Could Repeat 75% Historical Crashes, Putting $31K in Focus"Peter Brandt warns #Bitcoin could repeat historical 75% crashes, with technical calculations pointing to $37,629 and potentially $31,358.
Veteran trader Peter Brandt has raised concerns that Bitcoin could experience another major correction, highlighting a historical pattern in which previous bull markets ended with declines of at least 75%.
His warning comes as Bitcoin struggles near $62,000, roughly 51% below its October 2025 peak of approximately $126,200.
“Every bull market phase in BTC’s history has ended with at least a 75% correction of the previous parabolic bull trend,” Brandt stated.
He then questioned whether Bitcoin’s ongoing decline represents another repetition of that historical pattern.
Bitcoin’s Previous Bull Markets Ended With 75% or Greater Corrections
Bitcoin’s long-term price history shows several instances where powerful rallies ended in prolonged bear markets.
The first occurred after Bitcoin’s 2011 peak, when the asset declined approximately 94% before establishing its next major bottom.
A similar development followed the November 2013 rally. Bitcoin subsequently lost approximately 87% of its value before bottoming in January 2015.
The pattern continued after December 2017, when BTC declined roughly 84%, eventually reaching a bottom near $3,200 in December 2018.
Following the November 2021 high near $69,000, Bitcoin experienced another major correction, declining approximately 77% to $15,500 in November 2022.
These completed cycles form the basis of Brandt’s latest warning.
Notably, The Crypto Basic previously reported that Brandt had highlighted this same historical relationship in December 2025, when Bitcoin was trading above $80,000.
Bitcoin’s Parabolic Structure Shows Signs of Another Breakdown
Bitcoin’s weekly structure reveals how successive bull markets developed along steep, upward-curving support lines before eventually breaking below them.
The earlier parabolic advances are visible around the 2011, 2013, 2017, and 2021 peaks.
Red downward arrows identify the major market tops, while the curved support lines illustrate the accelerating price advances that preceded their reversals.
The longer blue horizontal markers compare the intervals between successive peaks, including periods of approximately 938, 1,526, 1,421, and 1,463 days.
These intervals illustrate Bitcoin’s recurring multiyear cycle structure, although the duration has varied.
Importantly, the most recent advance also formed a steepening support structure before Bitcoin reached its October 2025 peak.
BTC subsequently lost that trajectory and entered a prolonged correction.
As previously documented, Brandt had already identified a broadening-top formation and subsequent flag pattern as contributing to Bitcoin’s earlier breakdown.
Historical Correction Points to $37,629 and Potentially $31,358
One notable feature of the latest technical setup is a downside reference at $37,629, representing a 70% correction from an implied peak of approximately $125,430.
However, Brandt’s accompanying statement focuses on historical corrections of at least 75%.
Applying that larger decline to the same reference peak produces a lower hypothetical price:
70% correction: $37,62975% correction: $31,358
A decline to $37,629 would require another 39.4% drop from the chart’s $62,110.99 reference price.
Reaching $31,358 would require approximately 49.5% additional downside from that same level.
The $31,358 figure is a calculation based on Brandt’s historical comparison, rather than an explicit price target he announced.
Bitcoin Must Recover $76,583 to Improve Its Weekly Structure
Bitcoin’s latest weekly snapshot shows an open of $65,316.89, a high of $65,620.56, and a low of $61,363.22.
The most recent reading of $62,110.99 leaves BTC well below its weekly simple moving average at $76,583.48.
The weekly candle remains unfinished, meaning the approximately 4.9% weekly decline shown in the snapshot is not yet a confirmed closing result.
Bitcoin’s Average True Range stands near $6,926, reflecting substantial weekly price fluctuations, while its Average Directional Index is around 23.91.
Immediate support sits near $61,363, followed by the broader $57,000–$58,000 region associated with the mid-2026 lows.
Breaking below those lows would strengthen the case for another downward extension.
Conversely, Bitcoin must first reclaim $65,620 before challenging higher resistance.
The $76,400–$76,583 region is particularly important. As The Crypto Basic previously explained, Bitcoin lost $76,400 as support during the November correction.
Sustained weekly closes above that resistance area, accompanied by higher lows, would weaken the immediate bearish outlook.
For now, Bitcoin’s approximately 51% decline remains smaller than the major corrections recorded in previous completed cycles. Whether the current downturn eventually reaches a comparable depth depends on subsequent price action rather than historical repetition alone.
#CryptoNews🚀🔥V
"Peter Brandt Warns Bitcoin Could Repeat 75% Historical Crashes, Putting $31K in Focus"
Peter Brandt warns #Bitcoin could repeat historical 75% crashes, with technical calculations pointing to $37,629 and potentially $31,358.
Veteran trader Peter Brandt has raised concerns that Bitcoin could experience another major correction, highlighting a historical pattern in which previous bull markets ended with declines of at least 75%.
His warning comes as Bitcoin struggles near $62,000, roughly 51% below its October 2025 peak of approximately $126,200.
“Every bull market phase in BTC’s history has ended with at least a 75% correction of the previous parabolic bull trend,” Brandt stated.
He then questioned whether Bitcoin’s ongoing decline represents another repetition of that historical pattern.
Bitcoin’s Previous Bull Markets Ended With 75% or Greater Corrections
Bitcoin’s long-term price history shows several instances where powerful rallies ended in prolonged bear markets.
The first occurred after Bitcoin’s 2011 peak, when the asset declined approximately 94% before establishing its next major bottom.
A similar development followed the November 2013 rally. Bitcoin subsequently lost approximately 87% of its value before bottoming in January 2015.
The pattern continued after December 2017, when BTC declined roughly 84%, eventually reaching a bottom near $3,200 in December 2018.
Following the November 2021 high near $69,000, Bitcoin experienced another major correction, declining approximately 77% to $15,500 in November 2022.
These completed cycles form the basis of Brandt’s latest warning.
Notably, The Crypto Basic previously reported that Brandt had highlighted this same historical relationship in December 2025, when Bitcoin was trading above $80,000.
Bitcoin’s Parabolic Structure Shows Signs of Another Breakdown
Bitcoin’s weekly structure reveals how successive bull markets developed along steep, upward-curving support lines before eventually breaking below them.
The earlier parabolic advances are visible around the 2011, 2013, 2017, and 2021 peaks.
Red downward arrows identify the major market tops, while the curved support lines illustrate the accelerating price advances that preceded their reversals.
The longer blue horizontal markers compare the intervals between successive peaks, including periods of approximately 938, 1,526, 1,421, and 1,463 days.
These intervals illustrate Bitcoin’s recurring multiyear cycle structure, although the duration has varied.
Importantly, the most recent advance also formed a steepening support structure before Bitcoin reached its October 2025 peak.
BTC subsequently lost that trajectory and entered a prolonged correction.
As previously documented, Brandt had already identified a broadening-top formation and subsequent flag pattern as contributing to Bitcoin’s earlier breakdown.
Historical Correction Points to $37,629 and Potentially $31,358
One notable feature of the latest technical setup is a downside reference at $37,629, representing a 70% correction from an implied peak of approximately $125,430.
However, Brandt’s accompanying statement focuses on historical corrections of at least 75%.
Applying that larger decline to the same reference peak produces a lower hypothetical price:
70% correction: $37,62975% correction: $31,358
A decline to $37,629 would require another 39.4% drop from the chart’s $62,110.99 reference price.
Reaching $31,358 would require approximately 49.5% additional downside from that same level.
The $31,358 figure is a calculation based on Brandt’s historical comparison, rather than an explicit price target he announced.
Bitcoin Must Recover $76,583 to Improve Its Weekly Structure
Bitcoin’s latest weekly snapshot shows an open of $65,316.89, a high of $65,620.56, and a low of $61,363.22.
The most recent reading of $62,110.99 leaves BTC well below its weekly simple moving average at $76,583.48.
The weekly candle remains unfinished, meaning the approximately 4.9% weekly decline shown in the snapshot is not yet a confirmed closing result.
Bitcoin’s Average True Range stands near $6,926, reflecting substantial weekly price fluctuations, while its Average Directional Index is around 23.91.
Immediate support sits near $61,363, followed by the broader $57,000–$58,000 region associated with the mid-2026 lows.
Breaking below those lows would strengthen the case for another downward extension.
Conversely, Bitcoin must first reclaim $65,620 before challenging higher resistance.
The $76,400–$76,583 region is particularly important. As The Crypto Basic previously explained, Bitcoin lost $76,400 as support during the November correction.
Sustained weekly closes above that resistance area, accompanied by higher lows, would weaken the immediate bearish outlook.
For now, Bitcoin’s approximately 51% decline remains smaller than the major corrections recorded in previous completed cycles. Whether the current downturn eventually reaches a comparable depth depends on subsequent price action rather than historical repetition alone.
#CryptoNews🚀🔥V
Veteran trader Peter Brandt has raised concerns that Bitcoin could experience another major correction, highlighting a historical pattern in which previous bull markets ended with declines of at least 75%.
His warning comes as Bitcoin struggles near $62,000, roughly 51% below its October 2025 peak of approximately $126,200.
“Every bull market phase in BTC’s history has ended with at least a 75% correction of the previous parabolic bull trend,” Brandt stated.
He then questioned whether Bitcoin’s ongoing decline represents another repetition of that historical pattern.
Bitcoin’s Previous Bull Markets Ended With 75% or Greater Corrections
Bitcoin’s long-term price history shows several instances where powerful rallies ended in prolonged bear markets.
The first occurred after Bitcoin’s 2011 peak, when the asset declined approximately 94% before establishing its next major bottom.
A similar development followed the November 2013 rally. Bitcoin subsequently lost approximately 87% of its value before bottoming in January 2015.
The pattern continued after December 2017, when BTC declined roughly 84%, eventually reaching a bottom near $3,200 in December 2018.
Following the November 2021 high near $69,000, Bitcoin experienced another major correction, declining approximately 77% to $15,500 in November 2022.
These completed cycles form the basis of Brandt’s latest warning.
Notably, The Crypto Basic previously reported that Brandt had highlighted this same historical relationship in December 2025, when Bitcoin was trading above $80,000.
Bitcoin’s Parabolic Structure Shows Signs of Another Breakdown
Bitcoin’s weekly structure reveals how successive bull markets developed along steep, upward-curving support lines before eventually breaking below them.
The earlier parabolic advances are visible around the 2011, 2013, 2017, and 2021 peaks.
Red downward arrows identify the major market tops, while the curved support lines illustrate the accelerating price advances that preceded their reversals.
The longer blue horizontal markers compare the intervals between successive peaks, including periods of approximately 938, 1,526, 1,421, and 1,463 days.
These intervals illustrate Bitcoin’s recurring multiyear cycle structure, although the duration has varied.
Importantly, the most recent advance also formed a steepening support structure before Bitcoin reached its October 2025 peak.
BTC subsequently lost that trajectory and entered a prolonged correction.
As previously documented, Brandt had already identified a broadening-top formation and subsequent flag pattern as contributing to Bitcoin’s earlier breakdown.
Historical Correction Points to $37,629 and Potentially $31,358
One notable feature of the latest technical setup is a downside reference at $37,629, representing a 70% correction from an implied peak of approximately $125,430.
However, Brandt’s accompanying statement focuses on historical corrections of at least 75%.
Applying that larger decline to the same reference peak produces a lower hypothetical price:
70% correction: $37,62975% correction: $31,358
A decline to $37,629 would require another 39.4% drop from the chart’s $62,110.99 reference price.
Reaching $31,358 would require approximately 49.5% additional downside from that same level.
The $31,358 figure is a calculation based on Brandt’s historical comparison, rather than an explicit price target he announced.
Bitcoin Must Recover $76,583 to Improve Its Weekly Structure
Bitcoin’s latest weekly snapshot shows an open of $65,316.89, a high of $65,620.56, and a low of $61,363.22.
The most recent reading of $62,110.99 leaves BTC well below its weekly simple moving average at $76,583.48.
The weekly candle remains unfinished, meaning the approximately 4.9% weekly decline shown in the snapshot is not yet a confirmed closing result.
Bitcoin’s Average True Range stands near $6,926, reflecting substantial weekly price fluctuations, while its Average Directional Index is around 23.91.
Immediate support sits near $61,363, followed by the broader $57,000–$58,000 region associated with the mid-2026 lows.
Breaking below those lows would strengthen the case for another downward extension.
Conversely, Bitcoin must first reclaim $65,620 before challenging higher resistance.
The $76,400–$76,583 region is particularly important. As The Crypto Basic previously explained, Bitcoin lost $76,400 as support during the November correction.
Sustained weekly closes above that resistance area, accompanied by higher lows, would weaken the immediate bearish outlook.
For now, Bitcoin’s approximately 51% decline remains smaller than the major corrections recorded in previous completed cycles. Whether the current downturn eventually reaches a comparable depth depends on subsequent price action rather than historical repetition alone.
#CryptoNews🚀🔥V
658
·
--
Verified
🔴 $BTC BREAKS $60,000, FIRST TIME SINCE JULY
Bitcoin slid below $60,000 on Friday, touching ~$58,700, down ~5% in 24 hours and now ~53% below its October record high of $126,296.
This was not a crypto-only move. US tech stocks sold off hard, with AI names leading lower, and the ETF tape tells the real story: BlackRock's IBIT saw a record $541M of outflows on Thursday, the largest single-day exit ever.
$60,000 was the line the market defended for months. Losing it flips the structure bearish, with the next support at ~$57,700, the July 1 low. Bitcoin is now on course for a seventh straight weekly loss.
Risk check: markets this oversold can snap back violently, and shorting into support is how traders get squeezed. The trend is down until buyers reclaim $60K. Trade the level, not the emotion.
📌 Sharing personal opinions only, not financial advice or a recommendation to buy/sell. Crypto is highly risky; DYOR and you are solely responsible. No coin promotion.
$BTC #Bitcoin #Crypto #BitcoinETF #Binance
🔴 $BTC BREAKS $60,000, FIRST TIME SINCE JULY
Bitcoin slid below $60,000 on Friday, touching ~$58,700, down ~5% in 24 hours and now ~53% below its October record high of $126,296.
This was not a crypto-only move. US tech stocks sold off hard, with AI names leading lower, and the ETF tape tells the real story: BlackRock's IBIT saw a record $541M of outflows on Thursday, the largest single-day exit ever.
$60,000 was the line the market defended for months. Losing it flips the structure bearish, with the next support at ~$57,700, the July 1 low. Bitcoin is now on course for a seventh straight weekly loss.
Risk check: markets this oversold can snap back violently, and shorting into support is how traders get squeezed. The trend is down until buyers reclaim $60K. Trade the level, not the emotion.
📌 Sharing personal opinions only, not financial advice or a recommendation to buy/sell. Crypto is highly risky; DYOR and you are solely responsible. No coin promotion.
$BTC #Bitcoin #Crypto #BitcoinETF #Binance
Bitcoin slid below $60,000 on Friday, touching ~$58,700, down ~5% in 24 hours and now ~53% below its October record high of $126,296.
This was not a crypto-only move. US tech stocks sold off hard, with AI names leading lower, and the ETF tape tells the real story: BlackRock's IBIT saw a record $541M of outflows on Thursday, the largest single-day exit ever.
$60,000 was the line the market defended for months. Losing it flips the structure bearish, with the next support at ~$57,700, the July 1 low. Bitcoin is now on course for a seventh straight weekly loss.
Risk check: markets this oversold can snap back violently, and shorting into support is how traders get squeezed. The trend is down until buyers reclaim $60K. Trade the level, not the emotion.
📌 Sharing personal opinions only, not financial advice or a recommendation to buy/sell. Crypto is highly risky; DYOR and you are solely responsible. No coin promotion.
$BTC #Bitcoin #Crypto #BitcoinETF #Binance
BTC-7.58%
IBITETF-4.95%
Abu Fahadأ:
💛
1
9
12.9k

·
--
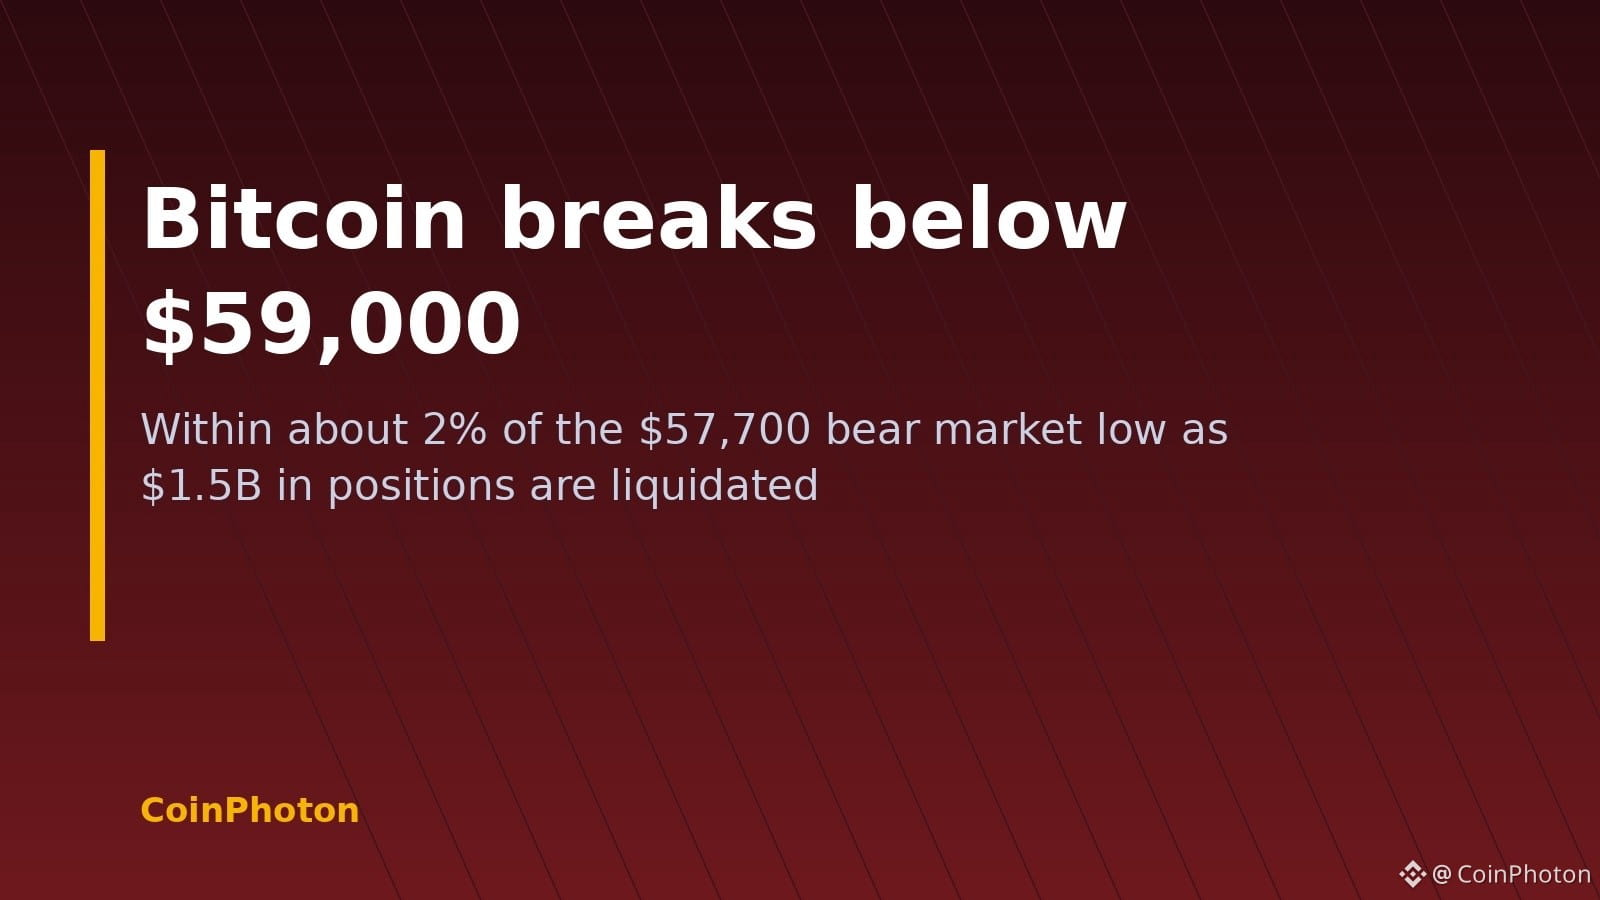
📉 Bitcoin breaks below $59,000, nears its $57,700 bear market low
BTC slid under $59,000 on Friday, wiping out the entire August-September rally to $87,000 and leaving it roughly 2% above the June-July low of $57,700. The selling started in AI stocks: Anthropic shares sank more than 14%, below their $83 IPO price, and the Nasdaq lost 3.8%. Ether dropped 7%, XRP, SOL and BNB fell 5-6%, and about $1.5B in leveraged crypto positions were liquidated in 24 hours, per CoinGlass.
⭐ A break below $57,700 would mark a fresh 2026 low and undercut the view that the bear market already bottomed this summer.
#Bitcoin #BTC #CryptoMarket #Liquidations
📉 Bitcoin breaks below $59,000, nears its $57,700 bear market low
BTC slid under $59,000 on Friday, wiping out the entire August-September rally to $87,000 and leaving it roughly 2% above the June-July low of $57,700. The selling started in AI stocks: Anthropic shares sank more than 14%, below their $83 IPO price, and the Nasdaq lost 3.8%. Ether dropped 7%, XRP, SOL and BNB fell 5-6%, and about $1.5B in leveraged crypto positions were liquidated in 24 hours, per CoinGlass.
⭐ A break below $57,700 would mark a fresh 2026 low and undercut the view that the bear market already bottomed this summer.
#Bitcoin #BTC #CryptoMarket #Liquidations
BTC slid under $59,000 on Friday, wiping out the entire August-September rally to $87,000 and leaving it roughly 2% above the June-July low of $57,700. The selling started in AI stocks: Anthropic shares sank more than 14%, below their $83 IPO price, and the Nasdaq lost 3.8%. Ether dropped 7%, XRP, SOL and BNB fell 5-6%, and about $1.5B in leveraged crypto positions were liquidated in 24 hours, per CoinGlass.
⭐ A break below $57,700 would mark a fresh 2026 low and undercut the view that the bear market already bottomed this summer.
#Bitcoin #BTC #CryptoMarket #Liquidations
1
322

·
--
BITCOIN DROPS BELOW 58,000 USD! CRYPTO MARKET LOSES BILLIONS
A large-scale sell-off continues across the cryptocurrency market. On Friday, November 20, $BTC fell below 58,000 USD for the first time since July, effectively wiping out almost all of its summer gains.
Altcoins have also come under pressure:
$ETH - Ethereum dropped to approximately 1,650 - 1,750 USD.
$SOL - Solana traded around 72 USD.
XRP - also faced downward pressure amid the broader market decline.
According to CoinGlass data, approximately 1.5 billion USD in trader positions was liquidated over a 24-hour period, with nearly 1.44 billion USD coming from long positions.
Additional pressure stems from institutional outflows: U.S. Bitcoin ETFs recorded 582 million USD in net outflows in a single trading day.
The market is undergoing a serious stress test. However, it is precisely during such sell-offs that opportunities emerge for long-term investors.
#CryptoNews #BuyTheDip #bitcoin
BITCOIN DROPS BELOW 58,000 USD! CRYPTO MARKET LOSES BILLIONS
A large-scale sell-off continues across the cryptocurrency market. On Friday, November 20, $BTC fell below 58,000 USD for the first time since July, effectively wiping out almost all of its summer gains.
Altcoins have also come under pressure:
$ETH - Ethereum dropped to approximately 1,650 - 1,750 USD.
$SOL - Solana traded around 72 USD.
XRP - also faced downward pressure amid the broader market decline.
According to CoinGlass data, approximately 1.5 billion USD in trader positions was liquidated over a 24-hour period, with nearly 1.44 billion USD coming from long positions.
Additional pressure stems from institutional outflows: U.S. Bitcoin ETFs recorded 582 million USD in net outflows in a single trading day.
The market is undergoing a serious stress test. However, it is precisely during such sell-offs that opportunities emerge for long-term investors.
#CryptoNews #BuyTheDip #bitcoin
A large-scale sell-off continues across the cryptocurrency market. On Friday, November 20, $BTC fell below 58,000 USD for the first time since July, effectively wiping out almost all of its summer gains.
Altcoins have also come under pressure:
$ETH - Ethereum dropped to approximately 1,650 - 1,750 USD.
$SOL - Solana traded around 72 USD.
XRP - also faced downward pressure amid the broader market decline.
According to CoinGlass data, approximately 1.5 billion USD in trader positions was liquidated over a 24-hour period, with nearly 1.44 billion USD coming from long positions.
Additional pressure stems from institutional outflows: U.S. Bitcoin ETFs recorded 582 million USD in net outflows in a single trading day.
The market is undergoing a serious stress test. However, it is precisely during such sell-offs that opportunities emerge for long-term investors.
#CryptoNews #BuyTheDip #bitcoin

411

·
--

Article
BTC DUMP TO $60K? IS BITCOIN ENTERING A DEEPER CORRECTION?Bitcoin is facing strong selling pressure, and the possibility of a drop toward the $60,000 level is becoming a major concern for crypto traders. Market uncertainty, liquidations, weak buying momentum, and fear across the crypto market can accelerate downside moves.
But is $60K a realistic target, or could Bitcoin recover before reaching that level?
📉 Why Is Bitcoin Falling?
Several factors can contribute to a sharp BTC decline:
* Profit-taking: Traders may be closing positions after previous rallies.
* Liquidations: Leveraged long positions can trigger cascading sell-offs.
* Weak market sentiment: Fear often pushes investors toward cash and safer assets.
* Liquidity pressure: When buyers disappear, even moderate selling can move prices sharply lower.
* Resistance rejection: Failure to break important resistance levels can bring sellers back into control.
🎯 Is $60,000 the Next Target?
If Bitcoin continues making lower highs and lower lows, bearish momentum could push the price toward major support zones. The $60K level could become an important psychological and technical area where buyers may attempt to defend the market.
However, reaching $60K is not guaranteed. Bitcoin can reverse sharply at any support level if buying volume returns and market sentiment improves.
{spot}(BTCUSDT)
🐻 Bearish vs. 🐂 Bullish Scenario!
[BTC Market Brief]
[Bitcoin Price Prediction: Bears Dominate as BTC Closes Below 50-Week EMA]
[Bitcoin Clings to $62.5K as Bearish Pressure Tightens Its Grip]
Bearish scenario 🐻
If selling pressure continues, BTC could break lower supports, triggering more liquidations and potentially moving toward $60K.
Bullish scenario 🐂
If buyers step in, Bitcoin could reclaim key resistance levels, stabilize, and turn the current correction into a temporary shakeout.
🧠 What Should Traders Do?
During high volatility, emotional trading can be dangerous. Avoid blindly chasing falling prices or using excessive leverage. Watch support, resistance, volume, and market structure before making any decision.
Sometimes the biggest opportunities appear during fear—but patience and risk management matter more than trying to predict the exact bottom.
#Bitcoin #CanBTCReboundAfterFallingBelow60K?
BTC DUMP TO $60K? IS BITCOIN ENTERING A DEEPER CORRECTION?
Bitcoin is facing strong selling pressure, and the possibility of a drop toward the $60,000 level is becoming a major concern for crypto traders. Market uncertainty, liquidations, weak buying momentum, and fear across the crypto market can accelerate downside moves.
But is $60K a realistic target, or could Bitcoin recover before reaching that level?
📉 Why Is Bitcoin Falling?
Several factors can contribute to a sharp BTC decline:
* Profit-taking: Traders may be closing positions after previous rallies.
* Liquidations: Leveraged long positions can trigger cascading sell-offs.
* Weak market sentiment: Fear often pushes investors toward cash and safer assets.
* Liquidity pressure: When buyers disappear, even moderate selling can move prices sharply lower.
* Resistance rejection: Failure to break important resistance levels can bring sellers back into control.
🎯 Is $60,000 the Next Target?
If Bitcoin continues making lower highs and lower lows, bearish momentum could push the price toward major support zones. The $60K level could become an important psychological and technical area where buyers may attempt to defend the market.
However, reaching $60K is not guaranteed. Bitcoin can reverse sharply at any support level if buying volume returns and market sentiment improves.
🐻 Bearish vs. 🐂 Bullish Scenario!
[BTC Market Brief]
[Bitcoin Price Prediction: Bears Dominate as BTC Closes Below 50-Week EMA]
[Bitcoin Clings to $62.5K as Bearish Pressure Tightens Its Grip]
Bearish scenario 🐻
If selling pressure continues, BTC could break lower supports, triggering more liquidations and potentially moving toward $60K.
Bullish scenario 🐂
If buyers step in, Bitcoin could reclaim key resistance levels, stabilize, and turn the current correction into a temporary shakeout.
🧠 What Should Traders Do?
During high volatility, emotional trading can be dangerous. Avoid blindly chasing falling prices or using excessive leverage. Watch support, resistance, volume, and market structure before making any decision.
Sometimes the biggest opportunities appear during fear—but patience and risk management matter more than trying to predict the exact bottom.
#Bitcoin #CanBTCReboundAfterFallingBelow60K?
But is $60K a realistic target, or could Bitcoin recover before reaching that level?
📉 Why Is Bitcoin Falling?
Several factors can contribute to a sharp BTC decline:
* Profit-taking: Traders may be closing positions after previous rallies.
* Liquidations: Leveraged long positions can trigger cascading sell-offs.
* Weak market sentiment: Fear often pushes investors toward cash and safer assets.
* Liquidity pressure: When buyers disappear, even moderate selling can move prices sharply lower.
* Resistance rejection: Failure to break important resistance levels can bring sellers back into control.
🎯 Is $60,000 the Next Target?
If Bitcoin continues making lower highs and lower lows, bearish momentum could push the price toward major support zones. The $60K level could become an important psychological and technical area where buyers may attempt to defend the market.
However, reaching $60K is not guaranteed. Bitcoin can reverse sharply at any support level if buying volume returns and market sentiment improves.
🐻 Bearish vs. 🐂 Bullish Scenario!
[BTC Market Brief]
[Bitcoin Price Prediction: Bears Dominate as BTC Closes Below 50-Week EMA]
[Bitcoin Clings to $62.5K as Bearish Pressure Tightens Its Grip]
Bearish scenario 🐻
If selling pressure continues, BTC could break lower supports, triggering more liquidations and potentially moving toward $60K.
Bullish scenario 🐂
If buyers step in, Bitcoin could reclaim key resistance levels, stabilize, and turn the current correction into a temporary shakeout.
🧠 What Should Traders Do?
During high volatility, emotional trading can be dangerous. Avoid blindly chasing falling prices or using excessive leverage. Watch support, resistance, volume, and market structure before making any decision.
Sometimes the biggest opportunities appear during fear—but patience and risk management matter more than trying to predict the exact bottom.
#Bitcoin #CanBTCReboundAfterFallingBelow60K?
3
141

·
--
Bearish
$BTC Is the $48K–$50K Zone the Final Bottom?
Bitcoin is showing serious weakness, but we may be approaching a major accumulation opportunity.
My thesis: BTC could find its bottom in the $48,000–$50,000 range.
Here’s why this zone deserves attention.
1. Institutional selling
Spot Bitcoin ETF outflows signal weakening institutional demand, adding downside pressure.
2. Macroeconomic uncertainty
Interest rate expectations, bond yields, and Federal Reserve uncertainty continue to weigh on risk assets.
3. Long liquidations
Heavy liquidations accelerate declines. When leveraged longs are wiped out, selling pressure can help create a market bottom.
4. Technical perspective
The $60K–$61K area is under pressure. If Bitcoin fails to reclaim resistance, lower support zones become increasingly relevant.
Key levels:
* $57K–$58K: Intermediate support.
* $50K: Psychological and technical level.
* $48K: Potential capitulation zone.
What happens next?
Bearish scenario: BTC loses intermediate support, triggering more liquidations and potentially pushing price toward $48K–$50K.
Bullish scenario: Bitcoin finds strong demand in this zone, selling pressure fades, and a recovery toward $65K–$68K becomes possible.
Institutional investors may remain cautious until flows stabilize, while broader market liquidity will likely determine whether selling continues or exhaustion sets in. A sharp rebound should still require confirmation through stronger spot demand and a sustained move back above resistance beyond a short squeeze.
My conclusion
Not every correction is a buying opportunity, but the $48K–$50K region deserves serious attention.
Watch volume, ETF flows, market sentiment, and Bitcoin’s reaction at major support.
The bottom is never confirmed in advance. The best opportunities often appear when fear is at its highest.
What’s your opinion?
Are we heading toward $50K, or will Bitcoin recover before reaching that level?
#bitcoin #BTC #CryptoMarket #BinanceSquare #Trading
$BTC Is the $48K–$50K Zone the Final Bottom?
Bitcoin is showing serious weakness, but we may be approaching a major accumulation opportunity.
My thesis: BTC could find its bottom in the $48,000–$50,000 range.
Here’s why this zone deserves attention.
1. Institutional selling
Spot Bitcoin ETF outflows signal weakening institutional demand, adding downside pressure.
2. Macroeconomic uncertainty
Interest rate expectations, bond yields, and Federal Reserve uncertainty continue to weigh on risk assets.
3. Long liquidations
Heavy liquidations accelerate declines. When leveraged longs are wiped out, selling pressure can help create a market bottom.
4. Technical perspective
The $60K–$61K area is under pressure. If Bitcoin fails to reclaim resistance, lower support zones become increasingly relevant.
Key levels:
* $57K–$58K: Intermediate support.
* $50K: Psychological and technical level.
* $48K: Potential capitulation zone.
What happens next?
Bearish scenario: BTC loses intermediate support, triggering more liquidations and potentially pushing price toward $48K–$50K.
Bullish scenario: Bitcoin finds strong demand in this zone, selling pressure fades, and a recovery toward $65K–$68K becomes possible.
Institutional investors may remain cautious until flows stabilize, while broader market liquidity will likely determine whether selling continues or exhaustion sets in. A sharp rebound should still require confirmation through stronger spot demand and a sustained move back above resistance beyond a short squeeze.
My conclusion
Not every correction is a buying opportunity, but the $48K–$50K region deserves serious attention.
Watch volume, ETF flows, market sentiment, and Bitcoin’s reaction at major support.
The bottom is never confirmed in advance. The best opportunities often appear when fear is at its highest.
What’s your opinion?
Are we heading toward $50K, or will Bitcoin recover before reaching that level?
#bitcoin #BTC #CryptoMarket #BinanceSquare #Trading
Bitcoin is showing serious weakness, but we may be approaching a major accumulation opportunity.
My thesis: BTC could find its bottom in the $48,000–$50,000 range.
Here’s why this zone deserves attention.
1. Institutional selling
Spot Bitcoin ETF outflows signal weakening institutional demand, adding downside pressure.
2. Macroeconomic uncertainty
Interest rate expectations, bond yields, and Federal Reserve uncertainty continue to weigh on risk assets.
3. Long liquidations
Heavy liquidations accelerate declines. When leveraged longs are wiped out, selling pressure can help create a market bottom.
4. Technical perspective
The $60K–$61K area is under pressure. If Bitcoin fails to reclaim resistance, lower support zones become increasingly relevant.
Key levels:
* $57K–$58K: Intermediate support.
* $50K: Psychological and technical level.
* $48K: Potential capitulation zone.
What happens next?
Bearish scenario: BTC loses intermediate support, triggering more liquidations and potentially pushing price toward $48K–$50K.
Bullish scenario: Bitcoin finds strong demand in this zone, selling pressure fades, and a recovery toward $65K–$68K becomes possible.
Institutional investors may remain cautious until flows stabilize, while broader market liquidity will likely determine whether selling continues or exhaustion sets in. A sharp rebound should still require confirmation through stronger spot demand and a sustained move back above resistance beyond a short squeeze.
My conclusion
Not every correction is a buying opportunity, but the $48K–$50K region deserves serious attention.
Watch volume, ETF flows, market sentiment, and Bitcoin’s reaction at major support.
The bottom is never confirmed in advance. The best opportunities often appear when fear is at its highest.
What’s your opinion?
Are we heading toward $50K, or will Bitcoin recover before reaching that level?
#bitcoin #BTC #CryptoMarket #BinanceSquare #Trading

1
172

·
--
Bearish
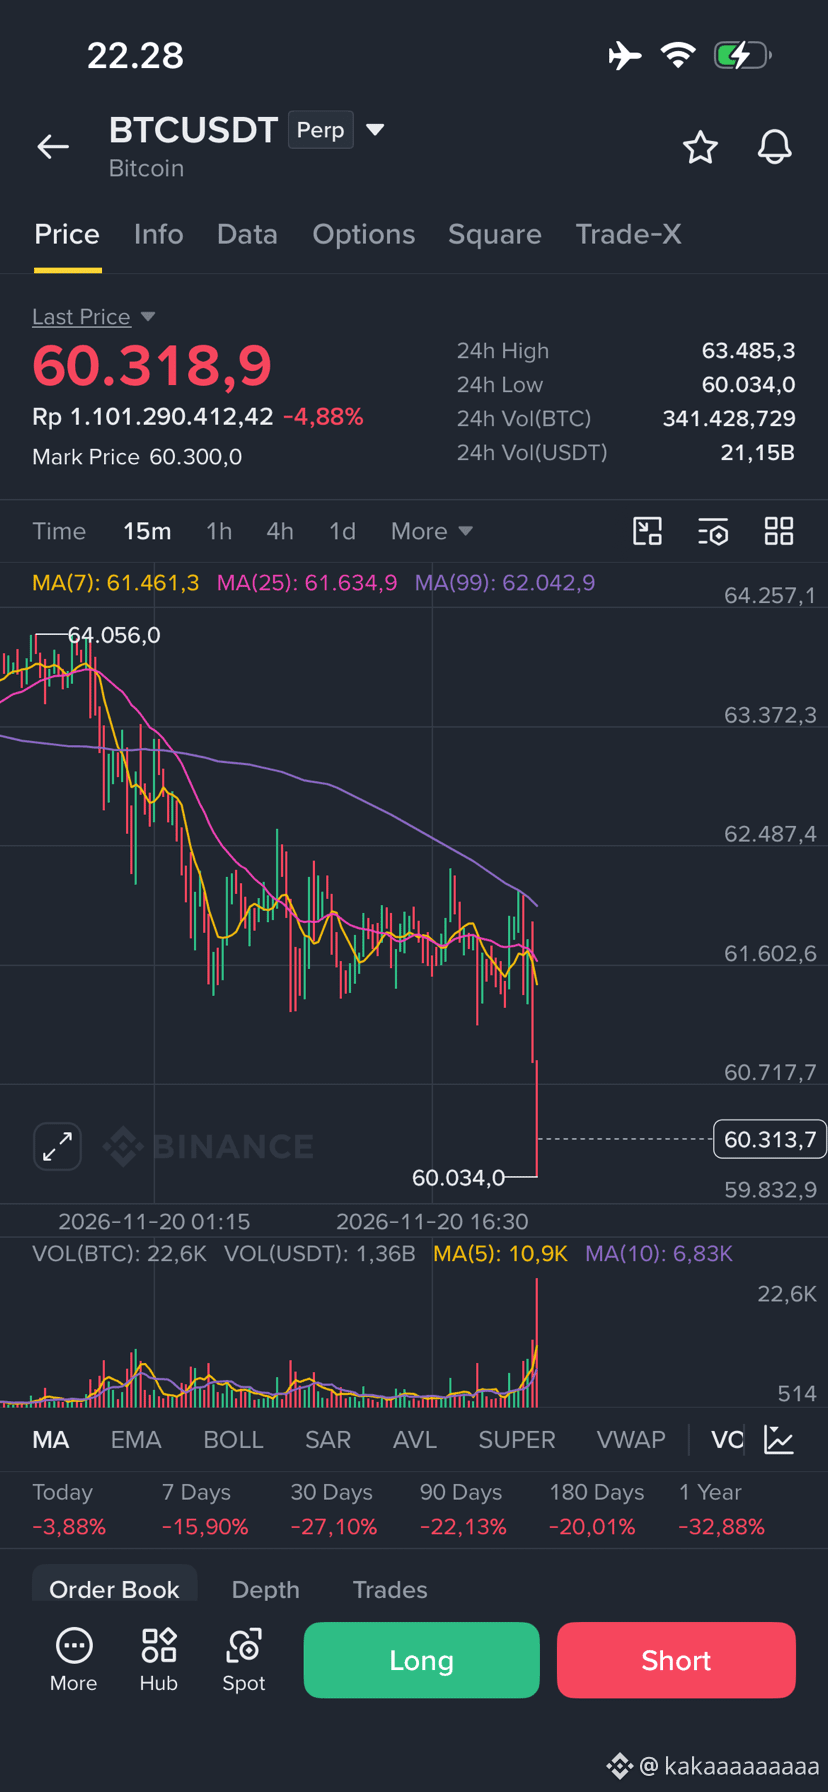
Bitcoin just dumped to $60K 😱
$BTC is now trading at $60,318 — down -4.88% in 24h and sitting right at its daily low of $60,034. The dump came with a massive volume spike: $21.15B traded in 24h.
Zoom out and it's ugly:
📉 7 days: -15.90%
📉 30 days: -27.10%
📉 1 year: -32.88%
Price is now below every major moving average (MA7 $61,461 / MA25 $61,635 / MA99 $62,043). No support held — $61K broke like paper.
Is $60K the bottom, or is this the start of something deeper? The next few hours will tell. Don't catch a falling knife. 🔪
$BTC
#BTC #bitcoin #crypto #Binance
{future}(BTCUSDT)
Bitcoin just dumped to $60K 😱
$BTC is now trading at $60,318 — down -4.88% in 24h and sitting right at its daily low of $60,034. The dump came with a massive volume spike: $21.15B traded in 24h.
Zoom out and it's ugly:
📉 7 days: -15.90%
📉 30 days: -27.10%
📉 1 year: -32.88%
Price is now below every major moving average (MA7 $61,461 / MA25 $61,635 / MA99 $62,043). No support held — $61K broke like paper.
Is $60K the bottom, or is this the start of something deeper? The next few hours will tell. Don't catch a falling knife. 🔪
$BTC
#BTC #bitcoin #crypto #Binance
$BTC is now trading at $60,318 — down -4.88% in 24h and sitting right at its daily low of $60,034. The dump came with a massive volume spike: $21.15B traded in 24h.
Zoom out and it's ugly:
📉 7 days: -15.90%
📉 30 days: -27.10%
📉 1 year: -32.88%
Price is now below every major moving average (MA7 $61,461 / MA25 $61,635 / MA99 $62,043). No support held — $61K broke like paper.
Is $60K the bottom, or is this the start of something deeper? The next few hours will tell. Don't catch a falling knife. 🔪
$BTC
#BTC #bitcoin #crypto #Binance
1
510

·
--
Bearish
LATEST: 📊 Bitcoin Is Becoming Real Money
A new report from Block finds 72% of Square's Bitcoin transactions occur at food and drink businesses.
Not luxury. Not hype. Not novelty.
Coffee. Lunch. Dinner. Everyday life.
Bitcoin is no longer just something people hold — it's something people actually USE.
This is the biggest signal for mass adoption:
When people start spending Bitcoin on food, it stops being just an investment...
It becomes money.
Are you spending or still just holding? 👇
#BTC #Bitcoin #Crypto #Adoption
{future}(BTCUSDT)
LATEST: 📊 Bitcoin Is Becoming Real Money
A new report from Block finds 72% of Square's Bitcoin transactions occur at food and drink businesses.
Not luxury. Not hype. Not novelty.
Coffee. Lunch. Dinner. Everyday life.
Bitcoin is no longer just something people hold — it's something people actually USE.
This is the biggest signal for mass adoption:
When people start spending Bitcoin on food, it stops being just an investment...
It becomes money.
Are you spending or still just holding? 👇
#BTC #Bitcoin #Crypto #Adoption
A new report from Block finds 72% of Square's Bitcoin transactions occur at food and drink businesses.
Not luxury. Not hype. Not novelty.
Coffee. Lunch. Dinner. Everyday life.
Bitcoin is no longer just something people hold — it's something people actually USE.
This is the biggest signal for mass adoption:
When people start spending Bitcoin on food, it stops being just an investment...
It becomes money.
Are you spending or still just holding? 👇
#BTC #Bitcoin #Crypto #Adoption


2
186

Twenty One Capital, Inc. (XXI) announced that, following the acquisition of 154.32 Bitcoin on November 16, it purchased an additional 172.25 Bitcoin for $10 million. The average purchase price per Bitcoin was approximately $58,054.
With this cash-funded purchase, the company’s total Bitcoin holdings reached approximately 43,841 as of November 20, 2026.
#Bitcoin #BTC $BTC
{spot}(BTCUSDT)
Twenty One Capital, Inc. (XXI) announced that, following the acquisition of 154.32 Bitcoin on November 16, it purchased an additional 172.25 Bitcoin for $10 million. The average purchase price per Bitcoin was approximately $58,054.
With this cash-funded purchase, the company’s total Bitcoin holdings reached approximately 43,841 as of November 20, 2026.
#Bitcoin #BTC $BTC
With this cash-funded purchase, the company’s total Bitcoin holdings reached approximately 43,841 as of November 20, 2026.
#Bitcoin #BTC $BTC
Abu Fahadأ:
💛
1
346

·
--
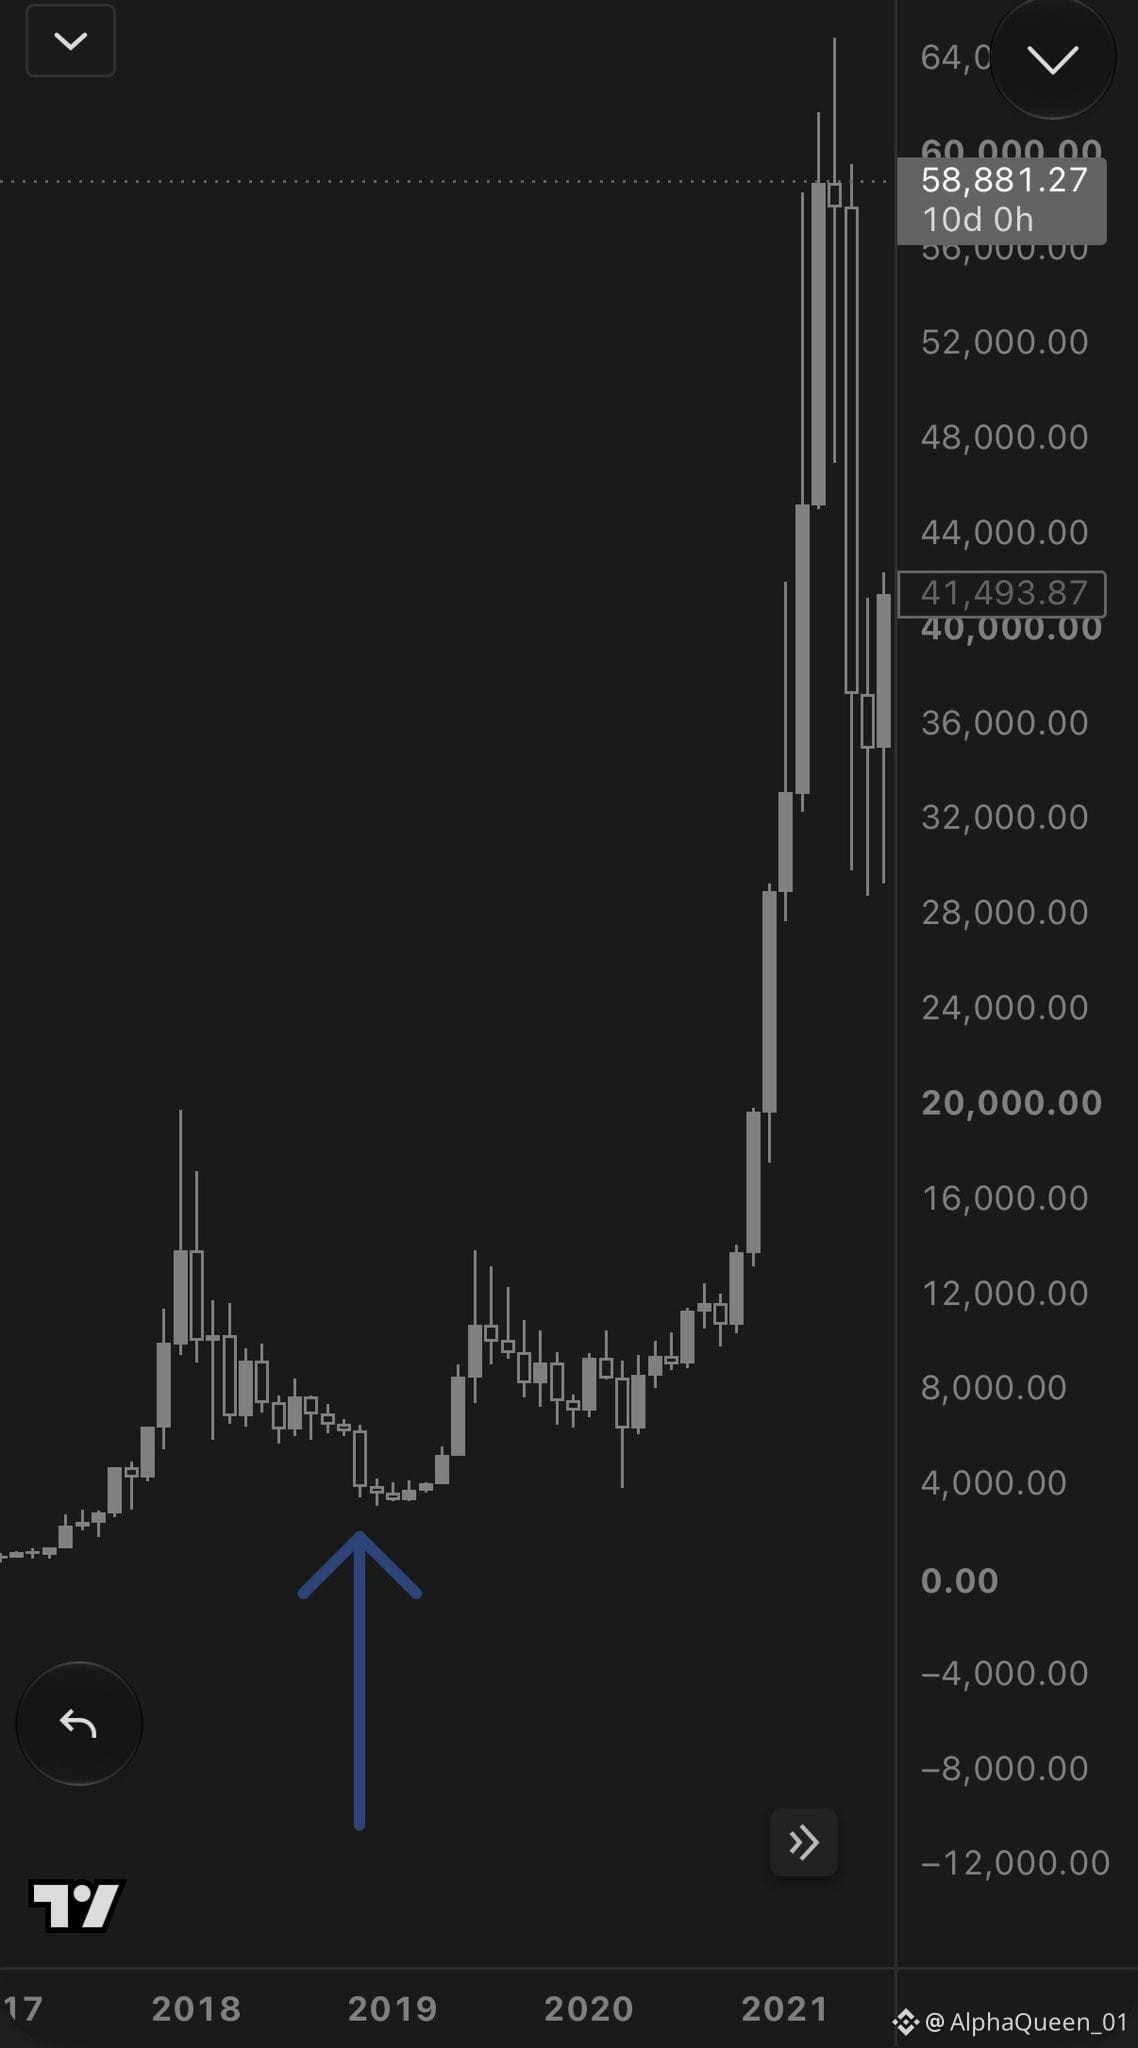
📉 BTC: Is History Repeating Itself?
Remember January 2024? Bitcoin dropped near $38,500 before making a remarkable recovery.
Now, in November 2026, BTC is around $59,500.
Could another major correction be coming in 2027?
I’m watching, learning and staying patient. No FOMO, just strategy.
What do you expect in 2027: More downside or a strong recovery? 👀
#bitcoin #BTC #Crypto2027 $BTC #CanBTCReboundAfterFallingBelow60K?
📉 BTC: Is History Repeating Itself?
Remember January 2024? Bitcoin dropped near $38,500 before making a remarkable recovery.
Now, in November 2026, BTC is around $59,500.
Could another major correction be coming in 2027?
I’m watching, learning and staying patient. No FOMO, just strategy.
What do you expect in 2027: More downside or a strong recovery? 👀
#bitcoin #BTC #Crypto2027 $BTC #CanBTCReboundAfterFallingBelow60K?
Remember January 2024? Bitcoin dropped near $38,500 before making a remarkable recovery.
Now, in November 2026, BTC is around $59,500.
Could another major correction be coming in 2027?
I’m watching, learning and staying patient. No FOMO, just strategy.
What do you expect in 2027: More downside or a strong recovery? 👀
#bitcoin #BTC #Crypto2027 $BTC #CanBTCReboundAfterFallingBelow60K?
Bullish 📈
Bearish 📉
14 hr(s) left
384
·
--
Bearish
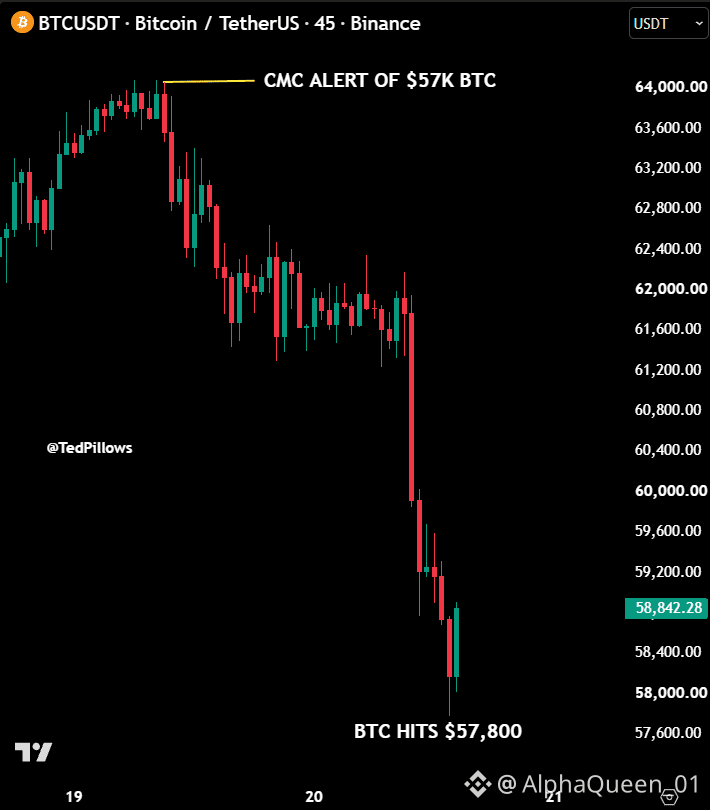
Wait... How is this even possible? 😳
On 19th November, CoinMarketCap sent a notification for $57,000 BTC.
At that time Bitcoin was at $64K.
And since then? Only down. Down. Down.
And today — $BTC just hit sub-$57K. Exactly the same price as that alert.
Same number. Same level. To the point.
Is this a coincidence? A glitch? Or did the market already know?
We are really living in a simulation. 💀
Comment your theory 👇
#BTC #Bitcoin #Crypto
{future}(BTCUSDT)
Wait... How is this even possible? 😳
On 19th November, CoinMarketCap sent a notification for $57,000 BTC.
At that time Bitcoin was at $64K.
And since then? Only down. Down. Down.
And today — $BTC just hit sub-$57K. Exactly the same price as that alert.
Same number. Same level. To the point.
Is this a coincidence? A glitch? Or did the market already know?
We are really living in a simulation. 💀
Comment your theory 👇
#BTC #Bitcoin #Crypto
On 19th November, CoinMarketCap sent a notification for $57,000 BTC.
At that time Bitcoin was at $64K.
And since then? Only down. Down. Down.
And today — $BTC just hit sub-$57K. Exactly the same price as that alert.
Same number. Same level. To the point.
Is this a coincidence? A glitch? Or did the market already know?
We are really living in a simulation. 💀
Comment your theory 👇
#BTC #Bitcoin #Crypto

2
194
Log in to explore more content
Join global crypto users on Binance Square
⚡️ Get latest and useful information about crypto.
💬 Trusted by the world’s largest crypto exchange.
👍 Discover real insights from verified creators.
Email / Phone number
Trending Topics
1
#CanBTCReboundAfterFallingBelow60K?
166,152 views
739 Discussing
2
#GlobalStocksFaceLongestLosingStreakSince2023
68,055 views
642 Discussing
3
#AnthropicPlungesTowardIPOPriceonDay2
28,313 views
289 Discussing
4
#BNBDropsBelow540USDTWith8.46%DailyDecline
2,903 views
58 Discussing
5
#HKBillProposesHK$100KFineForUnauthorizedCryptoTitles
0 views
3 Discussing
6
#BitMineFaces$10.1BUnrealizedETHLoss
123 views
3 Discussing
7
#StrategyReports$35BNetReserves
43 views
4 Discussing
8
#MorganStanleyEndsAnthropicStockSupportAfterOneDay
1,520 views
46 Discussing
9
#CryptoBilisAttackerMoves25000ETHToTornadoCash
2,556 views
42 Discussing
10
#POSCOAndLGCNSCompleteReceivablesTokenizationPilotOnInjective
0 views
3 Discussing