
#asts
asts
24,354 views
367 Discussing
Hot
Latest

·
--
$ASTS fell 6.231% over the past 24 hours, and the price is now 62.3. The size of this drop isn’t small, but what’s interesting is that two other key indicators on the board are fairly calm: the funding rate is zero, and open interest remains around 43,638.
These two calm figures, when viewed alongside the price drop, are the key to today. A zero funding rate means neither longs nor shorts have gained an advantage, and nobody is paying expensive costs to maintain positions. Since open interest hasn’t seen dramatic fluctuations during the price decline, it suggests there hasn’t been a large influx of new shorts to push the market down, nor have longs collectively panic-sold and exited.
My view is that this drop looks more like an overdue cycle of profit-taking or position reduction by existing holders, rather than a new round of aggressive 主力/major player building by shorts. The market hasn’t formed a strong new long-vs-short standoff. It feels more like a sentiment-driven sell-off than the start of structural selling pressure.
What’s the strongest counter-evidence? If prices keep falling next, but open interest begins to increase significantly, then my view would be wrong. That would imply shorts are using the down move to rebuild positions, and the market structure would become more complicated.
The second-order implications are simple. The hardest part of a low-volume decline is for those longs who entered at high levels and still have relatively heavy exposure. They’re bearing unrealized losses, but they haven’t received a clear pressure signal from the shorts—so their decision-making is very conflicted. If the market continues to lack direction, this portion of capital may choose to leave and wait, becoming a source of liquidity for the next wave.
Invalidation conditions are clear: if $ASTS rebounds but open interest remains weak, it means longs also lack confidence and the rebound won’t be sustainable. Or, if a sudden huge volume spike appears around the current level—regardless of whether price is up or down—it means market consensus has changed and the current “calm” assessment no longer holds.
So my action is: wait. For longs, around 62.3 isn’t a spot worth adding, because there’s no clear bullish signal to support it. For shorts, opening a new short here also doesn’t make much sense, because the funding rate is neutral, there’s no room for funding-rate arbitrage on the downside, and open interest isn’t cooperating. A more prudent approach is to observe whether price can stabilize in the current range, while closely tracking changes in open interest. If open interest starts rising moderately and price stops making new lows, that’s the signal the market may be choosing a new direction.
Trading tag: #TradFi #链上美股 #ASTS
Where do you think this set of assumptions is most likely to be wrong?
$ASTS fell 6.231% over the past 24 hours, and the price is now 62.3. The size of this drop isn’t small, but what’s interesting is that two other key indicators on the board are fairly calm: the funding rate is zero, and open interest remains around 43,638.
These two calm figures, when viewed alongside the price drop, are the key to today. A zero funding rate means neither longs nor shorts have gained an advantage, and nobody is paying expensive costs to maintain positions. Since open interest hasn’t seen dramatic fluctuations during the price decline, it suggests there hasn’t been a large influx of new shorts to push the market down, nor have longs collectively panic-sold and exited.
My view is that this drop looks more like an overdue cycle of profit-taking or position reduction by existing holders, rather than a new round of aggressive 主力/major player building by shorts. The market hasn’t formed a strong new long-vs-short standoff. It feels more like a sentiment-driven sell-off than the start of structural selling pressure.
What’s the strongest counter-evidence? If prices keep falling next, but open interest begins to increase significantly, then my view would be wrong. That would imply shorts are using the down move to rebuild positions, and the market structure would become more complicated.
The second-order implications are simple. The hardest part of a low-volume decline is for those longs who entered at high levels and still have relatively heavy exposure. They’re bearing unrealized losses, but they haven’t received a clear pressure signal from the shorts—so their decision-making is very conflicted. If the market continues to lack direction, this portion of capital may choose to leave and wait, becoming a source of liquidity for the next wave.
Invalidation conditions are clear: if $ASTS rebounds but open interest remains weak, it means longs also lack confidence and the rebound won’t be sustainable. Or, if a sudden huge volume spike appears around the current level—regardless of whether price is up or down—it means market consensus has changed and the current “calm” assessment no longer holds.
So my action is: wait. For longs, around 62.3 isn’t a spot worth adding, because there’s no clear bullish signal to support it. For shorts, opening a new short here also doesn’t make much sense, because the funding rate is neutral, there’s no room for funding-rate arbitrage on the downside, and open interest isn’t cooperating. A more prudent approach is to observe whether price can stabilize in the current range, while closely tracking changes in open interest. If open interest starts rising moderately and price stops making new lows, that’s the signal the market may be choosing a new direction.
Trading tag: #TradFi #链上美股 #ASTS
Where do you think this set of assumptions is most likely to be wrong?
These two calm figures, when viewed alongside the price drop, are the key to today. A zero funding rate means neither longs nor shorts have gained an advantage, and nobody is paying expensive costs to maintain positions. Since open interest hasn’t seen dramatic fluctuations during the price decline, it suggests there hasn’t been a large influx of new shorts to push the market down, nor have longs collectively panic-sold and exited.
My view is that this drop looks more like an overdue cycle of profit-taking or position reduction by existing holders, rather than a new round of aggressive 主力/major player building by shorts. The market hasn’t formed a strong new long-vs-short standoff. It feels more like a sentiment-driven sell-off than the start of structural selling pressure.
What’s the strongest counter-evidence? If prices keep falling next, but open interest begins to increase significantly, then my view would be wrong. That would imply shorts are using the down move to rebuild positions, and the market structure would become more complicated.
The second-order implications are simple. The hardest part of a low-volume decline is for those longs who entered at high levels and still have relatively heavy exposure. They’re bearing unrealized losses, but they haven’t received a clear pressure signal from the shorts—so their decision-making is very conflicted. If the market continues to lack direction, this portion of capital may choose to leave and wait, becoming a source of liquidity for the next wave.
Invalidation conditions are clear: if $ASTS rebounds but open interest remains weak, it means longs also lack confidence and the rebound won’t be sustainable. Or, if a sudden huge volume spike appears around the current level—regardless of whether price is up or down—it means market consensus has changed and the current “calm” assessment no longer holds.
So my action is: wait. For longs, around 62.3 isn’t a spot worth adding, because there’s no clear bullish signal to support it. For shorts, opening a new short here also doesn’t make much sense, because the funding rate is neutral, there’s no room for funding-rate arbitrage on the downside, and open interest isn’t cooperating. A more prudent approach is to observe whether price can stabilize in the current range, while closely tracking changes in open interest. If open interest starts rising moderately and price stops making new lows, that’s the signal the market may be choosing a new direction.
Trading tag: #TradFi #链上美股 #ASTS
Where do you think this set of assumptions is most likely to be wrong?
22

·
--
$ASTS current price 66.43, up 6.03% in the past 24 hours, but the funding rate is zero. This combination is very rare—worth taking apart to see what’s really going on.
Typically, when price rises, it comes with a positive funding rate: longs pay shorts. Now the price is being pushed up, yet the funding rate is zero. That suggests it isn’t longs chasing higher prices—it's shorts actively closing positions and exiting.
Open interest is 39125.8, which doesn’t show obvious abnormality, but the divergence between price and funding points to one fact: this surge is being driven by shorts’ stop-loss / liquidation-driven exits, not by fresh long capital pressing the attack.
The most direct counter-evidence is this: if it were a real strong trend starting, the funding rate wouldn’t stay stuck at zero. This could just be a pulse within range-bound consolidation at high levels, with insufficient sustained bid support.
Next, the key is the 65 integer level. If price retraces to it and can hold, that would mean the sell pressure after shorts’ stop-losses has already been released, potentially forming a new balance. If it breaks below 65, short-term positions that tried longs around 66 will trigger stop-losses, and the price could accelerate downward.
My plan: wait for a pullback into the 65–66 zone and observe. If it doesn’t break with decreasing volume, I’ll try a small long position, with a strict stop-loss set below 65. If it breaks down directly, I won’t participate.
Trading tag: #TradFi #链上美股 #ASTS
Where do you think this assessment is most likely to be wrong?
$ASTS current price 66.43, up 6.03% in the past 24 hours, but the funding rate is zero. This combination is very rare—worth taking apart to see what’s really going on.
Typically, when price rises, it comes with a positive funding rate: longs pay shorts. Now the price is being pushed up, yet the funding rate is zero. That suggests it isn’t longs chasing higher prices—it's shorts actively closing positions and exiting.
Open interest is 39125.8, which doesn’t show obvious abnormality, but the divergence between price and funding points to one fact: this surge is being driven by shorts’ stop-loss / liquidation-driven exits, not by fresh long capital pressing the attack.
The most direct counter-evidence is this: if it were a real strong trend starting, the funding rate wouldn’t stay stuck at zero. This could just be a pulse within range-bound consolidation at high levels, with insufficient sustained bid support.
Next, the key is the 65 integer level. If price retraces to it and can hold, that would mean the sell pressure after shorts’ stop-losses has already been released, potentially forming a new balance. If it breaks below 65, short-term positions that tried longs around 66 will trigger stop-losses, and the price could accelerate downward.
My plan: wait for a pullback into the 65–66 zone and observe. If it doesn’t break with decreasing volume, I’ll try a small long position, with a strict stop-loss set below 65. If it breaks down directly, I won’t participate.
Trading tag: #TradFi #链上美股 #ASTS
Where do you think this assessment is most likely to be wrong?
Typically, when price rises, it comes with a positive funding rate: longs pay shorts. Now the price is being pushed up, yet the funding rate is zero. That suggests it isn’t longs chasing higher prices—it's shorts actively closing positions and exiting.
Open interest is 39125.8, which doesn’t show obvious abnormality, but the divergence between price and funding points to one fact: this surge is being driven by shorts’ stop-loss / liquidation-driven exits, not by fresh long capital pressing the attack.
The most direct counter-evidence is this: if it were a real strong trend starting, the funding rate wouldn’t stay stuck at zero. This could just be a pulse within range-bound consolidation at high levels, with insufficient sustained bid support.
Next, the key is the 65 integer level. If price retraces to it and can hold, that would mean the sell pressure after shorts’ stop-losses has already been released, potentially forming a new balance. If it breaks below 65, short-term positions that tried longs around 66 will trigger stop-losses, and the price could accelerate downward.
My plan: wait for a pullback into the 65–66 zone and observe. If it doesn’t break with decreasing volume, I’ll try a small long position, with a strict stop-loss set below 65. If it breaks down directly, I won’t participate.
Trading tag: #TradFi #链上美股 #ASTS
Where do you think this assessment is most likely to be wrong?
69

·
--
$ASTS over the past 24 hours rose 5.46%, to 66.64, but the funding rate is zero. This combination is rare: prices are moving up, yet both longs and shorts are not paying fees, which suggests the market is waiting for signals rather than everyone pulling in the same direction.
A zero funding rate means both long and short costs are staying put. This kind of balance is the most fragile—any escalation in political or military news could instantly break it. Currently holding 39,011 contracts: the price is moving up, but the funding rate isn’t changing. The rise lacks long-side premium support; it looks more like it’s gathering momentum while waiting for the direction to become clear.
Trading tag: #TradFi #链上美股 #ASTS
Where do you think this assessment is most likely to be wrong?
$ASTS over the past 24 hours rose 5.46%, to 66.64, but the funding rate is zero. This combination is rare: prices are moving up, yet both longs and shorts are not paying fees, which suggests the market is waiting for signals rather than everyone pulling in the same direction.
A zero funding rate means both long and short costs are staying put. This kind of balance is the most fragile—any escalation in political or military news could instantly break it. Currently holding 39,011 contracts: the price is moving up, but the funding rate isn’t changing. The rise lacks long-side premium support; it looks more like it’s gathering momentum while waiting for the direction to become clear.
Trading tag: #TradFi #链上美股 #ASTS
Where do you think this assessment is most likely to be wrong?
A zero funding rate means both long and short costs are staying put. This kind of balance is the most fragile—any escalation in political or military news could instantly break it. Currently holding 39,011 contracts: the price is moving up, but the funding rate isn’t changing. The rise lacks long-side premium support; it looks more like it’s gathering momentum while waiting for the direction to become clear.
Trading tag: #TradFi #链上美股 #ASTS
Where do you think this assessment is most likely to be wrong?
26
·
--
$ASTS is up 5.46% today, priced at 66.64. The market is assigning a geopolitical risk premium to satellite communication stocks.
Satellite companies provide the infrastructure for military reconnaissance and emergency communications. When the situation in the Middle East and Eastern Europe tightens, capital flows here. The open interest of the 39,000-lot contracts has not changed significantly, the funding rate is zero, and the long and short sides are temporarily balanced. This rally is not being driven by longs aggressively piling in.
The counterargument: If conflict expectations cool down, this kind of panic premium would unwind the fastest, and the stock price would give back gains. In the second-order view, funds would move from “safe-haven” targets back into more purely growth-oriented tech stocks.
Trading tag: #TradFi #链上美股 #ASTS
Where do you think this thesis is most likely to be wrong?
$ASTS is up 5.46% today, priced at 66.64. The market is assigning a geopolitical risk premium to satellite communication stocks.
Satellite companies provide the infrastructure for military reconnaissance and emergency communications. When the situation in the Middle East and Eastern Europe tightens, capital flows here. The open interest of the 39,000-lot contracts has not changed significantly, the funding rate is zero, and the long and short sides are temporarily balanced. This rally is not being driven by longs aggressively piling in.
The counterargument: If conflict expectations cool down, this kind of panic premium would unwind the fastest, and the stock price would give back gains. In the second-order view, funds would move from “safe-haven” targets back into more purely growth-oriented tech stocks.
Trading tag: #TradFi #链上美股 #ASTS
Where do you think this thesis is most likely to be wrong?
Satellite companies provide the infrastructure for military reconnaissance and emergency communications. When the situation in the Middle East and Eastern Europe tightens, capital flows here. The open interest of the 39,000-lot contracts has not changed significantly, the funding rate is zero, and the long and short sides are temporarily balanced. This rally is not being driven by longs aggressively piling in.
The counterargument: If conflict expectations cool down, this kind of panic premium would unwind the fastest, and the stock price would give back gains. In the second-order view, funds would move from “safe-haven” targets back into more purely growth-oriented tech stocks.
Trading tag: #TradFi #链上美股 #ASTS
Where do you think this thesis is most likely to be wrong?
12

·
--
$ASTS is up nearly 6% in the past 24 hours, and the price on the screen has stalled at 66.48. This gain is quite eye-catching among tech ETF peers over the same period, but an old dog glanced at the contract data—more importantly, the funding rate: 0. Right now, neither the long nor the short side has to pay the other.
This zero funding rate is the most interesting signal at the moment. In on-chain U.S. stock perpetual futures contracts, it usually means the market has reached a temporary balance at a certain level. Prices are rising, but the funding rate hasn’t flipped positive, which suggests this pump wasn’t driven by a large amount of leveraged long positions chasing higher. Conversely, if shorts were massively adding bets on a drop here, the funding rate would drift toward negative. So, this is a bullish move without an obvious crowded direction. From the perspective of the M2 semiconductor/AI chain, such assets are often the targets of capital probing during narrative rotation, but the zero funding rate implies probing is heavy and main capital hasn’t made a clear statement yet.
My view is that $ASTS is currently in a window of a silent breakout. The price is up, yet the derivatives market is abnormally calm. There are two possible paths for how this structure evolves: one is that spot buying keeps coming, ultimately forcing shorts to take losses at higher levels and pushing the funding rate into positive territory—leading to a mild squeeze; the other is that spot buying weakens afterward and the price pulls back. Because long leverage isn’t heavy, there likely won’t be a large-scale chain liquidation—just a slow, downward drift.
The position size, 40490.69, by itself can’t tell whether it’s heavy or light, because it’s only the number of contracts and hasn’t been converted into a total USD value. But combining the zero funding rate and the price rise, my understanding is that the newly entered funds are more likely choosing spot or contracts with extremely low leverage. This isn’t a setup that’s “asking for a big headline.”
The strongest counterargument is this: maybe the calm isn’t balance at all—it’s simply waiting. A funding rate of zero is sometimes just the calm before the storm, meaning big capital is evaluating direction. Once they step in, the funding rate will be instantly broken. If tomorrow suddenly sees a sharp surge or plunge in the funding rate, then today’s judgment would be invalid. On the second-order effects: if the price keeps whipsawing within the current range, the most uncomfortable are the short-term shorts that have already built positions—they can’t earn time value (funding rate is 0) and must endure the psychological pressure of price rising. But if the price fails to break through for a long time, these shorts may escape from their losing positions, and that can increase selling pressure.
So my move is very clear: observe positions for now, don’t chase price or add leverage.
Trading tag: #BinanceFutures #TradFi #USDⓈM #ASTS #ASTSUSDT $ASTS
$ASTS is up nearly 6% in the past 24 hours, and the price on the screen has stalled at 66.48. This gain is quite eye-catching among tech ETF peers over the same period, but an old dog glanced at the contract data—more importantly, the funding rate: 0. Right now, neither the long nor the short side has to pay the other.
This zero funding rate is the most interesting signal at the moment. In on-chain U.S. stock perpetual futures contracts, it usually means the market has reached a temporary balance at a certain level. Prices are rising, but the funding rate hasn’t flipped positive, which suggests this pump wasn’t driven by a large amount of leveraged long positions chasing higher. Conversely, if shorts were massively adding bets on a drop here, the funding rate would drift toward negative. So, this is a bullish move without an obvious crowded direction. From the perspective of the M2 semiconductor/AI chain, such assets are often the targets of capital probing during narrative rotation, but the zero funding rate implies probing is heavy and main capital hasn’t made a clear statement yet.
My view is that $ASTS is currently in a window of a silent breakout. The price is up, yet the derivatives market is abnormally calm. There are two possible paths for how this structure evolves: one is that spot buying keeps coming, ultimately forcing shorts to take losses at higher levels and pushing the funding rate into positive territory—leading to a mild squeeze; the other is that spot buying weakens afterward and the price pulls back. Because long leverage isn’t heavy, there likely won’t be a large-scale chain liquidation—just a slow, downward drift.
The position size, 40490.69, by itself can’t tell whether it’s heavy or light, because it’s only the number of contracts and hasn’t been converted into a total USD value. But combining the zero funding rate and the price rise, my understanding is that the newly entered funds are more likely choosing spot or contracts with extremely low leverage. This isn’t a setup that’s “asking for a big headline.”
The strongest counterargument is this: maybe the calm isn’t balance at all—it’s simply waiting. A funding rate of zero is sometimes just the calm before the storm, meaning big capital is evaluating direction. Once they step in, the funding rate will be instantly broken. If tomorrow suddenly sees a sharp surge or plunge in the funding rate, then today’s judgment would be invalid. On the second-order effects: if the price keeps whipsawing within the current range, the most uncomfortable are the short-term shorts that have already built positions—they can’t earn time value (funding rate is 0) and must endure the psychological pressure of price rising. But if the price fails to break through for a long time, these shorts may escape from their losing positions, and that can increase selling pressure.
So my move is very clear: observe positions for now, don’t chase price or add leverage.
Trading tag: #BinanceFutures #TradFi #USDⓈM #ASTS #ASTSUSDT $ASTS
This zero funding rate is the most interesting signal at the moment. In on-chain U.S. stock perpetual futures contracts, it usually means the market has reached a temporary balance at a certain level. Prices are rising, but the funding rate hasn’t flipped positive, which suggests this pump wasn’t driven by a large amount of leveraged long positions chasing higher. Conversely, if shorts were massively adding bets on a drop here, the funding rate would drift toward negative. So, this is a bullish move without an obvious crowded direction. From the perspective of the M2 semiconductor/AI chain, such assets are often the targets of capital probing during narrative rotation, but the zero funding rate implies probing is heavy and main capital hasn’t made a clear statement yet.
My view is that $ASTS is currently in a window of a silent breakout. The price is up, yet the derivatives market is abnormally calm. There are two possible paths for how this structure evolves: one is that spot buying keeps coming, ultimately forcing shorts to take losses at higher levels and pushing the funding rate into positive territory—leading to a mild squeeze; the other is that spot buying weakens afterward and the price pulls back. Because long leverage isn’t heavy, there likely won’t be a large-scale chain liquidation—just a slow, downward drift.
The position size, 40490.69, by itself can’t tell whether it’s heavy or light, because it’s only the number of contracts and hasn’t been converted into a total USD value. But combining the zero funding rate and the price rise, my understanding is that the newly entered funds are more likely choosing spot or contracts with extremely low leverage. This isn’t a setup that’s “asking for a big headline.”
The strongest counterargument is this: maybe the calm isn’t balance at all—it’s simply waiting. A funding rate of zero is sometimes just the calm before the storm, meaning big capital is evaluating direction. Once they step in, the funding rate will be instantly broken. If tomorrow suddenly sees a sharp surge or plunge in the funding rate, then today’s judgment would be invalid. On the second-order effects: if the price keeps whipsawing within the current range, the most uncomfortable are the short-term shorts that have already built positions—they can’t earn time value (funding rate is 0) and must endure the psychological pressure of price rising. But if the price fails to break through for a long time, these shorts may escape from their losing positions, and that can increase selling pressure.
So my move is very clear: observe positions for now, don’t chase price or add leverage.
Trading tag: #BinanceFutures #TradFi #USDⓈM #ASTS #ASTSUSDT $ASTS
24
·
--
[M1_mag7]
The old dog glanced at $ASTS. Over the past 24 hours, it’s up 5.267%, trading at 65.96. This rally looks quite fierce, but funding of 0.00002175 is still positive—by the iron law, the longs are paying fees. Crowding is building. With no other comparable targets in the broader sector, this capital structure for a single coin suggests the pull-up is dominated by existing longs; costs are rising, and there’s a lack of fresh counterparty demand to step in and absorb the move. I assess that the risk of a short-term pullback outweighs the momentum for further upside.
Trading tag: #BinanceFutures #TradFi #USDⓈM #ASTS #ASTSUSDT $ASTS
[M1_mag7]
The old dog glanced at $ASTS . Over the past 24 hours, it’s up 5.267%, trading at 65.96. This rally looks quite fierce, but funding of 0.00002175 is still positive—by the iron law, the longs are paying fees. Crowding is building. With no other comparable targets in the broader sector, this capital structure for a single coin suggests the pull-up is dominated by existing longs; costs are rising, and there’s a lack of fresh counterparty demand to step in and absorb the move. I assess that the risk of a short-term pullback outweighs the momentum for further upside.
Trading tag: #BinanceFutures #TradFi #USDⓈM #ASTS #ASTSUSDT $ASTS
The old dog glanced at $ASTS . Over the past 24 hours, it’s up 5.267%, trading at 65.96. This rally looks quite fierce, but funding of 0.00002175 is still positive—by the iron law, the longs are paying fees. Crowding is building. With no other comparable targets in the broader sector, this capital structure for a single coin suggests the pull-up is dominated by existing longs; costs are rising, and there’s a lack of fresh counterparty demand to step in and absorb the move. I assess that the risk of a short-term pullback outweighs the momentum for further upside.
Trading tag: #BinanceFutures #TradFi #USDⓈM #ASTS #ASTSUSDT $ASTS
39
·
--
The old dog took a look at $ASTS’s contract market, and one figure really stood out: the funding rate was exactly 0.00000000, meaning neither longs nor shorts paid the other side a cent. The price was hovering around 63.33, up 1.393% over 24 hours, and open interest was fixed at 41,387.51 contracts. Put these three numbers together, and the picture is simple: price is edging up a bit, but leveraged capital is neither flooding in nor fleeing out; it’s just sitting still and waiting.
Looking at the M2_semi semiconductor/AI chain, the sector narrative has been hot for a while. But in terms of capital flow, $ASTS has temporarily stepped away from the sector’s linked storyline. It hasn’t followed the giants’ one-sided move; instead, it has formed an independent equilibrium. A funding rate back to zero is the key signal here. It shows that over the past period, longs and shorts have been locked in a tug-of-war to the point of exhaustion, with nearly identical holding costs on both sides. Neither side has been forced to reduce positions because of ongoing payments. The 41,387.51 open interest isn’t low, which means the positions are still there, but the zero funding rate also suggests these positions have temporarily reached a steady state, with no new, directional, high-leverage capital rushing in.
My view is: this is not the calm before a breakout, but more like a stalemate. The current price range and position structure leave both bulls and bears lacking the courage to launch a one-sided move. For an asset under the M2_semi narrative, the market is waiting for an external catalyst to break this micro-balance—such as a new move from a sector leader, or fresh orders or technical progress from $ASTS itself within the industry chain. Without that, it may continue to oscillate near 63 on shrinking volume.
On the other hand, the strongest counterargument is very simple: if this is just data noise, then tomorrow the funding rate will swing sharply positive or negative, and today’s observation becomes meaningless. After all, with only one day of data, the sample is too thin.
If the stalemate breaks next, will it be upward or downward? The second-order effect is that the longer the deadlock lasts, the more all the positions accumulated around 63 will become an accelerator once direction is chosen. If it breaks upward, short stop-losses will add fuel to the move; if it breaks downward, a chain of long liquidations will create a liquidity vacuum. The cost and pain will concentrate on one side.
The invalidation condition is clear: if within 24 hours $ASTS’s funding rate moves significantly away from zero, either positive or negative, and open interest increases noticeably along with it, then the balance has been broken by outside forces, capital has begun choosing sides, and my stalemate thesis fails.
Trading tag: #BinanceFutures #TradFi #USDⓈM #ASTS #ASTSUSDT $ASTS
The old dog took a look at $ASTS ’s contract market, and one figure really stood out: the funding rate was exactly 0.00000000, meaning neither longs nor shorts paid the other side a cent. The price was hovering around 63.33, up 1.393% over 24 hours, and open interest was fixed at 41,387.51 contracts. Put these three numbers together, and the picture is simple: price is edging up a bit, but leveraged capital is neither flooding in nor fleeing out; it’s just sitting still and waiting.
Looking at the M2_semi semiconductor/AI chain, the sector narrative has been hot for a while. But in terms of capital flow, $ASTS has temporarily stepped away from the sector’s linked storyline. It hasn’t followed the giants’ one-sided move; instead, it has formed an independent equilibrium. A funding rate back to zero is the key signal here. It shows that over the past period, longs and shorts have been locked in a tug-of-war to the point of exhaustion, with nearly identical holding costs on both sides. Neither side has been forced to reduce positions because of ongoing payments. The 41,387.51 open interest isn’t low, which means the positions are still there, but the zero funding rate also suggests these positions have temporarily reached a steady state, with no new, directional, high-leverage capital rushing in.
My view is: this is not the calm before a breakout, but more like a stalemate. The current price range and position structure leave both bulls and bears lacking the courage to launch a one-sided move. For an asset under the M2_semi narrative, the market is waiting for an external catalyst to break this micro-balance—such as a new move from a sector leader, or fresh orders or technical progress from $ASTS itself within the industry chain. Without that, it may continue to oscillate near 63 on shrinking volume.
On the other hand, the strongest counterargument is very simple: if this is just data noise, then tomorrow the funding rate will swing sharply positive or negative, and today’s observation becomes meaningless. After all, with only one day of data, the sample is too thin.
If the stalemate breaks next, will it be upward or downward? The second-order effect is that the longer the deadlock lasts, the more all the positions accumulated around 63 will become an accelerator once direction is chosen. If it breaks upward, short stop-losses will add fuel to the move; if it breaks downward, a chain of long liquidations will create a liquidity vacuum. The cost and pain will concentrate on one side.
The invalidation condition is clear: if within 24 hours $ASTS ’s funding rate moves significantly away from zero, either positive or negative, and open interest increases noticeably along with it, then the balance has been broken by outside forces, capital has begun choosing sides, and my stalemate thesis fails.
Trading tag: #BinanceFutures #TradFi #USDⓈM #ASTS #ASTSUSDT $ASTS
Looking at the M2_semi semiconductor/AI chain, the sector narrative has been hot for a while. But in terms of capital flow, $ASTS has temporarily stepped away from the sector’s linked storyline. It hasn’t followed the giants’ one-sided move; instead, it has formed an independent equilibrium. A funding rate back to zero is the key signal here. It shows that over the past period, longs and shorts have been locked in a tug-of-war to the point of exhaustion, with nearly identical holding costs on both sides. Neither side has been forced to reduce positions because of ongoing payments. The 41,387.51 open interest isn’t low, which means the positions are still there, but the zero funding rate also suggests these positions have temporarily reached a steady state, with no new, directional, high-leverage capital rushing in.
My view is: this is not the calm before a breakout, but more like a stalemate. The current price range and position structure leave both bulls and bears lacking the courage to launch a one-sided move. For an asset under the M2_semi narrative, the market is waiting for an external catalyst to break this micro-balance—such as a new move from a sector leader, or fresh orders or technical progress from $ASTS itself within the industry chain. Without that, it may continue to oscillate near 63 on shrinking volume.
On the other hand, the strongest counterargument is very simple: if this is just data noise, then tomorrow the funding rate will swing sharply positive or negative, and today’s observation becomes meaningless. After all, with only one day of data, the sample is too thin.
If the stalemate breaks next, will it be upward or downward? The second-order effect is that the longer the deadlock lasts, the more all the positions accumulated around 63 will become an accelerator once direction is chosen. If it breaks upward, short stop-losses will add fuel to the move; if it breaks downward, a chain of long liquidations will create a liquidity vacuum. The cost and pain will concentrate on one side.
The invalidation condition is clear: if within 24 hours $ASTS ’s funding rate moves significantly away from zero, either positive or negative, and open interest increases noticeably along with it, then the balance has been broken by outside forces, capital has begun choosing sides, and my stalemate thesis fails.
Trading tag: #BinanceFutures #TradFi #USDⓈM #ASTS #ASTSUSDT $ASTS
17

·
--
$ASTS 24 hours down 4.417%, current price 62.32, funding rate 0, open interest 42513.51. The price is sliding but longs and shorts are balanced, and the market is waiting for the direction of a political event.
Such consolidation is common in political trading. A funding rate of 0 means neither longs nor shorts are willing to make the first move, and open interest has not surged, indicating that large money is still on the sidelines watching. Once regulatory policy or fiscal news is released, the price could quickly break out.
The strongest counterargument is that the political event is delayed or turns out to be unremarkable, in which case the price may continue drifting lower. On a second-order basis, if arbitrage funds misjudge the direction, they may be forced into stop-loss liquidation, amplifying volatility. Failure condition: if the price continues to shrink in volume within the 60-65 range for three days, then my judgment fails and I switch to waiting. In terms of action, I am not chasing the downside or buying the dip now. If it breaks above 65 and open interest increases, I go long, stop loss at 62, take profit at 70, position size 10%. If it breaks below 60, I go short, stop loss at 63, take profit at 55, position size 5%.
Trading tag: #TradFi #链上美股 #ASTS
Where do you think this set of judgments is most likely to be wrong?
$ASTS 24 hours down 4.417%, current price 62.32, funding rate 0, open interest 42513.51. The price is sliding but longs and shorts are balanced, and the market is waiting for the direction of a political event.
Such consolidation is common in political trading. A funding rate of 0 means neither longs nor shorts are willing to make the first move, and open interest has not surged, indicating that large money is still on the sidelines watching. Once regulatory policy or fiscal news is released, the price could quickly break out.
The strongest counterargument is that the political event is delayed or turns out to be unremarkable, in which case the price may continue drifting lower. On a second-order basis, if arbitrage funds misjudge the direction, they may be forced into stop-loss liquidation, amplifying volatility. Failure condition: if the price continues to shrink in volume within the 60-65 range for three days, then my judgment fails and I switch to waiting. In terms of action, I am not chasing the downside or buying the dip now. If it breaks above 65 and open interest increases, I go long, stop loss at 62, take profit at 70, position size 10%. If it breaks below 60, I go short, stop loss at 63, take profit at 55, position size 5%.
Trading tag: #TradFi #链上美股 #ASTS
Where do you think this set of judgments is most likely to be wrong?
Such consolidation is common in political trading. A funding rate of 0 means neither longs nor shorts are willing to make the first move, and open interest has not surged, indicating that large money is still on the sidelines watching. Once regulatory policy or fiscal news is released, the price could quickly break out.
The strongest counterargument is that the political event is delayed or turns out to be unremarkable, in which case the price may continue drifting lower. On a second-order basis, if arbitrage funds misjudge the direction, they may be forced into stop-loss liquidation, amplifying volatility. Failure condition: if the price continues to shrink in volume within the 60-65 range for three days, then my judgment fails and I switch to waiting. In terms of action, I am not chasing the downside or buying the dip now. If it breaks above 65 and open interest increases, I go long, stop loss at 62, take profit at 70, position size 10%. If it breaks below 60, I go short, stop loss at 63, take profit at 55, position size 5%.
Trading tag: #TradFi #链上美股 #ASTS
Where do you think this set of judgments is most likely to be wrong?
·
--
$ASTS fell 4.417% over the past 24 hours, with the current price at 62.32. The funding rate is 0, indicating a balance between long and short funding costs.
When political uncertainty rises, capital tends to stay on the sidelines. As a TradFi on-chain asset, $ASTS is more sensitive to regulatory and election narratives. With funding at zero, it suggests neither leveraged longs nor shorts have built significant positions, and the market is waiting for a signal. OI is 42513.51; price is falling but open interest is not increasing, a typical structure of passive liquidation or new money being unwilling to enter.
The strongest counterargument is to interpret this as all bad news already priced in, meaning it should rebound after the drop. But funding and OI have not provided any aggressive signal: shorts have not built large positions, and longs have not stepped in to buy the dip. A second-order effect is that if political-risk events continue to intensify, these scattered leveraged traders will be forced to reduce positions, creating more concentrated downward pressure on price.
If the price cannot hold above 62, political uncertainty will turn into actual selling pressure. In terms of execution, I choose to try shorting around 62.3, set a stop loss at 63.8, take profit at 58.5, keep the position small, and use 2x leverage. The invalidation condition is that price reclaims 63 on strong volume and OI increases significantly; in that case, admit the mistake and exit.
Trading tag: #TradFi #链上美股 #ASTS
Where do you think this judgment is most likely wrong?
$ASTS fell 4.417% over the past 24 hours, with the current price at 62.32. The funding rate is 0, indicating a balance between long and short funding costs.
When political uncertainty rises, capital tends to stay on the sidelines. As a TradFi on-chain asset, $ASTS is more sensitive to regulatory and election narratives. With funding at zero, it suggests neither leveraged longs nor shorts have built significant positions, and the market is waiting for a signal. OI is 42513.51; price is falling but open interest is not increasing, a typical structure of passive liquidation or new money being unwilling to enter.
The strongest counterargument is to interpret this as all bad news already priced in, meaning it should rebound after the drop. But funding and OI have not provided any aggressive signal: shorts have not built large positions, and longs have not stepped in to buy the dip. A second-order effect is that if political-risk events continue to intensify, these scattered leveraged traders will be forced to reduce positions, creating more concentrated downward pressure on price.
If the price cannot hold above 62, political uncertainty will turn into actual selling pressure. In terms of execution, I choose to try shorting around 62.3, set a stop loss at 63.8, take profit at 58.5, keep the position small, and use 2x leverage. The invalidation condition is that price reclaims 63 on strong volume and OI increases significantly; in that case, admit the mistake and exit.
Trading tag: #TradFi #链上美股 #ASTS
Where do you think this judgment is most likely wrong?
When political uncertainty rises, capital tends to stay on the sidelines. As a TradFi on-chain asset, $ASTS is more sensitive to regulatory and election narratives. With funding at zero, it suggests neither leveraged longs nor shorts have built significant positions, and the market is waiting for a signal. OI is 42513.51; price is falling but open interest is not increasing, a typical structure of passive liquidation or new money being unwilling to enter.
The strongest counterargument is to interpret this as all bad news already priced in, meaning it should rebound after the drop. But funding and OI have not provided any aggressive signal: shorts have not built large positions, and longs have not stepped in to buy the dip. A second-order effect is that if political-risk events continue to intensify, these scattered leveraged traders will be forced to reduce positions, creating more concentrated downward pressure on price.
If the price cannot hold above 62, political uncertainty will turn into actual selling pressure. In terms of execution, I choose to try shorting around 62.3, set a stop loss at 63.8, take profit at 58.5, keep the position small, and use 2x leverage. The invalidation condition is that price reclaims 63 on strong volume and OI increases significantly; in that case, admit the mistake and exit.
Trading tag: #TradFi #链上美股 #ASTS
Where do you think this judgment is most likely wrong?
36
·
--
$ASTS 24 hours down 4.417%, with the price stuck at 62.32. Funding rate has gone to zero, which is a key signal.
Why say politics? This thing is an on-chain U.S. stock contract, so it differs from spot logic. Traditional stocks fear policy black swans the most, such as a sudden tax hike or tighter regulation before an election. A funding rate of 0 means longs and shorts are temporarily balanced, and no one is willing to pay the other side. This calm is usually interpreted as wait-and-see, but it can also be the calm before the storm, with big money waiting for a clear political signal before making a bet. Open interest of 42513 contracts is not low; there are quite a few people trapped in positions or lying in wait, just waiting for direction.
My view is that this balance will be broken. Once there is a clear policy negative or positive, a one-sided move will come quickly. If bulls bet correctly on a policy shift, they can directly blow up the shorts; and vice versa. Chasing shorts now makes no sense, as the price has already fallen once; chasing longs also has no catalyst yet.
I will place limit orders and wait for a breakout. I’m bearish on direction, but I won’t take the short side proactively; I’ll wait for it to break below the key level on its own and then follow. Parameters: short position, 2x leverage, stop loss at 63.5 (the previous small range), take profit at 58. Position size is only 5% of total capital; for this kind of politically driven volatility, the first trade must be a small trial position.
Trading tag: #TradFi #链上美股 #ASTS
Where do you think this set of judgments is most likely to be wrong?
$ASTS 24 hours down 4.417%, with the price stuck at 62.32. Funding rate has gone to zero, which is a key signal.
Why say politics? This thing is an on-chain U.S. stock contract, so it differs from spot logic. Traditional stocks fear policy black swans the most, such as a sudden tax hike or tighter regulation before an election. A funding rate of 0 means longs and shorts are temporarily balanced, and no one is willing to pay the other side. This calm is usually interpreted as wait-and-see, but it can also be the calm before the storm, with big money waiting for a clear political signal before making a bet. Open interest of 42513 contracts is not low; there are quite a few people trapped in positions or lying in wait, just waiting for direction.
My view is that this balance will be broken. Once there is a clear policy negative or positive, a one-sided move will come quickly. If bulls bet correctly on a policy shift, they can directly blow up the shorts; and vice versa. Chasing shorts now makes no sense, as the price has already fallen once; chasing longs also has no catalyst yet.
I will place limit orders and wait for a breakout. I’m bearish on direction, but I won’t take the short side proactively; I’ll wait for it to break below the key level on its own and then follow. Parameters: short position, 2x leverage, stop loss at 63.5 (the previous small range), take profit at 58. Position size is only 5% of total capital; for this kind of politically driven volatility, the first trade must be a small trial position.
Trading tag: #TradFi #链上美股 #ASTS
Where do you think this set of judgments is most likely to be wrong?
Why say politics? This thing is an on-chain U.S. stock contract, so it differs from spot logic. Traditional stocks fear policy black swans the most, such as a sudden tax hike or tighter regulation before an election. A funding rate of 0 means longs and shorts are temporarily balanced, and no one is willing to pay the other side. This calm is usually interpreted as wait-and-see, but it can also be the calm before the storm, with big money waiting for a clear political signal before making a bet. Open interest of 42513 contracts is not low; there are quite a few people trapped in positions or lying in wait, just waiting for direction.
My view is that this balance will be broken. Once there is a clear policy negative or positive, a one-sided move will come quickly. If bulls bet correctly on a policy shift, they can directly blow up the shorts; and vice versa. Chasing shorts now makes no sense, as the price has already fallen once; chasing longs also has no catalyst yet.
I will place limit orders and wait for a breakout. I’m bearish on direction, but I won’t take the short side proactively; I’ll wait for it to break below the key level on its own and then follow. Parameters: short position, 2x leverage, stop loss at 63.5 (the previous small range), take profit at 58. Position size is only 5% of total capital; for this kind of politically driven volatility, the first trade must be a small trial position.
Trading tag: #TradFi #链上美股 #ASTS
Where do you think this set of judgments is most likely to be wrong?
11

·
--
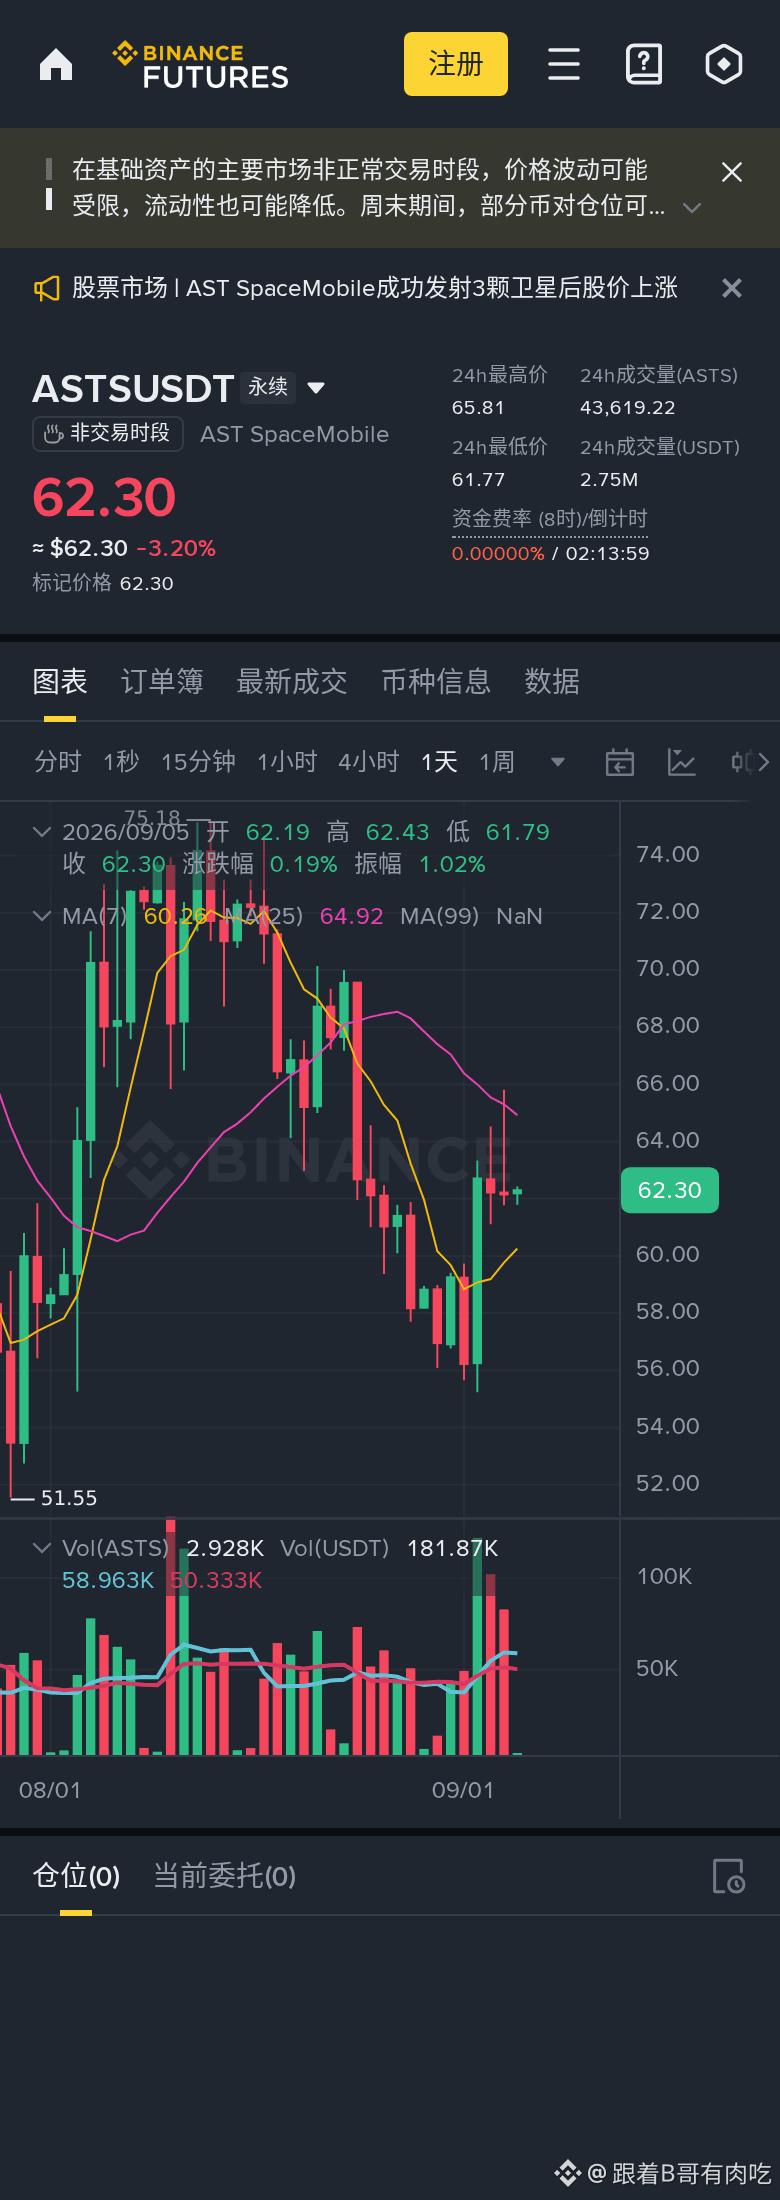
ASTS is at 62.30 now—an entry point or a trap?
A: I’m still missing one confirming candlestick for ASTS, so I’m not in a hurry.
B: Just do it, ASTS
ASTS is stuck in the 62.05~62.43 range, current price 62.30, RSI 48.9. I don’t bet on a one-way move in this kind of chop; I’ll only go long if 62.43 breaks out, and I’ll exit immediately if 62.05 breaks down. I’ll stay put in between.
Losing money taught me more than making money: after every stop-loss, reviewing the “why” is ten times more useful than guessing the next coin.
The above is just my personal pre-market thought process and does not constitute advice. Profit and loss are my own responsibility—follow your own plan.
#ASTS #trading diary
ASTS is at 62.30 now—an entry point or a trap?
A: I’m still missing one confirming candlestick for ASTS, so I’m not in a hurry.
B: Just do it, ASTS
ASTS is stuck in the 62.05~62.43 range, current price 62.30, RSI 48.9. I don’t bet on a one-way move in this kind of chop; I’ll only go long if 62.43 breaks out, and I’ll exit immediately if 62.05 breaks down. I’ll stay put in between.
Losing money taught me more than making money: after every stop-loss, reviewing the “why” is ten times more useful than guessing the next coin.
The above is just my personal pre-market thought process and does not constitute advice. Profit and loss are my own responsibility—follow your own plan.
#ASTS #trading diary
A: I’m still missing one confirming candlestick for ASTS, so I’m not in a hurry.
B: Just do it, ASTS
ASTS is stuck in the 62.05~62.43 range, current price 62.30, RSI 48.9. I don’t bet on a one-way move in this kind of chop; I’ll only go long if 62.43 breaks out, and I’ll exit immediately if 62.05 breaks down. I’ll stay put in between.
Losing money taught me more than making money: after every stop-loss, reviewing the “why” is ten times more useful than guessing the next coin.
The above is just my personal pre-market thought process and does not constitute advice. Profit and loss are my own responsibility—follow your own plan.
#ASTS #trading diary
15

·
--
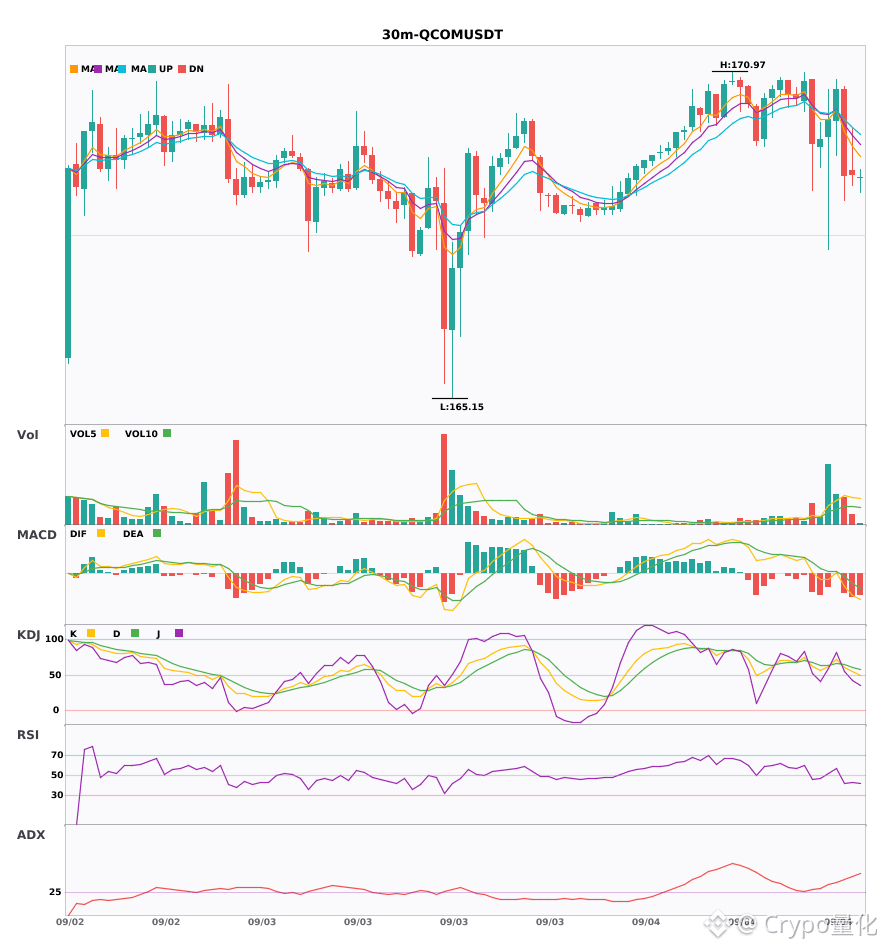
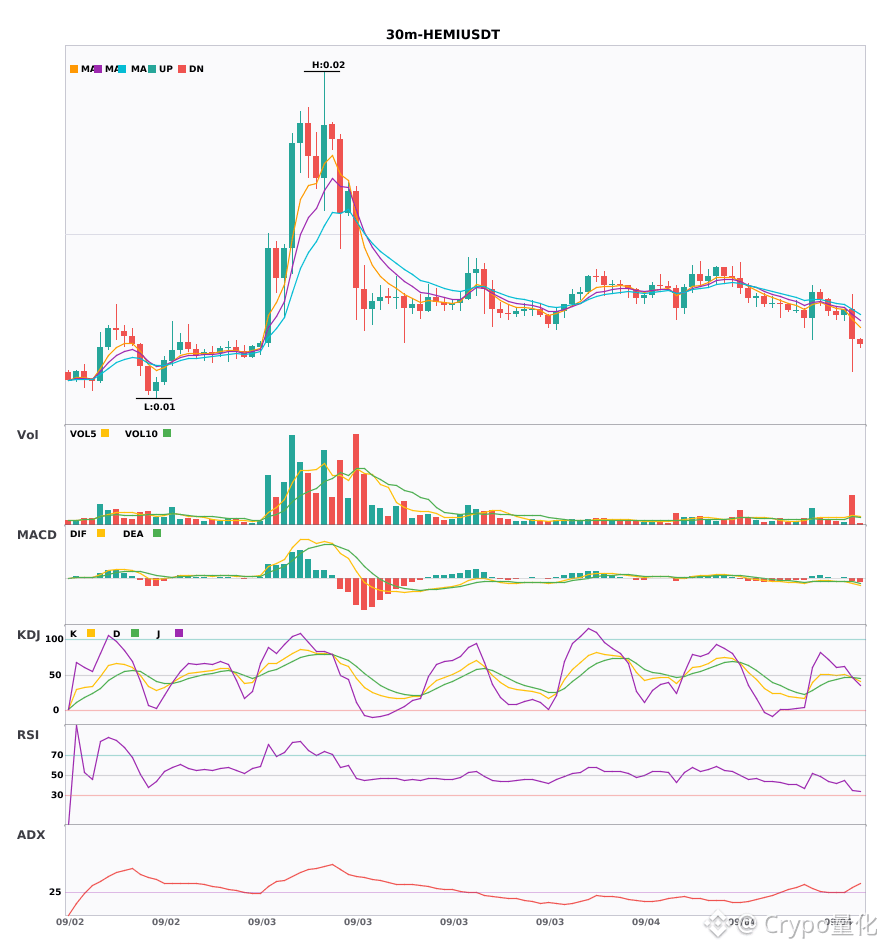
$ASTS/$QCOM/$HEMI 30 minutes triple-line downside, bearish moving average alignment 🔥
════════════════════
🟢 $ASTS 30 minutes bearish signal
⚠️Technicals: ADX 42, clear trending market; MACD death cross drops below the zero line, trend turns bearish; moving averages death cross, short-term turns bearish; volume expands 2.4x.
════════════════════
🟢 $QCOM 30 minutes bearish signal
⚠️Technicals: ADX jumps to 43, clearly a trending market. MACD DIF falls below the zero line, turning bearish. Moving averages 5, 8, and 13 are all sloping downward, a bearish alignment. KDJ also has a death cross, and it still looks likely to fall in the short term. Volume also increased by nearly 2x, everyone is running.
📢Market update: Binance will support cash dividend distribution for Qualcomm, PayPal, and Alphabet via bStocks.
════════════════════
🟢 $HEMI 30 minutes bearish signal
⚠️Technicals: ADX jumps to 33, clear trending market. MACD death cross below zero, bearish momentum accelerates. Moving averages diverge downward in a bearish formation, KDJ is weak and hovering around 46. Trading volume increases 3.6x, don't rush to buy the dip.
════════════════════
🔔 Follow for the latest market moves first-hand 🔔
#技术分析 #ASTS #QCOM #HEMI
📌 When trading, pay attention to whether the candlestick pattern matches.
$ASTS /$QCOM /$HEMI 30 minutes triple-line downside, bearish moving average alignment 🔥
════════════════════
🟢 $ASTS 30 minutes bearish signal
⚠️Technicals: ADX 42, clear trending market; MACD death cross drops below the zero line, trend turns bearish; moving averages death cross, short-term turns bearish; volume expands 2.4x.
════════════════════
🟢 $QCOM 30 minutes bearish signal
⚠️Technicals: ADX jumps to 43, clearly a trending market. MACD DIF falls below the zero line, turning bearish. Moving averages 5, 8, and 13 are all sloping downward, a bearish alignment. KDJ also has a death cross, and it still looks likely to fall in the short term. Volume also increased by nearly 2x, everyone is running.
📢Market update: Binance will support cash dividend distribution for Qualcomm, PayPal, and Alphabet via bStocks.
════════════════════
🟢 $HEMI 30 minutes bearish signal
⚠️Technicals: ADX jumps to 33, clear trending market. MACD death cross below zero, bearish momentum accelerates. Moving averages diverge downward in a bearish formation, KDJ is weak and hovering around 46. Trading volume increases 3.6x, don't rush to buy the dip.
════════════════════
🔔 Follow for the latest market moves first-hand 🔔
#技术分析 #ASTS #QCOM #HEMI
📌 When trading, pay attention to whether the candlestick pattern matches.
════════════════════
🟢 $ASTS 30 minutes bearish signal
⚠️Technicals: ADX 42, clear trending market; MACD death cross drops below the zero line, trend turns bearish; moving averages death cross, short-term turns bearish; volume expands 2.4x.
════════════════════
🟢 $QCOM 30 minutes bearish signal
⚠️Technicals: ADX jumps to 43, clearly a trending market. MACD DIF falls below the zero line, turning bearish. Moving averages 5, 8, and 13 are all sloping downward, a bearish alignment. KDJ also has a death cross, and it still looks likely to fall in the short term. Volume also increased by nearly 2x, everyone is running.
📢Market update: Binance will support cash dividend distribution for Qualcomm, PayPal, and Alphabet via bStocks.
════════════════════
🟢 $HEMI 30 minutes bearish signal
⚠️Technicals: ADX jumps to 33, clear trending market. MACD death cross below zero, bearish momentum accelerates. Moving averages diverge downward in a bearish formation, KDJ is weak and hovering around 46. Trading volume increases 3.6x, don't rush to buy the dip.
════════════════════
🔔 Follow for the latest market moves first-hand 🔔
#技术分析 #ASTS #QCOM #HEMI
📌 When trading, pay attention to whether the candlestick pattern matches.
217

$ASTSB
🛰️ ASTSB is moving!
📈 +9.55%
🎯 Target: $68 → $72
💡 Pro Tip: Momentum strong ho sakta hai, but entries ko chase mat karo.
#ASTS #Crypto #USWeeklyInitialJoblessClaimsRiseTo206000 #USGainsControlOfVenezuelanOilFields #CFTCScrutinizesPredictionMarketAffiliates
$ASTSB
🛰️ ASTSB is moving!
📈 +9.55%
🎯 Target: $68 → $72
💡 Pro Tip: Momentum strong ho sakta hai, but entries ko chase mat karo.
#ASTS #Crypto #USWeeklyInitialJoblessClaimsRiseTo206000 #USGainsControlOfVenezuelanOilFields #CFTCScrutinizesPredictionMarketAffiliates
🛰️ ASTSB is moving!
📈 +9.55%
🎯 Target: $68 → $72
💡 Pro Tip: Momentum strong ho sakta hai, but entries ko chase mat karo.
#ASTS #Crypto #USWeeklyInitialJoblessClaimsRiseTo206000 #USGainsControlOfVenezuelanOilFields #CFTCScrutinizesPredictionMarketAffiliates
49

·
--
Bullish
$ASTS
{future}(ASTSUSDT)
Price action is testing overhead resistance, trading around 64.32 (+15.46%). Looking for Short setups on exhaustion.
EP
64.32 - 66.89
TP
61.10
57.24
52.74
SL
70.75
Price action is pushing into potential resistance following a quick expansion move. Fading buying volume near local peaks signals momentum cooling off, opening space for a pullback toward lower demand levels.
Let's go #ASTS
$EDGE
{future}(EDGEUSDT)
$USELESS
{future}(USELESSUSDT)
$ASTS
Price action is testing overhead resistance, trading around 64.32 (+15.46%). Looking for Short setups on exhaustion.
EP
64.32 - 66.89
TP
61.10
57.24
52.74
SL
70.75
Price action is pushing into potential resistance following a quick expansion move. Fading buying volume near local peaks signals momentum cooling off, opening space for a pullback toward lower demand levels.
Let's go #ASTS
$EDGE
$USELESS
Price action is testing overhead resistance, trading around 64.32 (+15.46%). Looking for Short setups on exhaustion.
EP
64.32 - 66.89
TP
61.10
57.24
52.74
SL
70.75
Price action is pushing into potential resistance following a quick expansion move. Fading buying volume near local peaks signals momentum cooling off, opening space for a pullback toward lower demand levels.
Let's go #ASTS
$EDGE
$USELESS
38

·
--
Bullish
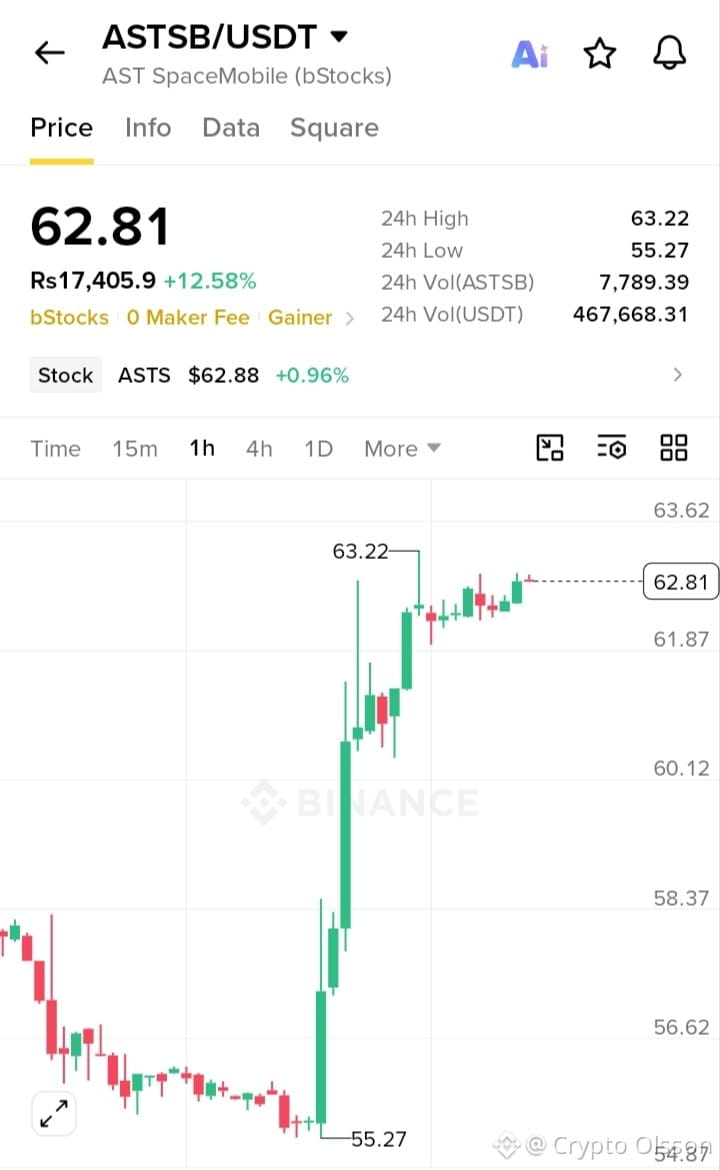
🚀 $ASTSB LONG SETUP — Momentum Watch!
$ASTSB /USDT 🟢 LONG
Entry: 61.80 – 62.50
TP1: 64.50
TP2: 67.00
TP3: 70.00
SL: 58.80
Strong momentum after +12% move. Manage risk and avoid chasing the breakout. 📈
#ASTS #ASTSB #BinanceSquare
$ASTSB
{spot}(ASTSBUSDT)
🚀 $ASTSB LONG SETUP — Momentum Watch!
$ASTSB /USDT 🟢 LONG
Entry: 61.80 – 62.50
TP1: 64.50
TP2: 67.00
TP3: 70.00
SL: 58.80
Strong momentum after +12% move. Manage risk and avoid chasing the breakout. 📈
#ASTS #ASTSB #BinanceSquare
$ASTSB
$ASTSB /USDT 🟢 LONG
Entry: 61.80 – 62.50
TP1: 64.50
TP2: 67.00
TP3: 70.00
SL: 58.80
Strong momentum after +12% move. Manage risk and avoid chasing the breakout. 📈
#ASTS #ASTSB #BinanceSquare
$ASTSB
1
348

·
--
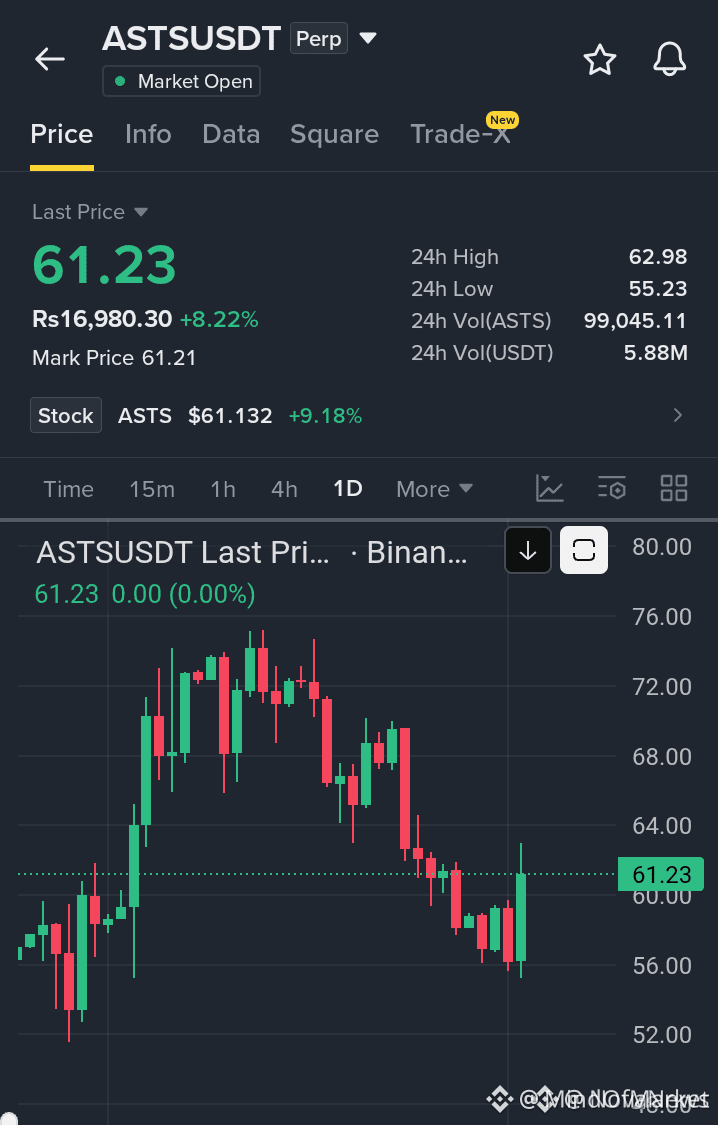
🚨 $ASTS SHIFTS MARKET STRUCTURE WITH AN 8% IMPULSE FROM LOCAL DEMAND! 📈
Target: 74.50 🚀
📌 Smart money absorbed seller pressure at the local bottom, launching an aggressive 8% expansion that confirms a clear bullish market structure shift. 🔍 Institutional accumulation is visible on lower timeframes as buyers reclaim structural control, setting up a high-probability swing back toward previous swing highs.
⚡ The fair value gap above offers a clean runway for continuation as volume begins to back this momentum. 💬 Will you ride this structural reversal now or wait for a discounted retest of the order block? 👇
⚠️ Not financial advice. Always manage your risk. 🛡️
🏷️ #ASTS #BullishReversal #MarketStructure #Crypto #Trading
🎯 🦈
🚨 $ASTS SHIFTS MARKET STRUCTURE WITH AN 8% IMPULSE FROM LOCAL DEMAND! 📈
Target: 74.50 🚀
📌 Smart money absorbed seller pressure at the local bottom, launching an aggressive 8% expansion that confirms a clear bullish market structure shift. 🔍 Institutional accumulation is visible on lower timeframes as buyers reclaim structural control, setting up a high-probability swing back toward previous swing highs.
⚡ The fair value gap above offers a clean runway for continuation as volume begins to back this momentum. 💬 Will you ride this structural reversal now or wait for a discounted retest of the order block? 👇
⚠️ Not financial advice. Always manage your risk. 🛡️
🏷️ #ASTS #BullishReversal #MarketStructure #Crypto #Trading
🎯 🦈
Target: 74.50 🚀
📌 Smart money absorbed seller pressure at the local bottom, launching an aggressive 8% expansion that confirms a clear bullish market structure shift. 🔍 Institutional accumulation is visible on lower timeframes as buyers reclaim structural control, setting up a high-probability swing back toward previous swing highs.
⚡ The fair value gap above offers a clean runway for continuation as volume begins to back this momentum. 💬 Will you ride this structural reversal now or wait for a discounted retest of the order block? 👇
⚠️ Not financial advice. Always manage your risk. 🛡️
🏷️ #ASTS #BullishReversal #MarketStructure #Crypto #Trading
🎯 🦈
71

·
--
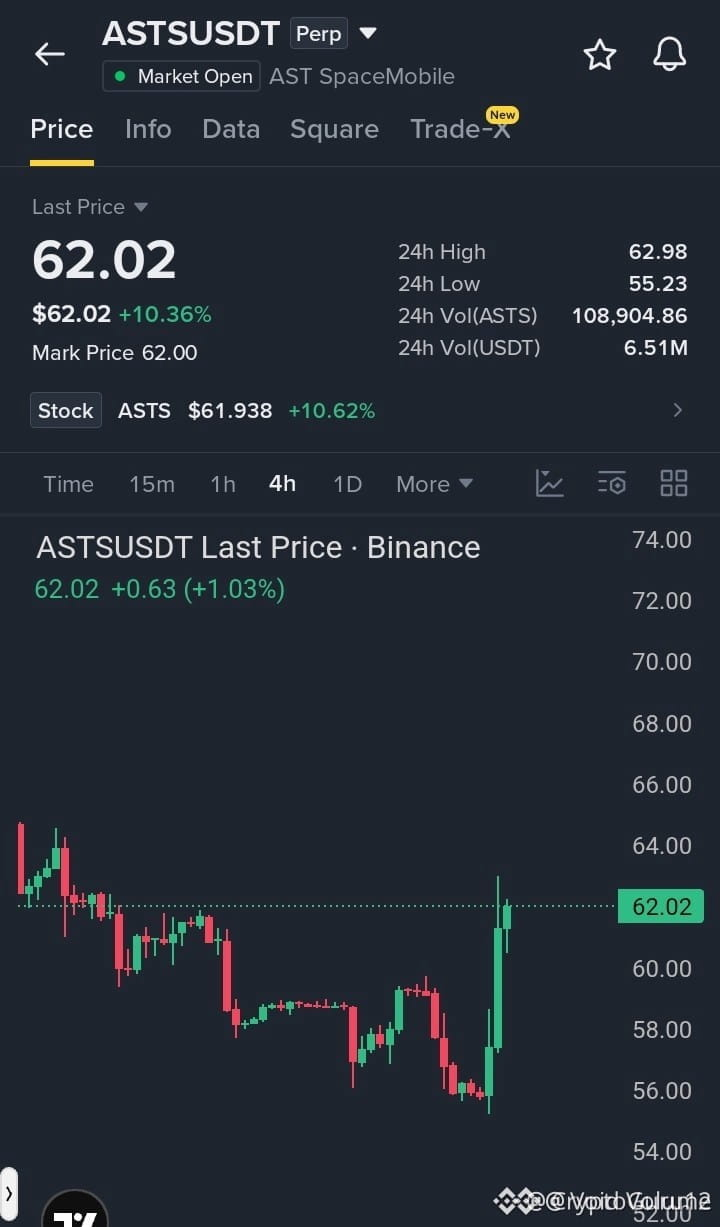
🚨 $ASTS PREPARES FOR LIQUIDITY BREAKOUT AS $63 RESISTANCE DECISION ZONE NEARS! ⚡
Entry: 61.40 - 62.00 ⚡
Target: 62.70 - 63.50 🚀
Stop Loss: 60.70 ⚠️
After executing a clean liquidity sweep at the $56 structural demand zone, $ASTS reclaimed $60 with aggressive 4H order flow. Price is now holding structural support around $62, actively absorbing overhead supply right beneath the key $62.98–$63.00 decision barrier. 📊
A decisive candle acceptance above $63.00 validates further upside continuation. Profit targets remain tight to lock in gains efficiently following this high-velocity initial leg, while $AKE and $TUT display similar technical alignment across lower timeframes. 🔍
💬 Are you positioning inside this consolidation zone or waiting for the $63.00 breakout confirmation? 👇
⚠️ Not financial advice. Always manage your risk. 🛡️
🏷️ #ASTS #AKE #TUT #Breakout #Crypto
🔥 ⚡
🚨 $ASTS PREPARES FOR LIQUIDITY BREAKOUT AS $63 RESISTANCE DECISION ZONE NEARS! ⚡
Entry: 61.40 - 62.00 ⚡
Target: 62.70 - 63.50 🚀
Stop Loss: 60.70 ⚠️
After executing a clean liquidity sweep at the $56 structural demand zone, $ASTS reclaimed $60 with aggressive 4H order flow. Price is now holding structural support around $62, actively absorbing overhead supply right beneath the key $62.98–$63.00 decision barrier. 📊
A decisive candle acceptance above $63.00 validates further upside continuation. Profit targets remain tight to lock in gains efficiently following this high-velocity initial leg, while $AKE and $TUT display similar technical alignment across lower timeframes. 🔍
💬 Are you positioning inside this consolidation zone or waiting for the $63.00 breakout confirmation? 👇
⚠️ Not financial advice. Always manage your risk. 🛡️
🏷️ #ASTS #AKE #TUT #Breakout #Crypto
🔥 ⚡
Entry: 61.40 - 62.00 ⚡
Target: 62.70 - 63.50 🚀
Stop Loss: 60.70 ⚠️
After executing a clean liquidity sweep at the $56 structural demand zone, $ASTS reclaimed $60 with aggressive 4H order flow. Price is now holding structural support around $62, actively absorbing overhead supply right beneath the key $62.98–$63.00 decision barrier. 📊
A decisive candle acceptance above $63.00 validates further upside continuation. Profit targets remain tight to lock in gains efficiently following this high-velocity initial leg, while $AKE and $TUT display similar technical alignment across lower timeframes. 🔍
💬 Are you positioning inside this consolidation zone or waiting for the $63.00 breakout confirmation? 👇
⚠️ Not financial advice. Always manage your risk. 🛡️
🏷️ #ASTS #AKE #TUT #Breakout #Crypto
🔥 ⚡
50

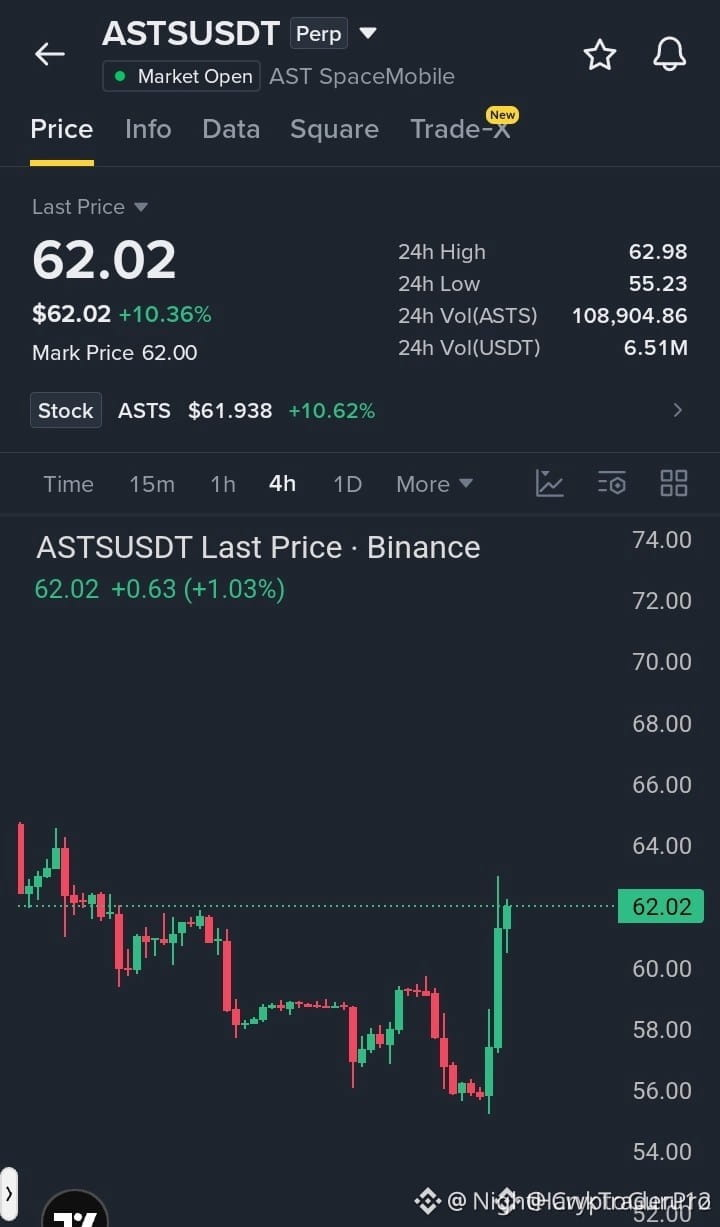
⚡ $ASTS SNAPS OUT OF $56 SUPPORT AS BREAKOUT PRESSURE BUILDS TOWARD $63! 💥
Entry: 61.40 - 62.00 ⚡
Target: 62.70 - 63.50 🚀
Stop Loss: 60.70 ⚠️
After a sharp push off the $56 support floor, $ASTS reclaimed $60 with explosive 4H momentum and is now coiling right under the critical $62.98–$63.00 resistance wall. 📊 Aggressive buyers are defense-bidding every shallow dip around $62, signaling order flow is shifting heavily in favor of a breakout expansion.
💡 A clean candle close above $63.00 clears the runway for swift continuation. 🔍 Because velocity was high on the initial impulse, keeping targets tight allows us to bank profit efficiently as price presses into supply. 💬 Are you front-running the $63 breakout or waiting for a confirmed candle close above resistance? 👇
⚠️ Not financial advice. Always manage your risk. 🛡️
🏷️ #ASTS #LongSetup #Breakout #Crypto
⚡ 🐂
⚡ $ASTS SNAPS OUT OF $56 SUPPORT AS BREAKOUT PRESSURE BUILDS TOWARD $63! 💥
Entry: 61.40 - 62.00 ⚡
Target: 62.70 - 63.50 🚀
Stop Loss: 60.70 ⚠️
After a sharp push off the $56 support floor, $ASTS reclaimed $60 with explosive 4H momentum and is now coiling right under the critical $62.98–$63.00 resistance wall. 📊 Aggressive buyers are defense-bidding every shallow dip around $62, signaling order flow is shifting heavily in favor of a breakout expansion.
💡 A clean candle close above $63.00 clears the runway for swift continuation. 🔍 Because velocity was high on the initial impulse, keeping targets tight allows us to bank profit efficiently as price presses into supply. 💬 Are you front-running the $63 breakout or waiting for a confirmed candle close above resistance? 👇
⚠️ Not financial advice. Always manage your risk. 🛡️
🏷️ #ASTS #LongSetup #Breakout #Crypto
⚡ 🐂
Entry: 61.40 - 62.00 ⚡
Target: 62.70 - 63.50 🚀
Stop Loss: 60.70 ⚠️
After a sharp push off the $56 support floor, $ASTS reclaimed $60 with explosive 4H momentum and is now coiling right under the critical $62.98–$63.00 resistance wall. 📊 Aggressive buyers are defense-bidding every shallow dip around $62, signaling order flow is shifting heavily in favor of a breakout expansion.
💡 A clean candle close above $63.00 clears the runway for swift continuation. 🔍 Because velocity was high on the initial impulse, keeping targets tight allows us to bank profit efficiently as price presses into supply. 💬 Are you front-running the $63 breakout or waiting for a confirmed candle close above resistance? 👇
⚠️ Not financial advice. Always manage your risk. 🛡️
🏷️ #ASTS #LongSetup #Breakout #Crypto
⚡ 🐂
84

·
--
Bullish
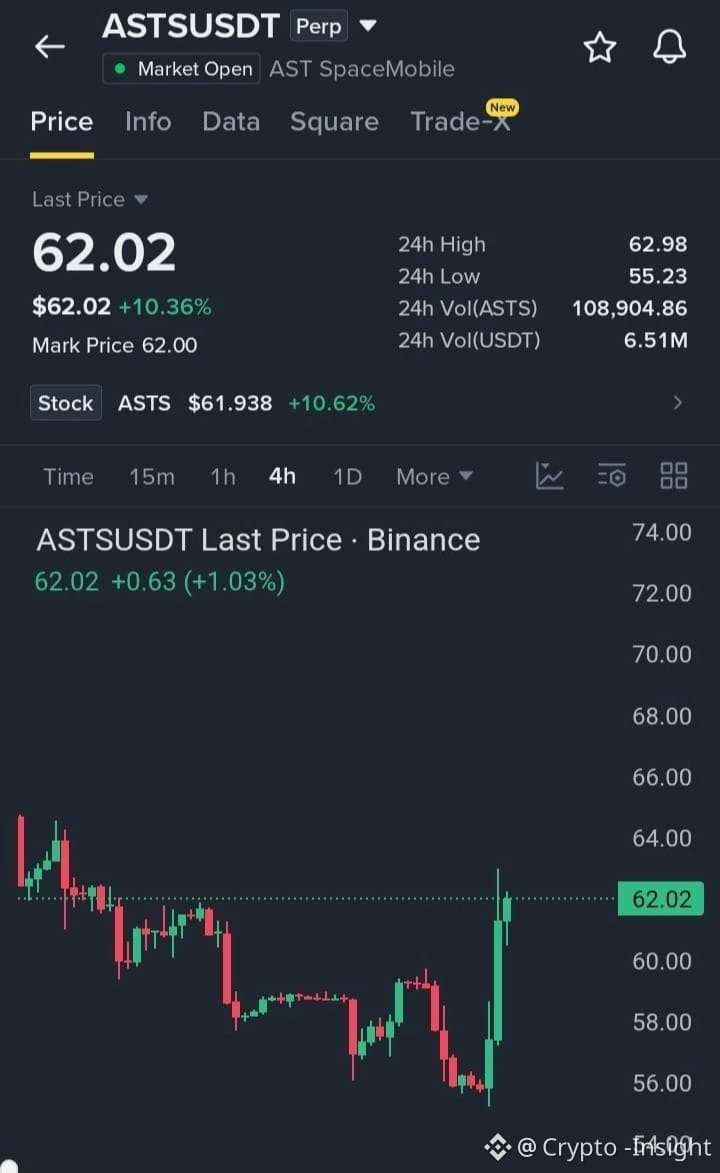
Sharp Bullish Spurt On $ASTS Pay Attention To This…!!
#ASTS is demonstrating strong bullish momentum following a quick vertical spike from its 55.23 low zone pushing the price back up toward 62.02 buyers stepped in aggressively to defend lower levels and reverse the short-term weakness if this upward drive holds the next key targets to watch are 64.00 and 66.00 while 58.00 remains the key support zone$TUT
{future}(TUTUSDT)
$AKE
{alpha}(560x2c3a8ee94ddd97244a93bc48298f97d2c412f7db)
Sharp Bullish Spurt On $ASTS Pay Attention To This…!!
#ASTS is demonstrating strong bullish momentum following a quick vertical spike from its 55.23 low zone pushing the price back up toward 62.02 buyers stepped in aggressively to defend lower levels and reverse the short-term weakness if this upward drive holds the next key targets to watch are 64.00 and 66.00 while 58.00 remains the key support zone$TUT
$AKE
#ASTS is demonstrating strong bullish momentum following a quick vertical spike from its 55.23 low zone pushing the price back up toward 62.02 buyers stepped in aggressively to defend lower levels and reverse the short-term weakness if this upward drive holds the next key targets to watch are 64.00 and 66.00 while 58.00 remains the key support zone$TUT
$AKE
583
·
--
$ASTS 24 hours deadlift 14.48%. The old dog glanced at the data—the funding rate is positive, 0.00005. This means longs are paying shorts; the capital pushing the move has position-carrying costs, so it’s not the healthiest price-and-volume setup.
More importantly, OI is 42400, and the price is 63.57. When price rises and funding is positive at the same time, it usually isn’t fresh new longs eagerly opening positions. It’s more likely that existing shorts are being forced to close or are being locked, getting squeezed up.
Trading tag: #BinanceFutures #TradFi #USDⓈM #ASTS #ASTSUSDT $ASTS
$ASTS 24 hours deadlift 14.48%. The old dog glanced at the data—the funding rate is positive, 0.00005. This means longs are paying shorts; the capital pushing the move has position-carrying costs, so it’s not the healthiest price-and-volume setup.
More importantly, OI is 42400, and the price is 63.57. When price rises and funding is positive at the same time, it usually isn’t fresh new longs eagerly opening positions. It’s more likely that existing shorts are being forced to close or are being locked, getting squeezed up.
Trading tag: #BinanceFutures #TradFi #USDⓈM #ASTS #ASTSUSDT $ASTS
More importantly, OI is 42400, and the price is 63.57. When price rises and funding is positive at the same time, it usually isn’t fresh new longs eagerly opening positions. It’s more likely that existing shorts are being forced to close or are being locked, getting squeezed up.
Trading tag: #BinanceFutures #TradFi #USDⓈM #ASTS #ASTSUSDT $ASTS
45
Log in to explore more content
Join global crypto users on Binance Square
⚡️ Get latest and useful information about crypto.
💬 Trusted by the world’s largest crypto exchange.
👍 Discover real insights from verified creators.
Email / Phone number
Trending Topics
1
#AppleDebutsFoldablePhone
4,593 views
124 Discussing
2
#US10YTreasuryYieldHitsHighestSinceNov2023
8,381 views
177 Discussing
3
#USTreasuryToBuyBackUpTo$6BLongDatedDebt
9,599 views
131 Discussing
4
#BitcoinSurpasses$79K
56,889 views
253 Discussing
5
#BrentCrudeTops$100
112,040 views
382 Discussing
6
#USADPWeeklyEmploymentRises12000
88,107 views
1,101 Discussing
7
#BankOfAmericaGroupPilotsUSBDCStablecoin
65,654 views
880 Discussing
8
#RippleLobbiesToAdvanceCLARITYActVote
99,104 views
1,152 Discussing
9
#GrayscaleZcashETFTops$500M
14,474 views
124 Discussing
10
#LAPTOPFoundationXAccountSuspended
5,406 views
91 Discussing