
#amandabella
amandabella
26,181 views
612 Discussing
Hot
Latest

·
--
#CLARITYActSenateVoteDelayedPastRecess
BITCOIN HOLDS $64,964 While Senate Sleeps 💤🚀
BREAKING: CLARITY Act DELAYED Past Recess - Senate needs 60 votes, has only 53.
Capitol in storm, Bitcoin rocket still flying!
I'm AMANDA BELLA and I ask you:
SELL OR BUY? VOTE NOW 👇
Comment SELL or BUY - I will reply to everyone!
— AMANDA BELLA
#CLARITYActSenateVoteDelayedPastRecess #BTC☀️ #AMANDABELLA #BinanceSquare
#CLARITYActSenateVoteDelayedPastRecess
BITCOIN HOLDS $64,964 While Senate Sleeps 💤🚀
BREAKING: CLARITY Act DELAYED Past Recess - Senate needs 60 votes, has only 53.
Capitol in storm, Bitcoin rocket still flying!
I'm AMANDA BELLA and I ask you:
SELL OR BUY? VOTE NOW 👇
Comment SELL or BUY - I will reply to everyone!
— AMANDA BELLA
#CLARITYActSenateVoteDelayedPastRecess #BTC☀️ #AMANDABELLA #BinanceSquare
BITCOIN HOLDS $64,964 While Senate Sleeps 💤🚀
BREAKING: CLARITY Act DELAYED Past Recess - Senate needs 60 votes, has only 53.
Capitol in storm, Bitcoin rocket still flying!
I'm AMANDA BELLA and I ask you:
SELL OR BUY? VOTE NOW 👇
Comment SELL or BUY - I will reply to everyone!
— AMANDA BELLA
#CLARITYActSenateVoteDelayedPastRecess #BTC☀️ #AMANDABELLA #BinanceSquare

3
82
·
--
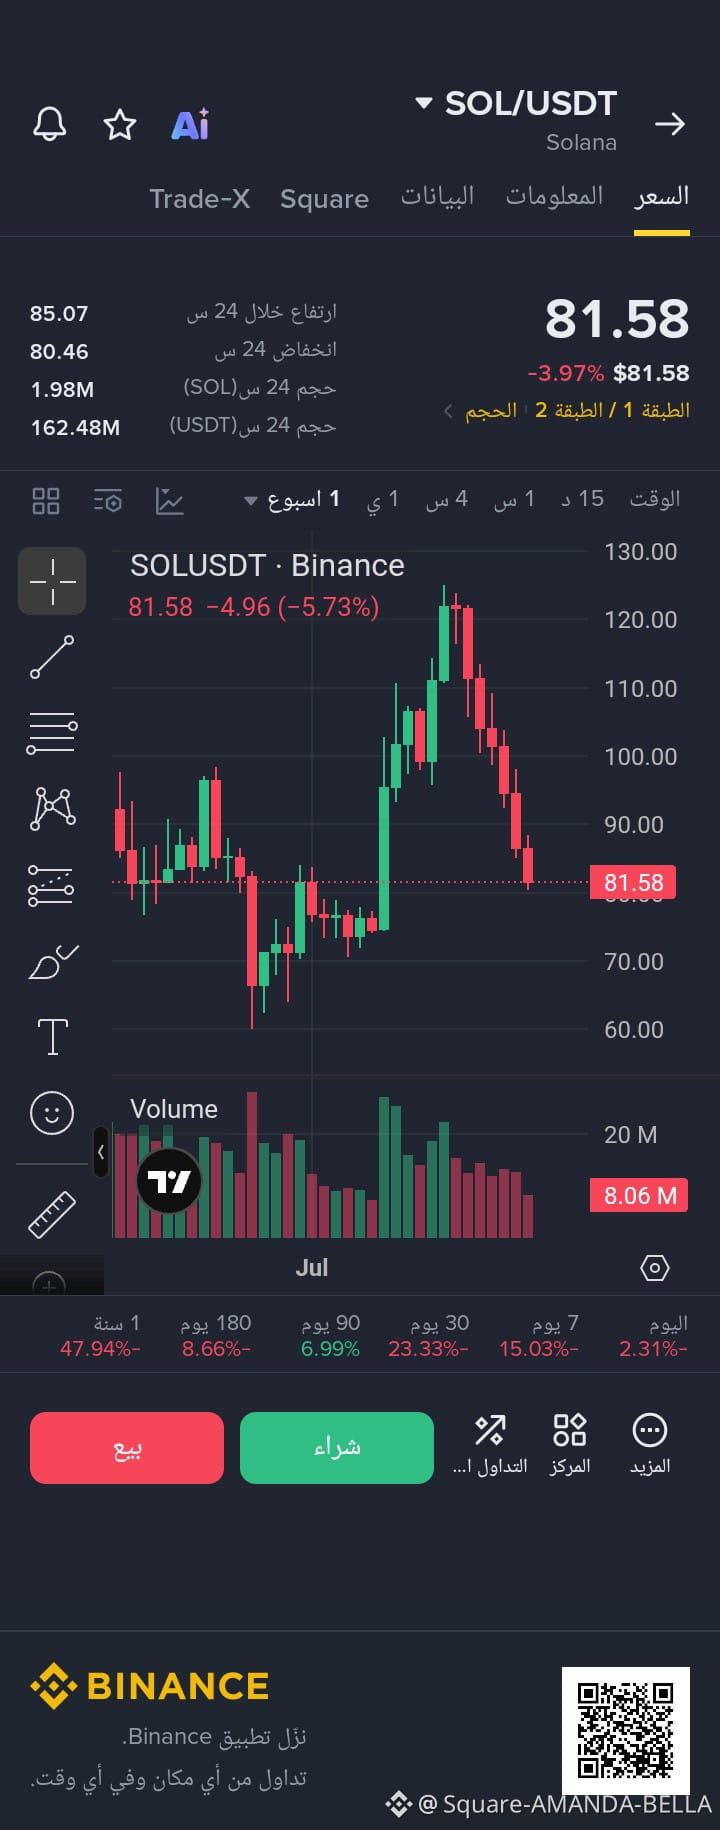
$SOL
{future}(SOLUSDT)
🔥🔥SOL plunges from $126 to $81... Have we hit the bottom, or is the bleeding still going?🔥🔥
Current price: $81.58
A violent drop from the peak of $126 to **$81** means Solana has lost more than 35% in a short time, and selling pressure remains strong.
We are now at a very important zone: $80–$82. This zone was previously strong support, and a break below it on a weekly candle would open the door to further declines. But if the price holds above it, the rebound could be quick and strong because selling has reached an oversold level.
Key levels:
Support: $80.46 (24h low), then $80, then $74
Resistance: $85.07 (24h high), then $90, then $100
Trading plan:
1. Buy scenario (quick trade):
Entry: $80.5–$82
Stop loss: daily candle close below $78
Target 1: $85
Target 2: $90
Target 3: $98–$100
2. Sell scenario:
If it breaks below $80 and holds there, do not buy. Selling pressure will intensify, with the next target at $74, then $68.
#sol板块
#AMANDABELLA
#USJoblessClaimsRise
#MSCIRemovalMayCurbStrategy’sBitcoinBuying
#CoreWeaveJumps10%On168%RevenueGrowth
$SOL
🔥🔥SOL plunges from $126 to $81... Have we hit the bottom, or is the bleeding still going?🔥🔥
Current price: $81.58
A violent drop from the peak of $126 to **$81** means Solana has lost more than 35% in a short time, and selling pressure remains strong.
We are now at a very important zone: $80–$82. This zone was previously strong support, and a break below it on a weekly candle would open the door to further declines. But if the price holds above it, the rebound could be quick and strong because selling has reached an oversold level.
Key levels:
Support: $80.46 (24h low), then $80, then $74
Resistance: $85.07 (24h high), then $90, then $100
Trading plan:
1. Buy scenario (quick trade):
Entry: $80.5–$82
Stop loss: daily candle close below $78
Target 1: $85
Target 2: $90
Target 3: $98–$100
2. Sell scenario:
If it breaks below $80 and holds there, do not buy. Selling pressure will intensify, with the next target at $74, then $68.
#sol板块
#AMANDABELLA
#USJoblessClaimsRise
#MSCIRemovalMayCurbStrategy’sBitcoinBuying
#CoreWeaveJumps10%On168%RevenueGrowth
🔥🔥SOL plunges from $126 to $81... Have we hit the bottom, or is the bleeding still going?🔥🔥
Current price: $81.58
A violent drop from the peak of $126 to **$81** means Solana has lost more than 35% in a short time, and selling pressure remains strong.
We are now at a very important zone: $80–$82. This zone was previously strong support, and a break below it on a weekly candle would open the door to further declines. But if the price holds above it, the rebound could be quick and strong because selling has reached an oversold level.
Key levels:
Support: $80.46 (24h low), then $80, then $74
Resistance: $85.07 (24h high), then $90, then $100
Trading plan:
1. Buy scenario (quick trade):
Entry: $80.5–$82
Stop loss: daily candle close below $78
Target 1: $85
Target 2: $90
Target 3: $98–$100
2. Sell scenario:
If it breaks below $80 and holds there, do not buy. Selling pressure will intensify, with the next target at $74, then $68.
#sol板块
#AMANDABELLA
#USJoblessClaimsRise
#MSCIRemovalMayCurbStrategy’sBitcoinBuying
#CoreWeaveJumps10%On168%RevenueGrowth
حمدي فايد ابو الياس اليماني:
عادها باتنزل لما. 050 بس خلي قلبك قوي لا تبيعيها
3
5
2.9k
·
--
Bullish
30D trade $XRP 1.1K USDT
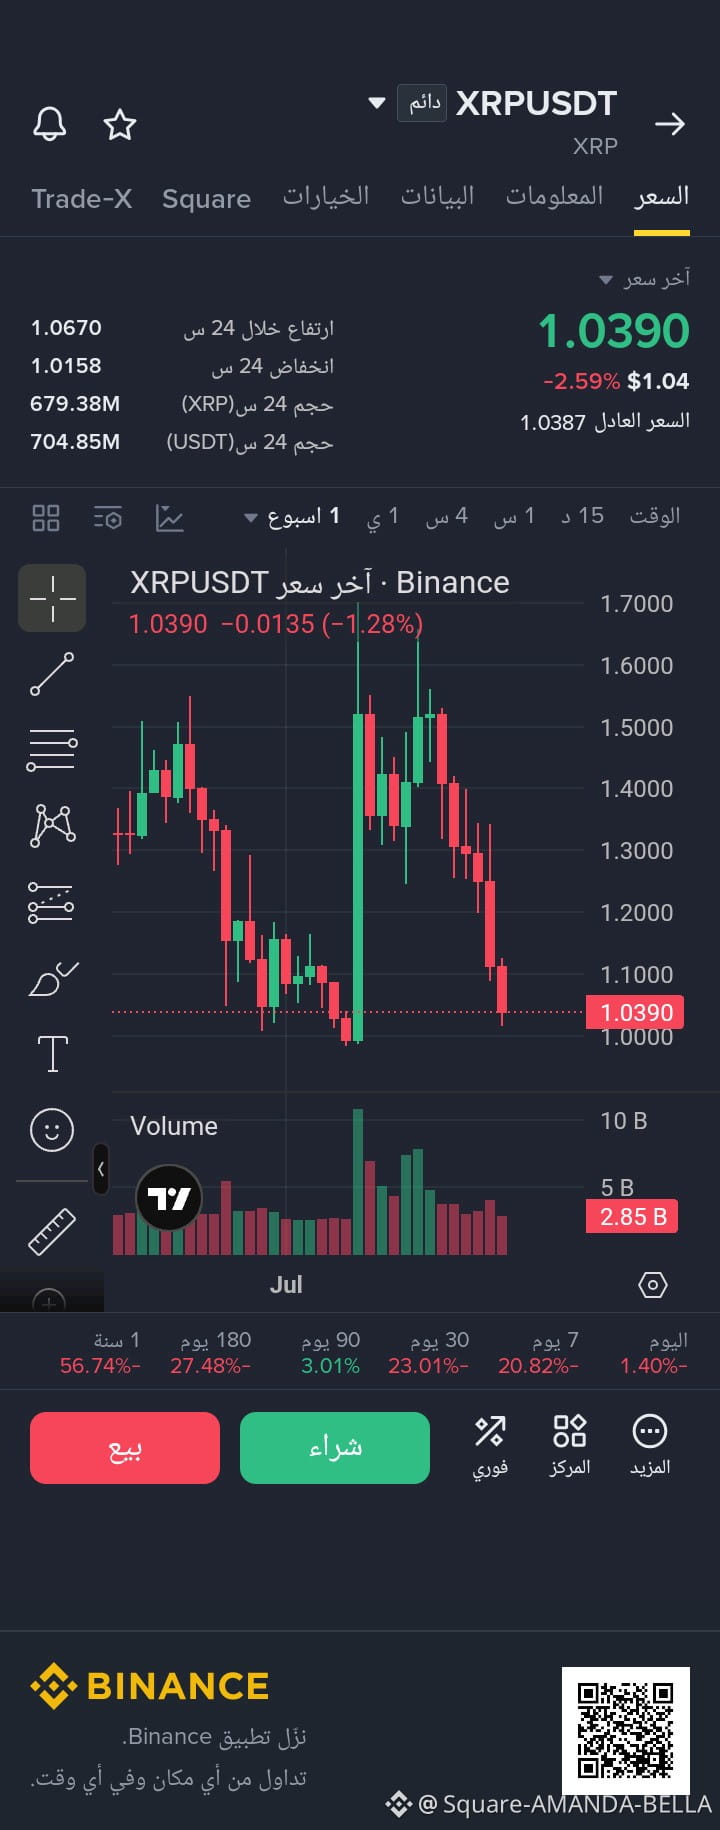
$XRP
{future}(XRPUSDT)
🔥🔥$XRP at a crossroads: $1.03 will decide its fate... breakdown or breakout?🔥🔥
Current price: $1.0390
A clear plunge from the $1.60 peak to $1.03 means XRP has lost more than 35% of its value, and selling pressure is still present.
But we’ve now reached a very sensitive area: the psychological and historical $1.00–$1.03 zone. This area was a previous bottom, and if the price holds here, we could see a strong rebound.
Key levels:
Support: $1.0158 (24-hour low), then $1.00, then $0.95
Resistance: $1.0670 (24-hour high), then $1.10, then $1.20
Trading plan:
1. Buy scenario (more likely):
Entry: $1.02–$1.04
Stop-loss: A daily candle close below $0.99
Target 1: $1.067
Target 2: $1.10
Target 3: $1.20
2. Sell scenario:
If it breaks below $1.00 decisively and stays below it, the bearish case strengthens, with the next target at $0.95–$0.90.
#XRPUSDT🚨
#AMANDABELLA
#CoreWeaveJumps10%On168%RevenueGrowth
#MSCIRemovalMayCurbStrategy’sBitcoinBuying
#TradFiForBeginners
$XRP
🔥🔥$XRP at a crossroads: $1.03 will decide its fate... breakdown or breakout?🔥🔥
Current price: $1.0390
A clear plunge from the $1.60 peak to $1.03 means XRP has lost more than 35% of its value, and selling pressure is still present.
But we’ve now reached a very sensitive area: the psychological and historical $1.00–$1.03 zone. This area was a previous bottom, and if the price holds here, we could see a strong rebound.
Key levels:
Support: $1.0158 (24-hour low), then $1.00, then $0.95
Resistance: $1.0670 (24-hour high), then $1.10, then $1.20
Trading plan:
1. Buy scenario (more likely):
Entry: $1.02–$1.04
Stop-loss: A daily candle close below $0.99
Target 1: $1.067
Target 2: $1.10
Target 3: $1.20
2. Sell scenario:
If it breaks below $1.00 decisively and stays below it, the bearish case strengthens, with the next target at $0.95–$0.90.
#XRPUSDT🚨
#AMANDABELLA
#CoreWeaveJumps10%On168%RevenueGrowth
#MSCIRemovalMayCurbStrategy’sBitcoinBuying
#TradFiForBeginners
🔥🔥$XRP at a crossroads: $1.03 will decide its fate... breakdown or breakout?🔥🔥
Current price: $1.0390
A clear plunge from the $1.60 peak to $1.03 means XRP has lost more than 35% of its value, and selling pressure is still present.
But we’ve now reached a very sensitive area: the psychological and historical $1.00–$1.03 zone. This area was a previous bottom, and if the price holds here, we could see a strong rebound.
Key levels:
Support: $1.0158 (24-hour low), then $1.00, then $0.95
Resistance: $1.0670 (24-hour high), then $1.10, then $1.20
Trading plan:
1. Buy scenario (more likely):
Entry: $1.02–$1.04
Stop-loss: A daily candle close below $0.99
Target 1: $1.067
Target 2: $1.10
Target 3: $1.20
2. Sell scenario:
If it breaks below $1.00 decisively and stays below it, the bearish case strengthens, with the next target at $0.95–$0.90.
#XRPUSDT🚨
#AMANDABELLA
#CoreWeaveJumps10%On168%RevenueGrowth
#MSCIRemovalMayCurbStrategy’sBitcoinBuying
#TradFiForBeginners
Abu Fahadأ:
💛
2
4
1.2k
·
--
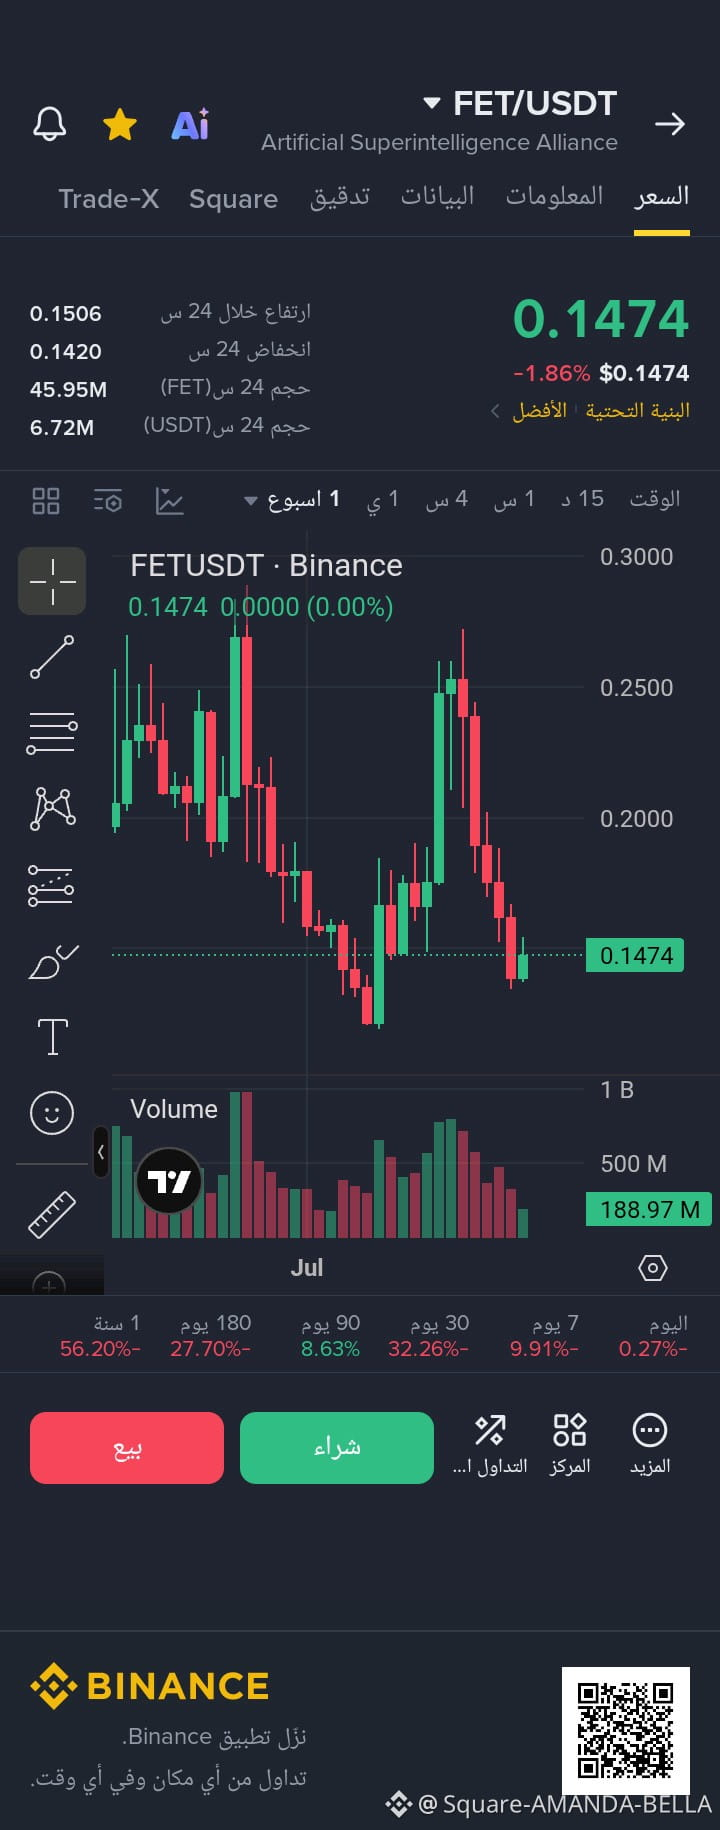
$FET
{future}(FETUSDT)
🔥🔥FET crashes from $0.28 to $0.14🔥🔥
Current price: $0.1474
The $FET coin has lost half its value in just a few weeks. Sellers are in complete control, and buyers are waiting for just one signal to enter.
We are right above critical support: $0.1420
This level is the dividing line between two scenarios:
Scenario one — rebound:
If the price stays above $0.142, we’ll see a rapid rise toward $0.16 and then $0.18.
Scenario two — collapse:
If the price breaks below $0.142 and closes beneath it, the next target will be $0.12.
#FET
#AMANDABELLA
#USJoblessClaimsRise
#TradFiForBeginners
#CoreWeaveJumps10%On168%RevenueGrowth
$FET
🔥🔥FET crashes from $0.28 to $0.14🔥🔥
Current price: $0.1474
The $FET coin has lost half its value in just a few weeks. Sellers are in complete control, and buyers are waiting for just one signal to enter.
We are right above critical support: $0.1420
This level is the dividing line between two scenarios:
Scenario one — rebound:
If the price stays above $0.142, we’ll see a rapid rise toward $0.16 and then $0.18.
Scenario two — collapse:
If the price breaks below $0.142 and closes beneath it, the next target will be $0.12.
#FET
#AMANDABELLA
#USJoblessClaimsRise
#TradFiForBeginners
#CoreWeaveJumps10%On168%RevenueGrowth
🔥🔥FET crashes from $0.28 to $0.14🔥🔥
Current price: $0.1474
The $FET coin has lost half its value in just a few weeks. Sellers are in complete control, and buyers are waiting for just one signal to enter.
We are right above critical support: $0.1420
This level is the dividing line between two scenarios:
Scenario one — rebound:
If the price stays above $0.142, we’ll see a rapid rise toward $0.16 and then $0.18.
Scenario two — collapse:
If the price breaks below $0.142 and closes beneath it, the next target will be $0.12.
#FET
#AMANDABELLA
#USJoblessClaimsRise
#TradFiForBeginners
#CoreWeaveJumps10%On168%RevenueGrowth
3
455
·
--
$NEAR
{future}(NEARUSDT)
🔥🔥NEAR coin drops more than 7%... Has it reached the buying zone, or is the worst yet to come?🔥🔥
After NEAR reached a peak of $6.00, it entered a sharp downward trend, losing more than 43% of its value and hitting a low of $3.341.
Currently, the price is trying to hold above the $3.40 level, an important level that previously served as a launchpad for an upward move. Holding above it could give buyers a chance to rebound, while a break below it would open the door to a deeper decline.
Key levels:
Support: $3.341, then $3.00, then $2.60
Resistance: $3.704, then $4.00, then $4.50
Trading plan:
First: Buy scenario
Entry zone: Between $3.40 and $3.45
Stop loss: A daily candle close below $3.30
First target: $3.70
Second target: $4.00
Third target: $4.50
Second: Sell scenario
If the price breaks below $3.30 and holds beneath it, selling becomes the stronger option, with targets at $3.00 and then $2.60.
#NEAR🚀🚀🚀
#AMANDABELLA
#USJoblessClaimsRise
#TradFiForBeginners
#CoreWeaveJumps10%On168%RevenueGrowth
$NEAR
🔥🔥NEAR coin drops more than 7%... Has it reached the buying zone, or is the worst yet to come?🔥🔥
After NEAR reached a peak of $6.00, it entered a sharp downward trend, losing more than 43% of its value and hitting a low of $3.341.
Currently, the price is trying to hold above the $3.40 level, an important level that previously served as a launchpad for an upward move. Holding above it could give buyers a chance to rebound, while a break below it would open the door to a deeper decline.
Key levels:
Support: $3.341, then $3.00, then $2.60
Resistance: $3.704, then $4.00, then $4.50
Trading plan:
First: Buy scenario
Entry zone: Between $3.40 and $3.45
Stop loss: A daily candle close below $3.30
First target: $3.70
Second target: $4.00
Third target: $4.50
Second: Sell scenario
If the price breaks below $3.30 and holds beneath it, selling becomes the stronger option, with targets at $3.00 and then $2.60.
#NEAR🚀🚀🚀
#AMANDABELLA
#USJoblessClaimsRise
#TradFiForBeginners
#CoreWeaveJumps10%On168%RevenueGrowth
🔥🔥NEAR coin drops more than 7%... Has it reached the buying zone, or is the worst yet to come?🔥🔥
After NEAR reached a peak of $6.00, it entered a sharp downward trend, losing more than 43% of its value and hitting a low of $3.341.
Currently, the price is trying to hold above the $3.40 level, an important level that previously served as a launchpad for an upward move. Holding above it could give buyers a chance to rebound, while a break below it would open the door to a deeper decline.
Key levels:
Support: $3.341, then $3.00, then $2.60
Resistance: $3.704, then $4.00, then $4.50
Trading plan:
First: Buy scenario
Entry zone: Between $3.40 and $3.45
Stop loss: A daily candle close below $3.30
First target: $3.70
Second target: $4.00
Third target: $4.50
Second: Sell scenario
If the price breaks below $3.30 and holds beneath it, selling becomes the stronger option, with targets at $3.00 and then $2.60.
#NEAR🚀🚀🚀
#AMANDABELLA
#USJoblessClaimsRise
#TradFiForBeginners
#CoreWeaveJumps10%On168%RevenueGrowth

4
522
·
--
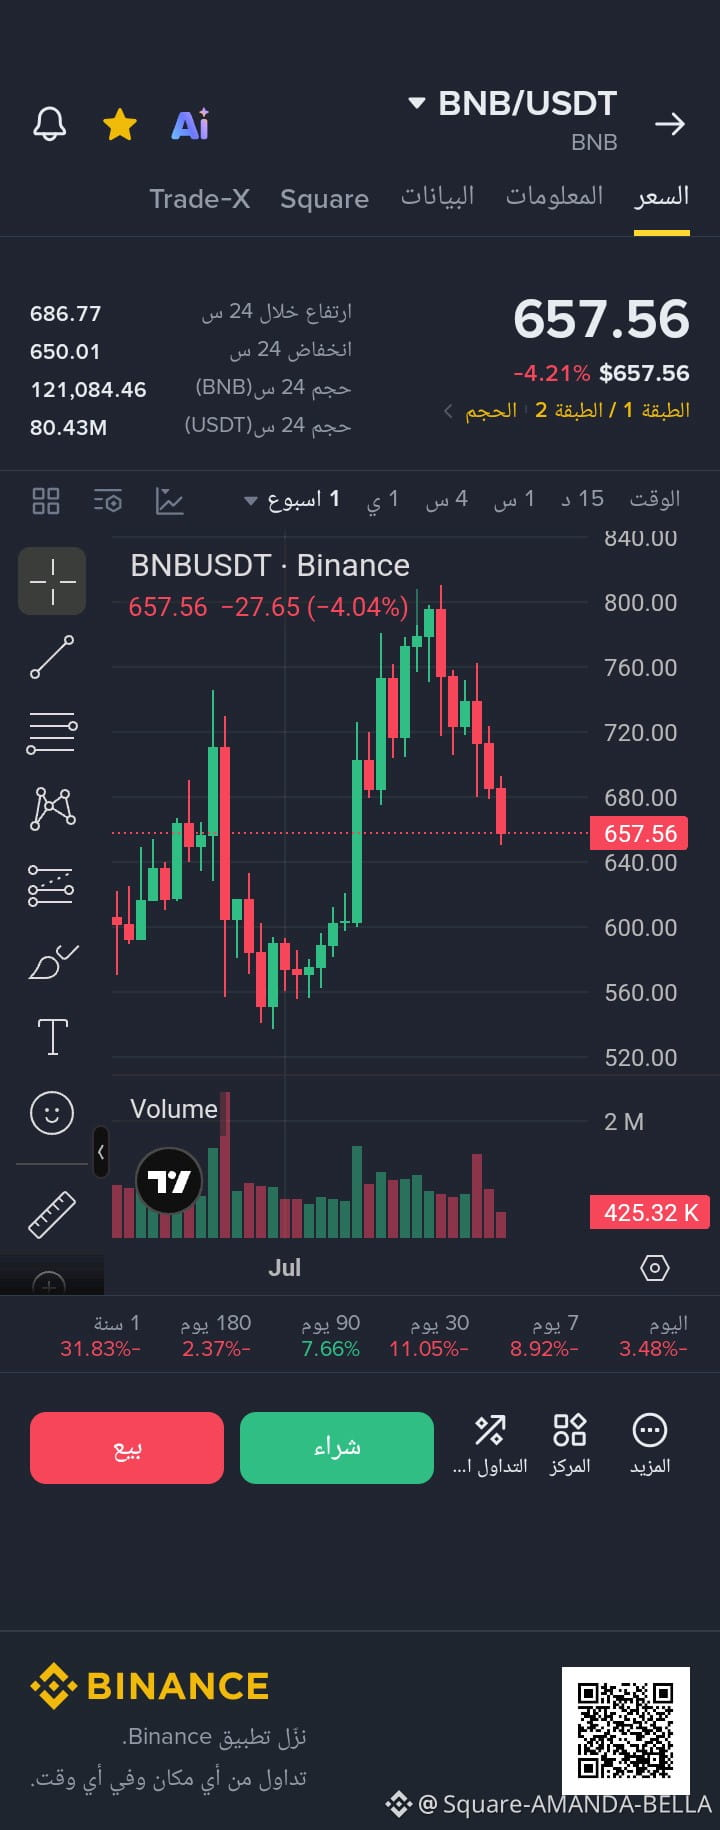
$BNB
{future}(BNBUSDT)
🔥🔥$BNB is retreating sharply.. Is it time to buy, or is the bottom still far away?🔥🔥
Current price: $657.56 (-4.21%)
What's happening now?
After BNB reached a peak of $810, it entered a strong correction wave and lost more than 18%. The price is now testing a very sensitive zone between $650 and $660.
Sellers are still in control, but the $650 zone is the last strong support before a deeper decline. Any hold above it = an excellent rebound opportunity.
Levels:
▪️ First support: $650
▪️ Strong support: $620 - $600
▪️ First resistance: $686
▪️ Strong resistance: $720 - $760
Trading plan:
To buy: I’ll wait for it to hold above $660.
Stop: Daily close below $640
My targets: $686 ➡️ $720 ➡️ $760
For sellers: A clear close below $650 = a drop toward $620, then $600
#BNB金铲子挖矿
#AMANDABELLA
#USJoblessClaimsRise
#TradFiForBeginners
#MSCIRemovalMayCurbStrategy’sBitcoinBuying
$BNB
🔥🔥$BNB is retreating sharply.. Is it time to buy, or is the bottom still far away?🔥🔥
Current price: $657.56 (-4.21%)
What's happening now?
After BNB reached a peak of $810, it entered a strong correction wave and lost more than 18%. The price is now testing a very sensitive zone between $650 and $660.
Sellers are still in control, but the $650 zone is the last strong support before a deeper decline. Any hold above it = an excellent rebound opportunity.
Levels:
▪️ First support: $650
▪️ Strong support: $620 - $600
▪️ First resistance: $686
▪️ Strong resistance: $720 - $760
Trading plan:
To buy: I’ll wait for it to hold above $660.
Stop: Daily close below $640
My targets: $686 ➡️ $720 ➡️ $760
For sellers: A clear close below $650 = a drop toward $620, then $600
#BNB金铲子挖矿
#AMANDABELLA
#USJoblessClaimsRise
#TradFiForBeginners
#MSCIRemovalMayCurbStrategy’sBitcoinBuying
🔥🔥$BNB is retreating sharply.. Is it time to buy, or is the bottom still far away?🔥🔥
Current price: $657.56 (-4.21%)
What's happening now?
After BNB reached a peak of $810, it entered a strong correction wave and lost more than 18%. The price is now testing a very sensitive zone between $650 and $660.
Sellers are still in control, but the $650 zone is the last strong support before a deeper decline. Any hold above it = an excellent rebound opportunity.
Levels:
▪️ First support: $650
▪️ Strong support: $620 - $600
▪️ First resistance: $686
▪️ Strong resistance: $720 - $760
Trading plan:
To buy: I’ll wait for it to hold above $660.
Stop: Daily close below $640
My targets: $686 ➡️ $720 ➡️ $760
For sellers: A clear close below $650 = a drop toward $620, then $600
#BNB金铲子挖矿
#AMANDABELLA
#USJoblessClaimsRise
#TradFiForBeginners
#MSCIRemovalMayCurbStrategy’sBitcoinBuying
User-89ace563:
أنا لسه جديد في هذا المجال ويعني لازم أعود نفسي ع الصبر والا بيسيطر عليا اليأس وأنا في بداية المشوار ههههههه
3
4
607
·
--
$PEPE
{spot}(PEPEUSDT)
🔥🔥$PEPE is collapsing from the top… Is the game over, or is this the golden opportunity?🔥🔥
Price: $0.00000451 (-3.84%)
PEPE peaked at $0.00000560, then plunged sharply, breaking through all the minor support levels and dropping as low as $0.00000429.
Now the price is trying to hold above $0.00000450, and this is the zone that will determine what happens next.
Trading plan:
✅ If it stays above $0.00000450
Entry: $0.00000451 - $0.00000455
First target: $0.00000475
Second target: $0.00000500
Stop: 4-hour close below $0.00000429
❌ If it breaks below $0.00000429
Don't buy; the sell-off will continue downward.
Target: $0.00000400, then $0.00000380
#PEPE创历史新高
#AMANDABELLA
#TradFiForBeginners
#USJoblessClaimsRise
#ChipStocksExtendLossesAfterNvidiaCEOChange
$PEPE
🔥🔥$PEPE is collapsing from the top… Is the game over, or is this the golden opportunity?🔥🔥
Price: $0.00000451 (-3.84%)
PEPE peaked at $0.00000560, then plunged sharply, breaking through all the minor support levels and dropping as low as $0.00000429.
Now the price is trying to hold above $0.00000450, and this is the zone that will determine what happens next.
Trading plan:
✅ If it stays above $0.00000450
Entry: $0.00000451 - $0.00000455
First target: $0.00000475
Second target: $0.00000500
Stop: 4-hour close below $0.00000429
❌ If it breaks below $0.00000429
Don't buy; the sell-off will continue downward.
Target: $0.00000400, then $0.00000380
#PEPE创历史新高
#AMANDABELLA
#TradFiForBeginners
#USJoblessClaimsRise
#ChipStocksExtendLossesAfterNvidiaCEOChange
🔥🔥$PEPE is collapsing from the top… Is the game over, or is this the golden opportunity?🔥🔥
Price: $0.00000451 (-3.84%)
PEPE peaked at $0.00000560, then plunged sharply, breaking through all the minor support levels and dropping as low as $0.00000429.
Now the price is trying to hold above $0.00000450, and this is the zone that will determine what happens next.
Trading plan:
✅ If it stays above $0.00000450
Entry: $0.00000451 - $0.00000455
First target: $0.00000475
Second target: $0.00000500
Stop: 4-hour close below $0.00000429
❌ If it breaks below $0.00000429
Don't buy; the sell-off will continue downward.
Target: $0.00000400, then $0.00000380
#PEPE创历史新高
#AMANDABELLA
#TradFiForBeginners
#USJoblessClaimsRise
#ChipStocksExtendLossesAfterNvidiaCEOChange

علاء الحلاوي alaa:
وعطيك جواب صديقي نزول واني بعت من كان 520
1
4
533
·
--
$AKE
{future}(AKEUSDT)
🔥🔥AKE jumps +350% in one day... Is it an opportunity or a trap?🔥🔥
Current price: $0.01220
The price surged from a low of $0.0025 to a high of $0.0133, then corrected sharply. Today, it returned with a strong bullish candle, backed by massive trading volume exceeding $1 billion. Momentum is strong, but the price is approaching critical resistance.
Trading plan:
• Entry: On a retest of the $0.0100–$0.0105 zone
• First target: $0.0133
• Second target: $0.0190
• Stop-loss: A break below $0.0090
#AKE
#AMANDABELLA
#WhatWillDriveCryptoandStocks’NextRebound?
#BitcoinBreaksBelow200WeekMovingAverage
#Anthropic’s6xIPODemandSignalsPotentialRecordRaise
$AKE
🔥🔥AKE jumps +350% in one day... Is it an opportunity or a trap?🔥🔥
Current price: $0.01220
The price surged from a low of $0.0025 to a high of $0.0133, then corrected sharply. Today, it returned with a strong bullish candle, backed by massive trading volume exceeding $1 billion. Momentum is strong, but the price is approaching critical resistance.
Trading plan:
• Entry: On a retest of the $0.0100–$0.0105 zone
• First target: $0.0133
• Second target: $0.0190
• Stop-loss: A break below $0.0090
#AKE
#AMANDABELLA
#WhatWillDriveCryptoandStocks’NextRebound?
#BitcoinBreaksBelow200WeekMovingAverage
#Anthropic’s6xIPODemandSignalsPotentialRecordRaise
🔥🔥AKE jumps +350% in one day... Is it an opportunity or a trap?🔥🔥
Current price: $0.01220
The price surged from a low of $0.0025 to a high of $0.0133, then corrected sharply. Today, it returned with a strong bullish candle, backed by massive trading volume exceeding $1 billion. Momentum is strong, but the price is approaching critical resistance.
Trading plan:
• Entry: On a retest of the $0.0100–$0.0105 zone
• First target: $0.0133
• Second target: $0.0190
• Stop-loss: A break below $0.0090
#AKE
#AMANDABELLA
#WhatWillDriveCryptoandStocks’NextRebound?
#BitcoinBreaksBelow200WeekMovingAverage
#Anthropic’s6xIPODemandSignalsPotentialRecordRaise

1
1
127
·
--
$ENA
{future}(ENAUSDT)
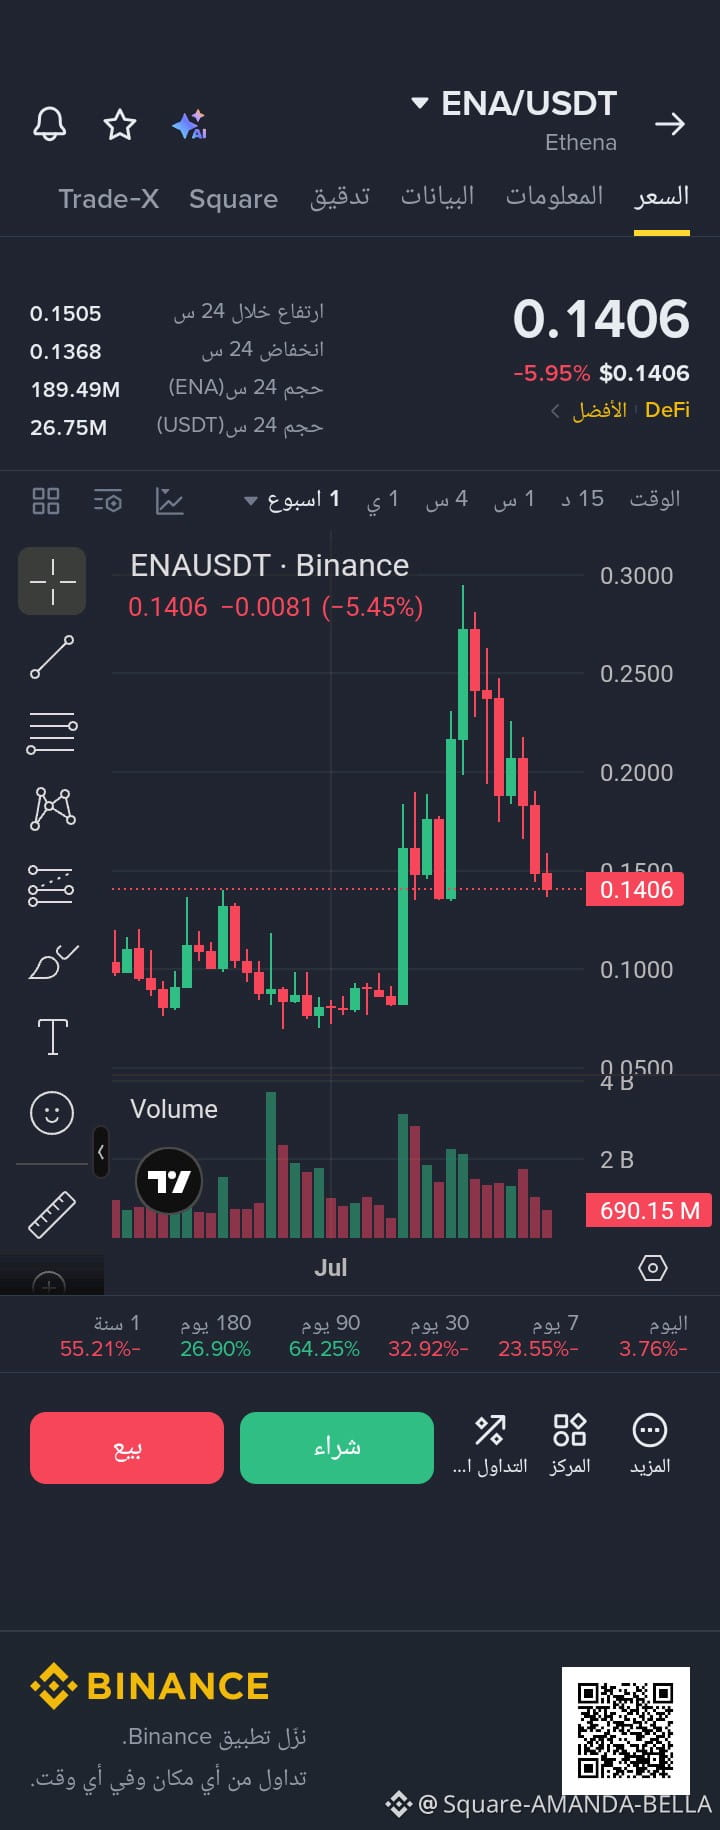
🔥🔥ENA is plunging sharply.. Have we neared the bottom, or is the decline still continuing?🔥🔥
Current price: $0.1406 — down 5.95%
After reaching a peak of $0.29, ENA entered a sharp downward trend, losing more than 50% of its value and hitting a low of $0.1368.
Currently, the price is trying to hold above $0.14, an important psychological and technical level. Holding above it could give buyers a chance to return, while a break below it would open the door to further declines.
Key levels:
Support: $0.1368, then $0.12, then $0.10
Resistance: $0.1505, then $0.17, then $0.19
Trading plan:
First: Buy scenario
Entry zone: Between $0.140 and $0.143
Stop loss: A daily candle close below $0.136
First target: $0.1505
Second target: $0.17
Third target: $0.19
Second: Sell scenario
If the $0.136 level breaks and the price holds below it, selling becomes the stronger option, with targets at $0.12 and then $0.10.
#ENA
#USJoblessClaimsRise
#TradFiForBeginners
#AMANDABELLA
#MSCIRemovalMayCurbStrategy’sBitcoinBuying
$ENA
🔥🔥ENA is plunging sharply.. Have we neared the bottom, or is the decline still continuing?🔥🔥
Current price: $0.1406 — down 5.95%
After reaching a peak of $0.29, ENA entered a sharp downward trend, losing more than 50% of its value and hitting a low of $0.1368.
Currently, the price is trying to hold above $0.14, an important psychological and technical level. Holding above it could give buyers a chance to return, while a break below it would open the door to further declines.
Key levels:
Support: $0.1368, then $0.12, then $0.10
Resistance: $0.1505, then $0.17, then $0.19
Trading plan:
First: Buy scenario
Entry zone: Between $0.140 and $0.143
Stop loss: A daily candle close below $0.136
First target: $0.1505
Second target: $0.17
Third target: $0.19
Second: Sell scenario
If the $0.136 level breaks and the price holds below it, selling becomes the stronger option, with targets at $0.12 and then $0.10.
#ENA
#USJoblessClaimsRise
#TradFiForBeginners
#AMANDABELLA
#MSCIRemovalMayCurbStrategy’sBitcoinBuying
🔥🔥ENA is plunging sharply.. Have we neared the bottom, or is the decline still continuing?🔥🔥
Current price: $0.1406 — down 5.95%
After reaching a peak of $0.29, ENA entered a sharp downward trend, losing more than 50% of its value and hitting a low of $0.1368.
Currently, the price is trying to hold above $0.14, an important psychological and technical level. Holding above it could give buyers a chance to return, while a break below it would open the door to further declines.
Key levels:
Support: $0.1368, then $0.12, then $0.10
Resistance: $0.1505, then $0.17, then $0.19
Trading plan:
First: Buy scenario
Entry zone: Between $0.140 and $0.143
Stop loss: A daily candle close below $0.136
First target: $0.1505
Second target: $0.17
Third target: $0.19
Second: Sell scenario
If the $0.136 level breaks and the price holds below it, selling becomes the stronger option, with targets at $0.12 and then $0.10.
#ENA
#USJoblessClaimsRise
#TradFiForBeginners
#AMANDABELLA
#MSCIRemovalMayCurbStrategy’sBitcoinBuying
3
221
·
--
$ADA
{future}(ADAUSDT)
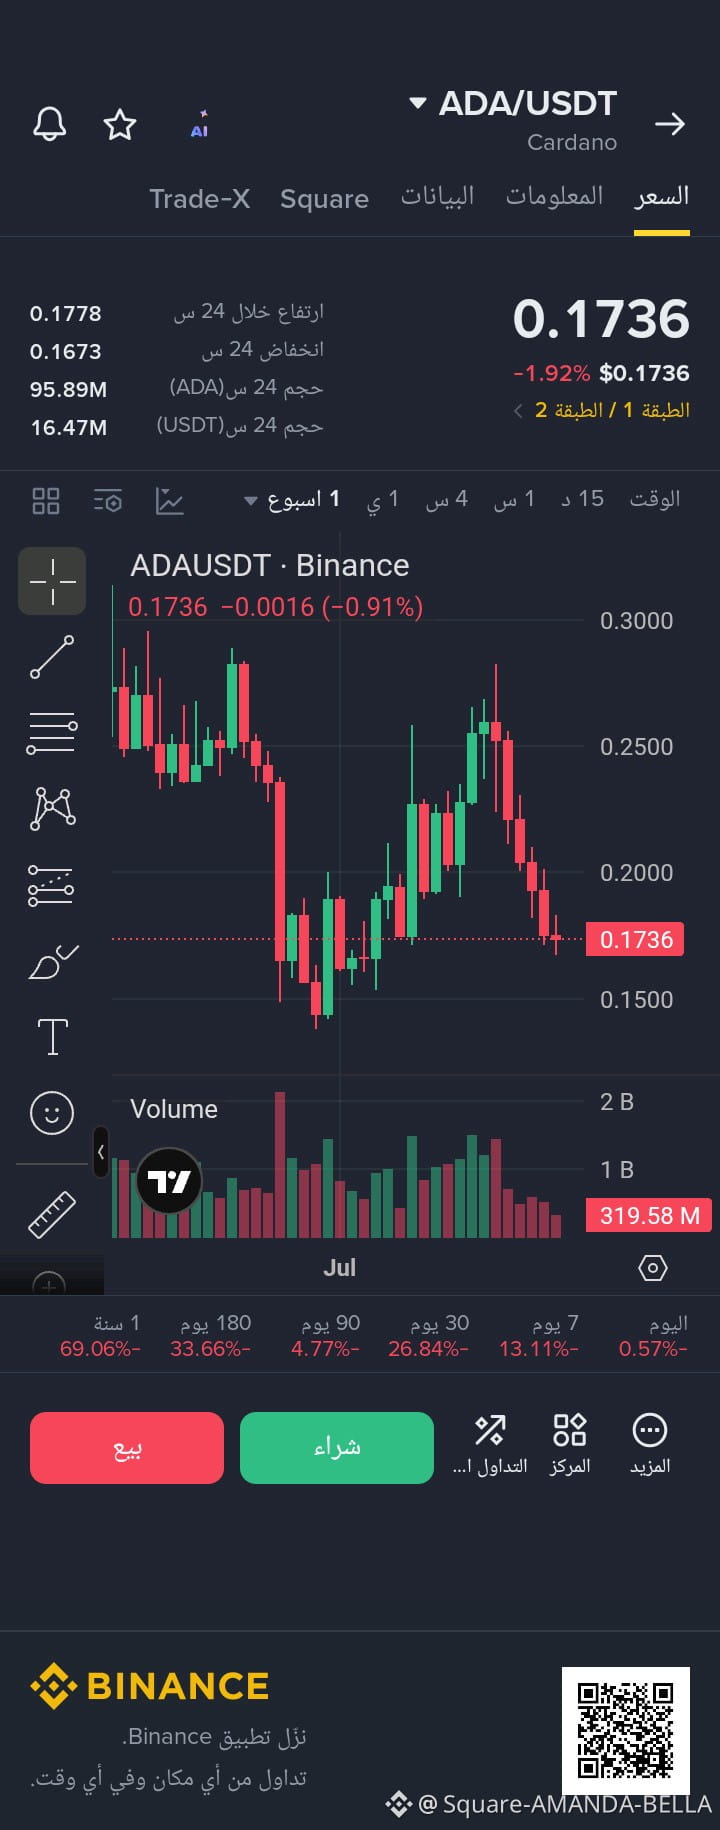
🔥🔥$ADA returns to the $0.17 zone.. Is this the real bottom, or is the decline still continuing?🔥🔥
Price: $0.1736 (-1.92%)
$ADA peaked at $0.29, then entered a sharp decline, broke through all support levels, and fell to $0.1673.
The price is now trying to hold above $0.17, and this is the zone that will determine the direction.
If it holds, the rebound will be quick; if it breaks, we’ll head to a deeper bottom.
Trading plan:
✅ If it stays above $0.17
Entry: $0.173 - $0.175
First target: $0.1778
Second target: $0.20
Third target: $0.22
Stop-loss: Daily close below $0.167
❌ If it breaks below $0.167
Don’t buy; the price will continue falling.
Target: $0.15, then $0.13
#ADA!
#AMANDABELLA
#USJoblessClaimsRise
#TradFiForBeginners
#MSCIRemovalMayCurbStrategy’sBitcoinBuying
$ADA
🔥🔥$ADA returns to the $0.17 zone.. Is this the real bottom, or is the decline still continuing?🔥🔥
Price: $0.1736 (-1.92%)
$ADA peaked at $0.29, then entered a sharp decline, broke through all support levels, and fell to $0.1673.
The price is now trying to hold above $0.17, and this is the zone that will determine the direction.
If it holds, the rebound will be quick; if it breaks, we’ll head to a deeper bottom.
Trading plan:
✅ If it stays above $0.17
Entry: $0.173 - $0.175
First target: $0.1778
Second target: $0.20
Third target: $0.22
Stop-loss: Daily close below $0.167
❌ If it breaks below $0.167
Don’t buy; the price will continue falling.
Target: $0.15, then $0.13
#ADA!
#AMANDABELLA
#USJoblessClaimsRise
#TradFiForBeginners
#MSCIRemovalMayCurbStrategy’sBitcoinBuying
🔥🔥$ADA returns to the $0.17 zone.. Is this the real bottom, or is the decline still continuing?🔥🔥
Price: $0.1736 (-1.92%)
$ADA peaked at $0.29, then entered a sharp decline, broke through all support levels, and fell to $0.1673.
The price is now trying to hold above $0.17, and this is the zone that will determine the direction.
If it holds, the rebound will be quick; if it breaks, we’ll head to a deeper bottom.
Trading plan:
✅ If it stays above $0.17
Entry: $0.173 - $0.175
First target: $0.1778
Second target: $0.20
Third target: $0.22
Stop-loss: Daily close below $0.167
❌ If it breaks below $0.167
Don’t buy; the price will continue falling.
Target: $0.15, then $0.13
#ADA!
#AMANDABELLA
#USJoblessClaimsRise
#TradFiForBeginners
#MSCIRemovalMayCurbStrategy’sBitcoinBuying
2
2
483
·
--
$ETH
{future}(ETHUSDT)
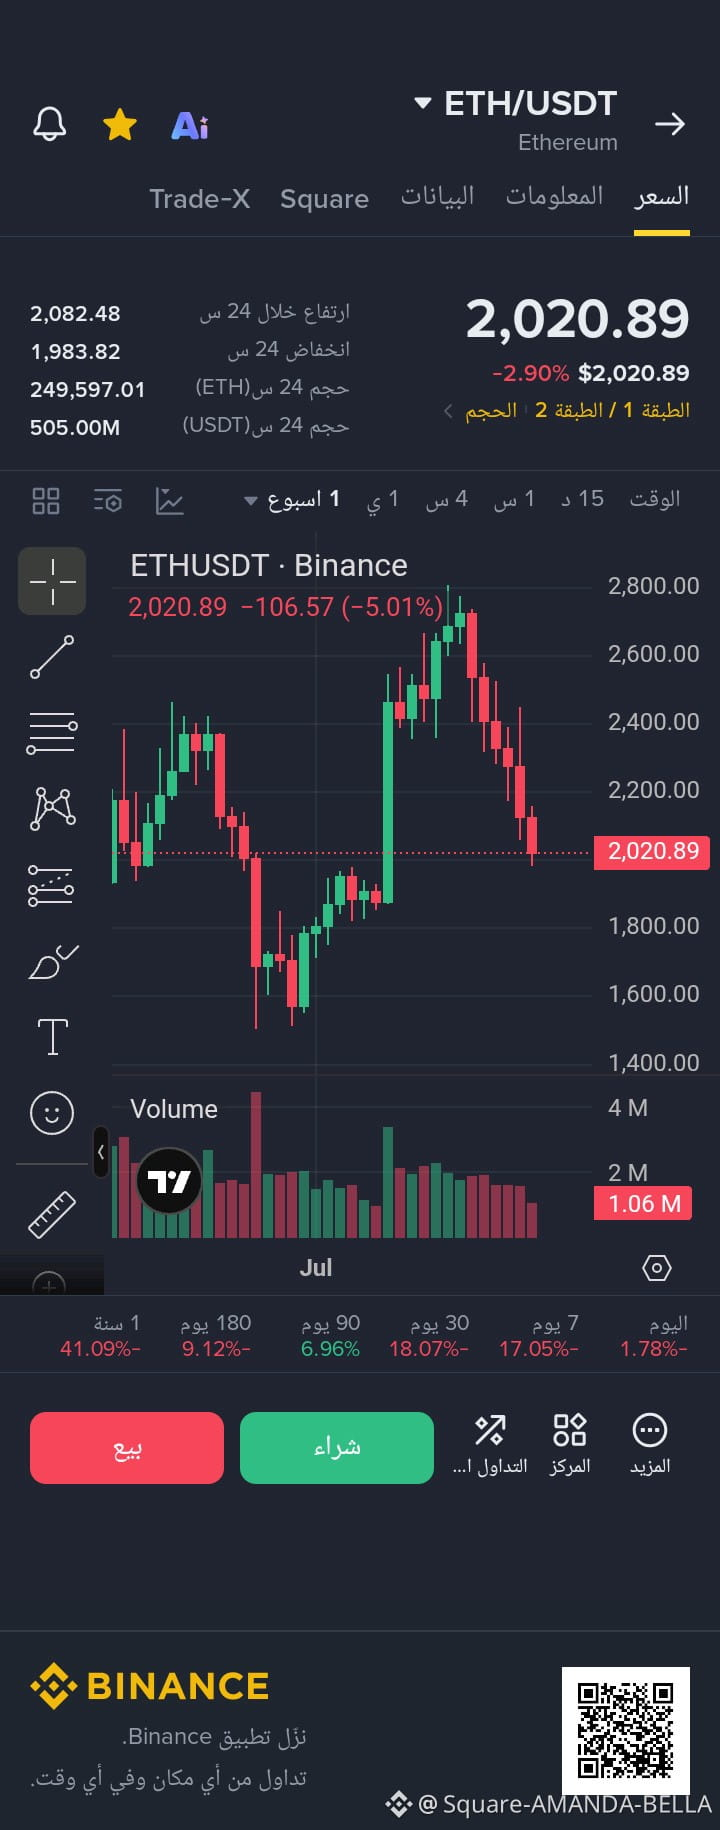
🔥🔥$ETH breaks below $2,000... Is this the major bottom or the beginning of a crash?🔥🔥
Current price: $2,020.89
A sharp drop from the $2,800 peak to **$2,020** means Ethereum has lost more than 27%, and the entire market is gripped by fear.
We have now reached the most critical zone: $2,000–$2,020. The psychological $2,000 mark is the last line of defense. If the price holds above it, the rebound could be very strong. But if it breaks below and closes under it, we could see a deeper sell-off.
Key levels:
Support: $1,983.82 (24-hour low), then $2,000, then $1,900
Resistance: $2,082.48 (24-hour high), then $2,200, then $2,400
Trading plan:
1. Buy scenario (more likely):
Entry: $1,990–$2,030
Stop-loss: Daily candle close below $1,950
Target 1: $2,082
Target 2: $2,200
Target 3: $2,400
2. Sell scenario:
If it breaks below $1,950 and stays there, don't buy. Selling pressure will intensify, with the next targets at $1,850 and then $1,700.
#ETH
#AMANDABELLA
#USJoblessClaimsRise
#TradFiForBeginners
#CoreWeaveJumps10%On168%RevenueGrowth
$ETH
🔥🔥$ETH breaks below $2,000... Is this the major bottom or the beginning of a crash?🔥🔥
Current price: $2,020.89
A sharp drop from the $2,800 peak to **$2,020** means Ethereum has lost more than 27%, and the entire market is gripped by fear.
We have now reached the most critical zone: $2,000–$2,020. The psychological $2,000 mark is the last line of defense. If the price holds above it, the rebound could be very strong. But if it breaks below and closes under it, we could see a deeper sell-off.
Key levels:
Support: $1,983.82 (24-hour low), then $2,000, then $1,900
Resistance: $2,082.48 (24-hour high), then $2,200, then $2,400
Trading plan:
1. Buy scenario (more likely):
Entry: $1,990–$2,030
Stop-loss: Daily candle close below $1,950
Target 1: $2,082
Target 2: $2,200
Target 3: $2,400
2. Sell scenario:
If it breaks below $1,950 and stays there, don't buy. Selling pressure will intensify, with the next targets at $1,850 and then $1,700.
#ETH
#AMANDABELLA
#USJoblessClaimsRise
#TradFiForBeginners
#CoreWeaveJumps10%On168%RevenueGrowth
🔥🔥$ETH breaks below $2,000... Is this the major bottom or the beginning of a crash?🔥🔥
Current price: $2,020.89
A sharp drop from the $2,800 peak to **$2,020** means Ethereum has lost more than 27%, and the entire market is gripped by fear.
We have now reached the most critical zone: $2,000–$2,020. The psychological $2,000 mark is the last line of defense. If the price holds above it, the rebound could be very strong. But if it breaks below and closes under it, we could see a deeper sell-off.
Key levels:
Support: $1,983.82 (24-hour low), then $2,000, then $1,900
Resistance: $2,082.48 (24-hour high), then $2,200, then $2,400
Trading plan:
1. Buy scenario (more likely):
Entry: $1,990–$2,030
Stop-loss: Daily candle close below $1,950
Target 1: $2,082
Target 2: $2,200
Target 3: $2,400
2. Sell scenario:
If it breaks below $1,950 and stays there, don't buy. Selling pressure will intensify, with the next targets at $1,850 and then $1,700.
#ETH
#AMANDABELLA
#USJoblessClaimsRise
#TradFiForBeginners
#CoreWeaveJumps10%On168%RevenueGrowth
Abu Fahadأ:
💛
2
3
453
·
--
$1INCH
{future}(1INCHUSDT)
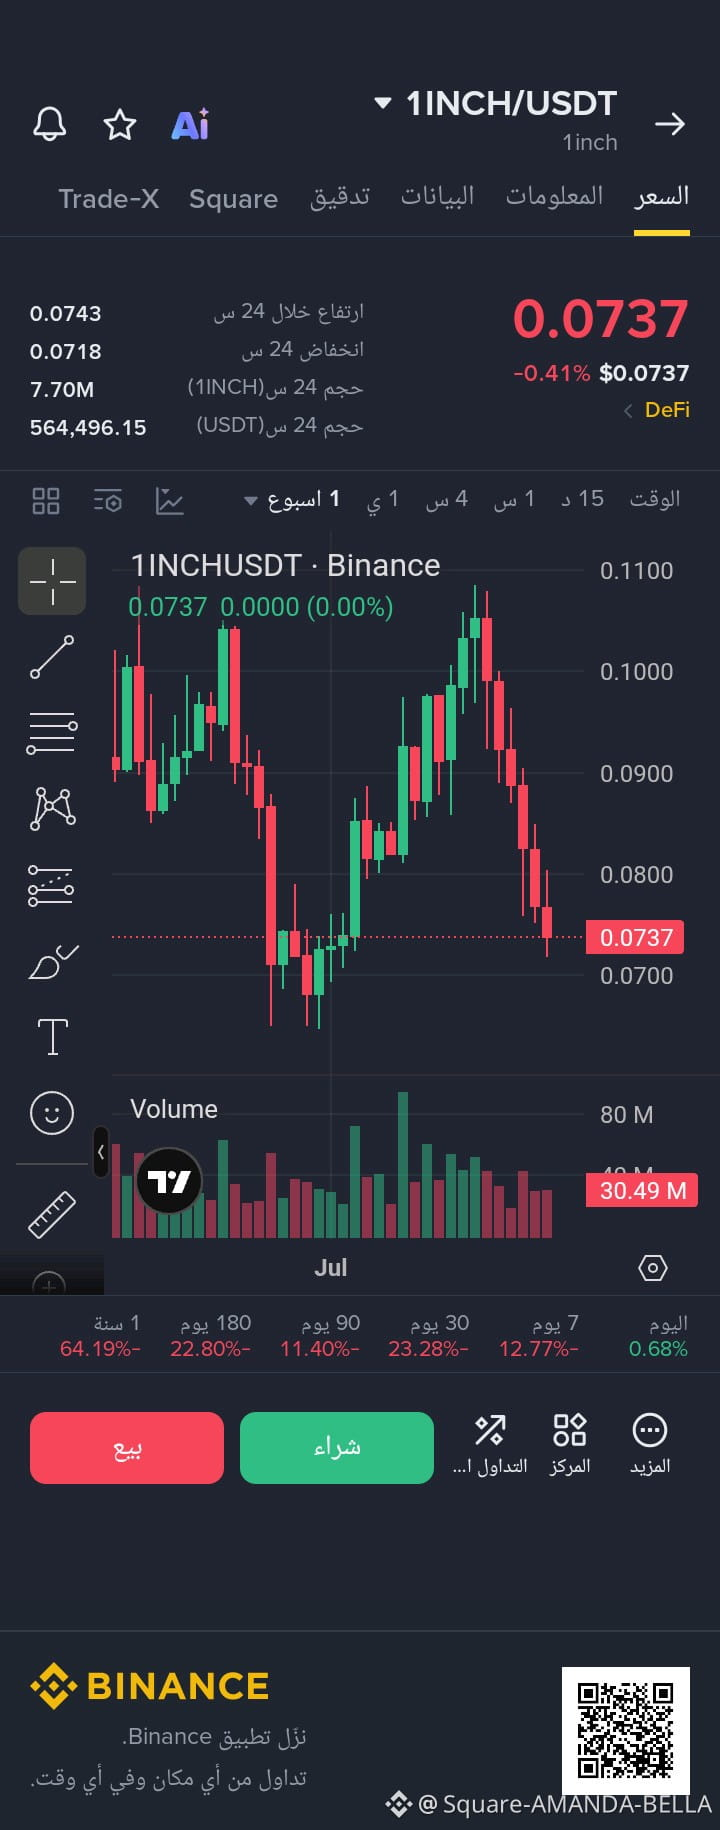
🔥🔥 1INCH at its last support... strong rebound or another crash? 🔥🔥
1INCH fell from $0.108 to $0.073, losing more than 32% 📉
The price is now at the last support zone: $0.0718
If it holds here = strong rebound
If it breaks below = we’ll head to $0.065
Trading plan:
🟢 Buy: $0.072–$0.074
🎯 Target: $0.08, then $0.085
🛑 Stop loss: close below $0.070
🔴 Sell: A break below $0.070 = don’t buy; wait for $0.065
#1INCH/USDT
#AMANDABELLA
#USJoblessClaimsRise
#TradFiForBeginners
#CoreWeaveJumps10%On168%RevenueGrowth
$1INCH
🔥🔥 1INCH at its last support... strong rebound or another crash? 🔥🔥
1INCH fell from $0.108 to $0.073, losing more than 32% 📉
The price is now at the last support zone: $0.0718
If it holds here = strong rebound
If it breaks below = we’ll head to $0.065
Trading plan:
🟢 Buy: $0.072–$0.074
🎯 Target: $0.08, then $0.085
🛑 Stop loss: close below $0.070
🔴 Sell: A break below $0.070 = don’t buy; wait for $0.065
#1INCH/USDT
#AMANDABELLA
#USJoblessClaimsRise
#TradFiForBeginners
#CoreWeaveJumps10%On168%RevenueGrowth
🔥🔥 1INCH at its last support... strong rebound or another crash? 🔥🔥
1INCH fell from $0.108 to $0.073, losing more than 32% 📉
The price is now at the last support zone: $0.0718
If it holds here = strong rebound
If it breaks below = we’ll head to $0.065
Trading plan:
🟢 Buy: $0.072–$0.074
🎯 Target: $0.08, then $0.085
🛑 Stop loss: close below $0.070
🔴 Sell: A break below $0.070 = don’t buy; wait for $0.065
#1INCH/USDT
#AMANDABELLA
#USJoblessClaimsRise
#TradFiForBeginners
#CoreWeaveJumps10%On168%RevenueGrowth
3
112
·
--
$BTC
{future}(BTCUSDT)
🔥🔥$BTC breaks $72,000.. Is this the major bottom or the beginning of the real crash?🔥🔥
Price: $71,595 (-3.87%)
Bitcoin peaked at $88,000, then entered a sharp decline, breaking through all support levels and dropping as low as $71,255.
The price is now trying to hold above $71,500. This is the zone that will determine the market’s fate, because BTC is the leader—if it falls, it will take the whole market down with it.
Trading plan:
✅ If it stays above $71,500
Entry: $71,500 - $72,000
First target: $74,556
Second target: $78,000
Third target: $80,000
Stop-loss: Daily close below $70,500
❌ If it breaks below $70,500
Don’t buy; the sell-off will continue downward
Target: $68,000, then $64,000
#BTC
#AMANDABELLA
#USJoblessClaimsRise
#TradFiForBeginners
#CoreWeaveJumps10%On168%RevenueGrowth
$BTC
🔥🔥$BTC breaks $72,000.. Is this the major bottom or the beginning of the real crash?🔥🔥
Price: $71,595 (-3.87%)
Bitcoin peaked at $88,000, then entered a sharp decline, breaking through all support levels and dropping as low as $71,255.
The price is now trying to hold above $71,500. This is the zone that will determine the market’s fate, because BTC is the leader—if it falls, it will take the whole market down with it.
Trading plan:
✅ If it stays above $71,500
Entry: $71,500 - $72,000
First target: $74,556
Second target: $78,000
Third target: $80,000
Stop-loss: Daily close below $70,500
❌ If it breaks below $70,500
Don’t buy; the sell-off will continue downward
Target: $68,000, then $64,000
#BTC
#AMANDABELLA
#USJoblessClaimsRise
#TradFiForBeginners
#CoreWeaveJumps10%On168%RevenueGrowth
🔥🔥$BTC breaks $72,000.. Is this the major bottom or the beginning of the real crash?🔥🔥
Price: $71,595 (-3.87%)
Bitcoin peaked at $88,000, then entered a sharp decline, breaking through all support levels and dropping as low as $71,255.
The price is now trying to hold above $71,500. This is the zone that will determine the market’s fate, because BTC is the leader—if it falls, it will take the whole market down with it.
Trading plan:
✅ If it stays above $71,500
Entry: $71,500 - $72,000
First target: $74,556
Second target: $78,000
Third target: $80,000
Stop-loss: Daily close below $70,500
❌ If it breaks below $70,500
Don’t buy; the sell-off will continue downward
Target: $68,000, then $64,000
#BTC
#AMANDABELLA
#USJoblessClaimsRise
#TradFiForBeginners
#CoreWeaveJumps10%On168%RevenueGrowth

2
232
·
--
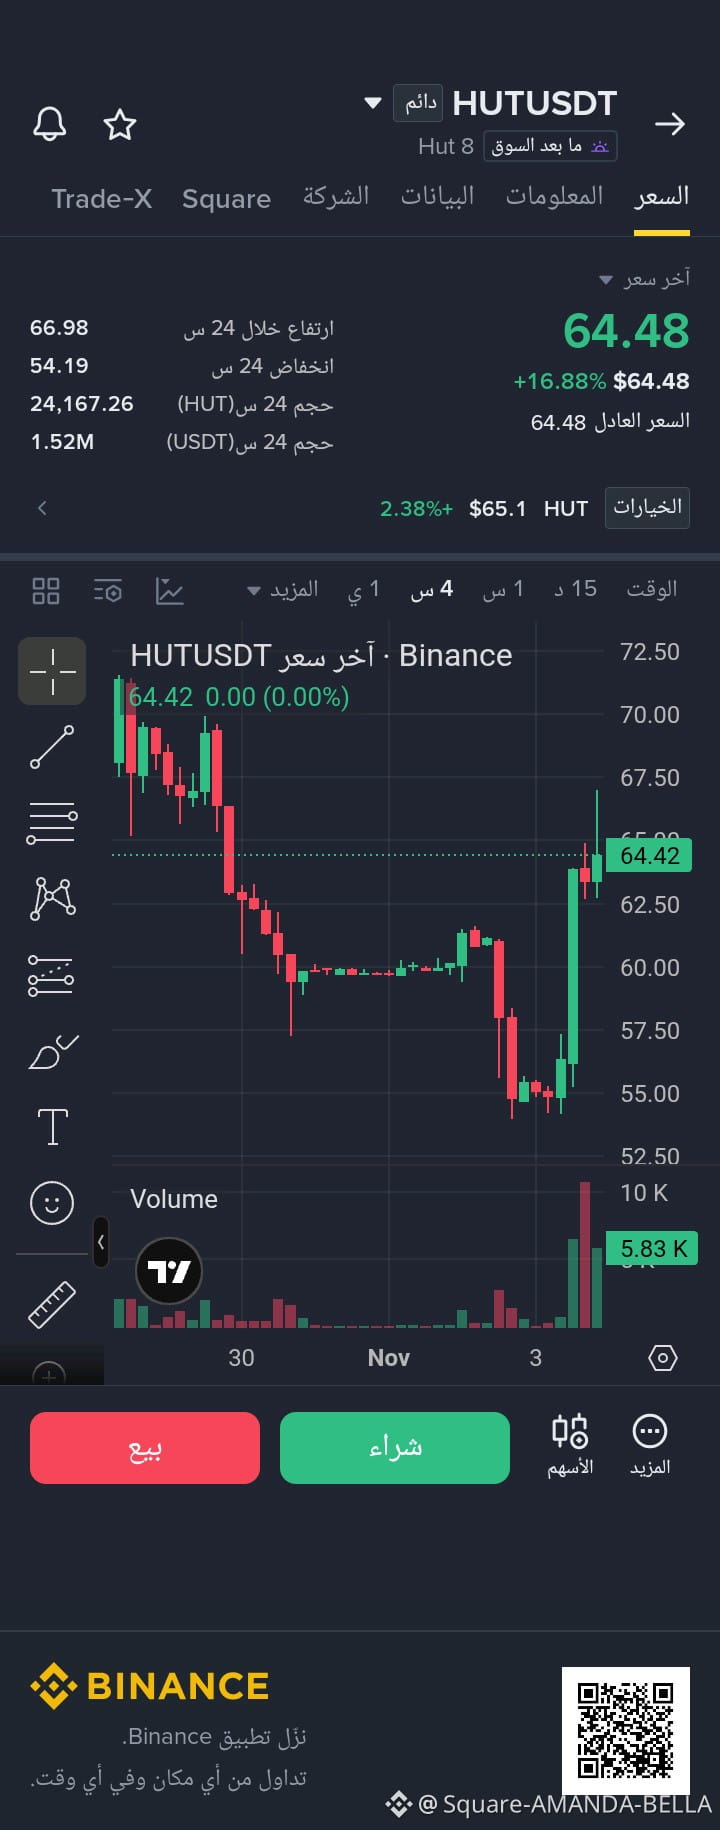
💥💥HUT at $64.48, surging 16.88% .. 💥💥
Coin $HUT now at $64.48 USD, +16.88% 🚀
24h high: $66.98 | 24h low: $54.19 | 24h volume: 24,167.26 HUT and 1.52M USDT
Chart volume: 5.83K then 10K — explosive volume not seen since October 30!
On the 4h timeframe, we can see a sharp drop from $72.50 to $57, followed by boring consolidation around $60 for several days, then a fake breakdown to $54 to hit stop-losses, followed by a rocket-like surge in two long candles from $54 to $66.80 (+22% in a few hours).
Trading plan:
1. Smart entry zone:
First entry: 63.00 - 64.50
Safer entry: 58.00 - 60.00
Support: $54.19
2. Targets:
Target 1: 66.98
Target 2: 70.00
Target 3: 72.50
3. Stop-loss:
4h close below 60.00.
#AMANDABELLA
#Hut8
#Nasdaq100EntersCorrection
{future}(HUTUSDT)
💥💥HUT at $64.48, surging 16.88% .. 💥💥
Coin $HUT now at $64.48 USD, +16.88% 🚀
24h high: $66.98 | 24h low: $54.19 | 24h volume: 24,167.26 HUT and 1.52M USDT
Chart volume: 5.83K then 10K — explosive volume not seen since October 30!
On the 4h timeframe, we can see a sharp drop from $72.50 to $57, followed by boring consolidation around $60 for several days, then a fake breakdown to $54 to hit stop-losses, followed by a rocket-like surge in two long candles from $54 to $66.80 (+22% in a few hours).
Trading plan:
1. Smart entry zone:
First entry: 63.00 - 64.50
Safer entry: 58.00 - 60.00
Support: $54.19
2. Targets:
Target 1: 66.98
Target 2: 70.00
Target 3: 72.50
3. Stop-loss:
4h close below 60.00.
#AMANDABELLA
#Hut8
#Nasdaq100EntersCorrection
Coin $HUT now at $64.48 USD, +16.88% 🚀
24h high: $66.98 | 24h low: $54.19 | 24h volume: 24,167.26 HUT and 1.52M USDT
Chart volume: 5.83K then 10K — explosive volume not seen since October 30!
On the 4h timeframe, we can see a sharp drop from $72.50 to $57, followed by boring consolidation around $60 for several days, then a fake breakdown to $54 to hit stop-losses, followed by a rocket-like surge in two long candles from $54 to $66.80 (+22% in a few hours).
Trading plan:
1. Smart entry zone:
First entry: 63.00 - 64.50
Safer entry: 58.00 - 60.00
Support: $54.19
2. Targets:
Target 1: 66.98
Target 2: 70.00
Target 3: 72.50
3. Stop-loss:
4h close below 60.00.
#AMANDABELLA
#Hut8
#Nasdaq100EntersCorrection
2
4
292
·
--
$TRB
{future}(TRBUSDT)
🔥🔥$TRB at $16.320 after a $14 drop... will it return to $21.947?🔥🔥
$TRB /USDT coin now at $16.320 +0.36%
24h high: $16.456 | 24h low: $15.935 | 24h volume: 138,302 TRB and 2.24M USDT
Chart volume: 571.85K, then 133.16K currently — an explosive candle!
On the 1-day timeframe, we see a strong rise in October from $16 to $21.947, followed by a sharp correction to $15.557 — a 9.17% drop in one day, opening at 17.349 and closing at 15.758 — then a hammer candle and a strong rebound to $16.320.
Performance: today +0.09%, stable; 7 days -5.42%, 30 days -20.13%, and 1 year -37.30%.
Trading plan:
1. Entry zone:
Ideal entry: 15.80 - 16.20
Safer entry: daily close above 16.456
Support: $15.557
2. Targets:
Target 1: 17.40
Target 2: 18.00
Target 3: 21.94
3. Stop loss:
Daily close below 15.20
#TRB走势预测
#AMANDABELLA
#FrenchAssemblyRejectsTwoCryptoExitTaxProposals
#BinanceHourlyDepositsExceedWithdrawals
#USOctoberNFP-AreRateCutsStillPossible
$TRB
🔥🔥$TRB at $16.320 after a $14 drop... will it return to $21.947?🔥🔥
$TRB /USDT coin now at $16.320 +0.36%
24h high: $16.456 | 24h low: $15.935 | 24h volume: 138,302 TRB and 2.24M USDT
Chart volume: 571.85K, then 133.16K currently — an explosive candle!
On the 1-day timeframe, we see a strong rise in October from $16 to $21.947, followed by a sharp correction to $15.557 — a 9.17% drop in one day, opening at 17.349 and closing at 15.758 — then a hammer candle and a strong rebound to $16.320.
Performance: today +0.09%, stable; 7 days -5.42%, 30 days -20.13%, and 1 year -37.30%.
Trading plan:
1. Entry zone:
Ideal entry: 15.80 - 16.20
Safer entry: daily close above 16.456
Support: $15.557
2. Targets:
Target 1: 17.40
Target 2: 18.00
Target 3: 21.94
3. Stop loss:
Daily close below 15.20
#TRB走势预测
#AMANDABELLA
#FrenchAssemblyRejectsTwoCryptoExitTaxProposals
#BinanceHourlyDepositsExceedWithdrawals
#USOctoberNFP-AreRateCutsStillPossible
🔥🔥$TRB at $16.320 after a $14 drop... will it return to $21.947?🔥🔥
$TRB /USDT coin now at $16.320 +0.36%
24h high: $16.456 | 24h low: $15.935 | 24h volume: 138,302 TRB and 2.24M USDT
Chart volume: 571.85K, then 133.16K currently — an explosive candle!
On the 1-day timeframe, we see a strong rise in October from $16 to $21.947, followed by a sharp correction to $15.557 — a 9.17% drop in one day, opening at 17.349 and closing at 15.758 — then a hammer candle and a strong rebound to $16.320.
Performance: today +0.09%, stable; 7 days -5.42%, 30 days -20.13%, and 1 year -37.30%.
Trading plan:
1. Entry zone:
Ideal entry: 15.80 - 16.20
Safer entry: daily close above 16.456
Support: $15.557
2. Targets:
Target 1: 17.40
Target 2: 18.00
Target 3: 21.94
3. Stop loss:
Daily close below 15.20
#TRB走势预测
#AMANDABELLA
#FrenchAssemblyRejectsTwoCryptoExitTaxProposals
#BinanceHourlyDepositsExceedWithdrawals
#USOctoberNFP-AreRateCutsStillPossible

1
3
218
·
--
$TUT
{future}(TUTUSDT)
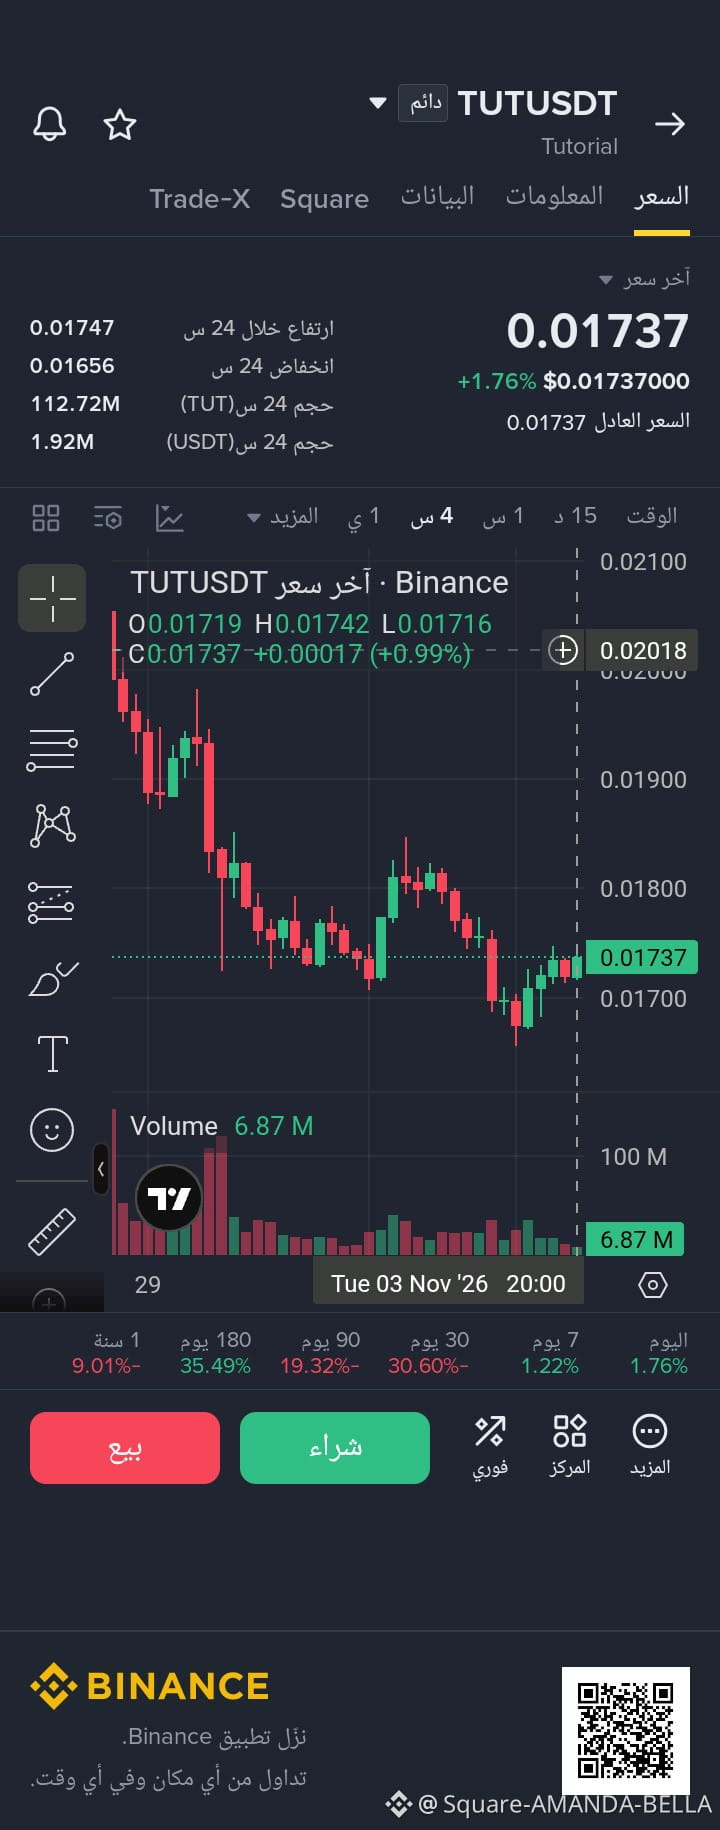
🔥$TUT at $0.01737 after a low of $0.01656... Is the 30% correction over, and has the reversal begun?🔥🔥
$TUT /USDT now at $0.01737, +1.76%
24h high: $0.01747 | 24h low: $0.01656 | 24h volume: 112.72M TUT and 1.92M USDT
Chart volume: 6.87M - the start of buying pressure!
The 4-hour chart tells the story: a sharp crash on October 29 from $0.02018 to $0.01700 on explosive selling volume of 100M+, followed by a bounce to $0.01850, then a second correction to $0.01670, forming a double bottom. Now a +0.99% candle has taken the price to $0.01737 - a clear accumulation move.
Performance: +1.76% today, +1.22% over 7 days, and +35.49% over 180 days! Despite being down 30.60% over 30 days, the coin remains bullish in the medium term.
Trading plan:
1. Entry zone:
Entry: 0.01700 - 0.01737
Confirmation entry: 4-hour close above 0.01742
2. Targets:
Target 1: 0.01850
Target 2: 0.01900
Target 3: 0.02018 - 0.02100
3. Stop-loss:
Daily close below 0.01650
#TUTAlpha
#AMANDABELLA
#Nasdaq100EntersCorrection
#BinanceHourlyDepositsExceedWithdrawals
#USOctoberNFP-AreRateCutsStillPossible
$TUT
🔥$TUT at $0.01737 after a low of $0.01656... Is the 30% correction over, and has the reversal begun?🔥🔥
$TUT /USDT now at $0.01737, +1.76%
24h high: $0.01747 | 24h low: $0.01656 | 24h volume: 112.72M TUT and 1.92M USDT
Chart volume: 6.87M - the start of buying pressure!
The 4-hour chart tells the story: a sharp crash on October 29 from $0.02018 to $0.01700 on explosive selling volume of 100M+, followed by a bounce to $0.01850, then a second correction to $0.01670, forming a double bottom. Now a +0.99% candle has taken the price to $0.01737 - a clear accumulation move.
Performance: +1.76% today, +1.22% over 7 days, and +35.49% over 180 days! Despite being down 30.60% over 30 days, the coin remains bullish in the medium term.
Trading plan:
1. Entry zone:
Entry: 0.01700 - 0.01737
Confirmation entry: 4-hour close above 0.01742
2. Targets:
Target 1: 0.01850
Target 2: 0.01900
Target 3: 0.02018 - 0.02100
3. Stop-loss:
Daily close below 0.01650
#TUTAlpha
#AMANDABELLA
#Nasdaq100EntersCorrection
#BinanceHourlyDepositsExceedWithdrawals
#USOctoberNFP-AreRateCutsStillPossible
🔥$TUT at $0.01737 after a low of $0.01656... Is the 30% correction over, and has the reversal begun?🔥🔥
$TUT /USDT now at $0.01737, +1.76%
24h high: $0.01747 | 24h low: $0.01656 | 24h volume: 112.72M TUT and 1.92M USDT
Chart volume: 6.87M - the start of buying pressure!
The 4-hour chart tells the story: a sharp crash on October 29 from $0.02018 to $0.01700 on explosive selling volume of 100M+, followed by a bounce to $0.01850, then a second correction to $0.01670, forming a double bottom. Now a +0.99% candle has taken the price to $0.01737 - a clear accumulation move.
Performance: +1.76% today, +1.22% over 7 days, and +35.49% over 180 days! Despite being down 30.60% over 30 days, the coin remains bullish in the medium term.
Trading plan:
1. Entry zone:
Entry: 0.01700 - 0.01737
Confirmation entry: 4-hour close above 0.01742
2. Targets:
Target 1: 0.01850
Target 2: 0.01900
Target 3: 0.02018 - 0.02100
3. Stop-loss:
Daily close below 0.01650
#TUTAlpha
#AMANDABELLA
#Nasdaq100EntersCorrection
#BinanceHourlyDepositsExceedWithdrawals
#USOctoberNFP-AreRateCutsStillPossible
3
145
·
--
$ADA
{future}(ADAUSDT)
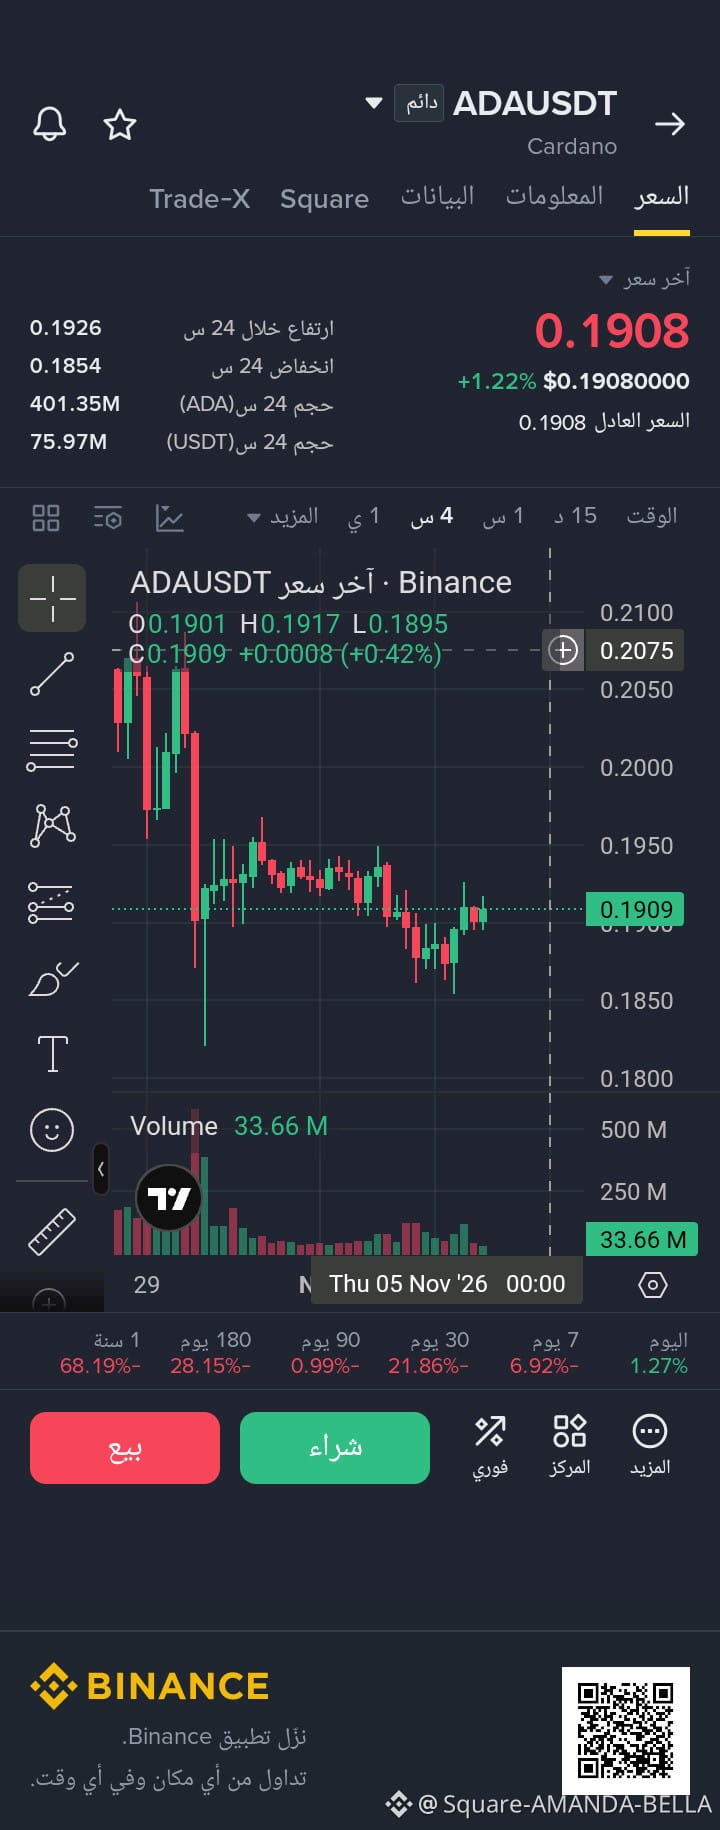
🔥🔥$ADA at $0.1908 after a low of $0.1854... Is the -68% correction over and an uptrend beginning?🔥🔥
$ADA /USDT now at $0.1908 +1.22%
24h high: $0.1926 | 24h low: $0.1854 | 24h volume: 401.35M ADA and 75.97M USDT
Chart volume: 33.66M - a rebound with real liquidity!
On the 4h timeframe, we see a sharp crash on October 29 from $0.2075 to $0.1820 on a candle with 500M+ volume, followed by sideways accumulation between $0.1900 and $0.1950 for days, then a fake dip to $0.1860 to trigger stop-losses. Now it has rebounded +0.42% to $0.1909.
Year-to-date performance is -68.19%, but over 90 days it is only -0.99%, meaning the bleeding has completely stopped. Today: +1.27%.
Trading plan:
1. Entry zone:
Ideal entry: 0.1880 - 0.1910
Confirmation entry: 4h close above 0.1917
2. Targets:
Target 1: 0.1950
Target 2: 0.2050
Target 3: 0.2075 - 0.2100
3. Stop-loss:
Daily close below 0.1840
#ADA!
#AMANDABELLA
#AppleReportsMixedResults
#Nasdaq100EntersCorrection
#USMidtermElections
$ADA
🔥🔥$ADA at $0.1908 after a low of $0.1854... Is the -68% correction over and an uptrend beginning?🔥🔥
$ADA /USDT now at $0.1908 +1.22%
24h high: $0.1926 | 24h low: $0.1854 | 24h volume: 401.35M ADA and 75.97M USDT
Chart volume: 33.66M - a rebound with real liquidity!
On the 4h timeframe, we see a sharp crash on October 29 from $0.2075 to $0.1820 on a candle with 500M+ volume, followed by sideways accumulation between $0.1900 and $0.1950 for days, then a fake dip to $0.1860 to trigger stop-losses. Now it has rebounded +0.42% to $0.1909.
Year-to-date performance is -68.19%, but over 90 days it is only -0.99%, meaning the bleeding has completely stopped. Today: +1.27%.
Trading plan:
1. Entry zone:
Ideal entry: 0.1880 - 0.1910
Confirmation entry: 4h close above 0.1917
2. Targets:
Target 1: 0.1950
Target 2: 0.2050
Target 3: 0.2075 - 0.2100
3. Stop-loss:
Daily close below 0.1840
#ADA!
#AMANDABELLA
#AppleReportsMixedResults
#Nasdaq100EntersCorrection
#USMidtermElections
🔥🔥$ADA at $0.1908 after a low of $0.1854... Is the -68% correction over and an uptrend beginning?🔥🔥
$ADA /USDT now at $0.1908 +1.22%
24h high: $0.1926 | 24h low: $0.1854 | 24h volume: 401.35M ADA and 75.97M USDT
Chart volume: 33.66M - a rebound with real liquidity!
On the 4h timeframe, we see a sharp crash on October 29 from $0.2075 to $0.1820 on a candle with 500M+ volume, followed by sideways accumulation between $0.1900 and $0.1950 for days, then a fake dip to $0.1860 to trigger stop-losses. Now it has rebounded +0.42% to $0.1909.
Year-to-date performance is -68.19%, but over 90 days it is only -0.99%, meaning the bleeding has completely stopped. Today: +1.27%.
Trading plan:
1. Entry zone:
Ideal entry: 0.1880 - 0.1910
Confirmation entry: 4h close above 0.1917
2. Targets:
Target 1: 0.1950
Target 2: 0.2050
Target 3: 0.2075 - 0.2100
3. Stop-loss:
Daily close below 0.1840
#ADA!
#AMANDABELLA
#AppleReportsMixedResults
#Nasdaq100EntersCorrection
#USMidtermElections
1
3
146
·
--
$ARB
{future}(ARBUSDT)
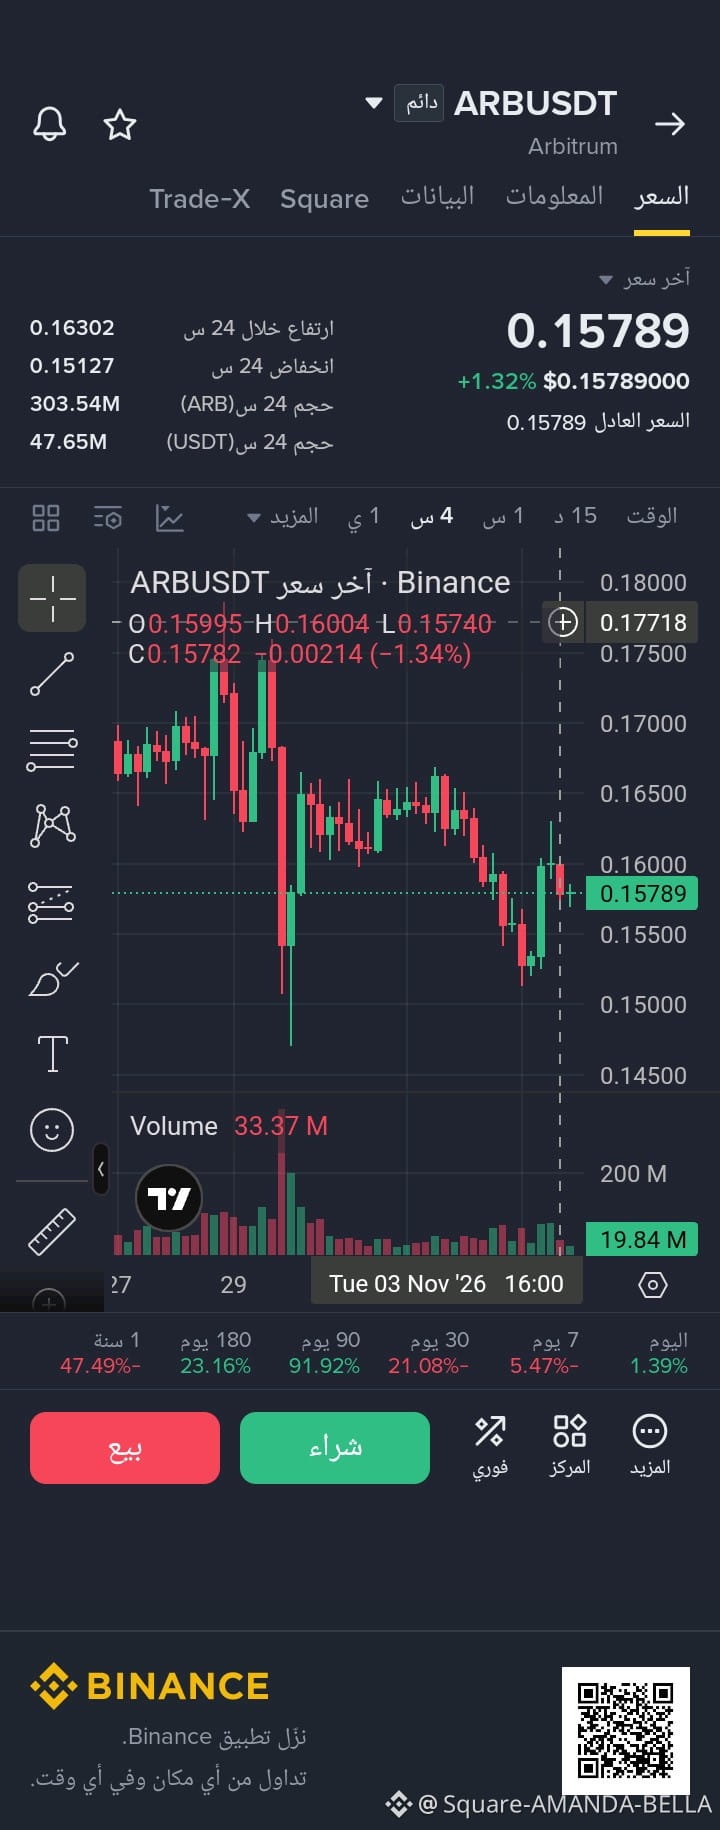
💥$ARB at $0.15789 after a low of $0.15127... Has the -47% correction ended and the explosion begun?💥💥
$ARB /USDT coin now at $0.15789 +1.32%
24h high: 0.16302$ | 24h low: 0.15127$ | Trading volume: 303.54M ARB and 47.65M USDT
Chart volume: 33.37M, then 19.84M currently — clear liquidity inflow!
On the 4-hour timeframe, we see a fake peak at 0.17718$ on October 29, followed by a collapse to 0.14700$ on a sell candle with 200M+ volume, then a double bottom at 0.15100$ and a rocket-like rebound to 0.16000$. Now it is consolidating at 0.15789$ -0.00214 (-1.34%) correction.
Yearly performance: -47.49%, but 180-day performance: +23.16%.
Trading plan:
1. Entry zone:
Ideal entry: 0.15500 - 0.15800
Confirmation entry: 4-hour close above 0.16004
2. Targets:
Target 1: 0.16302
Target 2: 0.17000
Target 3: 0.17718
3. Stop loss:
Daily close below 0.15000
#ARB🔥🔥🔥
#AMANDABELLA
#FrenchAssemblyRejectsTwoCryptoExitTaxProposals
#USMidtermElections
#Nasdaq100EntersCorrection
$ARB
💥$ARB at $0.15789 after a low of $0.15127... Has the -47% correction ended and the explosion begun?💥💥
$ARB /USDT coin now at $0.15789 +1.32%
24h high: 0.16302$ | 24h low: 0.15127$ | Trading volume: 303.54M ARB and 47.65M USDT
Chart volume: 33.37M, then 19.84M currently — clear liquidity inflow!
On the 4-hour timeframe, we see a fake peak at 0.17718$ on October 29, followed by a collapse to 0.14700$ on a sell candle with 200M+ volume, then a double bottom at 0.15100$ and a rocket-like rebound to 0.16000$. Now it is consolidating at 0.15789$ -0.00214 (-1.34%) correction.
Yearly performance: -47.49%, but 180-day performance: +23.16%.
Trading plan:
1. Entry zone:
Ideal entry: 0.15500 - 0.15800
Confirmation entry: 4-hour close above 0.16004
2. Targets:
Target 1: 0.16302
Target 2: 0.17000
Target 3: 0.17718
3. Stop loss:
Daily close below 0.15000
#ARB🔥🔥🔥
#AMANDABELLA
#FrenchAssemblyRejectsTwoCryptoExitTaxProposals
#USMidtermElections
#Nasdaq100EntersCorrection
💥$ARB at $0.15789 after a low of $0.15127... Has the -47% correction ended and the explosion begun?💥💥
$ARB /USDT coin now at $0.15789 +1.32%
24h high: 0.16302$ | 24h low: 0.15127$ | Trading volume: 303.54M ARB and 47.65M USDT
Chart volume: 33.37M, then 19.84M currently — clear liquidity inflow!
On the 4-hour timeframe, we see a fake peak at 0.17718$ on October 29, followed by a collapse to 0.14700$ on a sell candle with 200M+ volume, then a double bottom at 0.15100$ and a rocket-like rebound to 0.16000$. Now it is consolidating at 0.15789$ -0.00214 (-1.34%) correction.
Yearly performance: -47.49%, but 180-day performance: +23.16%.
Trading plan:
1. Entry zone:
Ideal entry: 0.15500 - 0.15800
Confirmation entry: 4-hour close above 0.16004
2. Targets:
Target 1: 0.16302
Target 2: 0.17000
Target 3: 0.17718
3. Stop loss:
Daily close below 0.15000
#ARB🔥🔥🔥
#AMANDABELLA
#FrenchAssemblyRejectsTwoCryptoExitTaxProposals
#USMidtermElections
#Nasdaq100EntersCorrection
1
2
115
·
--
$AGLD
{future}(AGLDUSDT)
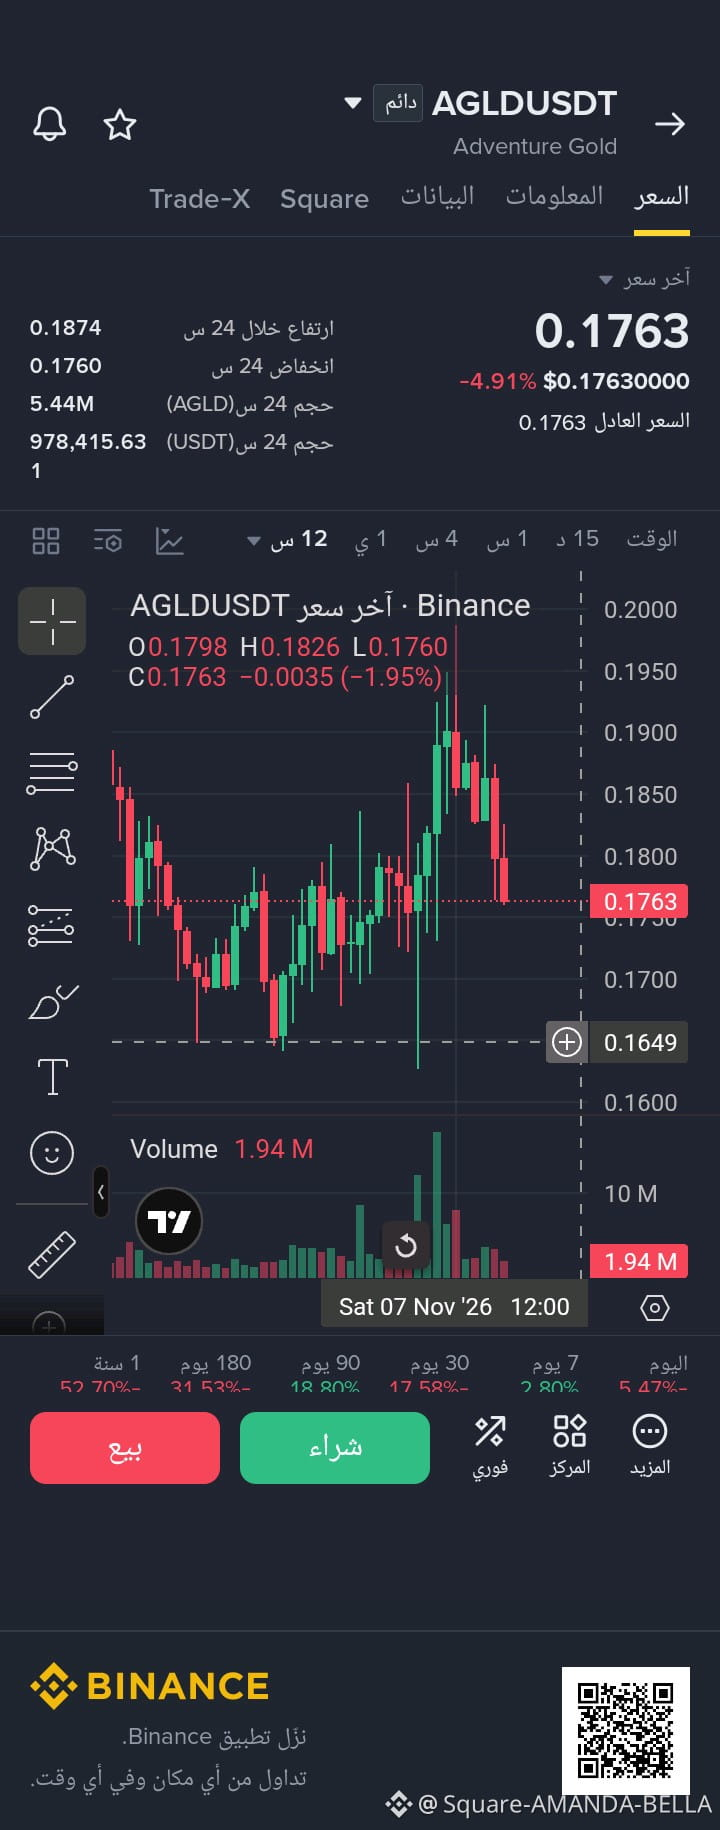
🚨🚨$AGLD drops to $0.1763 after failing to break above $0.1950... Is this the bottom to buy?🚨🚨
$AGLD USDT is now at $0.1763, down -4.91%
24h high: $0.1874 | 24h low: $0.1760 | Trading volume: 5.44M AGLD and 978K USDT
Chart volume: 1.94M with a -1.95% candle
On the 12-hour timeframe, we see a rise from a low of $0.1649 to a high of $0.1950, followed by a failed breakout and a current correction to $0.1763 — a correction after a +18% rise.
Performance: today -5.47%, 7 days -2.80%, 30 days -17.58%, and 1 year -52.70% — meaning the coin is at an all-time low!
Trading plan:
1. Entry zone:
First entry: 0.1740 - 0.1770
Safe entry: 0.1650 - 0.1680
Confirmation entry: 12-hour close above 0.1826
2. Targets:
Target 1: 0.1826
Target 2: 0.1874
Target 3: 0.1950 - 0.2000
3. Stop loss:
Daily close below 0.1630
#AGLD
#AMANDABELLA
#Nasdaq100EntersCorrection
#FrenchAssemblyRejectsTwoCryptoExitTaxProposals
#USOctoberNFP-AreRateCutsStillPossible
$AGLD
🚨🚨$AGLD drops to $0.1763 after failing to break above $0.1950... Is this the bottom to buy?🚨🚨
$AGLD USDT is now at $0.1763, down -4.91%
24h high: $0.1874 | 24h low: $0.1760 | Trading volume: 5.44M AGLD and 978K USDT
Chart volume: 1.94M with a -1.95% candle
On the 12-hour timeframe, we see a rise from a low of $0.1649 to a high of $0.1950, followed by a failed breakout and a current correction to $0.1763 — a correction after a +18% rise.
Performance: today -5.47%, 7 days -2.80%, 30 days -17.58%, and 1 year -52.70% — meaning the coin is at an all-time low!
Trading plan:
1. Entry zone:
First entry: 0.1740 - 0.1770
Safe entry: 0.1650 - 0.1680
Confirmation entry: 12-hour close above 0.1826
2. Targets:
Target 1: 0.1826
Target 2: 0.1874
Target 3: 0.1950 - 0.2000
3. Stop loss:
Daily close below 0.1630
#AGLD
#AMANDABELLA
#Nasdaq100EntersCorrection
#FrenchAssemblyRejectsTwoCryptoExitTaxProposals
#USOctoberNFP-AreRateCutsStillPossible
🚨🚨$AGLD drops to $0.1763 after failing to break above $0.1950... Is this the bottom to buy?🚨🚨
$AGLD USDT is now at $0.1763, down -4.91%
24h high: $0.1874 | 24h low: $0.1760 | Trading volume: 5.44M AGLD and 978K USDT
Chart volume: 1.94M with a -1.95% candle
On the 12-hour timeframe, we see a rise from a low of $0.1649 to a high of $0.1950, followed by a failed breakout and a current correction to $0.1763 — a correction after a +18% rise.
Performance: today -5.47%, 7 days -2.80%, 30 days -17.58%, and 1 year -52.70% — meaning the coin is at an all-time low!
Trading plan:
1. Entry zone:
First entry: 0.1740 - 0.1770
Safe entry: 0.1650 - 0.1680
Confirmation entry: 12-hour close above 0.1826
2. Targets:
Target 1: 0.1826
Target 2: 0.1874
Target 3: 0.1950 - 0.2000
3. Stop loss:
Daily close below 0.1630
#AGLD
#AMANDABELLA
#Nasdaq100EntersCorrection
#FrenchAssemblyRejectsTwoCryptoExitTaxProposals
#USOctoberNFP-AreRateCutsStillPossible
2
4
76
·
--
$CVC
{future}(CVCUSDT)
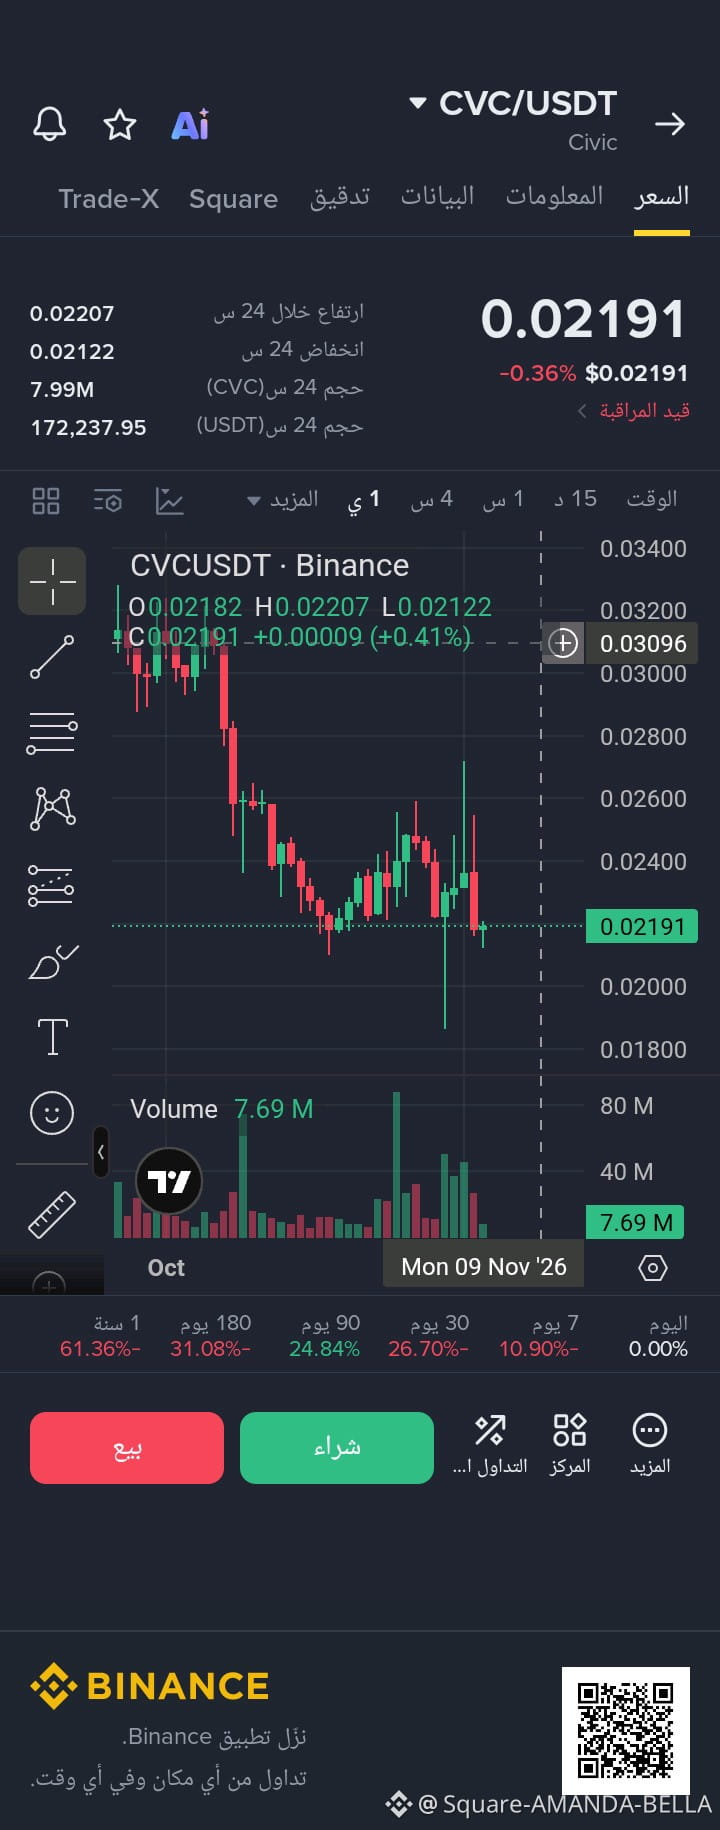
🔥🔥$CVC at $0.02191, down 61% from its low.. Is this an opportunity before the breakout?🔥🔥
$CVC /USDT coin Now $0.02191 -0.36%
24h high: $0.02207 | 24h low: $0.02122 | Trading volume: 7.99M CVC and 172K USDT
Chart volume: 7.69M - buying liquidity is starting to flow in!
On the 1-day timeframe, we can see a peak in October at $0.03096, followed by a sharp drop to a low of $0.01800 on high selling volume, then a strong rebound to $0.02700, and now a correction to $0.02191 with a +0.41% candle. This is forming a higher low.
Despite being down 61.36% over the year, the last 90 days are up 24.84%, meaning the reversal has begun.
Trading plan:
1. Entry zone:
Ideal entry: 0.02100 - 0.02200
Strong confirmation entry: daily close above 0.02400
3. Targets:
Target 1: 0.02450
Target 2: 0.02650
Target 3: 0.03096
4. Stop loss:
Daily close below 0.01950 - 0.02000
#CVC.智能策略库🏆🏆
#AMANDABELLA
#FrenchAssemblyRejectsTwoCryptoExitTaxProposals
#USOctoberNFP-AreRateCutsStillPossible
#BinanceHourlyDepositsExceedWithdrawals
$CVC
🔥🔥$CVC at $0.02191, down 61% from its low.. Is this an opportunity before the breakout?🔥🔥
$CVC /USDT coin Now $0.02191 -0.36%
24h high: $0.02207 | 24h low: $0.02122 | Trading volume: 7.99M CVC and 172K USDT
Chart volume: 7.69M - buying liquidity is starting to flow in!
On the 1-day timeframe, we can see a peak in October at $0.03096, followed by a sharp drop to a low of $0.01800 on high selling volume, then a strong rebound to $0.02700, and now a correction to $0.02191 with a +0.41% candle. This is forming a higher low.
Despite being down 61.36% over the year, the last 90 days are up 24.84%, meaning the reversal has begun.
Trading plan:
1. Entry zone:
Ideal entry: 0.02100 - 0.02200
Strong confirmation entry: daily close above 0.02400
3. Targets:
Target 1: 0.02450
Target 2: 0.02650
Target 3: 0.03096
4. Stop loss:
Daily close below 0.01950 - 0.02000
#CVC.智能策略库🏆🏆
#AMANDABELLA
#FrenchAssemblyRejectsTwoCryptoExitTaxProposals
#USOctoberNFP-AreRateCutsStillPossible
#BinanceHourlyDepositsExceedWithdrawals
🔥🔥$CVC at $0.02191, down 61% from its low.. Is this an opportunity before the breakout?🔥🔥
$CVC /USDT coin Now $0.02191 -0.36%
24h high: $0.02207 | 24h low: $0.02122 | Trading volume: 7.99M CVC and 172K USDT
Chart volume: 7.69M - buying liquidity is starting to flow in!
On the 1-day timeframe, we can see a peak in October at $0.03096, followed by a sharp drop to a low of $0.01800 on high selling volume, then a strong rebound to $0.02700, and now a correction to $0.02191 with a +0.41% candle. This is forming a higher low.
Despite being down 61.36% over the year, the last 90 days are up 24.84%, meaning the reversal has begun.
Trading plan:
1. Entry zone:
Ideal entry: 0.02100 - 0.02200
Strong confirmation entry: daily close above 0.02400
3. Targets:
Target 1: 0.02450
Target 2: 0.02650
Target 3: 0.03096
4. Stop loss:
Daily close below 0.01950 - 0.02000
#CVC.智能策略库🏆🏆
#AMANDABELLA
#FrenchAssemblyRejectsTwoCryptoExitTaxProposals
#USOctoberNFP-AreRateCutsStillPossible
#BinanceHourlyDepositsExceedWithdrawals
3
82
Log in to explore more content
Join global crypto users on Binance Square
⚡️ Get latest and useful information about crypto.
💬 Trusted by the world’s largest crypto exchange.
👍 Discover real insights from verified creators.
Email / Phone number
Trending Topics
1
#USPPIMissMayEaseBTCPressure
40,990 views
719 Discussing
2
#BitcoinCoreDisclosesTorTrafficVulnerability
15,773 views
374 Discussing
3
#WhatWillDriveCryptoandStocks’NextRebound?
149,477 views
1,585 Discussing
4
#BitcoinBreaksBelow200WeekMovingAverage
48,689 views
492 Discussing
5
#SpaceXTeslaMergerTalksWouldCombine30220BTC
15,614 views
263 Discussing
6
#Anthropic’s6xIPODemandSignalsPotentialRecordRaise
51,865 views
716 Discussing
7
#USCryptoETFsLose$1.48BInFiveDays
2,607 views
51 Discussing
8
#KoreaDigitalAssetBasicActFinalDraftExpectedEarlyJanuary
3,692 views
23 Discussing
9
#RippleRLUSDMarketCapSurpassesPayPalPYUSD
10,561 views
143 Discussing
10
#JaneStreetNearlyOctuplesFidelityBitcoinETFHoldings
22,531 views
247 Discussing