
#8
8
66,863 views
411 Discussing
Hot
Latest

💡 Important info: TRON is quietly holding its ground as the 8th largest coin in the world with a market cap of over 31 billion USD, while most of the market is still drowning in fear.
Details:
💰 Current TRX price: 0.3286 USD
📉 24h change: -0.89%
📈 7-day change: +3.33%
📊 24h volume: ~442 million USD
🏦 Market Cap: ~31.16 billion USD (ranked #8)
🔒 TVL on TRON: ~4.57 billion USD
💵 USDT on TRC20: accounts for a large portion of the 186 billion USD global market cap of USDT
⚡ Distance from ATH (0.4313 USD): -23.8%
Noteworthy:
TRON is currently the largest backbone for the USDT stablecoin, processing billions of transactions daily with nearly zero fees. As Ethereum fees skyrocket, stablecoin flows naturally shift to TRC20. This is the "golden goose" that few are paying attention to.
Looking ahead:
With a TVL of 4.57 billion USD and JustLend controlling over 3 billion, TRON has evolved from just a transfer network to a real DeFi ecosystem. In the context of extreme market fear (Fear & Greed Index = 23), TRX has only dipped slightly by 0.89% in 24h — showcasing strong support compared to many other altcoins.
Do you think TRX can hit its ATH of 0.43 USD again this year?
👉 Keep an eye on the market 24/7 — Follow the channel https://app.binance.com/uni-qr/cpro/Square-Creator-4a0f2008149d?l=en&r=BOZMO8A1
#TRX #TRON #CryptoNews #BinanceSquare $ETH
Details:
💰 Current TRX price: 0.3286 USD
📉 24h change: -0.89%
📈 7-day change: +3.33%
📊 24h volume: ~442 million USD
🏦 Market Cap: ~31.16 billion USD (ranked #8)
🔒 TVL on TRON: ~4.57 billion USD
💵 USDT on TRC20: accounts for a large portion of the 186 billion USD global market cap of USDT
⚡ Distance from ATH (0.4313 USD): -23.8%
Noteworthy:
TRON is currently the largest backbone for the USDT stablecoin, processing billions of transactions daily with nearly zero fees. As Ethereum fees skyrocket, stablecoin flows naturally shift to TRC20. This is the "golden goose" that few are paying attention to.
Looking ahead:
With a TVL of 4.57 billion USD and JustLend controlling over 3 billion, TRON has evolved from just a transfer network to a real DeFi ecosystem. In the context of extreme market fear (Fear & Greed Index = 23), TRX has only dipped slightly by 0.89% in 24h — showcasing strong support compared to many other altcoins.
Do you think TRX can hit its ATH of 0.43 USD again this year?
👉 Keep an eye on the market 24/7 — Follow the channel https://app.binance.com/uni-qr/cpro/Square-Creator-4a0f2008149d?l=en&r=BOZMO8A1
#TRX #TRON #CryptoNews #BinanceSquare $ETH

H How to play this segment? My answer is: only go long on pullbacks, don’t chase the price that just pumped up.
I’m setting my plan in stone, no changes during the session:
Entry looks to be in the range of `0.27169 - 0.27673`, with a stop-loss at `0.26376`, and targets up at `0.28538 / 0.29043 / 0.29692`.
Why this approach? — First, let's look at the time frame divergence. The 1h chart is currently at `+2.50%`, making a quick short-term jump; however, the 4h is at `-0.05%`, indicating that the mid-term hasn’t fully transitioned into a smooth uptrend yet. This setup feels more like '1-hour sprint, 4-hour confirmation'. Chasing high prices now doesn’t offer great risk-reward, so it’s better to wait for a pullback into the planned zone to grab a position; this makes stop-loss clearer and the risk-reward ratio more manageable.
On the data side, it’s leaning bullish but not extreme: Alpha Rank `#8`, Alpha24h `+9.20%`, futures 24h `+9.06%`, both spot and futures are moving in the same direction; 24h trading volume is `2176.26万`, providing liquidity to execute in batches. The risks to watch out for are in position sizing and fees: OI is `2.96亿` but down `-0.03%`, indicating that the new positions in this uptrend aren’t significant, so we need to monitor for continuation; funding is at `+0.0594%`, which is relatively high, meaning long positions are getting more expensive, and chasing orders could easily lead to a pullback. The conclusion is clear: execute with medium risk, only scale into longs within the range, and cut losses if it breaks `0.26376`.
Click here to place an order $H 👇
I’m setting my plan in stone, no changes during the session:
Entry looks to be in the range of `0.27169 - 0.27673`, with a stop-loss at `0.26376`, and targets up at `0.28538 / 0.29043 / 0.29692`.
Why this approach? — First, let's look at the time frame divergence. The 1h chart is currently at `+2.50%`, making a quick short-term jump; however, the 4h is at `-0.05%`, indicating that the mid-term hasn’t fully transitioned into a smooth uptrend yet. This setup feels more like '1-hour sprint, 4-hour confirmation'. Chasing high prices now doesn’t offer great risk-reward, so it’s better to wait for a pullback into the planned zone to grab a position; this makes stop-loss clearer and the risk-reward ratio more manageable.
On the data side, it’s leaning bullish but not extreme: Alpha Rank `#8`, Alpha24h `+9.20%`, futures 24h `+9.06%`, both spot and futures are moving in the same direction; 24h trading volume is `2176.26万`, providing liquidity to execute in batches. The risks to watch out for are in position sizing and fees: OI is `2.96亿` but down `-0.03%`, indicating that the new positions in this uptrend aren’t significant, so we need to monitor for continuation; funding is at `+0.0594%`, which is relatively high, meaning long positions are getting more expensive, and chasing orders could easily lead to a pullback. The conclusion is clear: execute with medium risk, only scale into longs within the range, and cut losses if it breaks `0.26376`.
Click here to place an order $H 👇
Don’t let intraday pullbacks scare you off. For this trade on H, I’m only looking to go long on the dips; if it breaks down, I’ll admit I was wrong.
HUSDT contract execution plan
- Direction: Long (buying on dips in batches)
- Entry range: 0.24615 - 0.25171
- Stop-loss: 0.23742
- Target 1: 0.26124
- Target 2: 0.26680
- Target 3: 0.27394
This trade is based on the "odds of a strong asset recovering after a pullback," not just blindly catching the bottom. Alpha rank #8, Alpha 24h +11.55%, contract 24h +11.51%, with spot and contract gains moving in sync, still showing directional consistency; however, 1h -1.68%, 4h -3.26%, indicating short-term pullback, so it’s better to wait for the range to hold before jumping in, no chasing highs. OI at 286 million, 24h about -0.00%, implying overall positions are stable, and I haven’t seen any crowded leverage getting out of hand; 24h trading volume at 34.755 million, plenty of liquidity for batching. Note that funding is +0.0459% which is on the high side, meaning long positions have a steep cost; if the price doesn’t pump soon, the pullback could intensify, which is why the stop-loss is set at 0.23742. Risk rating: medium; if the stop-loss level is breached, this long logic goes out the window.
Click here to open a position on $H 👇
HUSDT contract execution plan
- Direction: Long (buying on dips in batches)
- Entry range: 0.24615 - 0.25171
- Stop-loss: 0.23742
- Target 1: 0.26124
- Target 2: 0.26680
- Target 3: 0.27394
This trade is based on the "odds of a strong asset recovering after a pullback," not just blindly catching the bottom. Alpha rank #8, Alpha 24h +11.55%, contract 24h +11.51%, with spot and contract gains moving in sync, still showing directional consistency; however, 1h -1.68%, 4h -3.26%, indicating short-term pullback, so it’s better to wait for the range to hold before jumping in, no chasing highs. OI at 286 million, 24h about -0.00%, implying overall positions are stable, and I haven’t seen any crowded leverage getting out of hand; 24h trading volume at 34.755 million, plenty of liquidity for batching. Note that funding is +0.0459% which is on the high side, meaning long positions have a steep cost; if the price doesn’t pump soon, the pullback could intensify, which is why the stop-loss is set at 0.23742. Risk rating: medium; if the stop-loss level is breached, this long logic goes out the window.
Click here to open a position on $H 👇

The 15-minute candle just now directly dumped below the lower edge of nearly 20 five-minute candles. A structure like $PUMP is enough to make anyone's head spin.
What really caught my attention wasn't how much it fell, but the change in positioning behind it — OI is rising while price is moving down, which clearly means new leveraged shorts are hitting it. And the spot buy-sell ratio is 0.73, so aggressive selling pressure is overwhelmingly dominant; this isn't the kind of false breakdown. Funding rates are still high, which means longs are still holding on. In a market like this, if you don't cut losses, it becomes a slow grind that wears you down.
Overall pool anomaly rank #11, notional change rank #8 — this kind of depth-confirmed abnormal move is worth keeping on the radar. That said, Pump-type names are highly elastic, and now that it's broken support, we'll have to see whether this is a fake drop or the real thing. If it quickly reclaims above the lower edge later, then the short-term bears should actually start getting nervous.
Don't rush to chase the direction; wait for the next confirmation.
What really caught my attention wasn't how much it fell, but the change in positioning behind it — OI is rising while price is moving down, which clearly means new leveraged shorts are hitting it. And the spot buy-sell ratio is 0.73, so aggressive selling pressure is overwhelmingly dominant; this isn't the kind of false breakdown. Funding rates are still high, which means longs are still holding on. In a market like this, if you don't cut losses, it becomes a slow grind that wears you down.
Overall pool anomaly rank #11, notional change rank #8 — this kind of depth-confirmed abnormal move is worth keeping on the radar. That said, Pump-type names are highly elastic, and now that it's broken support, we'll have to see whether this is a fake drop or the real thing. If it quickly reclaims above the lower edge later, then the short-term bears should actually start getting nervous.
Don't rush to chase the direction; wait for the next confirmation.

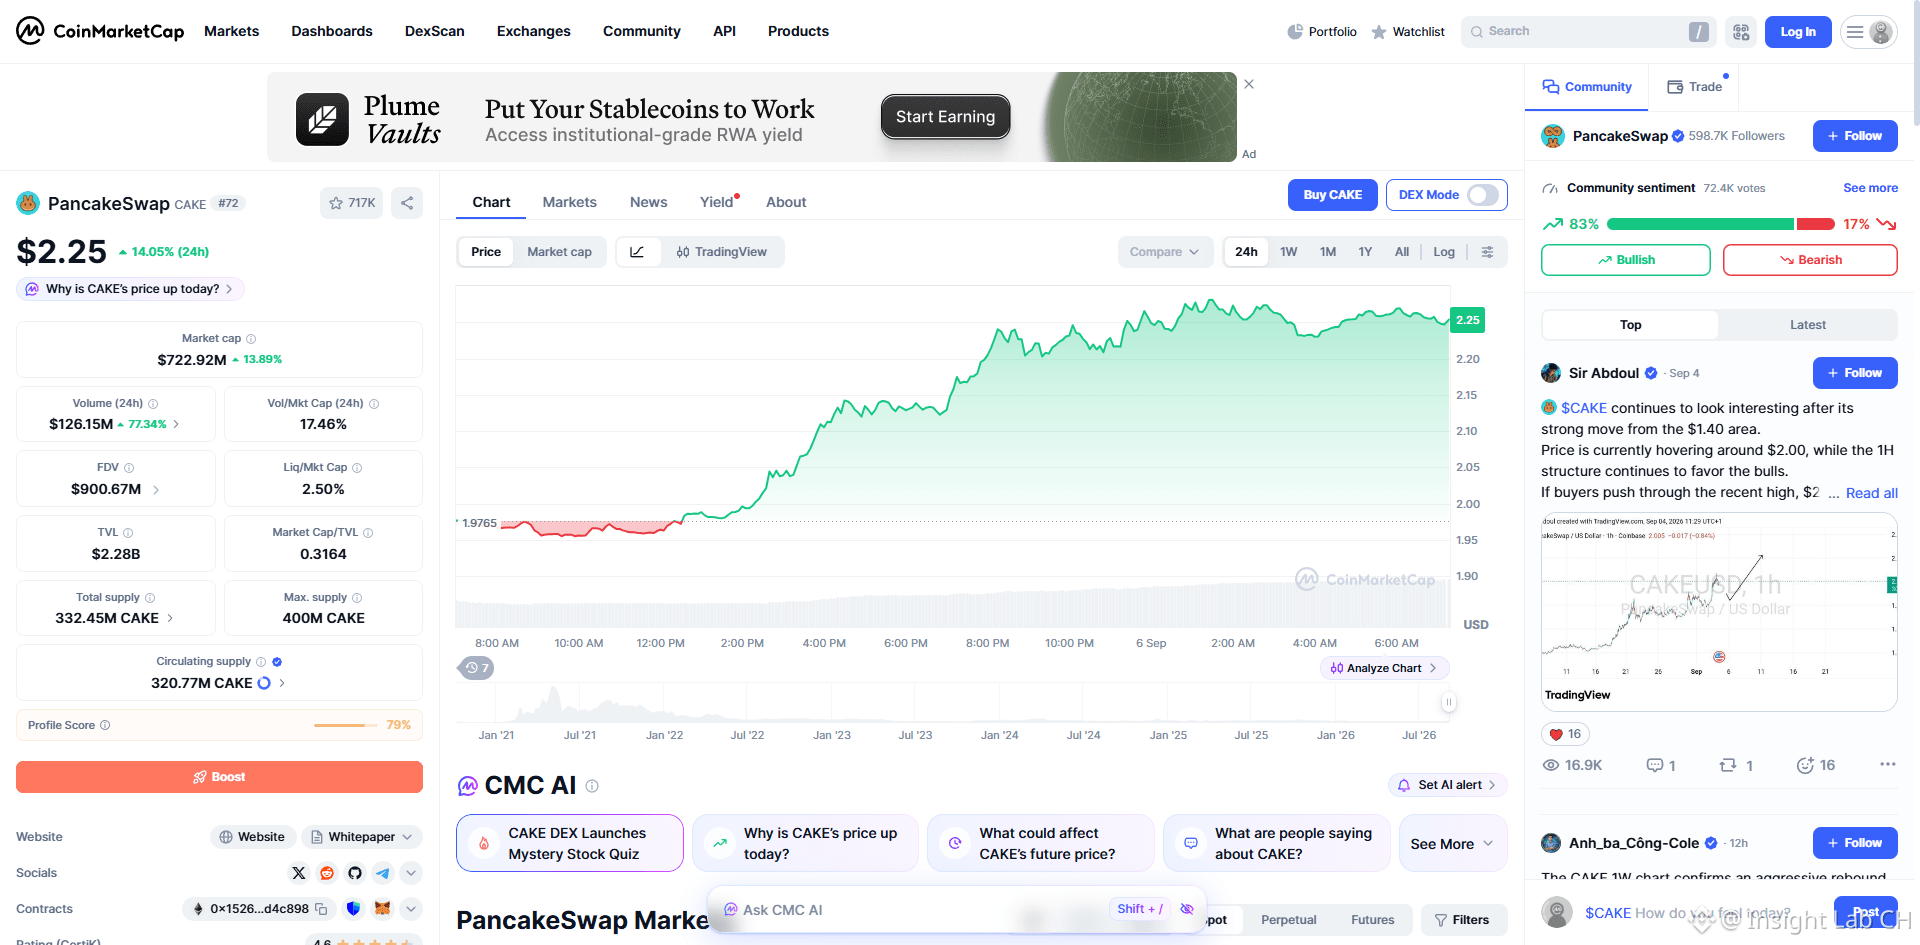
Data shows that $CAKE currently ranks #8 th on CoinMarketCap's trending list. Against the backdrop of persistently tight macro liquidity, the short-term popularity of the DEX sector can hardly conceal the reality of cooling on-chain activity overall. Investors should beware of the correction risk after sentiment fades. #DeFi

See translation
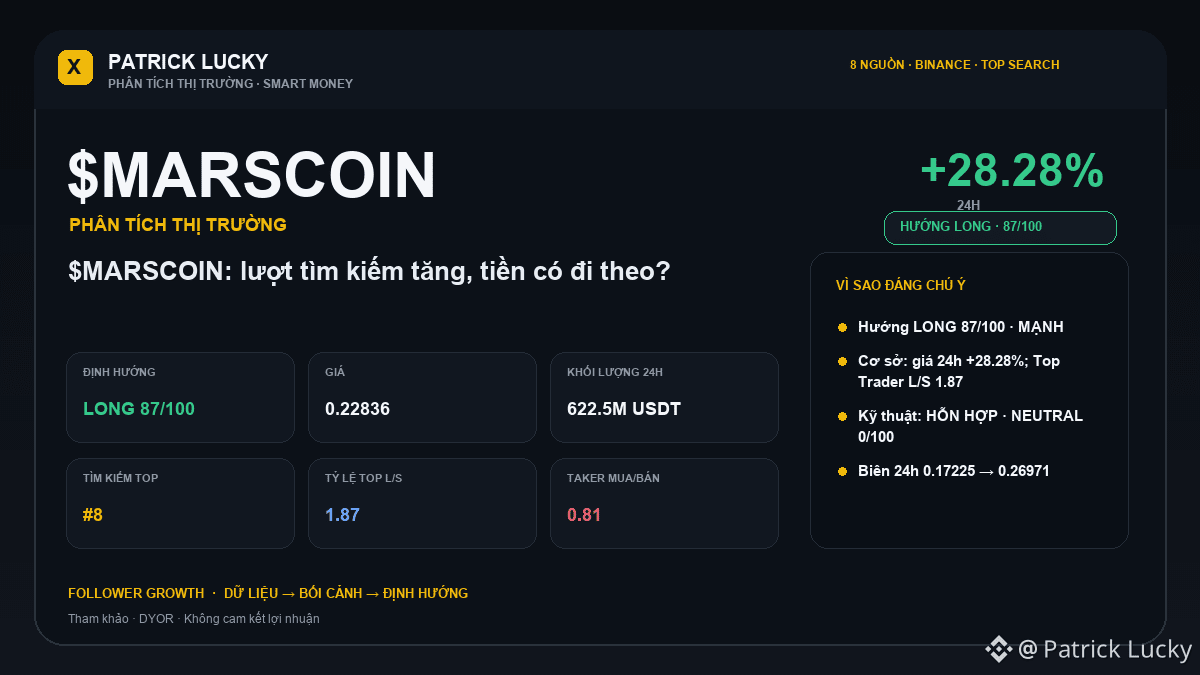
🔎 $MARSCOIN đang xuất hiện trong nhóm được tìm kiếm nhiều trên Binance (#8) — đây là tín hiệu về mức quan tâm, chưa phải tín hiệu mua.
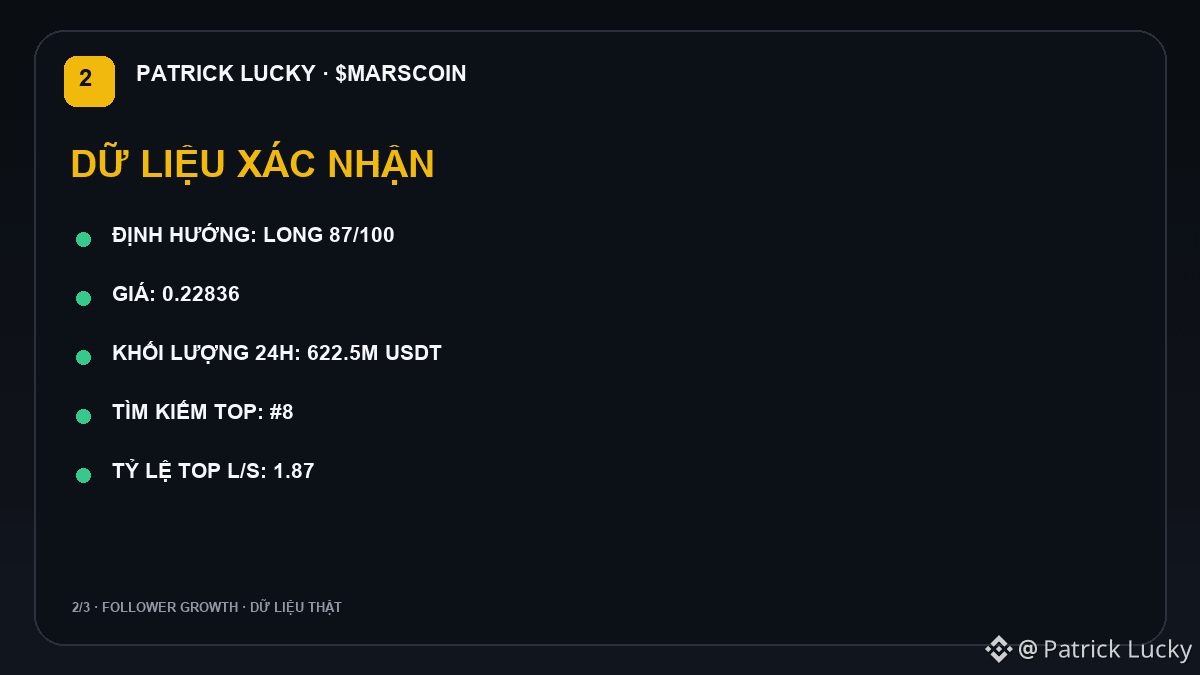
Thị trường: 0.22836 · 24h +28.28% · khối lượng ~622.5M USDT · 9,647,691 giao dịch.
Điểm quan tâm người dùng: 90/100.
Nếu mức quan tâm chuyển thành giao dịch thực: Vượt 0.26971 với khối lượng mở rộng sẽ làm kịch bản tiếp diễn đáng tin hơn.
Nếu lượt tìm kiếm tăng nhưng thị trường không xác nhận: Không giữ được vùng cao và rơi lại dưới trung điểm 0.22098 sẽ làm kịch bản hạ nhiệt rõ hơn.
🎯 Xu hướng ưu tiên: **LONG · MẠNH · 87/100**.
Cơ sở chính: giá 24h +28.28%; Top Trader L/S 1.87; mạnh hơn BTC +27.72 điểm %.
Xác nhận thêm khi: giữ trên 0.22098 và vượt 0.26971 với khối lượng/dòng tiền tiếp tục xác nhận.
Hạ/hủy định hướng nếu: mất 0.22098 kèm taker/dòng tiền Leader suy yếu.
💬 Với $MARSCOIN , anh/chị đang đặt trọng số cao hơn cho giá/khối lượng hay dòng tiền/định vị?
⚠️ Phân tích thị trường mang tính tham khảo, không phải cam kết lợi nhuận. Mỗi người tự nghiên cứu (DYOR), tự quản trị rủi ro và tự chịu trách nhiệm với quyết định giao dịch.
$MARSCOIN $BTC
Thị trường: 0.22836 · 24h +28.28% · khối lượng ~622.5M USDT · 9,647,691 giao dịch.
Điểm quan tâm người dùng: 90/100.
Nếu mức quan tâm chuyển thành giao dịch thực: Vượt 0.26971 với khối lượng mở rộng sẽ làm kịch bản tiếp diễn đáng tin hơn.
Nếu lượt tìm kiếm tăng nhưng thị trường không xác nhận: Không giữ được vùng cao và rơi lại dưới trung điểm 0.22098 sẽ làm kịch bản hạ nhiệt rõ hơn.
🎯 Xu hướng ưu tiên: **LONG · MẠNH · 87/100**.
Cơ sở chính: giá 24h +28.28%; Top Trader L/S 1.87; mạnh hơn BTC +27.72 điểm %.
Xác nhận thêm khi: giữ trên 0.22098 và vượt 0.26971 với khối lượng/dòng tiền tiếp tục xác nhận.
Hạ/hủy định hướng nếu: mất 0.22098 kèm taker/dòng tiền Leader suy yếu.
💬 Với $MARSCOIN , anh/chị đang đặt trọng số cao hơn cho giá/khối lượng hay dòng tiền/định vị?
⚠️ Phân tích thị trường mang tính tham khảo, không phải cam kết lợi nhuận. Mỗi người tự nghiên cứu (DYOR), tự quản trị rủi ro và tự chịu trách nhiệm với quyết định giao dịch.
$MARSCOIN $BTC


CAKE’s 15-minute candlestick is quite interesting. Volume has surged to more than four times the normal level, and price has simultaneously broken above the upper edge of the past 20 candlesticks. OI is also expanding in sync, and both the 15m and 1h contract metrics are showing positive growth — this is not the kind of quick pump-and-dump setup that yanks the ladder away after a short trade. It is genuine new leveraged longs stepping in to take positions.
Looking further into the details, the funding rate has already moved into a recent high percentile, which indicates that long sentiment is getting a bit overheated. But the active buy-sell gap is still holding at a positive 21.8%, with a buy/sell ratio of 1.56. Combined with the notional change surging into the abnormal percentile of the entire pool at #8 , the market structure is at least still under the control of bulls for now.
That said, this kind of dual high-level setup — price near an extreme historical range plus funding rates running hot — often also means the risk of a final push is building up. The rise is real; the overheating is also real. Those already in positions should watch whether price can hold above this breakout level. For those still flat, chasing here is no longer about value for money; it is about whether you are willing to sit in the passenger seat while someone else floors it.
Looking further into the details, the funding rate has already moved into a recent high percentile, which indicates that long sentiment is getting a bit overheated. But the active buy-sell gap is still holding at a positive 21.8%, with a buy/sell ratio of 1.56. Combined with the notional change surging into the abnormal percentile of the entire pool at #8 , the market structure is at least still under the control of bulls for now.
That said, this kind of dual high-level setup — price near an extreme historical range plus funding rates running hot — often also means the risk of a final push is building up. The rise is real; the overheating is also real. Those already in positions should watch whether price can hold above this breakout level. For those still flat, chasing here is no longer about value for money; it is about whether you are willing to sit in the passenger seat while someone else floors it.
$UAI Is this another big one brewing?
On the 15-minute timeframe, it directly broke through the recent range high, and the closing price climbed above the ceiling of the 20 most recent 5-minute candles. Volume simultaneously expanded to 2.44x, and volatility percentile jumped to 96%+.
More importantly — 1-hour notional positions surged 8.32%, while the 15-minute move only rose 3.59%. This kind of structure, where price and OI rise together, is not short covering; it’s truly new leveraged longs entering and competing for accumulation. Aggressive buying is -7.6%, and the bid-ask ratio is 1.17, with the direction being obvious at a glance.
Trading volume confirmed the breakout’s validity, and abnormal funding rates and OI continued across multiple timeframes... This is not a lone candle move, but a trend with continuity.
But I’d advise you not to rush into an all-in gamble. This thing has already run to the front of the abnormal full pool rankings (#8), and someone may start taking profits at any moment. Leverage is a double-edged sword: it enters fast, and it exits violently.
Today’s script is either an accelerator for the trend, or a hunter’s trap against it. It’s up to you which side you stand on.
#币安合约 #UAI #Breakout Trading
On the 15-minute timeframe, it directly broke through the recent range high, and the closing price climbed above the ceiling of the 20 most recent 5-minute candles. Volume simultaneously expanded to 2.44x, and volatility percentile jumped to 96%+.
More importantly — 1-hour notional positions surged 8.32%, while the 15-minute move only rose 3.59%. This kind of structure, where price and OI rise together, is not short covering; it’s truly new leveraged longs entering and competing for accumulation. Aggressive buying is -7.6%, and the bid-ask ratio is 1.17, with the direction being obvious at a glance.
Trading volume confirmed the breakout’s validity, and abnormal funding rates and OI continued across multiple timeframes... This is not a lone candle move, but a trend with continuity.
But I’d advise you not to rush into an all-in gamble. This thing has already run to the front of the abnormal full pool rankings (#8), and someone may start taking profits at any moment. Leverage is a double-edged sword: it enters fast, and it exits violently.
Today’s script is either an accelerator for the trend, or a hunter’s trap against it. It’s up to you which side you stand on.
#币安合约 #UAI #Breakout Trading

The 15-minute line of $MAGMA shot straight up, +18.6%. Volume surged to more than 3 times the usual level, and by the close it had even broken through the upper range of the last 20 five-minute candles.
But interestingly, OI did not rise along with it; contracts actually shrank by 1.49%. This kind of price-up, position-down structure looks more like shorts covering than new longs driving the move. In other words, the sustainability of this rally is questionable, so keep an eye on it.
Looking at the order book, aggressive trades were lower by 6.8%, with buy-side slightly dominant, but not overwhelmingly so. MAGMA has now reached the vicinity of its own historical extreme range; it ranks #11 in overall anomaly level and #8 in notional change, which is indeed eye-catching. However, chasing at this level is easy to get punished.
Best to observe for now and wait for a pullback confirmation before saying more. Don’t mistake short covering for a trend reversal.
But interestingly, OI did not rise along with it; contracts actually shrank by 1.49%. This kind of price-up, position-down structure looks more like shorts covering than new longs driving the move. In other words, the sustainability of this rally is questionable, so keep an eye on it.
Looking at the order book, aggressive trades were lower by 6.8%, with buy-side slightly dominant, but not overwhelmingly so. MAGMA has now reached the vicinity of its own historical extreme range; it ranks #11 in overall anomaly level and #8 in notional change, which is indeed eye-catching. However, chasing at this level is easy to get punished.
Best to observe for now and wait for a pullback confirmation before saying more. Don’t mistake short covering for a trend reversal.

Zcash ($ZEC ) Gains Momentum Despite Market Downturn
Zcash ($ZEC ) is trending at #8, despite a 4.52% dip in the last 24 hours. The coin's robust privacy features and recent protocol upgrades are driving interest. With a market cap rank of 11 and a 24h volume of $1.2B, $ZEC is showing strong liquidity and community support. Traders should keep an eye on the ongoing development of its privacy tech, which could attract more institutional investors. ⚡
Follow for more setups like this.
#HahaProfit #Zcash
Zcash ($ZEC ) is trending at #8, despite a 4.52% dip in the last 24 hours. The coin's robust privacy features and recent protocol upgrades are driving interest. With a market cap rank of 11 and a 24h volume of $1.2B, $ZEC is showing strong liquidity and community support. Traders should keep an eye on the ongoing development of its privacy tech, which could attract more institutional investors. ⚡
Follow for more setups like this.
#HahaProfit #Zcash

Arbitrum Gains Momentum: What’s Driving $ARB ?
Arbitrum is making waves with a 4.65% 24h gain, ranking #8 in trending coins. The Layer 2 solution is seeing strong volume at $300M, driven by its growing ecosystem and robust developer activity. As more dApps and users migrate to Arbitrum for lower fees and faster transactions, $ARB is positioned to benefit from increased adoption. Keep an eye on this network’s expansion and community engagement. ⚡
Follow for daily crypto updates.
#DeGenYuv #Arbitrum
Arbitrum is making waves with a 4.65% 24h gain, ranking #8 in trending coins. The Layer 2 solution is seeing strong volume at $300M, driven by its growing ecosystem and robust developer activity. As more dApps and users migrate to Arbitrum for lower fees and faster transactions, $ARB is positioned to benefit from increased adoption. Keep an eye on this network’s expansion and community engagement. ⚡
Follow for daily crypto updates.
#DeGenYuv #Arbitrum

Ethereum ($ETH ) Stays in the Spotlight Amid Market Downturn
Ethereum ($ETH ) is holding its ground at $2,372 despite a 3.18% dip in the last 24 hours. The second-largest crypto by market cap is trending at #8 with a strong volume of $9.71B. Traders are watching $ETH closely as it maintains its position amid broader market volatility. With ongoing developments in the Ethereum ecosystem, including potential upgrades and DeFi innovations, $ETH remains a key player to follow. ⚠️
Follow for more crypto setups.
#HahaProfit #Ethereum
Ethereum ($ETH ) is holding its ground at $2,372 despite a 3.18% dip in the last 24 hours. The second-largest crypto by market cap is trending at #8 with a strong volume of $9.71B. Traders are watching $ETH closely as it maintains its position amid broader market volatility. With ongoing developments in the Ethereum ecosystem, including potential upgrades and DeFi innovations, $ETH remains a key player to follow. ⚠️
Follow for more crypto setups.
#HahaProfit #Ethereum

$CHIP This move has some real substance.
In 15 minutes it went straight up 2.53%, with volume surging to more than 5x. This isn’t the kind of breakout that’s on shrinking volume and just a fake move—it’s a genuine, money-backed breakout. The price also managed to reach above the boundary of the recent K-line range, so at least directionally there’s no ambiguity.
What’s even more interesting is the OI side—on the 1h contracts, open interest is up 1%+; the notional change is also up by about 4 points. The percentile has pushed directly to 94.6%, and the entire pool can rank it at #8. This structure doesn’t really look like old longs adding for a bet on a second wave. It looks more like new leveraged positions are entering the arena to raise the flag. The aggressive trade ratio is also in a favorable position, and the short-term sentiment is clearly being controlled by the bullish side.
Of course, the closer you get to historical extreme levels, the more you need to stay alert—after all, the funding/fee rates are already high. Chasing longs from this spot will only get more and more expensive. Sure, if someone is willing to use leverage at this level to show confidence in the outlook, that’s fine—but if things really turn around, the resulting stampede won’t be gentle.
In short: the bias is bullish, no problem—just remember you’re here to trade, not to stand guard.
In 15 minutes it went straight up 2.53%, with volume surging to more than 5x. This isn’t the kind of breakout that’s on shrinking volume and just a fake move—it’s a genuine, money-backed breakout. The price also managed to reach above the boundary of the recent K-line range, so at least directionally there’s no ambiguity.
What’s even more interesting is the OI side—on the 1h contracts, open interest is up 1%+; the notional change is also up by about 4 points. The percentile has pushed directly to 94.6%, and the entire pool can rank it at #8. This structure doesn’t really look like old longs adding for a bet on a second wave. It looks more like new leveraged positions are entering the arena to raise the flag. The aggressive trade ratio is also in a favorable position, and the short-term sentiment is clearly being controlled by the bullish side.
Of course, the closer you get to historical extreme levels, the more you need to stay alert—after all, the funding/fee rates are already high. Chasing longs from this spot will only get more and more expensive. Sure, if someone is willing to use leverage at this level to show confidence in the outlook, that’s fine—but if things really turn around, the resulting stampede won’t be gentle.
In short: the bias is bullish, no problem—just remember you’re here to trade, not to stand guard.
$GIGGLE This move has some substance.
In just 15 minutes, it broke through the upper bound of an interval of nearly 20 5-minute K-lines, with volume and liquidity at 2.24 times the usual—active buy orders were up 9.6%, and the buy order ratio is 1.21. This isn’t just messing around.
But what’s interesting is that the OI is actually falling while nominal changes rise sharply. This “price up, positions down” structure looks more like short covering driving the move, not new long entries. Funds that don’t understand easily chase the price up; in reality, this move should be using a rebound as fuel, not a trend starting.
The funding rate is also at a high percentile recently, and market sentiment is overheated—there’s too much short-term premium, so be careful about a reversal.
Anyway, for an abnormal asset like GIGGLE, the persistence is worth watching; but even more worth watching is how fast it’s getting into the rankings. In the whole pool #8, it’s been extending across consecutive periods. Signals at this “background audio” level are meant to be monitored intraday, not something you act on impulsively.
> I’m not recommending chasing longs—just that this structure is worth noting.
#GIGGLE #合约观察 #short covering
In just 15 minutes, it broke through the upper bound of an interval of nearly 20 5-minute K-lines, with volume and liquidity at 2.24 times the usual—active buy orders were up 9.6%, and the buy order ratio is 1.21. This isn’t just messing around.
But what’s interesting is that the OI is actually falling while nominal changes rise sharply. This “price up, positions down” structure looks more like short covering driving the move, not new long entries. Funds that don’t understand easily chase the price up; in reality, this move should be using a rebound as fuel, not a trend starting.
The funding rate is also at a high percentile recently, and market sentiment is overheated—there’s too much short-term premium, so be careful about a reversal.
Anyway, for an abnormal asset like GIGGLE, the persistence is worth watching; but even more worth watching is how fast it’s getting into the rankings. In the whole pool #8, it’s been extending across consecutive periods. Signals at this “background audio” level are meant to be monitored intraday, not something you act on impulsively.
> I’m not recommending chasing longs—just that this structure is worth noting.
#GIGGLE #合约观察 #short covering
Why $PENGU is Dominating the Spotlight Right Now 🐧
$PENGU is securing its spot as a top-trending asset, currently sitting at #8 on the trending list. While the broader market experiences some cooling off, this community-driven giant is capturing massive trader attention with over $51 million in 24-hour volume. Pudgy Penguins has successfully bridged the gap between Web3 culture and mainstream retail, proving that its ecosystem holds serious staying power beyond typical NFT hype. As liquidity rotates, smart money is keeping a very close eye on how $PENGU consolidates at these levels. The volume speaks for itself—the market is actively watching this one for its next major expansion phase. 👀
Follow for more setups like this.
#DeGenYuv #PudgyPenguins
$PENGU is securing its spot as a top-trending asset, currently sitting at #8 on the trending list. While the broader market experiences some cooling off, this community-driven giant is capturing massive trader attention with over $51 million in 24-hour volume. Pudgy Penguins has successfully bridged the gap between Web3 culture and mainstream retail, proving that its ecosystem holds serious staying power beyond typical NFT hype. As liquidity rotates, smart money is keeping a very close eye on how $PENGU consolidates at these levels. The volume speaks for itself—the market is actively watching this one for its next major expansion phase. 👀
Follow for more setups like this.
#DeGenYuv #PudgyPenguins

Contract trades are 2.4 times that of the spot, but the funding rate is only at +0.0050%. This is exactly the most interesting part of what’s on the leaderboard today, $MIRA .
Spot 24h volume is $2.54M, while futures are $6.13M. The price is $0.0455, with intraday high/low of $0.04614 / $0.04072, and the 24h gain is 10.04%. Based on this structure, what’s pushing it onto the spot gainers list #8 and the futures gainers list #13 is not just aggressive one-sided chasing. It looks more like short-term funds first lift futures momentum, but bullish sentiment hasn’t gotten out of control yet. The funding rate hasn’t spiked, which means there are people chasing longs—but not so crowded that it’s squeezed.
What I care about more is the open position size: 51,927,608 MIRA. Price is up and positions are also up, which suggests this move isn’t just a pure rebound from shorts getting cut; there are indeed new positions coming in on the venue. The issue is that this kind of token doesn’t have thick spot liquidity. With 44,834 trades pushing the price up to near the intraday high, once the futures leg continues to expand and spot can’t keep up, volatility can easily get steep.
My plan: I won’t open a chase-long position. I’ll wait for it to come back near $0.043 and then try a 2% spot entry. If it breaks today’s low of $0.04072, I’ll exit immediately. For the futures side, I won’t touch it. The reason is simple: futures are hot compared to spot, but the funding rate isn’t extreme enough—being stuck in the middle is where it’s easiest to get swept back and forth. $MIRA #MIRA
If you can’t handle it, don’t get on the ride. Anyway, that’s the experience I lost money learning.
Spot 24h volume is $2.54M, while futures are $6.13M. The price is $0.0455, with intraday high/low of $0.04614 / $0.04072, and the 24h gain is 10.04%. Based on this structure, what’s pushing it onto the spot gainers list #8 and the futures gainers list #13 is not just aggressive one-sided chasing. It looks more like short-term funds first lift futures momentum, but bullish sentiment hasn’t gotten out of control yet. The funding rate hasn’t spiked, which means there are people chasing longs—but not so crowded that it’s squeezed.
What I care about more is the open position size: 51,927,608 MIRA. Price is up and positions are also up, which suggests this move isn’t just a pure rebound from shorts getting cut; there are indeed new positions coming in on the venue. The issue is that this kind of token doesn’t have thick spot liquidity. With 44,834 trades pushing the price up to near the intraday high, once the futures leg continues to expand and spot can’t keep up, volatility can easily get steep.
My plan: I won’t open a chase-long position. I’ll wait for it to come back near $0.043 and then try a 2% spot entry. If it breaks today’s low of $0.04072, I’ll exit immediately. For the futures side, I won’t touch it. The reason is simple: futures are hot compared to spot, but the funding rate isn’t extreme enough—being stuck in the middle is where it’s easiest to get swept back and forth. $MIRA #MIRA
If you can’t handle it, don’t get on the ride. Anyway, that’s the experience I lost money learning.

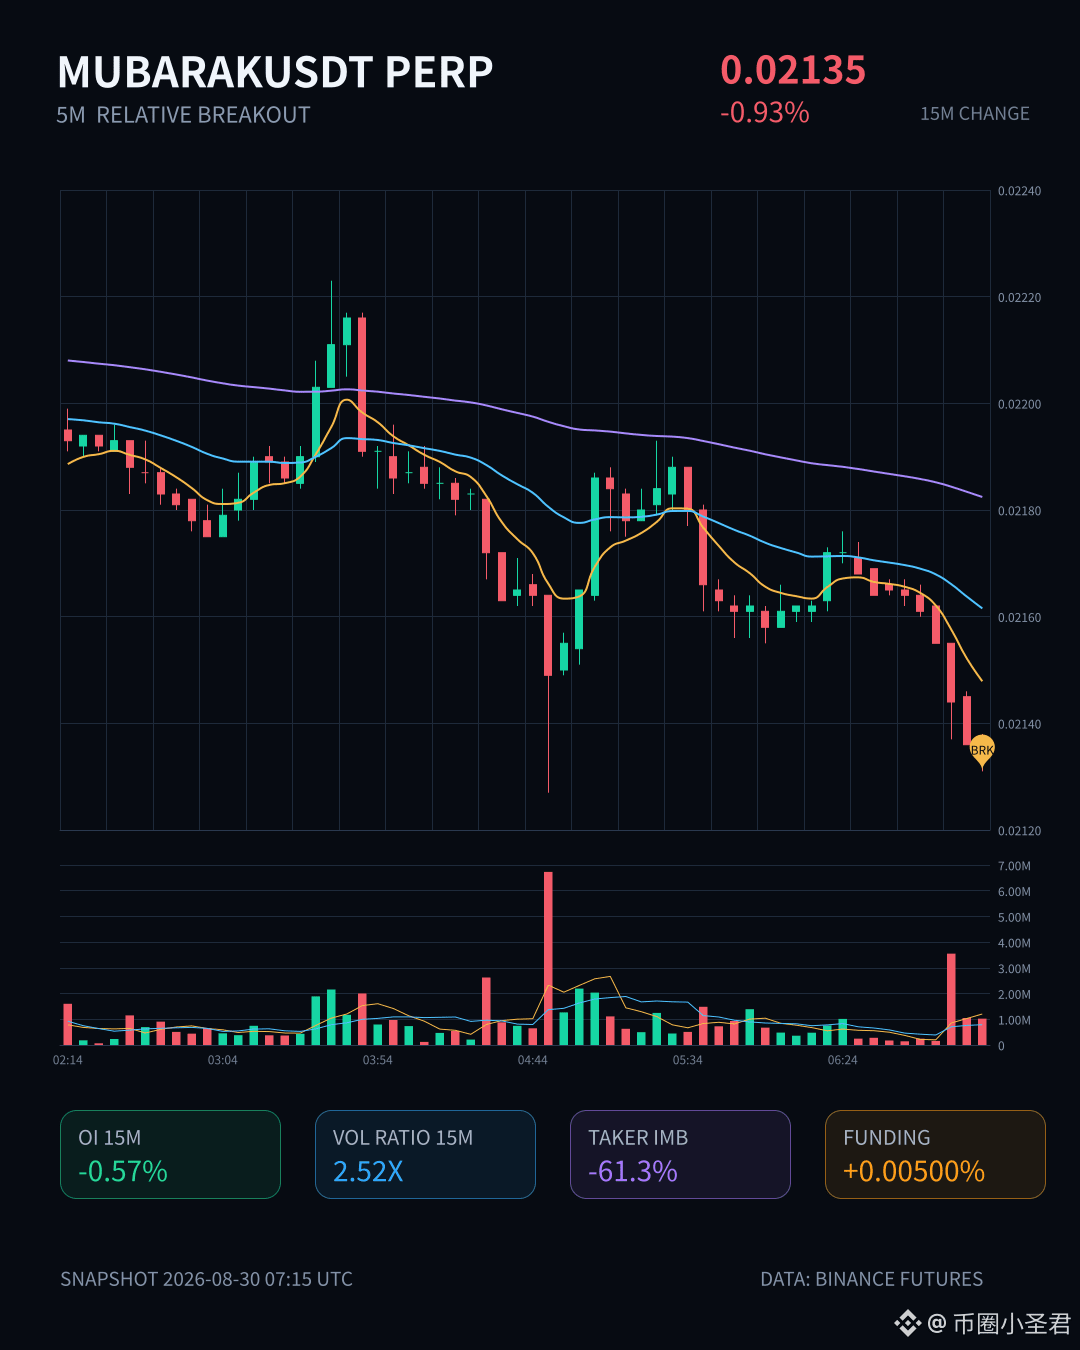
$MUBARAK This move is kind of interesting.
The price dropped by less than 1%, but the futures open-interest is clearly contracting—both the 15-minute and 1-hour level OI are falling, and the notional change is also negative. This combination of “price down + OI down” is more consistent with longs actively deleveraging and exiting via stop-loss, rather than shorts smashing the market to enter.
The order-book data backs it up too: the aggressive trade difference is -61.3%, the buy/sell ratio is 0.24—almost one-sided selling pressure. The closing price also broke directly below the lower band of the recent 20 five-minute K-lines. Volume expanded to 2.5 times, the volatility Z value is 1.55, and the funding rate is still hanging at a high level. From any angle, it looks like a “long squeeze into more long liquidation” type of pattern.
The pool-level abnormal percentile is 88.9%, the anomaly rank is #8. There has been continuous capital retreat—this signal can’t be ignored.
If you want to bottom-fish, don’t rush to catch the falling knife. If you want to short, don’t chase the short. Right now, the structure has formed—but only after subsequent confirmed follow-through volume can you talk about the next directional move.
The price dropped by less than 1%, but the futures open-interest is clearly contracting—both the 15-minute and 1-hour level OI are falling, and the notional change is also negative. This combination of “price down + OI down” is more consistent with longs actively deleveraging and exiting via stop-loss, rather than shorts smashing the market to enter.
The order-book data backs it up too: the aggressive trade difference is -61.3%, the buy/sell ratio is 0.24—almost one-sided selling pressure. The closing price also broke directly below the lower band of the recent 20 five-minute K-lines. Volume expanded to 2.5 times, the volatility Z value is 1.55, and the funding rate is still hanging at a high level. From any angle, it looks like a “long squeeze into more long liquidation” type of pattern.
The pool-level abnormal percentile is 88.9%, the anomaly rank is #8. There has been continuous capital retreat—this signal can’t be ignored.
If you want to bottom-fish, don’t rush to catch the falling knife. If you want to short, don’t chase the short. Right now, the structure has formed—but only after subsequent confirmed follow-through volume can you talk about the next directional move.
$ETH Holds the Spotlight: Why the King of Altcoins is Trending
$ETH is back in the spotlight, securing the #8 trending spot as the market watches its next major move. While a 1.42% daily nudge might look quiet, the real story is in the massive $8.4B trading volume flowing through the network. Ethereum remains the ultimate layer-1 benchmark, and this volume spike shows institutional and retail eyes are locked back on it. As gas fees stabilize and layer-2 scaling solutions continue to lock in TVL, smart money is quietly positioning. It’s not about the daily noise—it’s about the underlying liquidity fueling the entire DeFi ecosystem. Keep an eye on how $ETH handles this volume surge as market momentum builds.
Follow for more setups like this.
#DeGenYuv #Ethereum
$ETH is back in the spotlight, securing the #8 trending spot as the market watches its next major move. While a 1.42% daily nudge might look quiet, the real story is in the massive $8.4B trading volume flowing through the network. Ethereum remains the ultimate layer-1 benchmark, and this volume spike shows institutional and retail eyes are locked back on it. As gas fees stabilize and layer-2 scaling solutions continue to lock in TVL, smart money is quietly positioning. It’s not about the daily noise—it’s about the underlying liquidity fueling the entire DeFi ecosystem. Keep an eye on how $ETH handles this volume surge as market momentum builds.
Follow for more setups like this.
#DeGenYuv #Ethereum

"The Bitcoin bear cycle is over" — CryptoQuant CEO Ki Young Ju, yesterday 16:15Z, 198k views. We archive their feed, so let's pop the hood.
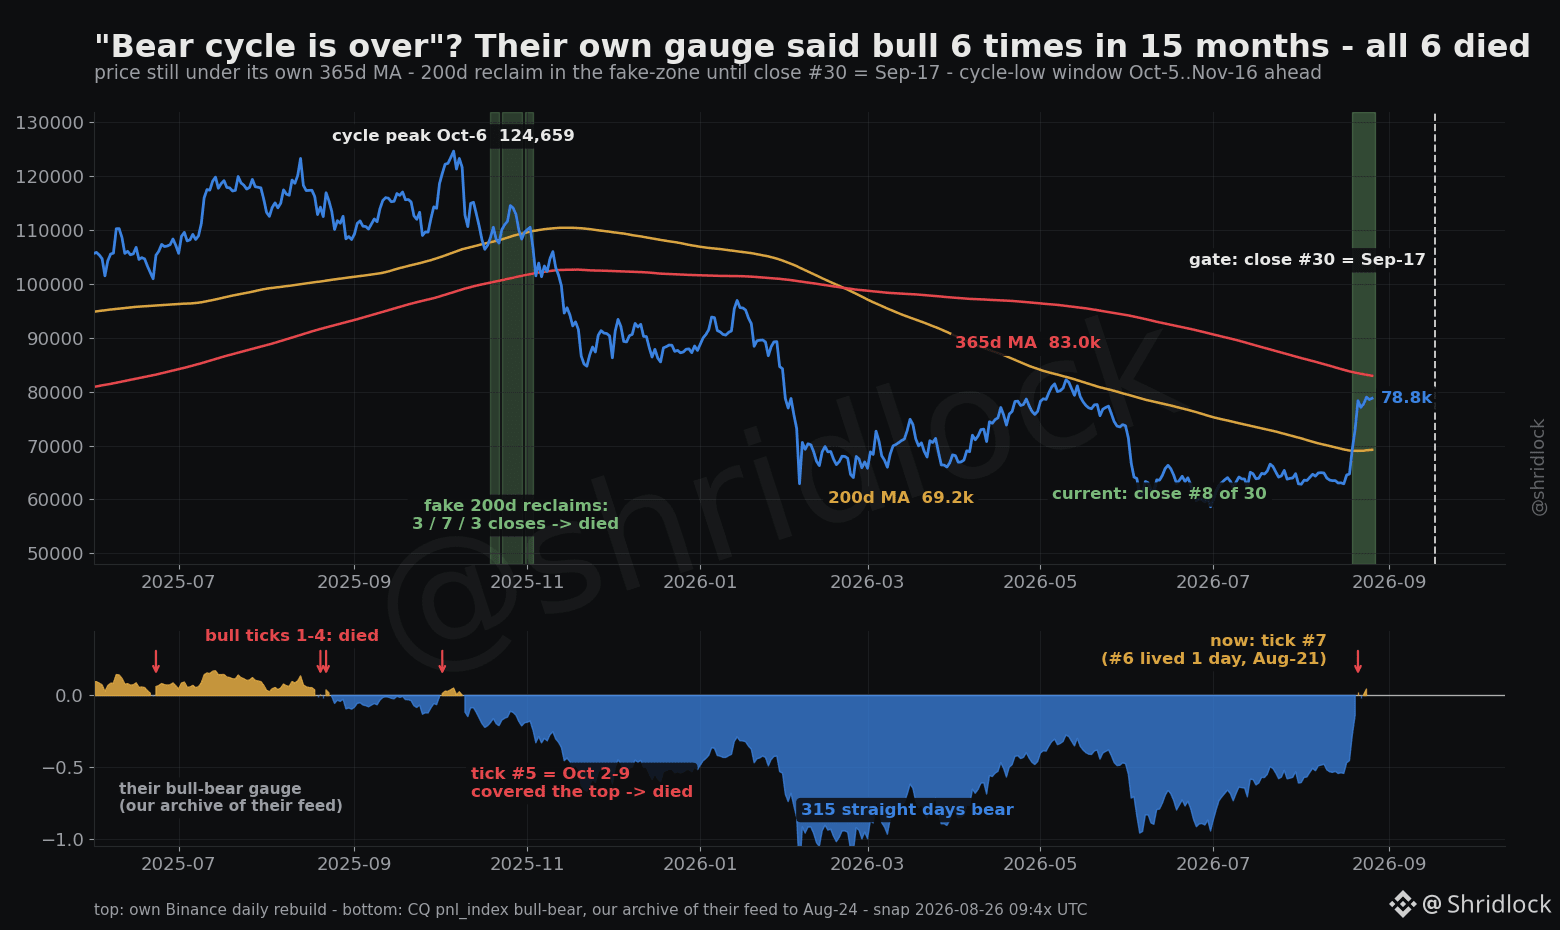
The gauge behind the call: their P&L Index (MVRV + NUPL + LTH/STH SOPR) ticking above its own 365-day average. In their own numbers, that tick fired bullish 6 times in 15 months — and died back into bear all 6. One of those bulls ran Oct 2-9 and covered the cycle top itself, 4 days before the slide. Before the current tick (Aug-23, after a bull-bear wobble on Aug 21-22) the gauge sat bear 315 straight days.
Their desk adds: Bull Score 30 → 80, "$83K is the only thing left standing in the way." On our tape that wall is price's own 365d MA at 83.0k — $BTC sits UNDER it at 78.8k. And the 200d reclaim is on close #8: every fake reclaim of this era died in 3-7 closes, the longest fake in history ran ~30. Real ones ran 146-385.
So the call has a near judge: close #30 lands Sep-17. Survive it and "over" earns the word. Lose the 200d earlier — fake #4, same bear, fresh headline.
The far ruler still disagrees: day 324 from the top, cycle lows land 364-406 days in — Oct-5 to Nov-16, still ahead. Near judge rules first: a hold through Sep-17 sends the clock itself to review. Your line to draw. NFA
The gauge behind the call: their P&L Index (MVRV + NUPL + LTH/STH SOPR) ticking above its own 365-day average. In their own numbers, that tick fired bullish 6 times in 15 months — and died back into bear all 6. One of those bulls ran Oct 2-9 and covered the cycle top itself, 4 days before the slide. Before the current tick (Aug-23, after a bull-bear wobble on Aug 21-22) the gauge sat bear 315 straight days.
Their desk adds: Bull Score 30 → 80, "$83K is the only thing left standing in the way." On our tape that wall is price's own 365d MA at 83.0k — $BTC sits UNDER it at 78.8k. And the 200d reclaim is on close #8: every fake reclaim of this era died in 3-7 closes, the longest fake in history ran ~30. Real ones ran 146-385.
So the call has a near judge: close #30 lands Sep-17. Survive it and "over" earns the word. Lose the 200d earlier — fake #4, same bear, fresh headline.
The far ruler still disagrees: day 324 from the top, cycle lows land 364-406 days in — Oct-5 to Nov-16, still ahead. Near judge rules first: a hold through Sep-17 sends the clock itself to review. Your line to draw. NFA
$AAVE Holds the DeFi Spotlight Amid Market Volatility
DeFi giant $AAVE is holding strong in the trending charts at rank #8. Despite a minor 24-hour dip of -3.33%, the protocol continues to command massive attention with over $101M in daily trading volume. As the broader market hunts for yield and stability, $AAVE remains the undisputed king of decentralized lending. Institutional interest and governance proposals to optimize tokenomics are keeping the narrative highly bullish. Traders are watching closely as the protocol consolidates around $126.11, proving once again that when DeFi heats up, $AAVE is the first asset liquidity flows back into. Keep an eye on this one as the market prepares for its next major move. ⚡📊
Follow for more crypto setups.
#DeGenYuv #Aave
DeFi giant $AAVE is holding strong in the trending charts at rank #8. Despite a minor 24-hour dip of -3.33%, the protocol continues to command massive attention with over $101M in daily trading volume. As the broader market hunts for yield and stability, $AAVE remains the undisputed king of decentralized lending. Institutional interest and governance proposals to optimize tokenomics are keeping the narrative highly bullish. Traders are watching closely as the protocol consolidates around $126.11, proving once again that when DeFi heats up, $AAVE is the first asset liquidity flows back into. Keep an eye on this one as the market prepares for its next major move. ⚡📊
Follow for more crypto setups.
#DeGenYuv #Aave

Log in to explore more content