

#40
40
29,295 views
108 Discussing
Hot
Latest

·
--
$PUMP still lowkey doing something wild — 24% below ATH but volume screaming $374M+ this week. Rank #40 on the list right now on Solana 🐬
The real question: is it building for the next rally or just running circles?
$PUMP still lowkey doing something wild — 24% below ATH but volume screaming $374M+ this week. Rank #40 on the list right now on Solana 🐬
The real question: is it building for the next rally or just running circles?
The real question: is it building for the next rally or just running circles?
60

·
--
Bullish
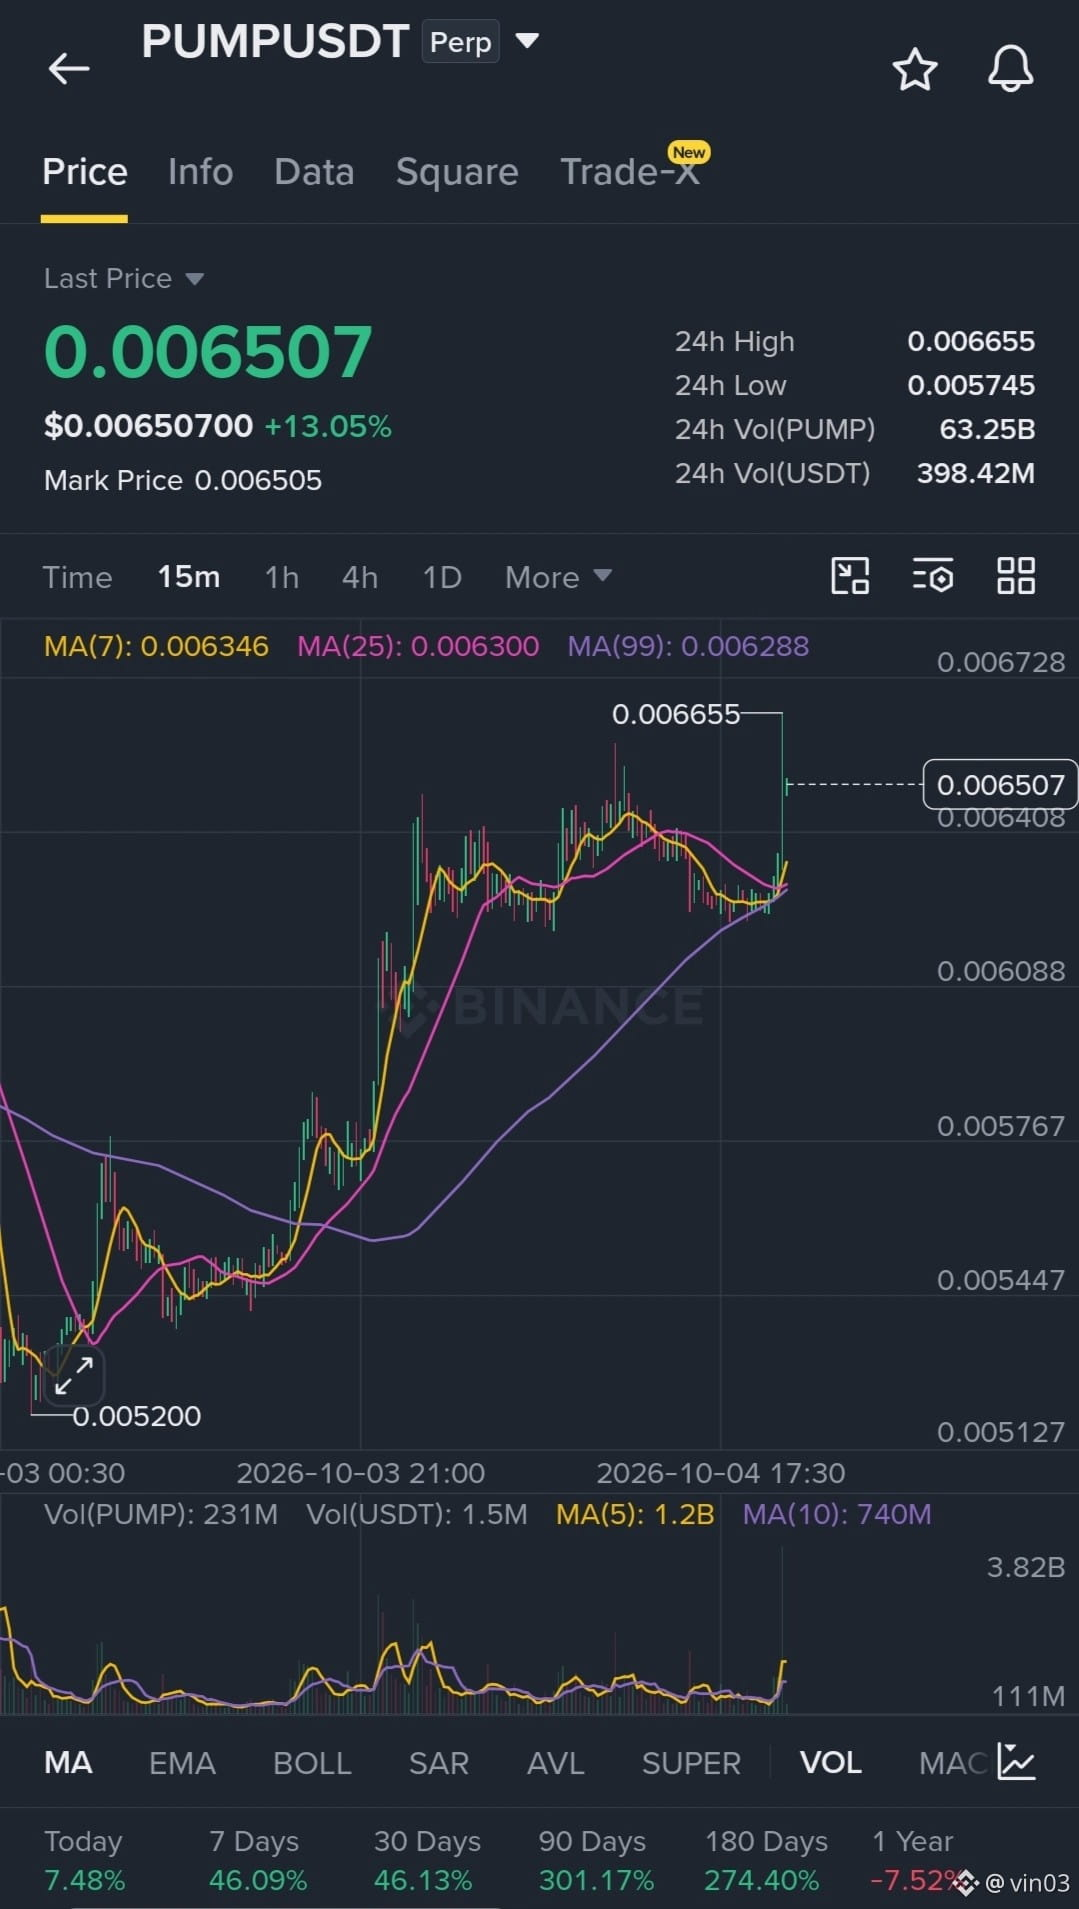
$PUMP is cooking today 🔥
Sitting around $0.00627–0.00630 right now, up roughly 8–10% on the day (some charts showing even higher earlier).
Market cap holding strong near $2.91–2.95B, still ranked around #40
24h range has been lively — dipped near $0.0057 and pushed up toward $0.00654. Volume is solid, open interest climbed, and we’ve seen some short liquidations getting cleaned out. Whales have been active too (a couple big wallets moving/buying millions worth).
$ZEC
{future}(ZECUSDT)
$PUMP is cooking today 🔥
Sitting around $0.00627–0.00630 right now, up roughly 8–10% on the day (some charts showing even higher earlier).
Market cap holding strong near $2.91–2.95B, still ranked around #40
24h range has been lively — dipped near $0.0057 and pushed up toward $0.00654. Volume is solid, open interest climbed, and we’ve seen some short liquidations getting cleaned out. Whales have been active too (a couple big wallets moving/buying millions worth).
$ZEC
Sitting around $0.00627–0.00630 right now, up roughly 8–10% on the day (some charts showing even higher earlier).
Market cap holding strong near $2.91–2.95B, still ranked around #40
24h range has been lively — dipped near $0.0057 and pushed up toward $0.00654. Volume is solid, open interest climbed, and we’ve seen some short liquidations getting cleaned out. Whales have been active too (a couple big wallets moving/buying millions worth).
$ZEC
2
200

·
--
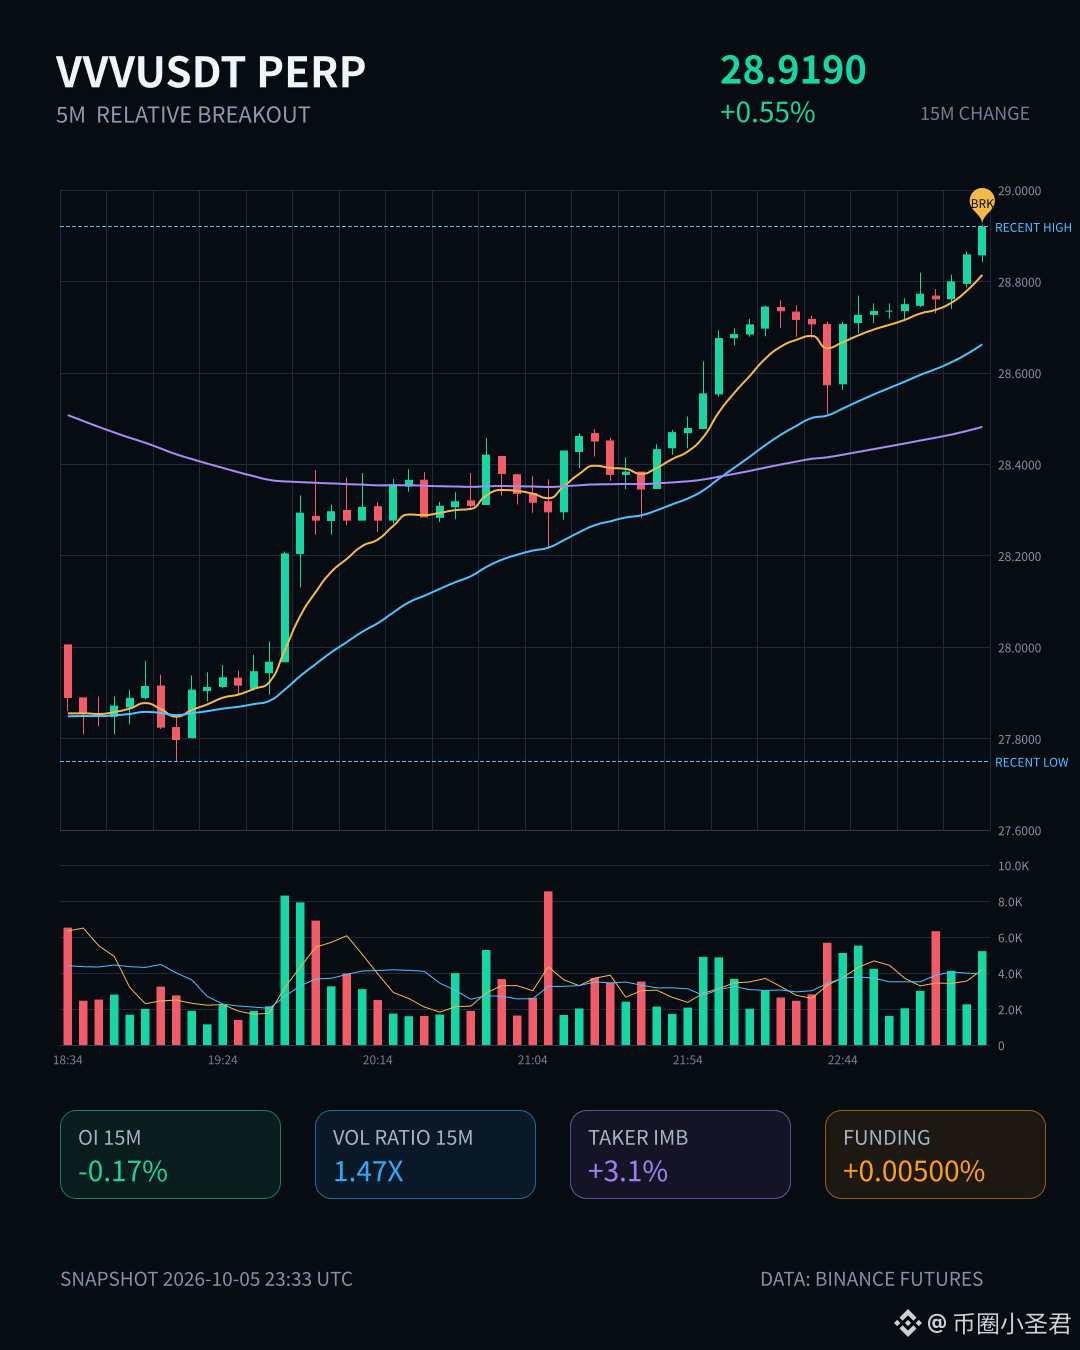
$VVV 15m just tested the upper edge of a nearly 20-bar 5m range. Volume is 1.47x, the buy/sell ratio is 1.06, and the taker flow imbalance is +3.1%. The price is slightly up, while OI is down 0.94% over 1h—a typical short-covering/position-reduction structure, not a major influx of new longs. Pool-wide anomaly rank: #40; notional rank: #36; notional change: 103K (+0.34%). Watch for follow-through: if OI keeps falling while the price holds steady, there may be more room for short covering.
$VVV 15m just tested the upper edge of a nearly 20-bar 5m range. Volume is 1.47x, the buy/sell ratio is 1.06, and the taker flow imbalance is +3.1%. The price is slightly up, while OI is down 0.94% over 1h—a typical short-covering/position-reduction structure, not a major influx of new longs. Pool-wide anomaly rank: #40; notional rank: #36; notional change: 103K (+0.34%). Watch for follow-through: if OI keeps falling while the price holds steady, there may be more room for short covering.
16

·
--
$PUMP is now 27% below its ATH, at $0.006452 with a market cap of $3.00B, up 52% over the past 30 days. A #40 market-cap ranking is already expensive for a token spun off from a launchpad.
What’s really worth watching is this week’s volume. On October 3, institutional volume surged to $579M, but the price couldn’t hold near $0.0053. Volume later fell to $350M, while the price climbed back above $0.0064. This doesn’t look like buyers flooding in; it looks more like buyers tested the downside, then continued building positions around $0.0058–$0.0062, gradually pushing the price higher.
But there’s one issue we can’t ignore: volume picked up near the previous ATH highs, yet the price stalled. There’s also a concern that this short-term rebound lacks sufficient volume. What really needs confirmation isn’t whether the price can break above $0.0068, but whether the bulls in 616 will keep buying if it pulls back to around $0.0058. If it falls below $0.0055, this 52% rally will be seen as a period of high-level consolidation, not a base forming.
The more practical risk is that $PUMP ’s price already reflects a lot of optimism. Once the market cap reaches $3B, new liquidity has to come in at a higher cost to support the next leg up. And capital rotates through the meme sector faster than people think. Reaching the $0.0088 ATH will take more than imagining a higher price; volume needs to show the kind of staying power it had in late September.
At this stage, both the bullish and bearish cases are internally consistent.
The question with $PUMP isn’t whether it has risen enough, but how much room is actually left when a low-volume rebound after heavy profit-taking runs up against a market cap of this size—and how much of the price is being supported by expectations.
$PUMP is now 27% below its ATH, at $0.006452 with a market cap of $3.00B, up 52% over the past 30 days. A #40 market-cap ranking is already expensive for a token spun off from a launchpad.
What’s really worth watching is this week’s volume. On October 3, institutional volume surged to $579M, but the price couldn’t hold near $0.0053. Volume later fell to $350M, while the price climbed back above $0.0064. This doesn’t look like buyers flooding in; it looks more like buyers tested the downside, then continued building positions around $0.0058–$0.0062, gradually pushing the price higher.
But there’s one issue we can’t ignore: volume picked up near the previous ATH highs, yet the price stalled. There’s also a concern that this short-term rebound lacks sufficient volume. What really needs confirmation isn’t whether the price can break above $0.0068, but whether the bulls in 616 will keep buying if it pulls back to around $0.0058. If it falls below $0.0055, this 52% rally will be seen as a period of high-level consolidation, not a base forming.
The more practical risk is that $PUMP ’s price already reflects a lot of optimism. Once the market cap reaches $3B, new liquidity has to come in at a higher cost to support the next leg up. And capital rotates through the meme sector faster than people think. Reaching the $0.0088 ATH will take more than imagining a higher price; volume needs to show the kind of staying power it had in late September.
At this stage, both the bullish and bearish cases are internally consistent.
The question with $PUMP isn’t whether it has risen enough, but how much room is actually left when a low-volume rebound after heavy profit-taking runs up against a market cap of this size—and how much of the price is being supported by expectations.
What’s really worth watching is this week’s volume. On October 3, institutional volume surged to $579M, but the price couldn’t hold near $0.0053. Volume later fell to $350M, while the price climbed back above $0.0064. This doesn’t look like buyers flooding in; it looks more like buyers tested the downside, then continued building positions around $0.0058–$0.0062, gradually pushing the price higher.
But there’s one issue we can’t ignore: volume picked up near the previous ATH highs, yet the price stalled. There’s also a concern that this short-term rebound lacks sufficient volume. What really needs confirmation isn’t whether the price can break above $0.0068, but whether the bulls in 616 will keep buying if it pulls back to around $0.0058. If it falls below $0.0055, this 52% rally will be seen as a period of high-level consolidation, not a base forming.
The more practical risk is that $PUMP ’s price already reflects a lot of optimism. Once the market cap reaches $3B, new liquidity has to come in at a higher cost to support the next leg up. And capital rotates through the meme sector faster than people think. Reaching the $0.0088 ATH will take more than imagining a higher price; volume needs to show the kind of staying power it had in late September.
At this stage, both the bullish and bearish cases are internally consistent.
The question with $PUMP isn’t whether it has risen enough, but how much room is actually left when a low-volume rebound after heavy profit-taking runs up against a market cap of this size—and how much of the price is being supported by expectations.
25

·
--
$1000FLOKI — there’s something going on here.
Up 1.26% over 15m, volume at 1.36x, volatility Z spiking to 1.95, and price has just broken above the high of the last ~20 5m candles. Aggressive trade imbalance is +23.4%, the buy/sell ratio is 1.61, and funding rates are elevated — this move is coming with leveraged longs.
OI is up 2.37% over 15m and 2.89% over 1h, with notional change close to 200K USDT and an anomaly percentile of 99. Ranked #4 for anomalies across the entire pool, and #40 for notional change.
Price up, OI up — a setup driven by new leveraged longs. 24h trading volume is 15.49M USDT, and it’s currently hovering near historical extremes.
Hard to say whether it’ll continue, but this level is definitely interesting.
$1000FLOKI — there’s something going on here.
Up 1.26% over 15m, volume at 1.36x, volatility Z spiking to 1.95, and price has just broken above the high of the last ~20 5m candles. Aggressive trade imbalance is +23.4%, the buy/sell ratio is 1.61, and funding rates are elevated — this move is coming with leveraged longs.
OI is up 2.37% over 15m and 2.89% over 1h, with notional change close to 200K USDT and an anomaly percentile of 99. Ranked #4 for anomalies across the entire pool, and #40 for notional change.
Price up, OI up — a setup driven by new leveraged longs. 24h trading volume is 15.49M USDT, and it’s currently hovering near historical extremes.
Hard to say whether it’ll continue, but this level is definitely interesting.
Up 1.26% over 15m, volume at 1.36x, volatility Z spiking to 1.95, and price has just broken above the high of the last ~20 5m candles. Aggressive trade imbalance is +23.4%, the buy/sell ratio is 1.61, and funding rates are elevated — this move is coming with leveraged longs.
OI is up 2.37% over 15m and 2.89% over 1h, with notional change close to 200K USDT and an anomaly percentile of 99. Ranked #4 for anomalies across the entire pool, and #40 for notional change.
Price up, OI up — a setup driven by new leveraged longs. 24h trading volume is 15.49M USDT, and it’s currently hovering near historical extremes.
Hard to say whether it’ll continue, but this level is definitely interesting.
5
·
--
$ONE This drop isn’t that violent, but the structure is pretty interesting.
On the 15m chart, it fell by less than 1 point, yet the volume expanded to 1.63x, and the volatility “Z” hit 2.41—the volume came out first, while the price just slowly grinds downward. More importantly, OI is dropping in sync. In the 1h contracts, open interest fell by 1.81%, and the notional shrank by nearly 190k U. A combination of price down + positions down looks more like longs cutting risk or actively reducing exposure, rather than shorts opening new positions to press it lower.
Active trade imbalance: -13.7%, buy/sell ratio at 0.76. Selling pressure is indeed in control, and the close also broke below the lower edge of the last ~20 5m candles. But note: this is deleveraging-style selling, not capital rushing in to short.
In the whole pool’s abnormal ranking it’s #40, and notional change is #36—so it ranks relatively high among the pool’s notable moves, though the absolute magnitude isn’t huge.
My take: volume up while price falls + OI shrinking. After the short-term sell pressure is released, there may be a rebound, but the prerequisite is that positions don’t keep dropping. If OI continues to move lower, then positions are steadily exiting, and the rebound strength will be discounted. With 63M’s 24h trading value sitting there—liquidity is sufficient—don’t rush to pick the bottom. Wait until the active buy/sell ratio returns above 1 before considering it.
$ONE This drop isn’t that violent, but the structure is pretty interesting.
On the 15m chart, it fell by less than 1 point, yet the volume expanded to 1.63x, and the volatility “Z” hit 2.41—the volume came out first, while the price just slowly grinds downward. More importantly, OI is dropping in sync. In the 1h contracts, open interest fell by 1.81%, and the notional shrank by nearly 190k U. A combination of price down + positions down looks more like longs cutting risk or actively reducing exposure, rather than shorts opening new positions to press it lower.
Active trade imbalance: -13.7%, buy/sell ratio at 0.76. Selling pressure is indeed in control, and the close also broke below the lower edge of the last ~20 5m candles. But note: this is deleveraging-style selling, not capital rushing in to short.
In the whole pool’s abnormal ranking it’s #40, and notional change is #36—so it ranks relatively high among the pool’s notable moves, though the absolute magnitude isn’t huge.
My take: volume up while price falls + OI shrinking. After the short-term sell pressure is released, there may be a rebound, but the prerequisite is that positions don’t keep dropping. If OI continues to move lower, then positions are steadily exiting, and the rebound strength will be discounted. With 63M’s 24h trading value sitting there—liquidity is sufficient—don’t rush to pick the bottom. Wait until the active buy/sell ratio returns above 1 before considering it.
On the 15m chart, it fell by less than 1 point, yet the volume expanded to 1.63x, and the volatility “Z” hit 2.41—the volume came out first, while the price just slowly grinds downward. More importantly, OI is dropping in sync. In the 1h contracts, open interest fell by 1.81%, and the notional shrank by nearly 190k U. A combination of price down + positions down looks more like longs cutting risk or actively reducing exposure, rather than shorts opening new positions to press it lower.
Active trade imbalance: -13.7%, buy/sell ratio at 0.76. Selling pressure is indeed in control, and the close also broke below the lower edge of the last ~20 5m candles. But note: this is deleveraging-style selling, not capital rushing in to short.
In the whole pool’s abnormal ranking it’s #40, and notional change is #36—so it ranks relatively high among the pool’s notable moves, though the absolute magnitude isn’t huge.
My take: volume up while price falls + OI shrinking. After the short-term sell pressure is released, there may be a rebound, but the prerequisite is that positions don’t keep dropping. If OI continues to move lower, then positions are steadily exiting, and the rebound strength will be discounted. With 63M’s 24h trading value sitting there—liquidity is sufficient—don’t rush to pick the bottom. Wait until the active buy/sell ratio returns above 1 before considering it.
11

·
--
M Turns Around Instantly in the Order Book! The price spread widens abnormally—watch out for slippage in the short term14:13 (7 minutes ago) M saw an intraday surge of 4.1%. As of 14:21:00, the current price is 1.0681, up 2.0% over the past 24h. Other tickers in the same batch of unusual moves include SIREN and PHA.
📅 Data as of 14:21:00 (event trigger times are indicated in each note; prices are real-time snapshots at the time of writing)
📌 One-sentence highlight: The order book thins out, spreads widen, and slippage grows larger—short-term orders should slow down
Market Overview: BTC 84,912.50 (+0.36%) · ETH 2,694.67 (+0.72%); Across the whole market, 345 stocks rose / 146 fell over the past 24h; Top gainer in the past 24h: AIN +194.71%, biggest loser: BTW -35.69%.
—— Event Details ——
I. Key Time Points of Sudden Movement
M Turns Around Instantly in the Order Book! The price spread widens abnormally—watch out for slippage in the short term
14:13 (7 minutes ago) M saw an intraday surge of 4.1%. As of 14:21:00, the current price is 1.0681, up 2.0% over the past 24h. Other tickers in the same batch of unusual moves include SIREN and PHA.
📅 Data as of 14:21:00 (event trigger times are indicated in each note; prices are real-time snapshots at the time of writing)
📌 One-sentence highlight: The order book thins out, spreads widen, and slippage grows larger—short-term orders should slow down
Market Overview: BTC 84,912.50 (+0.36%) · ETH 2,694.67 (+0.72%); Across the whole market, 345 stocks rose / 146 fell over the past 24h; Top gainer in the past 24h: AIN +194.71%, biggest loser: BTW -35.69%.
—— Event Details ——
I. Key Time Points of Sudden Movement
📅 Data as of 14:21:00 (event trigger times are indicated in each note; prices are real-time snapshots at the time of writing)
📌 One-sentence highlight: The order book thins out, spreads widen, and slippage grows larger—short-term orders should slow down
Market Overview: BTC 84,912.50 (+0.36%) · ETH 2,694.67 (+0.72%); Across the whole market, 345 stocks rose / 146 fell over the past 24h; Top gainer in the past 24h: AIN +194.71%, biggest loser: BTW -35.69%.
—— Event Details ——
I. Key Time Points of Sudden Movement
20

·
--
$RAYSOL This spot is a bit interesting.
In 15m, it directly pulled up by 1.53%; volume reached 2.69x, the Z value is 2.04. The closing price pushed through the upper boundary of the most recent 20 five-minute candles. The aggressive trades are down 47.4%, and the buy/sell ratio is 2.81—buyers are actually rushing in, not just posting orders as a show.
What’s even more worth watching is the OI: in 15m, OI is +0.04%, notional is +1.51%, with an abnormal percentile of 94.4%, ranking 4th across the whole pool. Price rising while OI rises is a structure consistent with newly added leveraged long positions—not the kind of “short covering” that only looks like a fake lift. On the 1h dimension, OI has dipped slightly, but notional is still positive, indicating the positions haven’t scattered.
In the last 24h, turnover is 26.54M; the change in notional within the pool ranks #40, and for several consecutive periods the move has been ongoing. The deeper signals confirm volume strength, price-range boundaries, the tilt toward aggressive buying, and abnormal OI—all of these line up together, not just a single-point anomaly.
Of course, it’s approaching its own historical extreme zone. If you chase, be mentally prepared—when leveraged longs get crowded, reversals can be just as fast. First, see whether it can hold steady above this breakout level.
$RAYSOL This spot is a bit interesting.
In 15m, it directly pulled up by 1.53%; volume reached 2.69x, the Z value is 2.04. The closing price pushed through the upper boundary of the most recent 20 five-minute candles. The aggressive trades are down 47.4%, and the buy/sell ratio is 2.81—buyers are actually rushing in, not just posting orders as a show.
What’s even more worth watching is the OI: in 15m, OI is +0.04%, notional is +1.51%, with an abnormal percentile of 94.4%, ranking 4th across the whole pool. Price rising while OI rises is a structure consistent with newly added leveraged long positions—not the kind of “short covering” that only looks like a fake lift. On the 1h dimension, OI has dipped slightly, but notional is still positive, indicating the positions haven’t scattered.
In the last 24h, turnover is 26.54M; the change in notional within the pool ranks #40, and for several consecutive periods the move has been ongoing. The deeper signals confirm volume strength, price-range boundaries, the tilt toward aggressive buying, and abnormal OI—all of these line up together, not just a single-point anomaly.
Of course, it’s approaching its own historical extreme zone. If you chase, be mentally prepared—when leveraged longs get crowded, reversals can be just as fast. First, see whether it can hold steady above this breakout level.
In 15m, it directly pulled up by 1.53%; volume reached 2.69x, the Z value is 2.04. The closing price pushed through the upper boundary of the most recent 20 five-minute candles. The aggressive trades are down 47.4%, and the buy/sell ratio is 2.81—buyers are actually rushing in, not just posting orders as a show.
What’s even more worth watching is the OI: in 15m, OI is +0.04%, notional is +1.51%, with an abnormal percentile of 94.4%, ranking 4th across the whole pool. Price rising while OI rises is a structure consistent with newly added leveraged long positions—not the kind of “short covering” that only looks like a fake lift. On the 1h dimension, OI has dipped slightly, but notional is still positive, indicating the positions haven’t scattered.
In the last 24h, turnover is 26.54M; the change in notional within the pool ranks #40, and for several consecutive periods the move has been ongoing. The deeper signals confirm volume strength, price-range boundaries, the tilt toward aggressive buying, and abnormal OI—all of these line up together, not just a single-point anomaly.
Of course, it’s approaching its own historical extreme zone. If you chase, be mentally prepared—when leveraged longs get crowded, reversals can be just as fast. First, see whether it can hold steady above this breakout level.
18
·
--
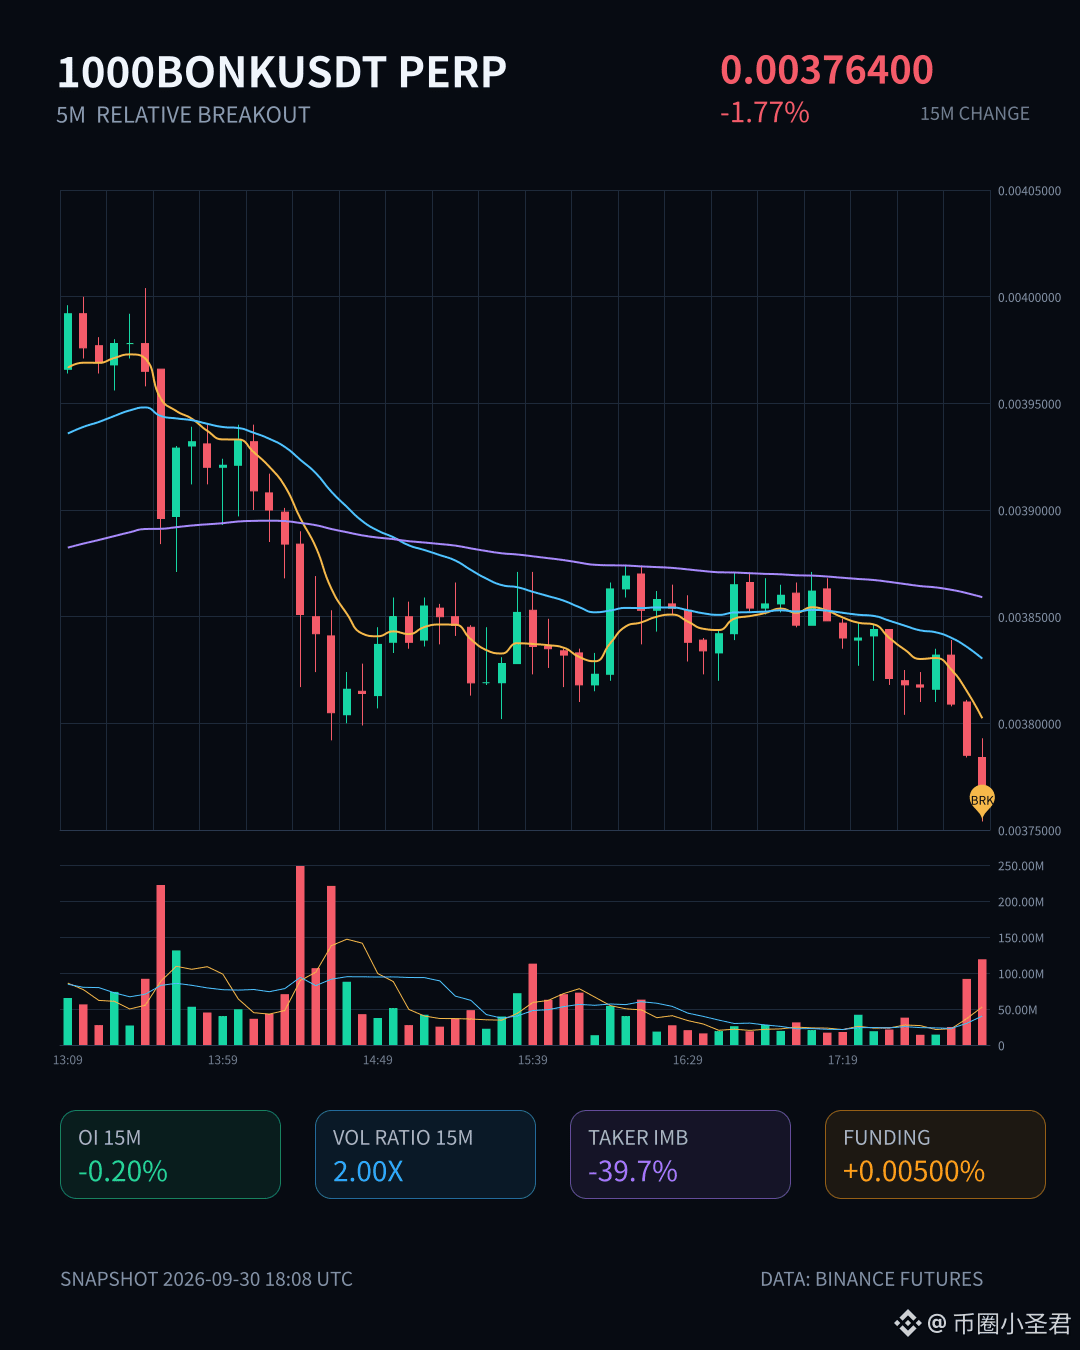
$1000BONK just smashed a 15m candle—volume is 2x. It directly broke below the low of the previous 20 candles of 5m.
What’s interesting is that OI is falling too: 15m -0.2%, 1h -0.41%, nominally down by nearly 800k U. Price is dropping + positions are shrinking—this feels more like longs are being carried out rather than shorts opening new positions to push it down.
Aggressive trade volume is down -39.7%, buy/sell ratio is 0.43—selling pressure is definitely real. OI abnormal percentile is 92.1%, pool rank #16, nominal change rank #40—data-wise, this is indeed the standout bucket today.
In the last 24h there’s still 53M of volume—not exactly quiet. It remains to be seen whether this deleveraging move is just a quick sweep, or whether it also taps that lower layer of liquidity.
$1000BONK just smashed a 15m candle—volume is 2x. It directly broke below the low of the previous 20 candles of 5m.
What’s interesting is that OI is falling too: 15m -0.2%, 1h -0.41%, nominally down by nearly 800k U. Price is dropping + positions are shrinking—this feels more like longs are being carried out rather than shorts opening new positions to push it down.
Aggressive trade volume is down -39.7%, buy/sell ratio is 0.43—selling pressure is definitely real. OI abnormal percentile is 92.1%, pool rank #16, nominal change rank #40—data-wise, this is indeed the standout bucket today.
In the last 24h there’s still 53M of volume—not exactly quiet. It remains to be seen whether this deleveraging move is just a quick sweep, or whether it also taps that lower layer of liquidity.
What’s interesting is that OI is falling too: 15m -0.2%, 1h -0.41%, nominally down by nearly 800k U. Price is dropping + positions are shrinking—this feels more like longs are being carried out rather than shorts opening new positions to push it down.
Aggressive trade volume is down -39.7%, buy/sell ratio is 0.43—selling pressure is definitely real. OI abnormal percentile is 92.1%, pool rank #16, nominal change rank #40—data-wise, this is indeed the standout bucket today.
In the last 24h there’s still 53M of volume—not exactly quiet. It remains to be seen whether this deleveraging move is just a quick sweep, or whether it also taps that lower layer of liquidity.
10

·
--
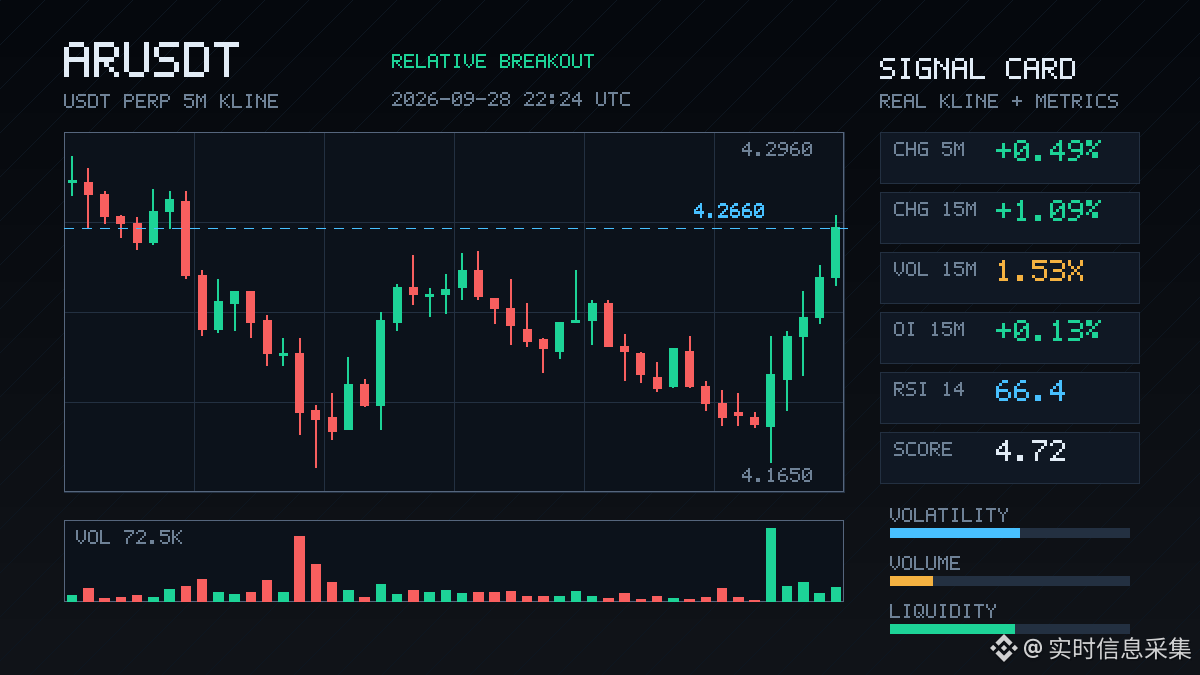
$AR There’s something interesting here.
On the 15m chart, it’s up 1.09%. The volume surged directly to 1.53x, with a Z value of 2.16—not some fake breakout on shrinking volume, but clearly people are pushing it for real. The closing price has just bitten through nearly 20 consecutive 5m upper edges. The active turnover is up 14.1%, and the buy-sell ratio is 1.33, with buy orders clearly more urgent.
More importantly, it’s the OI: 15m is +0.13%, and 1h is +0.34%, with a nominal 170K that’s gradually increasing. Price is rising, positions are rising, and volume is also rising—this combination looks more like new longs coming in to take over leverage, rather than shorts being forced to cover.
At the abnormal percentile of 80%, it ranks #14 across the whole pool, with nominal change at #40. The 24h trading value is 35.91M. The pool isn’t that big, so this amount of volume is enough to push the structure up.
I’ll keep watching first—whether this 5m candle can hold above the upper edge. If it can hold, we’ll talk about the next move. If it can’t, then it’s just a single pin-prick candle.
$AR There’s something interesting here.
On the 15m chart, it’s up 1.09%. The volume surged directly to 1.53x, with a Z value of 2.16—not some fake breakout on shrinking volume, but clearly people are pushing it for real. The closing price has just bitten through nearly 20 consecutive 5m upper edges. The active turnover is up 14.1%, and the buy-sell ratio is 1.33, with buy orders clearly more urgent.
More importantly, it’s the OI: 15m is +0.13%, and 1h is +0.34%, with a nominal 170K that’s gradually increasing. Price is rising, positions are rising, and volume is also rising—this combination looks more like new longs coming in to take over leverage, rather than shorts being forced to cover.
At the abnormal percentile of 80%, it ranks #14 across the whole pool, with nominal change at #40. The 24h trading value is 35.91M. The pool isn’t that big, so this amount of volume is enough to push the structure up.
I’ll keep watching first—whether this 5m candle can hold above the upper edge. If it can hold, we’ll talk about the next move. If it can’t, then it’s just a single pin-prick candle.
On the 15m chart, it’s up 1.09%. The volume surged directly to 1.53x, with a Z value of 2.16—not some fake breakout on shrinking volume, but clearly people are pushing it for real. The closing price has just bitten through nearly 20 consecutive 5m upper edges. The active turnover is up 14.1%, and the buy-sell ratio is 1.33, with buy orders clearly more urgent.
More importantly, it’s the OI: 15m is +0.13%, and 1h is +0.34%, with a nominal 170K that’s gradually increasing. Price is rising, positions are rising, and volume is also rising—this combination looks more like new longs coming in to take over leverage, rather than shorts being forced to cover.
At the abnormal percentile of 80%, it ranks #14 across the whole pool, with nominal change at #40. The 24h trading value is 35.91M. The pool isn’t that big, so this amount of volume is enough to push the structure up.
I’ll keep watching first—whether this 5m candle can hold above the upper edge. If it can hold, we’ll talk about the next move. If it can’t, then it’s just a single pin-prick candle.
24
·
--
When capital is looking for the next narrative that can absorb liquidity, RWA usually isn’t the noisiest one. But $ONDO ’s order book has been less than calm lately. In the past 30 days, it was pushed from around 0.35 to 0.57. What you really need to watch is September 25: volume jumped from over 200M straight to 1.06B, and price moved in tandem from 0.41 up to 0.52. This kind of volume-price action isn’t built by retail accumulation—it looks more like capital is resetting the way the market prices RWA. $ONDO ranks #40 by market cap at 2.78B, with sufficient depth for big-money inflows and outflows, but it’s still 73% below its ATH. It’s not trading the new-high narrative right now; it’s repairing after a deep drawdown.
What I care about most is that this rotation could be coming from two directions: first, capital spilling over from memes and L1s, seeking assets with real yield and compliant narratives; second, an early bet that institutions will adopt RWA in the next cycle. The mispricing—or expectation gap—is whether the market is willing to award RWA leaders higher valuation multiples, rather than treating them only as defensive allocations.
The risks are just as direct. Over 1 year it’s still down 34.92%, and long-term holders are still under water. Upward supply pressure won’t just disappear out of thin air. If volume falls back below 200M, or if price drops back into the 0.45 range, this rotation may have only been a short-term rebound. The RWA thesis also heavily depends on macro interest rates and regulatory signals—it can’t be sustained purely by community sentiment.
Have you recently noticed the same direction in stablecoin net inflows, changes in the size of tokenized Treasuries, or large on-chain transfers? If institutional money hasn’t truly entered yet, does $ONDO look more like an intermediate stop in a liquidity rotation—or a rehearsal for the main breakout surge?
When capital is looking for the next narrative that can absorb liquidity, RWA usually isn’t the noisiest one. But $ONDO ’s order book has been less than calm lately. In the past 30 days, it was pushed from around 0.35 to 0.57. What you really need to watch is September 25: volume jumped from over 200M straight to 1.06B, and price moved in tandem from 0.41 up to 0.52. This kind of volume-price action isn’t built by retail accumulation—it looks more like capital is resetting the way the market prices RWA. $ONDO ranks #40 by market cap at 2.78B, with sufficient depth for big-money inflows and outflows, but it’s still 73% below its ATH. It’s not trading the new-high narrative right now; it’s repairing after a deep drawdown.
What I care about most is that this rotation could be coming from two directions: first, capital spilling over from memes and L1s, seeking assets with real yield and compliant narratives; second, an early bet that institutions will adopt RWA in the next cycle. The mispricing—or expectation gap—is whether the market is willing to award RWA leaders higher valuation multiples, rather than treating them only as defensive allocations.
The risks are just as direct. Over 1 year it’s still down 34.92%, and long-term holders are still under water. Upward supply pressure won’t just disappear out of thin air. If volume falls back below 200M, or if price drops back into the 0.45 range, this rotation may have only been a short-term rebound. The RWA thesis also heavily depends on macro interest rates and regulatory signals—it can’t be sustained purely by community sentiment.
Have you recently noticed the same direction in stablecoin net inflows, changes in the size of tokenized Treasuries, or large on-chain transfers? If institutional money hasn’t truly entered yet, does $ONDO look more like an intermediate stop in a liquidity rotation—or a rehearsal for the main breakout surge?
What I care about most is that this rotation could be coming from two directions: first, capital spilling over from memes and L1s, seeking assets with real yield and compliant narratives; second, an early bet that institutions will adopt RWA in the next cycle. The mispricing—or expectation gap—is whether the market is willing to award RWA leaders higher valuation multiples, rather than treating them only as defensive allocations.
The risks are just as direct. Over 1 year it’s still down 34.92%, and long-term holders are still under water. Upward supply pressure won’t just disappear out of thin air. If volume falls back below 200M, or if price drops back into the 0.45 range, this rotation may have only been a short-term rebound. The RWA thesis also heavily depends on macro interest rates and regulatory signals—it can’t be sustained purely by community sentiment.
Have you recently noticed the same direction in stablecoin net inflows, changes in the size of tokenized Treasuries, or large on-chain transfers? If institutional money hasn’t truly entered yet, does $ONDO look more like an intermediate stop in a liquidity rotation—or a rehearsal for the main breakout surge?
14
·
--
I have a hunch that this round—$ONDO —may be more than just an oversold rebound. It feels like capital is repricing the RWA narrative. This intuition needs to be validated with several sets of data: is the trading volume genuinely expanding, can the price turn $0.55 from resistance into support, and are the buy orders coming from spot or from derivatives.
Current price is $0.577: up +36% over 7 days, +63% over 30 days, but still -34% over 1 year, and it’s -73% from ATH. On September 25, that volume spike jumped from 200M to 1.06B, and the price moved from $0.41 to $0.52. After that, volume has held around $300M—this cannot be explained by retail sentiment alone. Market cap rank #40 with a $2.81B float, 24h volume of $392M, and turnover isn’t low.
What I care about more is that the capital may not be buying $ONDO itself, but rather the expectation that “real-yield assets are being tokenized and put on-chain.” The expectation gap is that the market still treats it as a leftover from the previous cycle, but the 30-day slope suggests smart money is accumulating. The problem is that there’s still 73% of downside space from the ATH, meaning there are dense overhead trapped positions, and every bounce will face sell pressure from people trying to get out.
If over the next few days the price breaks below $0.52 and volume falls back under $200M, then this move is a liquidity pulse—not a trend reversal. If it holds above $0.55 and breaks $0.60 with increased volume, then we can talk about the trend. You don’t have to agree, but don’t pick a side yet—test it first: when the market consolidates for a week, does volume stay from shrinking, or does a direct breakout with volume convince you more?
I have a hunch that this round—$ONDO —may be more than just an oversold rebound. It feels like capital is repricing the RWA narrative. This intuition needs to be validated with several sets of data: is the trading volume genuinely expanding, can the price turn $0.55 from resistance into support, and are the buy orders coming from spot or from derivatives.
Current price is $0.577: up +36% over 7 days, +63% over 30 days, but still -34% over 1 year, and it’s -73% from ATH. On September 25, that volume spike jumped from 200M to 1.06B, and the price moved from $0.41 to $0.52. After that, volume has held around $300M—this cannot be explained by retail sentiment alone. Market cap rank #40 with a $2.81B float, 24h volume of $392M, and turnover isn’t low.
What I care about more is that the capital may not be buying $ONDO itself, but rather the expectation that “real-yield assets are being tokenized and put on-chain.” The expectation gap is that the market still treats it as a leftover from the previous cycle, but the 30-day slope suggests smart money is accumulating. The problem is that there’s still 73% of downside space from the ATH, meaning there are dense overhead trapped positions, and every bounce will face sell pressure from people trying to get out.
If over the next few days the price breaks below $0.52 and volume falls back under $200M, then this move is a liquidity pulse—not a trend reversal. If it holds above $0.55 and breaks $0.60 with increased volume, then we can talk about the trend. You don’t have to agree, but don’t pick a side yet—test it first: when the market consolidates for a week, does volume stay from shrinking, or does a direct breakout with volume convince you more?
Current price is $0.577: up +36% over 7 days, +63% over 30 days, but still -34% over 1 year, and it’s -73% from ATH. On September 25, that volume spike jumped from 200M to 1.06B, and the price moved from $0.41 to $0.52. After that, volume has held around $300M—this cannot be explained by retail sentiment alone. Market cap rank #40 with a $2.81B float, 24h volume of $392M, and turnover isn’t low.
What I care about more is that the capital may not be buying $ONDO itself, but rather the expectation that “real-yield assets are being tokenized and put on-chain.” The expectation gap is that the market still treats it as a leftover from the previous cycle, but the 30-day slope suggests smart money is accumulating. The problem is that there’s still 73% of downside space from the ATH, meaning there are dense overhead trapped positions, and every bounce will face sell pressure from people trying to get out.
If over the next few days the price breaks below $0.52 and volume falls back under $200M, then this move is a liquidity pulse—not a trend reversal. If it holds above $0.55 and breaks $0.60 with increased volume, then we can talk about the trend. You don’t have to agree, but don’t pick a side yet—test it first: when the market consolidates for a week, does volume stay from shrinking, or does a direct breakout with volume convince you more?
30

·
--
$ATOM This one is a bit interesting—15m saw a volume increase of 2.84x. Price rose 0.86%, and it closed above the upper edge of the most recent ~20 five-minute candles range. The buy/sell ratio from the active side is 1.36, with a moderately bullish tilt.
But the OI is trending downward: 15m -0.03%, 1h -0.61%, and nominal still increases. Price is up while open interest is down—this looks more like short covering or position shifting rather than a structure where new long positions are aggressively entering.
The abnormal percentile is 90.9%, the whole pool is #14, and the nominal change is #40. Depth and volume have both confirmed it, and even the touch is real. But chasing this kind of setup feels uncomfortable: a short-covering push rally. Once the covering stops, it can easily lose momentum. First, see whether it can hold above the upper edge of this range. If it can’t, it’s likely a fake breakout.
$ATOM This one is a bit interesting—15m saw a volume increase of 2.84x. Price rose 0.86%, and it closed above the upper edge of the most recent ~20 five-minute candles range. The buy/sell ratio from the active side is 1.36, with a moderately bullish tilt.
But the OI is trending downward: 15m -0.03%, 1h -0.61%, and nominal still increases. Price is up while open interest is down—this looks more like short covering or position shifting rather than a structure where new long positions are aggressively entering.
The abnormal percentile is 90.9%, the whole pool is #14, and the nominal change is #40. Depth and volume have both confirmed it, and even the touch is real. But chasing this kind of setup feels uncomfortable: a short-covering push rally. Once the covering stops, it can easily lose momentum. First, see whether it can hold above the upper edge of this range. If it can’t, it’s likely a fake breakout.
But the OI is trending downward: 15m -0.03%, 1h -0.61%, and nominal still increases. Price is up while open interest is down—this looks more like short covering or position shifting rather than a structure where new long positions are aggressively entering.
The abnormal percentile is 90.9%, the whole pool is #14, and the nominal change is #40. Depth and volume have both confirmed it, and even the touch is real. But chasing this kind of setup feels uncomfortable: a short-covering push rally. Once the covering stops, it can easily lose momentum. First, see whether it can hold above the upper edge of this range. If it can’t, it’s likely a fake breakout.
4
·
--
$ENA This price looks calm and steady, only up 0.6% in 24 hours. But if you stretch it to seven days, it’s +39.74%, and in thirty days, +63%. On the surface it’s quiet, but the order book has already switched to a different face—on September 14 it was still bottoming around $0.136, and then on September 26, a bullish candle with a $1.06B trading volume pushed it straight up to $0.267. In a single candlestick, it swallowed up all the hesitation from the prior two weeks.
What I care about more is the volume structure. From $0.216 to $0.271, the price only rose 25%, yet after the 26th, there was still daily turnover of $400M–$600M without immediately drying up. This suggests it wasn’t just a one-shot spike from a single needle, and then nobody cared—there’s capital maintaining the heat above $0.26. Add to that the market cap ranking at #40 with a $2.74B size, and $ENA has shifted from a “rebound” to an attempted “trend.”
But don’t ignore another number: it’s still 82% away from the ATH of $1.52. What’s most worrying here isn’t a drop—it’s a rise to around $0.30 where you might suddenly see “good news taking profits” style sell pressure. After all, coming up from the bottom it’s already doubled, and any little breeze can trigger profit-taking. What needs confirmation in the short term is whether $ENA can use its own liquidity to turn the $0.26–$0.28 range into support rather than a ceiling when Bitcoin holds steady and the broader stablecoin narrative cools down.
Which variable do you think is most likely to overturn the “trend continuation” view—volume shrinking after $0.25 is lost, or the team’s unlocks/sales around $0.30? I haven’t said the final word yet—your turn to add.
$ENA This price looks calm and steady, only up 0.6% in 24 hours. But if you stretch it to seven days, it’s +39.74%, and in thirty days, +63%. On the surface it’s quiet, but the order book has already switched to a different face—on September 14 it was still bottoming around $0.136, and then on September 26, a bullish candle with a $1.06B trading volume pushed it straight up to $0.267. In a single candlestick, it swallowed up all the hesitation from the prior two weeks.
What I care about more is the volume structure. From $0.216 to $0.271, the price only rose 25%, yet after the 26th, there was still daily turnover of $400M–$600M without immediately drying up. This suggests it wasn’t just a one-shot spike from a single needle, and then nobody cared—there’s capital maintaining the heat above $0.26. Add to that the market cap ranking at #40 with a $2.74B size, and $ENA has shifted from a “rebound” to an attempted “trend.”
But don’t ignore another number: it’s still 82% away from the ATH of $1.52. What’s most worrying here isn’t a drop—it’s a rise to around $0.30 where you might suddenly see “good news taking profits” style sell pressure. After all, coming up from the bottom it’s already doubled, and any little breeze can trigger profit-taking. What needs confirmation in the short term is whether $ENA can use its own liquidity to turn the $0.26–$0.28 range into support rather than a ceiling when Bitcoin holds steady and the broader stablecoin narrative cools down.
Which variable do you think is most likely to overturn the “trend continuation” view—volume shrinking after $0.25 is lost, or the team’s unlocks/sales around $0.30? I haven’t said the final word yet—your turn to add.
What I care about more is the volume structure. From $0.216 to $0.271, the price only rose 25%, yet after the 26th, there was still daily turnover of $400M–$600M without immediately drying up. This suggests it wasn’t just a one-shot spike from a single needle, and then nobody cared—there’s capital maintaining the heat above $0.26. Add to that the market cap ranking at #40 with a $2.74B size, and $ENA has shifted from a “rebound” to an attempted “trend.”
But don’t ignore another number: it’s still 82% away from the ATH of $1.52. What’s most worrying here isn’t a drop—it’s a rise to around $0.30 where you might suddenly see “good news taking profits” style sell pressure. After all, coming up from the bottom it’s already doubled, and any little breeze can trigger profit-taking. What needs confirmation in the short term is whether $ENA can use its own liquidity to turn the $0.26–$0.28 range into support rather than a ceiling when Bitcoin holds steady and the broader stablecoin narrative cools down.
Which variable do you think is most likely to overturn the “trend continuation” view—volume shrinking after $0.25 is lost, or the team’s unlocks/sales around $0.30? I haven’t said the final word yet—your turn to add.
39
·
--
$ENA is currently in the high-level handoff zone after the pump. The price rose from the bottom around $0.136 to nearly double, and the bullish candle on the 26th with a massive volume of 1.06B pushed the board straight up to $0.2678. But the very next day, volume shrank to about 600M. During the day it briefly touched $0.285 before retreating; the 24h gain/loss eventually ended at just -0.27%, barely moving at all. For those who chased the price higher, this position is the most uncomfortable. Even holders watch volume halve and are unsure whether to take profits on the position they bought from around $0.13.
Over 30 days, it’s +58.19%, and the market cap has fallen back to #40. Here, a $2.69B float is changing hands rather than getting dumped immediately, suggesting that some of the holders are not willing to sell their chips at a steep discount all at once. But it’s still 82.44% short of the ATH, and 1Y performance remains -54.88%. This looks more like a repair move within the cycle rather than a new narrative starting up. What I care about most is whether there’s real support/absorption at the $0.26 platform.
If, going forward, volume returns above 800M and it can hold steady above $0.28, then that long upper shadow would count as a real test. If, instead, volume gradually contracts and the price sinks back below $0.24, then this move would only be a relatively strong one within an oversold rebound—nothing that confidently counts as the first leg of a reversal.
The unanswered question in the market right now is this: was the big-volume bullish candle on the 26th the starting point for absorbing supply, or the endpoint for phase-based distribution? The chart is still showing the setup, but the answer isn’t on that single K-line—it’s in the volume over the following days.
$ENA is currently in the high-level handoff zone after the pump. The price rose from the bottom around $0.136 to nearly double, and the bullish candle on the 26th with a massive volume of 1.06B pushed the board straight up to $0.2678. But the very next day, volume shrank to about 600M. During the day it briefly touched $0.285 before retreating; the 24h gain/loss eventually ended at just -0.27%, barely moving at all. For those who chased the price higher, this position is the most uncomfortable. Even holders watch volume halve and are unsure whether to take profits on the position they bought from around $0.13.
Over 30 days, it’s +58.19%, and the market cap has fallen back to #40. Here, a $2.69B float is changing hands rather than getting dumped immediately, suggesting that some of the holders are not willing to sell their chips at a steep discount all at once. But it’s still 82.44% short of the ATH, and 1Y performance remains -54.88%. This looks more like a repair move within the cycle rather than a new narrative starting up. What I care about most is whether there’s real support/absorption at the $0.26 platform.
If, going forward, volume returns above 800M and it can hold steady above $0.28, then that long upper shadow would count as a real test. If, instead, volume gradually contracts and the price sinks back below $0.24, then this move would only be a relatively strong one within an oversold rebound—nothing that confidently counts as the first leg of a reversal.
The unanswered question in the market right now is this: was the big-volume bullish candle on the 26th the starting point for absorbing supply, or the endpoint for phase-based distribution? The chart is still showing the setup, but the answer isn’t on that single K-line—it’s in the volume over the following days.
Over 30 days, it’s +58.19%, and the market cap has fallen back to #40. Here, a $2.69B float is changing hands rather than getting dumped immediately, suggesting that some of the holders are not willing to sell their chips at a steep discount all at once. But it’s still 82.44% short of the ATH, and 1Y performance remains -54.88%. This looks more like a repair move within the cycle rather than a new narrative starting up. What I care about most is whether there’s real support/absorption at the $0.26 platform.
If, going forward, volume returns above 800M and it can hold steady above $0.28, then that long upper shadow would count as a real test. If, instead, volume gradually contracts and the price sinks back below $0.24, then this move would only be a relatively strong one within an oversold rebound—nothing that confidently counts as the first leg of a reversal.
The unanswered question in the market right now is this: was the big-volume bullish candle on the 26th the starting point for absorbing supply, or the endpoint for phase-based distribution? The chart is still showing the setup, but the answer isn’t on that single K-line—it’s in the volume over the following days.
49
·
--
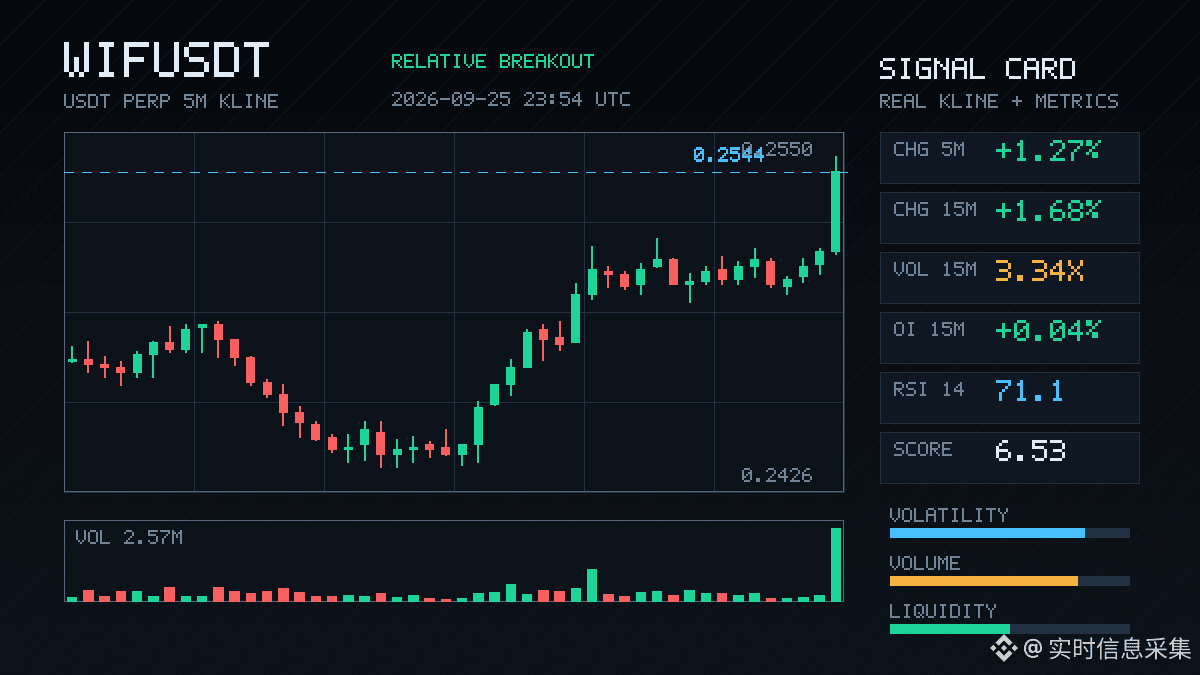
$WIF moved.
On the 15m chart, it suddenly surged by 1.68%. The volume jumped straight to 3.34x the normal level. The Z-score is 3.24, and the closing price broke through the upper trendline of the last 20 5m candles.
The key isn’t just this single bullish candle—it’s that the OI rose along with it. In 1h terms, nominal OI is +124K. The price went up and the open interest went up too, meaning new leveraged longs are entering—not that kind of “fake” short covering.
Active trade volume difference is +16.4%, buy/sell ratio is 1.39. The funding rate is also in the higher percentile recently, suggesting there are quite a lot of people chasing longs, and sentiment is getting a bit heated.
The abnormality percentile is 67.5%, ranking #11 across the whole pool; nominal change is #40. In the past 24h, turnover is 31.6M. This isn’t the most ferocious in the biggest pools, but combined with the breakout and volume, it’s worth watching for a moment in the short term.
It’s a fast rally and the funding rate is on the high side—watch for a pullback after the spike. If it truly wants to hold, you’ll need to see whether the volume can keep following through.
$WIF moved.
On the 15m chart, it suddenly surged by 1.68%. The volume jumped straight to 3.34x the normal level. The Z-score is 3.24, and the closing price broke through the upper trendline of the last 20 5m candles.
The key isn’t just this single bullish candle—it’s that the OI rose along with it. In 1h terms, nominal OI is +124K. The price went up and the open interest went up too, meaning new leveraged longs are entering—not that kind of “fake” short covering.
Active trade volume difference is +16.4%, buy/sell ratio is 1.39. The funding rate is also in the higher percentile recently, suggesting there are quite a lot of people chasing longs, and sentiment is getting a bit heated.
The abnormality percentile is 67.5%, ranking #11 across the whole pool; nominal change is #40. In the past 24h, turnover is 31.6M. This isn’t the most ferocious in the biggest pools, but combined with the breakout and volume, it’s worth watching for a moment in the short term.
It’s a fast rally and the funding rate is on the high side—watch for a pullback after the spike. If it truly wants to hold, you’ll need to see whether the volume can keep following through.
On the 15m chart, it suddenly surged by 1.68%. The volume jumped straight to 3.34x the normal level. The Z-score is 3.24, and the closing price broke through the upper trendline of the last 20 5m candles.
The key isn’t just this single bullish candle—it’s that the OI rose along with it. In 1h terms, nominal OI is +124K. The price went up and the open interest went up too, meaning new leveraged longs are entering—not that kind of “fake” short covering.
Active trade volume difference is +16.4%, buy/sell ratio is 1.39. The funding rate is also in the higher percentile recently, suggesting there are quite a lot of people chasing longs, and sentiment is getting a bit heated.
The abnormality percentile is 67.5%, ranking #11 across the whole pool; nominal change is #40. In the past 24h, turnover is 31.6M. This isn’t the most ferocious in the biggest pools, but combined with the breakout and volume, it’s worth watching for a moment in the short term.
It’s a fast rally and the funding rate is on the high side—watch for a pullback after the spike. If it truly wants to hold, you’ll need to see whether the volume can keep following through.
13

·
--
Verified
After founder Nathan Allman passed away, someone was reportedly organizing to sell Ondo Finance. The company denied it unequivocally, and Allman’s estate refused to comment—under these circumstances, ONDO jumped 26.9% in 24 hours, with the spot market up 24.7% and trading volume reaching $140 million. The price even touched 0.5327. At the same time, U.S. Treasury yields hit the highest level since 2007. BTC stayed stuck around 84,000, yet ONDO became the fastest-running coin among the altcoins. I checked CoinGecko’s trending list: market cap ranks #40 and search volume is also rising, suggesting this isn’t just a small in-group self-congratulating. What is the market betting on? That the token will have a buyer if the company is acquired—or that with the founder gone, the governance vacuum will actually make negotiations easier? The company denies a sale, and the estate stays silent. Put together, it gives buyers an even bigger imagination space. With a move like this, I’m not too sure I’d chase it. A fundamental change like the founder’s death is being treated as a positive catalyst—the logic is backwards. $ONDO
After founder Nathan Allman passed away, someone was reportedly organizing to sell Ondo Finance. The company denied it unequivocally, and Allman’s estate refused to comment—under these circumstances, ONDO jumped 26.9% in 24 hours, with the spot market up 24.7% and trading volume reaching $140 million. The price even touched 0.5327. At the same time, U.S. Treasury yields hit the highest level since 2007. BTC stayed stuck around 84,000, yet ONDO became the fastest-running coin among the altcoins. I checked CoinGecko’s trending list: market cap ranks #40 and search volume is also rising, suggesting this isn’t just a small in-group self-congratulating. What is the market betting on? That the token will have a buyer if the company is acquired—or that with the founder gone, the governance vacuum will actually make negotiations easier? The company denies a sale, and the estate stays silent. Put together, it gives buyers an even bigger imagination space. With a move like this, I’m not too sure I’d chase it. A fundamental change like the founder’s death is being treated as a positive catalyst—the logic is backwards. $ONDO

129
·
--
$UAI On this side, I just saw a relatively breakout—on the 15m timeframe it pulled up 1.91%. Volume surged to 1.92x, with aggressive buy-side orders showing a +10.3% imbalance; buy/sell ratio is 1.23. The closing price directly pushed through the upper bound of the last 20-odd 5m candles.
What’s even more interesting is the OI: 15m is +0.07%, 1h is +0.04%. Nominals are being lifted slightly, the percentile is 79.4%, and the overall pool’s nominal change ranks at #40. Price is rising and positions are rising along with it—this structure is more like fresh leveraged long entries rather than shorts covering on hype.
In the last 24h, turnover is 51.65M, and the order book depth is sufficient—not the kind of move where you just poke in and leave. Right now it remains to see whether it can hold above the top of this range. If it can hold, there may be another leg. If volume shrinks and it falls back, then just treat it as if you didn’t see it.
$UAI On this side, I just saw a relatively breakout—on the 15m timeframe it pulled up 1.91%. Volume surged to 1.92x, with aggressive buy-side orders showing a +10.3% imbalance; buy/sell ratio is 1.23. The closing price directly pushed through the upper bound of the last 20-odd 5m candles.
What’s even more interesting is the OI: 15m is +0.07%, 1h is +0.04%. Nominals are being lifted slightly, the percentile is 79.4%, and the overall pool’s nominal change ranks at #40. Price is rising and positions are rising along with it—this structure is more like fresh leveraged long entries rather than shorts covering on hype.
In the last 24h, turnover is 51.65M, and the order book depth is sufficient—not the kind of move where you just poke in and leave. Right now it remains to see whether it can hold above the top of this range. If it can hold, there may be another leg. If volume shrinks and it falls back, then just treat it as if you didn’t see it.
What’s even more interesting is the OI: 15m is +0.07%, 1h is +0.04%. Nominals are being lifted slightly, the percentile is 79.4%, and the overall pool’s nominal change ranks at #40. Price is rising and positions are rising along with it—this structure is more like fresh leveraged long entries rather than shorts covering on hype.
In the last 24h, turnover is 51.65M, and the order book depth is sufficient—not the kind of move where you just poke in and leave. Right now it remains to see whether it can hold above the top of this range. If it can hold, there may be another leg. If volume shrinks and it falls back, then just treat it as if you didn’t see it.
4

Article
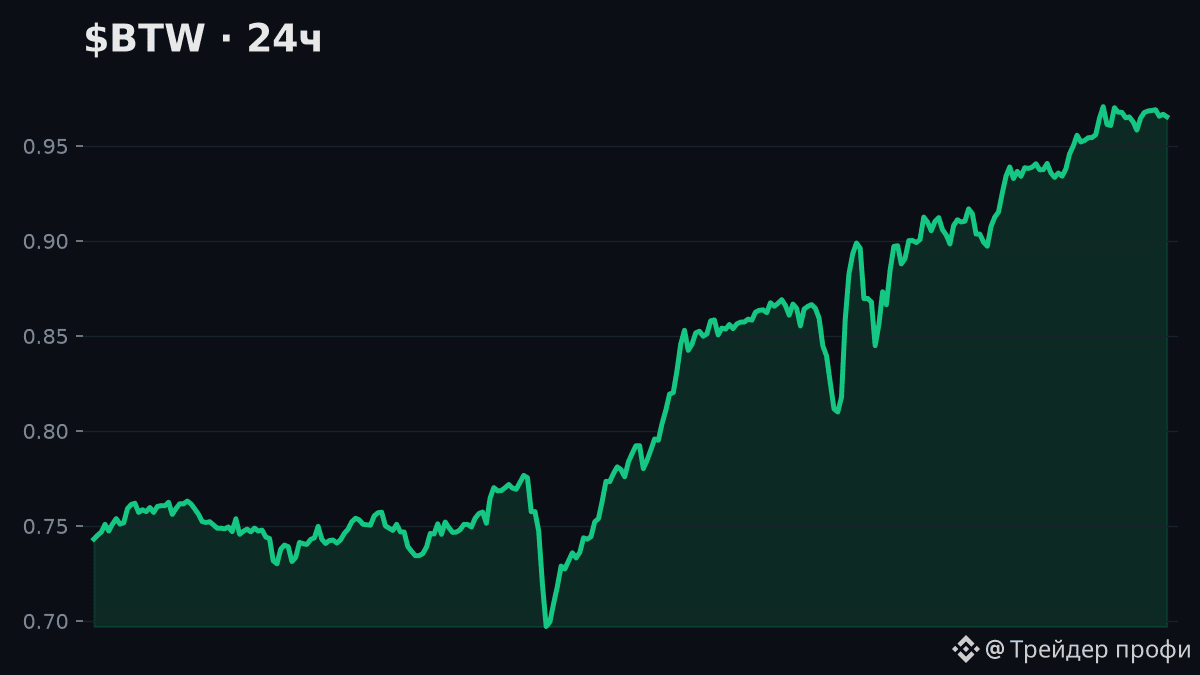
$BTW +30.1% in 24h — hit the maximum gain among the top 100!⚡ $BTW +30.1% in 24h — I hit the maximum gain among the top 100!
We collected the hottest picks for you in the last 24 hours. 🔥
🧭 Summary: the move is following a broader trend — 7D and 30D are pointing in the same direction; volume is low — the price action may be unstable.
🌍 Market context: out of 70 major coins with noticeable movement in the last 24h — 🔼 58 increased, 🔽 12 fell
$BTW +30.1% in 24h — hit the maximum gain among the top 100!
⚡ $BTW +30.1% in 24h — I hit the maximum gain among the top 100!
We collected the hottest picks for you in the last 24 hours. 🔥
🧭 Summary: the move is following a broader trend — 7D and 30D are pointing in the same direction; volume is low — the price action may be unstable.
🌍 Market context: out of 70 major coins with noticeable movement in the last 24h — 🔼 58 increased, 🔽 12 fell
We collected the hottest picks for you in the last 24 hours. 🔥
🧭 Summary: the move is following a broader trend — 7D and 30D are pointing in the same direction; volume is low — the price action may be unstable.
🌍 Market context: out of 70 major coins with noticeable movement in the last 24h — 🔼 58 increased, 🔽 12 fell
72
·
--
$RENDER has something.
On the 15m, it directly topped up to about 20 of the 5m band’s upper edge, with volume at 2.55x, and the aggressive buy/sell ratio at 2.06—this isn’t a retail trader casually pushing it.
The key is OI—15m +1.19%, 1h +1.28%, an anomalous percentile of 98.4%, and the nominal change across the whole pool is #40. Price is rising along with open interest; new leveraged longs are entering—this isn’t a fake move from short covering.
If it continues across several cycles, the whole pool is anomalous #6. At this position, it’s either pre-launch buildup or a trap set for people chasing. The 24h trading value is only 21M, liquidity isn’t very thick. One big bullish candle can push it up, and one big bearish candle can also smash it.
I’m watching—no rush to act.
$RENDER has something.
On the 15m, it directly topped up to about 20 of the 5m band’s upper edge, with volume at 2.55x, and the aggressive buy/sell ratio at 2.06—this isn’t a retail trader casually pushing it.
The key is OI—15m +1.19%, 1h +1.28%, an anomalous percentile of 98.4%, and the nominal change across the whole pool is #40. Price is rising along with open interest; new leveraged longs are entering—this isn’t a fake move from short covering.
If it continues across several cycles, the whole pool is anomalous #6. At this position, it’s either pre-launch buildup or a trap set for people chasing. The 24h trading value is only 21M, liquidity isn’t very thick. One big bullish candle can push it up, and one big bearish candle can also smash it.
I’m watching—no rush to act.
On the 15m, it directly topped up to about 20 of the 5m band’s upper edge, with volume at 2.55x, and the aggressive buy/sell ratio at 2.06—this isn’t a retail trader casually pushing it.
The key is OI—15m +1.19%, 1h +1.28%, an anomalous percentile of 98.4%, and the nominal change across the whole pool is #40. Price is rising along with open interest; new leveraged longs are entering—this isn’t a fake move from short covering.
If it continues across several cycles, the whole pool is anomalous #6. At this position, it’s either pre-launch buildup or a trap set for people chasing. The 24h trading value is only 21M, liquidity isn’t very thick. One big bullish candle can push it up, and one big bearish candle can also smash it.
I’m watching—no rush to act.
5
Log in to explore more content
Join global crypto users on Binance Square
⚡️ Get latest and useful information about crypto.
💬 Trusted by the world’s largest crypto exchange.
👍 Discover real insights from verified creators.
Email / Phone number
Trending Topics
1
#FedMinutesFocusOnOctoberPause
130,404 views
1,167 Discussing
2
#BinanceLaunchesBinanceIntelligence
1.1M views
6,374 Discussing
3
#EvernorthDelaysNasdaqDebutToOct12
9,365 views
245 Discussing
4
#RobinhoodAdds$25MInBitcoinToBalanceSheet
2,726 views
61 Discussing
5
#SP500AndNasdaqHitRecordHighs
17,104 views
442 Discussing
6
#USMortgageRatesRiseTo7.49%
20,210 views
356 Discussing
7
#BTCFallsBelow$84K
114,227 views
229 Discussing
8
#DubaiVARAIssuesReserveAssetAuditCircular
43,282 views
930 Discussing
9
#SECApproves3XBitcoinETF
40,374 views
760 Discussing
10
#WinklevossFilesSpotZcashETFApplication
48,533 views
863 Discussing