

#178
178
448 views
19 Discussing
Hot
Latest

·
--
M Surges 4.9% in 5 Minutes! What Happened? Key Levels Here19:00 (2 minutes ago): M surged 4.9% within 5 minutes (5-minute window: 18:55→19:00). As of 19:02:54, the current price is 0.8128, down 13.9% over 24h. Other tokens showing unusual moves around the same time include CTK and W.
📅 Data as of 19:02:54 (event trigger times are noted for each item; prices are real-time snapshots taken at the time of writing)
📌 One-line takeaway: Short-term momentum is concentrated, and pullbacks often come quickly—staggered limit orders are safer than chasing highs
Market overview: BTC 83,238.90 (-0.23%) · ETH 2,497.03 (-2.20%); across the market, 46 assets rose and 447 fell in 24h; top 24h gainer: OGN +25.19%, biggest loser: ARC -60.46%.
M Surges 4.9% in 5 Minutes! What Happened? Key Levels Here
19:00 (2 minutes ago): M surged 4.9% within 5 minutes (5-minute window: 18:55→19:00). As of 19:02:54, the current price is 0.8128, down 13.9% over 24h. Other tokens showing unusual moves around the same time include CTK and W.
📅 Data as of 19:02:54 (event trigger times are noted for each item; prices are real-time snapshots taken at the time of writing)
📌 One-line takeaway: Short-term momentum is concentrated, and pullbacks often come quickly—staggered limit orders are safer than chasing highs
Market overview: BTC 83,238.90 (-0.23%) · ETH 2,497.03 (-2.20%); across the market, 46 assets rose and 447 fell in 24h; top 24h gainer: OGN +25.19%, biggest loser: ARC -60.46%.
·
--
BLUR Surges 1.7% at a Key Time Point! What Happened? Key Levels HereAt 12:03 (28 minutes ago), BLUR surged 1.7% at a key time point (5-minute window: 11:58→12:03). As of 12:31:58, the current price is 0.0133, down 29.4% over 24h. COLLECT and W also saw unusual moves around the same time.
📅 Data as of 12:31:58 (event trigger times are noted for each item; prices are real-time snapshots taken when this was written)
📌 In a nutshell: Unusual moves during key periods (candlestick closes / U.S. stock market opens and closes) often involve institutional participation, making them more reliable signals.
Market overview: BTC 83,351.60 (-0.41%) · ETH 2,512.19 (-1.58%); across the market, 53 assets rose and 440 fell in 24h; top 24h gainer: GTC +36.87%, top loser: ARC -36.92%.
BLUR Surges 1.7% at a Key Time Point! What Happened? Key Levels Here
At 12:03 (28 minutes ago), BLUR surged 1.7% at a key time point (5-minute window: 11:58→12:03). As of 12:31:58, the current price is 0.0133, down 29.4% over 24h. COLLECT and W also saw unusual moves around the same time.
📅 Data as of 12:31:58 (event trigger times are noted for each item; prices are real-time snapshots taken when this was written)
📌 In a nutshell: Unusual moves during key periods (candlestick closes / U.S. stock market opens and closes) often involve institutional participation, making them more reliable signals.
Market overview: BTC 83,351.60 (-0.41%) · ETH 2,512.19 (-1.58%); across the market, 53 assets rose and 440 fell in 24h; top 24h gainer: GTC +36.87%, top loser: ARC -36.92%.
2
·
--
GPS suddenly plunges 2.2% at a key time! Panic or opportunity? A quick look at support levelsAt 11:09 (11 minutes ago), GPS dropped 2.2% at a key time point (5-minute window 11:04→11:09). As of 11:20:50, the current price is 0.007949, down 24.3% over 24h. Other tokens showing similar moves include W and AVNT.
📅 Data as of 11:20:50 (event trigger times are noted for each item; prices are live snapshots at the time of writing)
📌 In a nutshell: Moves during key periods (candle closes / U.S. market opens and closes) often involve institutional participation, making the signals more reliable
Market overview: BTC 82,769.50(-1.00%) · ETH 2,486.88(-2.18%); across the market, 45 gainers / 448 decliners over 24h; top 24h gainer GTC+34.48%, top decliner ARC-42.33%.
GPS suddenly plunges 2.2% at a key time! Panic or opportunity? A quick look at support levels
At 11:09 (11 minutes ago), GPS dropped 2.2% at a key time point (5-minute window 11:04→11:09). As of 11:20:50, the current price is 0.007949, down 24.3% over 24h. Other tokens showing similar moves include W and AVNT.
📅 Data as of 11:20:50 (event trigger times are noted for each item; prices are live snapshots at the time of writing)
📌 In a nutshell: Moves during key periods (candle closes / U.S. market opens and closes) often involve institutional participation, making the signals more reliable
Market overview: BTC 82,769.50(-1.00%) · ETH 2,486.88(-2.18%); across the market, 45 gainers / 448 decliners over 24h; top 24h gainer GTC+34.48%, top decliner ARC-42.33%.
5
·
--
MANTA surges 4.0% in 5 minutes! What happened? Key levels are here18:05 (7 minutes ago): MANTA surged 4.0% within 5 minutes (5-minute window: 18:00→18:05). As of 18:12:53, the current price is 0.07598, up 15.3% over 24h. Other assets showing similar moves include MAGIC and CHIP.
📅 Data as of 18:12:53 (event trigger times are noted for each item; prices are live snapshots taken when this was written)
📌 In a nutshell: Short-term momentum is concentrated, and pullbacks can come quickly—placing staggered limit orders is steadier than chasing prices higher.
Market overview: BTC 83,004.50 (+0.27%) · ETH 2,500.75 (+0.26%); across the market, 221 assets rose and 180 fell over 24h; top gainer: STRK +52.47%, top loser: RVN -9.13%.
MANTA surges 4.0% in 5 minutes! What happened? Key levels are here
18:05 (7 minutes ago): MANTA surged 4.0% within 5 minutes (5-minute window: 18:00→18:05). As of 18:12:53, the current price is 0.07598, up 15.3% over 24h. Other assets showing similar moves include MAGIC and CHIP.
📅 Data as of 18:12:53 (event trigger times are noted for each item; prices are live snapshots taken when this was written)
📌 In a nutshell: Short-term momentum is concentrated, and pullbacks can come quickly—placing staggered limit orders is steadier than chasing prices higher.
Market overview: BTC 83,004.50 (+0.27%) · ETH 2,500.75 (+0.26%); across the market, 221 assets rose and 180 fell over 24h; top gainer: STRK +52.47%, top loser: RVN -9.13%.
3
·
--
PUMPBTC surges 9.4% on a breakout! Can you chase moves like this?13:30 (6 minutes ago) PUMPBTC saw a surge of 9.4% within 15 minutes (15-minute window 13:15→13:30). As of 13:37:38, the current price is 0.01694, up 102.6% over 24h. Other movers in the same batch include AWE and GRIFFAIN.
📅 Data as of 13:37:38 (event trigger times are noted on each item; prices are real-time snapshots at the time of writing)
📌 One-sentence takeaway: The 15-minute trend is being amplified—decide where to set your stop loss before the trend starts.
Market overview: BTC 85,678.00(+0.96%) · ETH 2,702.04(+0.31%); 205 gainers / 286 decliners across the market over the past 24h; Top gainer in the past 24h: PUMPBTC +102.63%, worst performer: US-29.04%.
PUMPBTC surges 9.4% on a breakout! Can you chase moves like this?
13:30 (6 minutes ago) PUMPBTC saw a surge of 9.4% within 15 minutes (15-minute window 13:15→13:30). As of 13:37:38, the current price is 0.01694, up 102.6% over 24h. Other movers in the same batch include AWE and GRIFFAIN.
📅 Data as of 13:37:38 (event trigger times are noted on each item; prices are real-time snapshots at the time of writing)
📌 One-sentence takeaway: The 15-minute trend is being amplified—decide where to set your stop loss before the trend starts.
Market overview: BTC 85,678.00(+0.96%) · ETH 2,702.04(+0.31%); 205 gainers / 286 decliners across the market over the past 24h; Top gainer in the past 24h: PUMPBTC +102.63%, worst performer: US-29.04%.
·
--
MAGMA drops 6.4% on the move! These support levels are worth watching11:11 (just now) MAGMA saw a drop of 6.4% within 5 minutes (5-minute window 11:06→11:11). As of 11:12:15, the current price is 0.2329, with 24h -7.3%. Other movers in the same batch include AIN and AWE.
📅 Data as of 11:12:15 (event trigger time is noted in each item; prices are real-time snapshots at the time of writing)
📌 One-sentence highlights: short-term momentum is concentrated, and pullbacks often come and go quickly—placing staggered orders is more stable than chasing highs
Market Overview: BTC 86,450.30 (+1.99%) · ETH 2,727.94 (+1.35%); across the whole market, 352 stocks up / 133 down over 24h; top gainer in 24h: GTC +65.75%, worst performer: US -33.11%.
MAGMA drops 6.4% on the move! These support levels are worth watching
11:11 (just now) MAGMA saw a drop of 6.4% within 5 minutes (5-minute window 11:06→11:11). As of 11:12:15, the current price is 0.2329, with 24h -7.3%. Other movers in the same batch include AIN and AWE.
📅 Data as of 11:12:15 (event trigger time is noted in each item; prices are real-time snapshots at the time of writing)
📌 One-sentence highlights: short-term momentum is concentrated, and pullbacks often come and go quickly—placing staggered orders is more stable than chasing highs
Market Overview: BTC 86,450.30 (+1.99%) · ETH 2,727.94 (+1.35%); across the whole market, 352 stocks up / 133 down over 24h; top gainer in 24h: GTC +65.75%, worst performer: US -33.11%.
2

·
--
I've been scanning CoinGecko's trending list and Zcash (ZEC) jumps out with a solid +8.3% surge, keeping its spot at rank #11. Close behind, Lighter (LIT) climbs +5.7%, and Dash (DASH) nudges up +4.2%. These moves signal fresh momentum in privacy‑focused assets, and I'm keeping an eye on them. 🚀
Next on my radar are the mid‑cap contenders: MarsCoin (MARSCOIN) spikes +12.1% to rank #178, while Lil' Shrub (SHRUB) rallies +9.4% at #332. Pons (PONS) surprises with a +7.8% lift, breaking into the top 110. Such volatility offers entry points for traders looking to diversify beyond the giants. 🌕
Finally, the under‑the‑radar player Cluster Protocol (CP) shows a modest +3.5% bump despite its #518 rank, hinting at a possible breakout. I think these eight tokens illustrate how varied the market can be, from established names to hidden gems. Stay tuned, and I'll keep you posted on any new spikes. ✨
$MARSCOIN, $DASH, $MARSCOIN
I've been scanning CoinGecko's trending list and Zcash (ZEC) jumps out with a solid +8.3% surge, keeping its spot at rank #11. Close behind, Lighter (LIT) climbs +5.7%, and Dash (DASH) nudges up +4.2%. These moves signal fresh momentum in privacy‑focused assets, and I'm keeping an eye on them. 🚀
Next on my radar are the mid‑cap contenders: MarsCoin (MARSCOIN) spikes +12.1% to rank #178, while Lil' Shrub (SHRUB) rallies +9.4% at #332. Pons (PONS) surprises with a +7.8% lift, breaking into the top 110. Such volatility offers entry points for traders looking to diversify beyond the giants. 🌕
Finally, the under‑the‑radar player Cluster Protocol (CP) shows a modest +3.5% bump despite its #518 rank, hinting at a possible breakout. I think these eight tokens illustrate how varied the market can be, from established names to hidden gems. Stay tuned, and I'll keep you posted on any new spikes. ✨
$MARSCOIN , $DASH , $MARSCOIN
352

·
--
** How to Identify Support and Resistance Points in Technical Analysis? 📊STONK (STONKUSDT) is trending right now!
Rank: #178
** Hello crypto traders! 👋 Today, we will explain step by step how to identify support and resistance points, one of the fundamental concepts in technical analysis. This information is very important for improving your trading strategy. 💡 **Step 1: What Are Support and Resistance? 🤔** Support is a level that prevents an asset’s price from falling. When the price reaches this level, it usually rises again. Resistance, on the other hand, is a level that prevents an asset’s price from rising. When the price reaches this level, it usually falls again. **Step 2: Do Chart Analysis 📊** While doing chart analysis of an asset (for example, ), pay attention to the following: * Examine the asset’s previous price movements. * Identify the points where the price repeatedly rises or falls at certain levels. **Step 3: Determine Support and Resistance Levels 🎯** For example, 's current price is 76660.42 $. By looking at past price movements, we can determine support and resistance levels: * Support level: 70000 $ (the level where the price previously fell and then rose again) * Resistance level: 80000 $ (the level where the price previously rose and then fell again) **Step 4: Practical Application Suggestions 📈** * Consider buying at a price close to the support level. If the price breaks this level, it may drop to lower levels. * Consider selling at a price close to the resistance level. If the price breaks above this level, it may move to higher lev
** How to Identify Support and Resistance Points in Technical Analysis? 📊
STONK (STONKUSDT) is trending right now!
Rank: #178
** Hello crypto traders! 👋 Today, we will explain step by step how to identify support and resistance points, one of the fundamental concepts in technical analysis. This information is very important for improving your trading strategy. 💡 **Step 1: What Are Support and Resistance? 🤔** Support is a level that prevents an asset’s price from falling. When the price reaches this level, it usually rises again. Resistance, on the other hand, is a level that prevents an asset’s price from rising. When the price reaches this level, it usually falls again. **Step 2: Do Chart Analysis 📊** While doing chart analysis of an asset (for example, ), pay attention to the following: * Examine the asset’s previous price movements. * Identify the points where the price repeatedly rises or falls at certain levels. **Step 3: Determine Support and Resistance Levels 🎯** For example, 's current price is 76660.42 $. By looking at past price movements, we can determine support and resistance levels: * Support level: 70000 $ (the level where the price previously fell and then rose again) * Resistance level: 80000 $ (the level where the price previously rose and then fell again) **Step 4: Practical Application Suggestions 📈** * Consider buying at a price close to the support level. If the price breaks this level, it may drop to lower levels. * Consider selling at a price close to the resistance level. If the price breaks above this level, it may move to higher lev
1

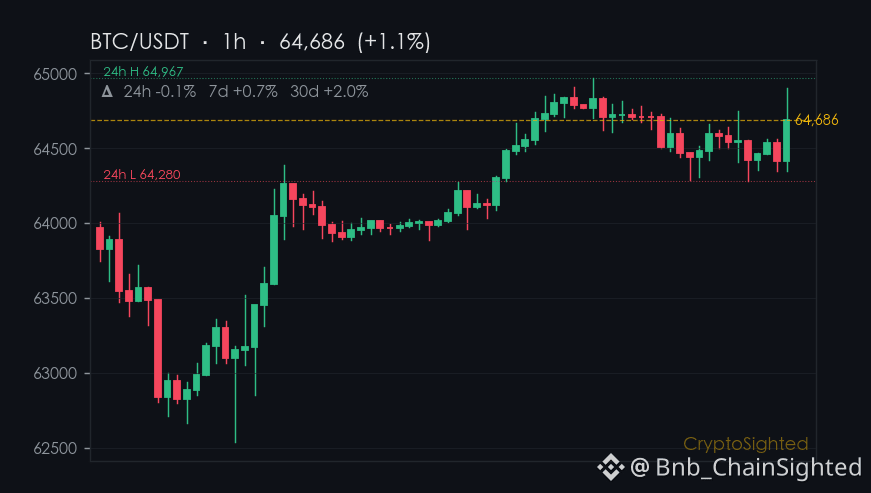
0.5% — that’s the range $BTC has been stuck in, barely moving, while the rest of the market surges.
BTC is flat, quiet, and barely moving — just 8,481 tokens traded in 24 hours.
Meanwhile, $PUMP is up 96.8% on a flood of volume — 4.1 billion tokens traded in 24 hours.
The 7-day return is up 2.6%, and the 30-day is up 0.7%. That’s a slow climb, not a breakout.
—
Not financial advice. DYOR.
📌 Hotspot Watch · #178 · #CryptoTrends #CryptoSighted $BTC
456
Log in to explore more content
Join global crypto users on Binance Square
⚡️ Get latest and useful information about crypto.
💬 Trusted by the world’s largest crypto exchange.
👍 Discover real insights from verified creators.
Email / Phone number
Trending Topics
1
#BinancePick
3.3M views
161,596 Discussing
2
#EarningsSeason
5.4M views
26,556 Discussing
3
#StrategySkipsBitcoinPurchasesSpends$205MOnSTRCBuybacks
56 views
6 Discussing
4
#BitmineAdds10452ETH
3,875 views
108 Discussing
5
#SouthKoreaConsidersEducationTaxOnCryptoExchanges
4,018 views
100 Discussing
6
#OCCUrgesCommunityBanksToEnterStablecoinPayments
3,121 views
64 Discussing
7
#RippleWinsFullApprovalAsNationalTrustBank
2,872 views
65 Discussing
8
#AkashSelectsSolanaAsMigrationTarget
1,235 views
25 Discussing
9
#OndoToOpenSubscriptionsForOpenAIPreIPOTokenizedNotes
120 views
7 Discussing
10
#AnthropicTTMRevenueGrewAbout1200%
51,483 views
539 Discussing