
#15
15
35,921 views
258 Discussing
Hot
Latest

·
--
Cryptocurrency mining company American Bitcoin Corp (known on the Nasdaq exchange under the ticker ABTC) officially announced the execution of a reverse stock split (Reverse Stock Split) at a ratio of 1 for 15. Share reduction: This split will reduce the company’s issued shares from approximately 1.09 billion shares to about 73 million shares (specifically, a 93.3% reduction). This means the consolidation of shares: every 15 old shares that an investor holds in their portfolio will be automatically consolidated into one corresponding share, and the stock will immediately increase by #15 x to offset the decline. This will take effect officially after the stock market closes on July 2, and trading in the shares will begin on July 6, 2026.
Cryptocurrency mining company American Bitcoin Corp (known on the Nasdaq exchange under the ticker ABTC) officially announced the execution of a reverse stock split (Reverse Stock Split) at a ratio of 1 for 15. Share reduction: This split will reduce the company’s issued shares from approximately 1.09 billion shares to about 73 million shares (specifically, a 93.3% reduction). This means the consolidation of shares: every 15 old shares that an investor holds in their portfolio will be automatically consolidated into one corresponding share, and the stock will immediately increase by #15 x to offset the decline. This will take effect officially after the stock market closes on July 2, and trading in the shares will begin on July 6, 2026.

ABTCUS+2.54%
128

·
--
$VVV This wave of a 15m move is somewhat interesting. The price is up 2.41%—it doesn’t look that impressive at first glance—but the OI is also dropping: 15m -0.24%, 1h -1.43%. Nominally it’s still positive, which suggests new money is pushing the price higher, but positions being closed causes net open interest to shrink. This is a typical short-covering structure.
More importantly, the price has just broken above the upper edge of the last ~20 5m K-bars. Active trade imbalance is +22.2%, and the buy/sell ratio is 1.57. The bids are really pushing—not the kind of fake breakout that spikes with a single push and then immediately falls back. The OI percentile is extremely high at 90.9%. In the whole pool, ranking is #15 by position, and #17 by nominal change. Multiple consecutive cycles have been in the front ranks. This kind of consistency is far more trustworthy than just one period spiking.
24h trading volume is 148 million, liquidity is sufficient, and depth also confirms the range boundaries. Now we just need to see whether this short-covering wave can turn into a real trend increment. If OI continues to fall while the price keeps being pushed upward, then be careful—it could be the final leg of a squeeze. Keep watching first; don’t rush to chase.
$VVV This wave of a 15m move is somewhat interesting. The price is up 2.41%—it doesn’t look that impressive at first glance—but the OI is also dropping: 15m -0.24%, 1h -1.43%. Nominally it’s still positive, which suggests new money is pushing the price higher, but positions being closed causes net open interest to shrink. This is a typical short-covering structure.
More importantly, the price has just broken above the upper edge of the last ~20 5m K-bars. Active trade imbalance is +22.2%, and the buy/sell ratio is 1.57. The bids are really pushing—not the kind of fake breakout that spikes with a single push and then immediately falls back. The OI percentile is extremely high at 90.9%. In the whole pool, ranking is #15 by position, and #17 by nominal change. Multiple consecutive cycles have been in the front ranks. This kind of consistency is far more trustworthy than just one period spiking.
24h trading volume is 148 million, liquidity is sufficient, and depth also confirms the range boundaries. Now we just need to see whether this short-covering wave can turn into a real trend increment. If OI continues to fall while the price keeps being pushed upward, then be careful—it could be the final leg of a squeeze. Keep watching first; don’t rush to chase.
More importantly, the price has just broken above the upper edge of the last ~20 5m K-bars. Active trade imbalance is +22.2%, and the buy/sell ratio is 1.57. The bids are really pushing—not the kind of fake breakout that spikes with a single push and then immediately falls back. The OI percentile is extremely high at 90.9%. In the whole pool, ranking is #15 by position, and #17 by nominal change. Multiple consecutive cycles have been in the front ranks. This kind of consistency is far more trustworthy than just one period spiking.
24h trading volume is 148 million, liquidity is sufficient, and depth also confirms the range boundaries. Now we just need to see whether this short-covering wave can turn into a real trend increment. If OI continues to fall while the price keeps being pushed upward, then be careful—it could be the final leg of a squeeze. Keep watching first; don’t rush to chase.
44
·
--
$INJ there’s a bit of movement.
15m: it’s up 1.33%, volume is 1.59x, and the price breaks straight through the recent 5m upper range line, hugging that upper boundary. The key isn’t this single bullish candle—it’s that OI is rising in sync: 15m +0.42%, 1h +0.23%, and the notional changes are also moving upward, with the abnormal percentile at 92.1%.
Price rises + OI rises—structurally it looks more like new leveraged long positions are entering, not a short squeeze type of fake pull. Passive/active trade gap is 19.3%, buy/sell ratio is 1.48, and the order flow is clearly biased to the buy side.
24h turnover is 92M; the abnormality level ranks at #15 in the pool, notional change is #13. Multiple consecutive periods are continuing—this isn’t just a single impulse.
Watch whether it can hold above this range’s upper edge. If it can’t, it’s a fake breakout; if it can, there may be another leg up.
$INJ there’s a bit of movement.
15m: it’s up 1.33%, volume is 1.59x, and the price breaks straight through the recent 5m upper range line, hugging that upper boundary. The key isn’t this single bullish candle—it’s that OI is rising in sync: 15m +0.42%, 1h +0.23%, and the notional changes are also moving upward, with the abnormal percentile at 92.1%.
Price rises + OI rises—structurally it looks more like new leveraged long positions are entering, not a short squeeze type of fake pull. Passive/active trade gap is 19.3%, buy/sell ratio is 1.48, and the order flow is clearly biased to the buy side.
24h turnover is 92M; the abnormality level ranks at #15 in the pool, notional change is #13. Multiple consecutive periods are continuing—this isn’t just a single impulse.
Watch whether it can hold above this range’s upper edge. If it can’t, it’s a fake breakout; if it can, there may be another leg up.
15m: it’s up 1.33%, volume is 1.59x, and the price breaks straight through the recent 5m upper range line, hugging that upper boundary. The key isn’t this single bullish candle—it’s that OI is rising in sync: 15m +0.42%, 1h +0.23%, and the notional changes are also moving upward, with the abnormal percentile at 92.1%.
Price rises + OI rises—structurally it looks more like new leveraged long positions are entering, not a short squeeze type of fake pull. Passive/active trade gap is 19.3%, buy/sell ratio is 1.48, and the order flow is clearly biased to the buy side.
24h turnover is 92M; the abnormality level ranks at #15 in the pool, notional change is #13. Multiple consecutive periods are continuing—this isn’t just a single impulse.
Watch whether it can hold above this range’s upper edge. If it can’t, it’s a fake breakout; if it can, there may be another leg up.
3

·
--
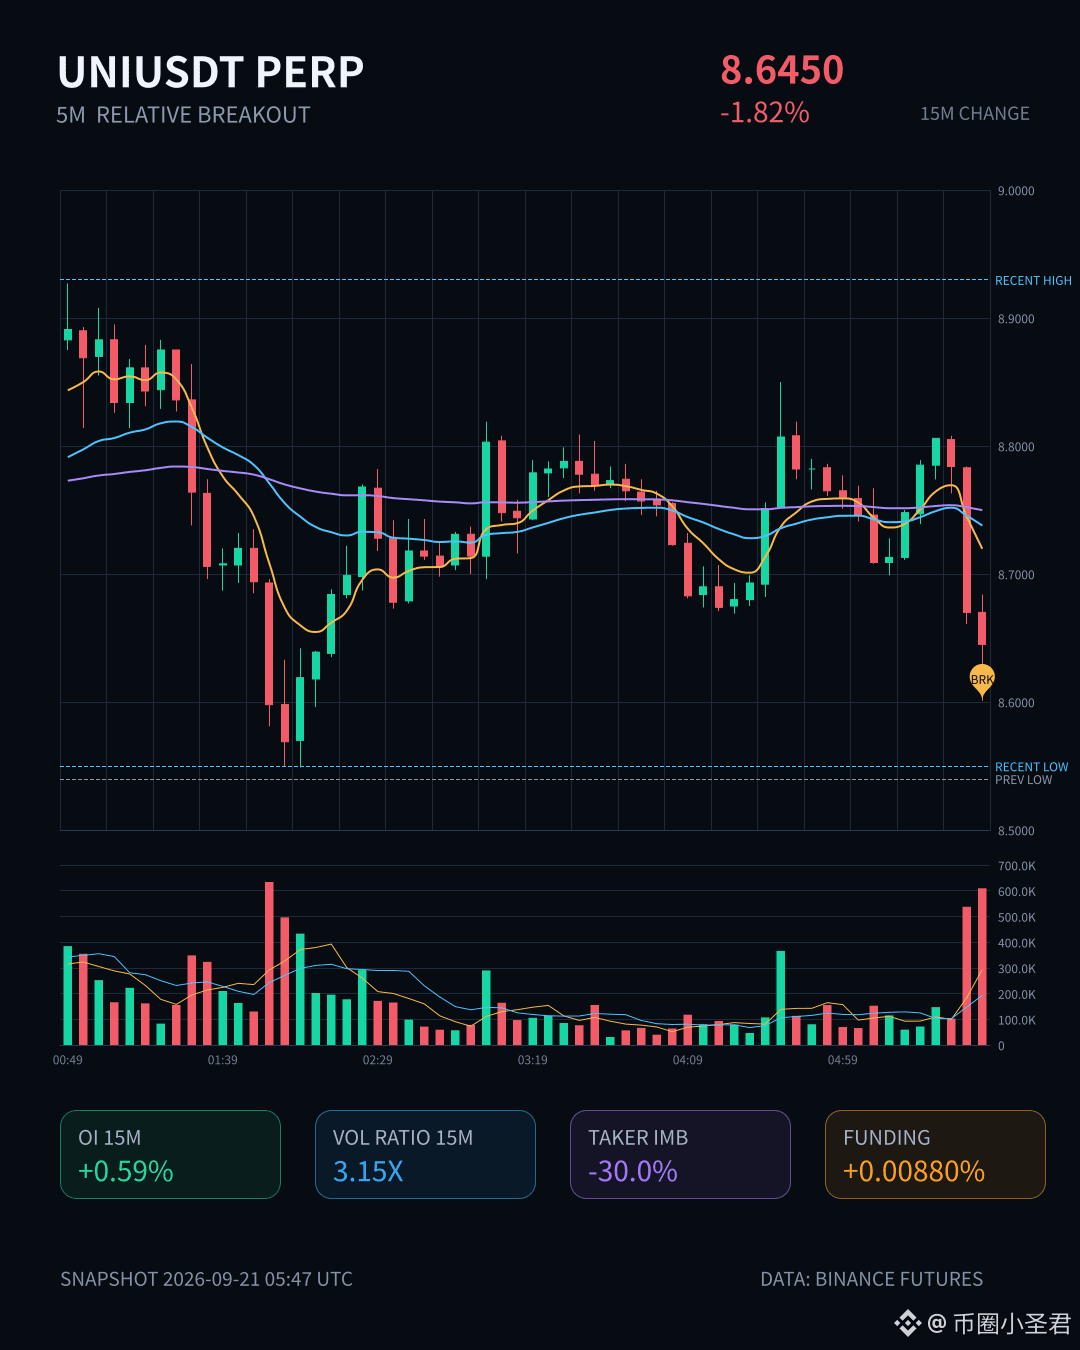
$UNI This 15-minute move is kind of interesting.
Price dropped 1.82%, and volume directly surged to 3.15x. The volatility Z is 2.45, and the 5m close broke below the lower edge of the near-20-bar range. But the key is OI—on the 15m contract +0.59%, on the 1h +1.08%, with an abnormal percentile of 89.7%. Across the whole pool, abnormal #15 and nominal change #4.
Price is down while OI is up—this combo isn’t just simple long liquidation or stop-loss. It looks more like newly added leveraged shorts entering. Active trade imbalance is -30%, and the buy/sell ratio is 0.54. The direction of selling pressure is very clear.
Multiple consecutive cycles show abnormal OI continuing, and the depth is also sufficient—trading volume is higher than usual, it hits the boundary of the range, and the direction is somewhat skewed. I’ll keep an eye on this structure going forward. If OI keeps building but price doesn’t accelerate downward, then be careful about a reverse squeeze after shorts get crowded.
24h turnover is 419M. There’s plenty of money in the pool—don’t rush to chase.
$UNI This 15-minute move is kind of interesting.
Price dropped 1.82%, and volume directly surged to 3.15x. The volatility Z is 2.45, and the 5m close broke below the lower edge of the near-20-bar range. But the key is OI—on the 15m contract +0.59%, on the 1h +1.08%, with an abnormal percentile of 89.7%. Across the whole pool, abnormal #15 and nominal change #4.
Price is down while OI is up—this combo isn’t just simple long liquidation or stop-loss. It looks more like newly added leveraged shorts entering. Active trade imbalance is -30%, and the buy/sell ratio is 0.54. The direction of selling pressure is very clear.
Multiple consecutive cycles show abnormal OI continuing, and the depth is also sufficient—trading volume is higher than usual, it hits the boundary of the range, and the direction is somewhat skewed. I’ll keep an eye on this structure going forward. If OI keeps building but price doesn’t accelerate downward, then be careful about a reverse squeeze after shorts get crowded.
24h turnover is 419M. There’s plenty of money in the pool—don’t rush to chase.
Price dropped 1.82%, and volume directly surged to 3.15x. The volatility Z is 2.45, and the 5m close broke below the lower edge of the near-20-bar range. But the key is OI—on the 15m contract +0.59%, on the 1h +1.08%, with an abnormal percentile of 89.7%. Across the whole pool, abnormal #15 and nominal change #4.
Price is down while OI is up—this combo isn’t just simple long liquidation or stop-loss. It looks more like newly added leveraged shorts entering. Active trade imbalance is -30%, and the buy/sell ratio is 0.54. The direction of selling pressure is very clear.
Multiple consecutive cycles show abnormal OI continuing, and the depth is also sufficient—trading volume is higher than usual, it hits the boundary of the range, and the direction is somewhat skewed. I’ll keep an eye on this structure going forward. If OI keeps building but price doesn’t accelerate downward, then be careful about a reverse squeeze after shorts get crowded.
24h turnover is 419M. There’s plenty of money in the pool—don’t rush to chase.
27

·
--
$B2 This move is kind of interesting.
In the 15m timeframe, it directly surged 3.63%. Trading volume hit 5x the average, with a Z-score of 4.36—this isn’t just a random needle jab.
The closing price has just broken above the top of the recent 20 5m candles, which counts as a decent range breakout.
More importantly, OI is rising in sync—15m +0.95%, 1h +1.01%. The nominal increase sums to nearly 750k USDT. Price is up and open interest is up too. This is a classic incremental-leverage long entry, not that kind of “short covering” hype.
Active trade imbalance is +2.0%, with a buy/sell ratio of 1.04. Buys are slightly dominant but not extreme, suggesting we’re not at the FOMO stage yet.
The abnormal percentile is 86.7%, ranking #15 in the whole pool. Nominal change ranks #29, and the 24h trading value is 52.62M. The data isn’t wildly explosive, but the structure is clean: volume and price align, OI confirms, and the range boundaries are clear.
Next, there are two things to watch: first, whether it can hold above this breakout level; second, if OI keeps stacking, be careful of the flip-side “insert needle” after long crowding.
For now, we’ll observe.
$B2 This move is kind of interesting.
In the 15m timeframe, it directly surged 3.63%. Trading volume hit 5x the average, with a Z-score of 4.36—this isn’t just a random needle jab.
The closing price has just broken above the top of the recent 20 5m candles, which counts as a decent range breakout.
More importantly, OI is rising in sync—15m +0.95%, 1h +1.01%. The nominal increase sums to nearly 750k USDT. Price is up and open interest is up too. This is a classic incremental-leverage long entry, not that kind of “short covering” hype.
Active trade imbalance is +2.0%, with a buy/sell ratio of 1.04. Buys are slightly dominant but not extreme, suggesting we’re not at the FOMO stage yet.
The abnormal percentile is 86.7%, ranking #15 in the whole pool. Nominal change ranks #29, and the 24h trading value is 52.62M. The data isn’t wildly explosive, but the structure is clean: volume and price align, OI confirms, and the range boundaries are clear.
Next, there are two things to watch: first, whether it can hold above this breakout level; second, if OI keeps stacking, be careful of the flip-side “insert needle” after long crowding.
For now, we’ll observe.
In the 15m timeframe, it directly surged 3.63%. Trading volume hit 5x the average, with a Z-score of 4.36—this isn’t just a random needle jab.
The closing price has just broken above the top of the recent 20 5m candles, which counts as a decent range breakout.
More importantly, OI is rising in sync—15m +0.95%, 1h +1.01%. The nominal increase sums to nearly 750k USDT. Price is up and open interest is up too. This is a classic incremental-leverage long entry, not that kind of “short covering” hype.
Active trade imbalance is +2.0%, with a buy/sell ratio of 1.04. Buys are slightly dominant but not extreme, suggesting we’re not at the FOMO stage yet.
The abnormal percentile is 86.7%, ranking #15 in the whole pool. Nominal change ranks #29, and the 24h trading value is 52.62M. The data isn’t wildly explosive, but the structure is clean: volume and price align, OI confirms, and the range boundaries are clear.
Next, there are two things to watch: first, whether it can hold above this breakout level; second, if OI keeps stacking, be careful of the flip-side “insert needle” after long crowding.
For now, we’ll observe.
1
·
--
$XTZ This move has some real substance.
In 15m, it pulled directly up 2.60%, volume reached 4.67x, Z value 4.47—this isn’t just some random shake.
OI: 15m +2.22%, 1h +1.49%. Price is rising and open interest is rising along with it. That’s a classic case of new leveraged long positions entering, not short covering to drive a fake pump.
The closing price has already broken above the upper edge of the last ~20 consecutive 5m range candles. Active traded volume is 19.6% higher than the passive side; buy/sell ratio is 1.49—buyers are genuinely chasing.
OI abnormal percentile is 94%. It ranks #15 across the whole pool at this level. Here, it’s either going to accelerate further, or it’s setting up to carry the people who were positioned in front.
In the past 24h, turnover is 64M, and the depth confirms it too—this isn’t some small pool self-hype.
My take: with this kind of structure, I lean toward going with the momentum, but I won’t chase during the rally. I’ll wait for a pullback and confirmation before deciding. $XTZ is basically an old monster coin—once it moves, it doesn’t follow logic. Manage position sizing well.
$XTZ This move has some real substance.
In 15m, it pulled directly up 2.60%, volume reached 4.67x, Z value 4.47—this isn’t just some random shake.
OI: 15m +2.22%, 1h +1.49%. Price is rising and open interest is rising along with it. That’s a classic case of new leveraged long positions entering, not short covering to drive a fake pump.
The closing price has already broken above the upper edge of the last ~20 consecutive 5m range candles. Active traded volume is 19.6% higher than the passive side; buy/sell ratio is 1.49—buyers are genuinely chasing.
OI abnormal percentile is 94%. It ranks #15 across the whole pool at this level. Here, it’s either going to accelerate further, or it’s setting up to carry the people who were positioned in front.
In the past 24h, turnover is 64M, and the depth confirms it too—this isn’t some small pool self-hype.
My take: with this kind of structure, I lean toward going with the momentum, but I won’t chase during the rally. I’ll wait for a pullback and confirmation before deciding. $XTZ is basically an old monster coin—once it moves, it doesn’t follow logic. Manage position sizing well.
In 15m, it pulled directly up 2.60%, volume reached 4.67x, Z value 4.47—this isn’t just some random shake.
OI: 15m +2.22%, 1h +1.49%. Price is rising and open interest is rising along with it. That’s a classic case of new leveraged long positions entering, not short covering to drive a fake pump.
The closing price has already broken above the upper edge of the last ~20 consecutive 5m range candles. Active traded volume is 19.6% higher than the passive side; buy/sell ratio is 1.49—buyers are genuinely chasing.
OI abnormal percentile is 94%. It ranks #15 across the whole pool at this level. Here, it’s either going to accelerate further, or it’s setting up to carry the people who were positioned in front.
In the past 24h, turnover is 64M, and the depth confirms it too—this isn’t some small pool self-hype.
My take: with this kind of structure, I lean toward going with the momentum, but I won’t chase during the rally. I’ll wait for a pullback and confirmation before deciding. $XTZ is basically an old monster coin—once it moves, it doesn’t follow logic. Manage position sizing well.
·
--
$G This drop isn’t that brutal—on the 15m chart it’s only -1%, but the OI falling is kind of interesting: longs are pulling out. On 15m it’s -2.52%, and on 1h it’s -3.38%. The notional value keeps tugging back and forth. The 86.5% abnormal percentile plus the full pool #15 indicates it’s not just a small move. Volume is 1.56x the usual level; active volume spread is -2.8%. The buy/sell ratio is 0.94—sell pressure is there, but it hasn’t reached the point of panic. It looks more like stop-losses and position reduction, not new shorts entering. Watch first—don’t rush to catch it.
$G This drop isn’t that brutal—on the 15m chart it’s only -1%, but the OI falling is kind of interesting: longs are pulling out. On 15m it’s -2.52%, and on 1h it’s -3.38%. The notional value keeps tugging back and forth. The 86.5% abnormal percentile plus the full pool #15 indicates it’s not just a small move. Volume is 1.56x the usual level; active volume spread is -2.8%. The buy/sell ratio is 0.94—sell pressure is there, but it hasn’t reached the point of panic. It looks more like stop-losses and position reduction, not new shorts entering. Watch first—don’t rush to catch it.
11

·
--
$SAGA this spot looks a bit ugly.
The 15m chart got smashed straight down by -2.35%, volume expanded to 2.41x, volatility Z hit 3.14, and the close fell below the lower edge of the recent 20 5m candles' range. Aggressive turnover was -43.5%, and the buy/sell ratio was 0.39 — the selling pressure was real, not just fake order-book noise.
But interestingly, OI didn’t rise with it. 15m -0.23%, 1h -0.40%, with notional down a little over 400k U. Price down + OI down — this combo basically means long deleveraging or a stop-loss cascade, not fresh short selling. In other words, this move looks more like shaking out weak hands in one go, rather than a trend reversal to the downside.
Funding rates are still at a relatively high recent percentile, which shows longs were indeed pretty crowded before. The abnormal percentile is 88.7%, ranked #15 in the whole pool, and deep confirmation has also passed — moves of this magnitude usually don’t just end quietly like this.
I’m not stepping in for now. After breaking below the range’s lower bound, we need to see whether it can quickly reclaim it; if not, then it’s a different story.
$SAGA this spot looks a bit ugly.
The 15m chart got smashed straight down by -2.35%, volume expanded to 2.41x, volatility Z hit 3.14, and the close fell below the lower edge of the recent 20 5m candles' range. Aggressive turnover was -43.5%, and the buy/sell ratio was 0.39 — the selling pressure was real, not just fake order-book noise.
But interestingly, OI didn’t rise with it. 15m -0.23%, 1h -0.40%, with notional down a little over 400k U. Price down + OI down — this combo basically means long deleveraging or a stop-loss cascade, not fresh short selling. In other words, this move looks more like shaking out weak hands in one go, rather than a trend reversal to the downside.
Funding rates are still at a relatively high recent percentile, which shows longs were indeed pretty crowded before. The abnormal percentile is 88.7%, ranked #15 in the whole pool, and deep confirmation has also passed — moves of this magnitude usually don’t just end quietly like this.
I’m not stepping in for now. After breaking below the range’s lower bound, we need to see whether it can quickly reclaim it; if not, then it’s a different story.
The 15m chart got smashed straight down by -2.35%, volume expanded to 2.41x, volatility Z hit 3.14, and the close fell below the lower edge of the recent 20 5m candles' range. Aggressive turnover was -43.5%, and the buy/sell ratio was 0.39 — the selling pressure was real, not just fake order-book noise.
But interestingly, OI didn’t rise with it. 15m -0.23%, 1h -0.40%, with notional down a little over 400k U. Price down + OI down — this combo basically means long deleveraging or a stop-loss cascade, not fresh short selling. In other words, this move looks more like shaking out weak hands in one go, rather than a trend reversal to the downside.
Funding rates are still at a relatively high recent percentile, which shows longs were indeed pretty crowded before. The abnormal percentile is 88.7%, ranked #15 in the whole pool, and deep confirmation has also passed — moves of this magnitude usually don’t just end quietly like this.
I’m not stepping in for now. After breaking below the range’s lower bound, we need to see whether it can quickly reclaim it; if not, then it’s a different story.
8

Article
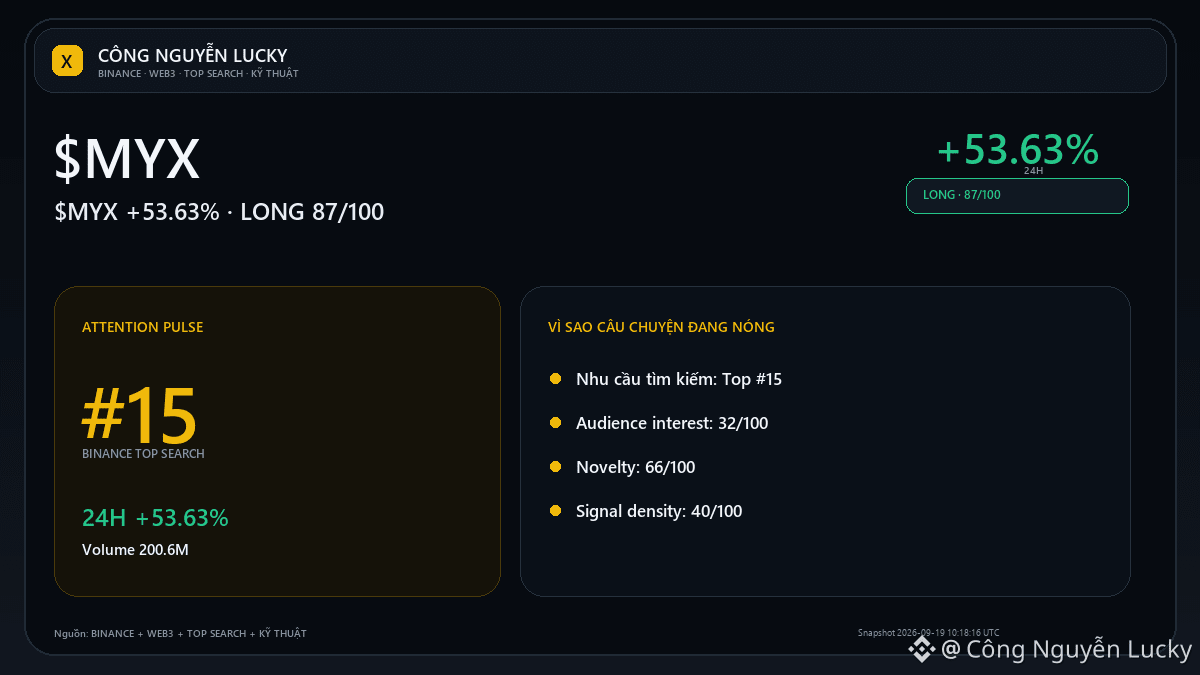
$MYX: is the price action bullish engulfing reliable?🔥 $MYX rising +53.63% — but the percentage increase/decrease isn’t enough to call this a good setup. Market: 0.09424 · 24h +53.63% · volume ~200.6M USDT · 3,438,125 trades.
Technical bias LONG 100/100 · support 0.08401 · resistance 0.09680147. The candle pattern only has value when it appears at the right structural position, and is confirmed by the next candle/volume; if not, ignore it. The technical levels being selected follow the current regime:
$MYX: is the price action bullish engulfing reliable?
🔥 $MYX rising +53.63% — but the percentage increase/decrease isn’t enough to call this a good setup. Market: 0.09424 · 24h +53.63% · volume ~200.6M USDT · 3,438,125 trades.
Technical bias LONG 100/100 · support 0.08401 · resistance 0.09680147. The candle pattern only has value when it appears at the right structural position, and is confirmed by the next candle/volume; if not, ignore it. The technical levels being selected follow the current regime:
Technical bias LONG 100/100 · support 0.08401 · resistance 0.09680147. The candle pattern only has value when it appears at the right structural position, and is confirmed by the next candle/volume; if not, ignore it. The technical levels being selected follow the current regime:
85

·
--
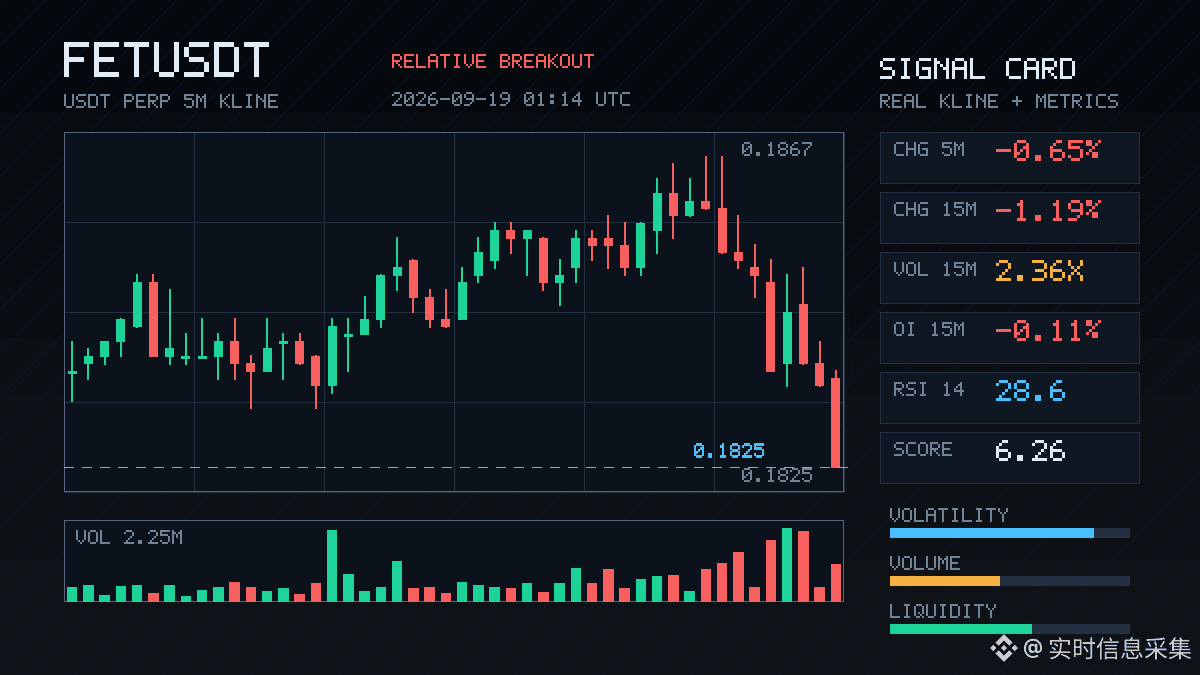
$FET This 15m timeframe is a bit interesting.
The price fell by 1.19%, yet the volume surged straight to 2.36x. The volatility indicator (Z) hit 3.39—this isn’t a normal dip; it looks like someone was concentrating distribution, or passive stop-losses were swept.
The close broke below the lower edge of the recent 20 five-minute range. Active trading value dropped by -13.2%, the buy-sell ratio is 0.77, and the sell pressure is absolutely real.
But the key is the OI (open interest): 15m -0.11%, 1h -0.80%. Notional decreased by 680k U. Price down while OI down—that’s typical deleveraging by longs, not new shorts entering to smash the market.
In plain terms, existing leveraged positions are being cleared, not someone actively building a new short.
The OI abnormal percentile is 93.5%, in the full pool #15, with notional change #28. This position alone already suggests FET’s position structure has reached a fairly extreme level.
When things are like this, be especially careful about two possible paths: either deleveraging ends and price quickly snaps back, or this is just the appetizer for a larger, higher-timeframe selloff.
In the past 24h, turnover is 59M. The pool isn’t big, and with limited liquidity depth, a volume amplification like this is definitely worth watching closely. I’ll hold off for now—I'll wait until the OI stabilizes before looking again.
$FET This 15m timeframe is a bit interesting.
The price fell by 1.19%, yet the volume surged straight to 2.36x. The volatility indicator (Z) hit 3.39—this isn’t a normal dip; it looks like someone was concentrating distribution, or passive stop-losses were swept.
The close broke below the lower edge of the recent 20 five-minute range. Active trading value dropped by -13.2%, the buy-sell ratio is 0.77, and the sell pressure is absolutely real.
But the key is the OI (open interest): 15m -0.11%, 1h -0.80%. Notional decreased by 680k U. Price down while OI down—that’s typical deleveraging by longs, not new shorts entering to smash the market.
In plain terms, existing leveraged positions are being cleared, not someone actively building a new short.
The OI abnormal percentile is 93.5%, in the full pool #15, with notional change #28. This position alone already suggests FET’s position structure has reached a fairly extreme level.
When things are like this, be especially careful about two possible paths: either deleveraging ends and price quickly snaps back, or this is just the appetizer for a larger, higher-timeframe selloff.
In the past 24h, turnover is 59M. The pool isn’t big, and with limited liquidity depth, a volume amplification like this is definitely worth watching closely. I’ll hold off for now—I'll wait until the OI stabilizes before looking again.
The price fell by 1.19%, yet the volume surged straight to 2.36x. The volatility indicator (Z) hit 3.39—this isn’t a normal dip; it looks like someone was concentrating distribution, or passive stop-losses were swept.
The close broke below the lower edge of the recent 20 five-minute range. Active trading value dropped by -13.2%, the buy-sell ratio is 0.77, and the sell pressure is absolutely real.
But the key is the OI (open interest): 15m -0.11%, 1h -0.80%. Notional decreased by 680k U. Price down while OI down—that’s typical deleveraging by longs, not new shorts entering to smash the market.
In plain terms, existing leveraged positions are being cleared, not someone actively building a new short.
The OI abnormal percentile is 93.5%, in the full pool #15, with notional change #28. This position alone already suggests FET’s position structure has reached a fairly extreme level.
When things are like this, be especially careful about two possible paths: either deleveraging ends and price quickly snaps back, or this is just the appetizer for a larger, higher-timeframe selloff.
In the past 24h, turnover is 59M. The pool isn’t big, and with limited liquidity depth, a volume amplification like this is definitely worth watching closely. I’ll hold off for now—I'll wait until the OI stabilizes before looking again.
80
·
--
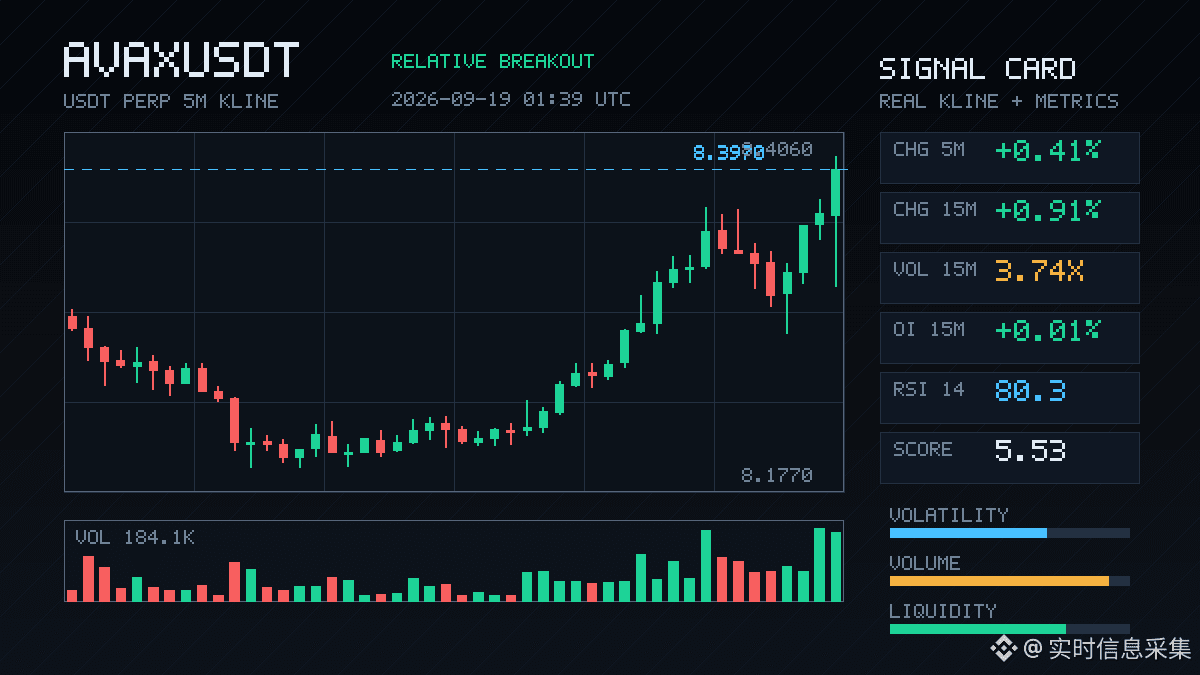
There’s something here on AVAX.
In 15m, it surged straight up by 0.91%. Volume exploded to 3.74x, with a Z value of 2.61. This isn’t just random wobbling—there are genuinely people entering the market. The closing price broke above the upper band of the last ~20 consecutive 5m K-lines. Active transaction volume difference is +4.9%, and the buy/sell ratio is 1.10, indicating that bids are actively eating upward.
More importantly, it’s OI. As price rises, OI also lifts in sync. Both 15m and 1h show net increases. The combined nominal change is close to 2M USDT. The OI abnormal percentile is 93.3%; in the whole pool, the abnormality ranks at #9, and the nominal change ranks at #15. This structure is more consistent with newly added leveraged long participation, not just shorts covering.
The funding rate is also at a recent high percentile. It has continued across multiple consecutive cycles, indicating this move isn’t an isolated spike—someone is steadily adding.
The 24h trading value is 156M, and the order book depth confirms it is in place. Price is also approaching its own historical extreme zone. At this kind of location, once it breaks out on increased volume, either it keeps squeezing shorts higher, or it becomes a violent shakeout after leverage gets stacked too high.
Keep an eye on it first—don’t chase. Wait for a pullback and confirmation.
There’s something here on AVAX.
In 15m, it surged straight up by 0.91%. Volume exploded to 3.74x, with a Z value of 2.61. This isn’t just random wobbling—there are genuinely people entering the market. The closing price broke above the upper band of the last ~20 consecutive 5m K-lines. Active transaction volume difference is +4.9%, and the buy/sell ratio is 1.10, indicating that bids are actively eating upward.
More importantly, it’s OI. As price rises, OI also lifts in sync. Both 15m and 1h show net increases. The combined nominal change is close to 2M USDT. The OI abnormal percentile is 93.3%; in the whole pool, the abnormality ranks at #9, and the nominal change ranks at #15. This structure is more consistent with newly added leveraged long participation, not just shorts covering.
The funding rate is also at a recent high percentile. It has continued across multiple consecutive cycles, indicating this move isn’t an isolated spike—someone is steadily adding.
The 24h trading value is 156M, and the order book depth confirms it is in place. Price is also approaching its own historical extreme zone. At this kind of location, once it breaks out on increased volume, either it keeps squeezing shorts higher, or it becomes a violent shakeout after leverage gets stacked too high.
Keep an eye on it first—don’t chase. Wait for a pullback and confirmation.
In 15m, it surged straight up by 0.91%. Volume exploded to 3.74x, with a Z value of 2.61. This isn’t just random wobbling—there are genuinely people entering the market. The closing price broke above the upper band of the last ~20 consecutive 5m K-lines. Active transaction volume difference is +4.9%, and the buy/sell ratio is 1.10, indicating that bids are actively eating upward.
More importantly, it’s OI. As price rises, OI also lifts in sync. Both 15m and 1h show net increases. The combined nominal change is close to 2M USDT. The OI abnormal percentile is 93.3%; in the whole pool, the abnormality ranks at #9, and the nominal change ranks at #15. This structure is more consistent with newly added leveraged long participation, not just shorts covering.
The funding rate is also at a recent high percentile. It has continued across multiple consecutive cycles, indicating this move isn’t an isolated spike—someone is steadily adding.
The 24h trading value is 156M, and the order book depth confirms it is in place. Price is also approaching its own historical extreme zone. At this kind of location, once it breaks out on increased volume, either it keeps squeezing shorts higher, or it becomes a violent shakeout after leverage gets stacked too high.
Keep an eye on it first—don’t chase. Wait for a pullback and confirmation.
30
·
--
GENIUS This move is a bit brutal.
In the 15m timeframe it directly dropped 3.55%, with volume surging to 4.63x and a Z value of 2.94. This isn’t ordinary volatility—someone is really running it. The close broke below the lower band of the last 20 5m candles: the aggressive trading difference is -33.6%, and the buy-sell ratio is 0.50—sell orders are completely pressing down on buys.
But the interesting part is that OI is also dropping. 15m: -2.21%, 1h: -1.40%. Nominal changes are all above -5%. Price is falling while OI is declining; this doesn’t look like new shorts entering. It’s more like long positions de-leveraging, stop-loss cascades, or position reduction.
The anomaly percentile is 96.8%, the whole pool is #12, and the nominal change is #15. The funding rate is still at a high percentile recently—after the longs were squeezed and crowded, now it’s just more pain.
24h trading value is 156M; the volume is there, and depth confirmation has passed too. With this kind of structure, I don’t really want to catch a falling knife. I’ll wait until OI stabilizes and the aggressive trading difference narrows.
Just watch for now.
GENIUS This move is a bit brutal.
In the 15m timeframe it directly dropped 3.55%, with volume surging to 4.63x and a Z value of 2.94. This isn’t ordinary volatility—someone is really running it. The close broke below the lower band of the last 20 5m candles: the aggressive trading difference is -33.6%, and the buy-sell ratio is 0.50—sell orders are completely pressing down on buys.
But the interesting part is that OI is also dropping. 15m: -2.21%, 1h: -1.40%. Nominal changes are all above -5%. Price is falling while OI is declining; this doesn’t look like new shorts entering. It’s more like long positions de-leveraging, stop-loss cascades, or position reduction.
The anomaly percentile is 96.8%, the whole pool is #12, and the nominal change is #15. The funding rate is still at a high percentile recently—after the longs were squeezed and crowded, now it’s just more pain.
24h trading value is 156M; the volume is there, and depth confirmation has passed too. With this kind of structure, I don’t really want to catch a falling knife. I’ll wait until OI stabilizes and the aggressive trading difference narrows.
Just watch for now.
In the 15m timeframe it directly dropped 3.55%, with volume surging to 4.63x and a Z value of 2.94. This isn’t ordinary volatility—someone is really running it. The close broke below the lower band of the last 20 5m candles: the aggressive trading difference is -33.6%, and the buy-sell ratio is 0.50—sell orders are completely pressing down on buys.
But the interesting part is that OI is also dropping. 15m: -2.21%, 1h: -1.40%. Nominal changes are all above -5%. Price is falling while OI is declining; this doesn’t look like new shorts entering. It’s more like long positions de-leveraging, stop-loss cascades, or position reduction.
The anomaly percentile is 96.8%, the whole pool is #12, and the nominal change is #15. The funding rate is still at a high percentile recently—after the longs were squeezed and crowded, now it’s just more pain.
24h trading value is 156M; the volume is there, and depth confirmation has passed too. With this kind of structure, I don’t really want to catch a falling knife. I’ll wait until OI stabilizes and the aggressive trading difference narrows.
Just watch for now.
5
·
--
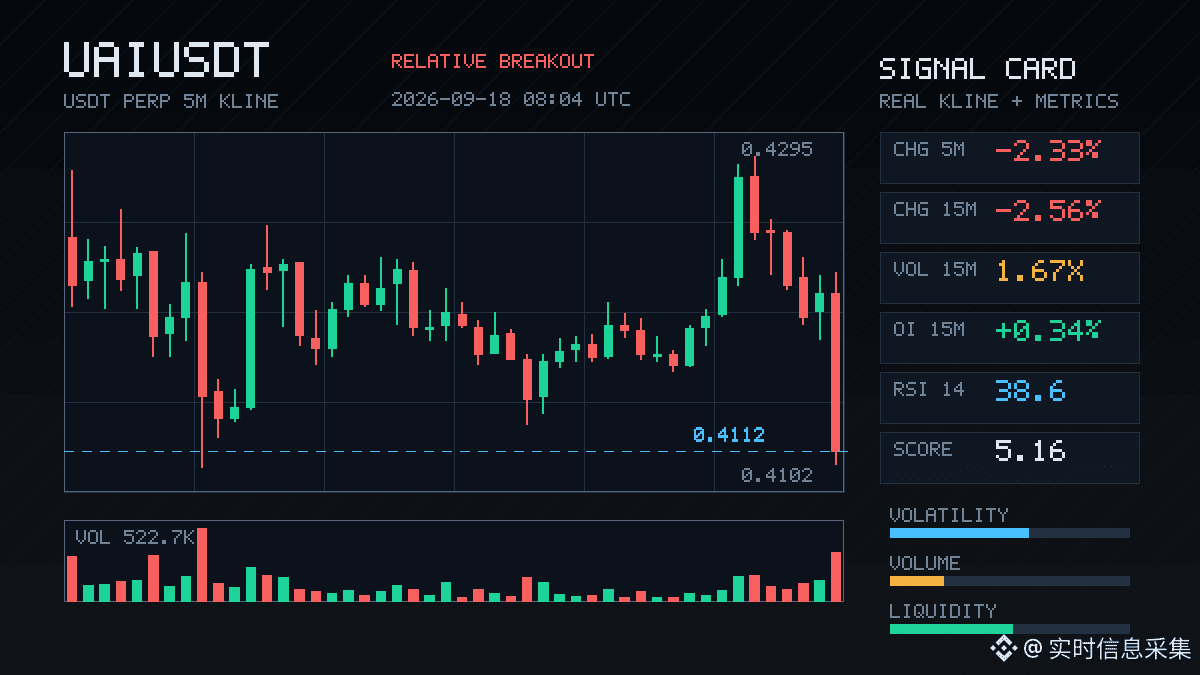
$UAI This 15m drop is down 2.56%; volume is 1.67x, and OI is still rising—price is falling while positions are increasing. This is a typical leveraged short entry rhythm; it’s not just simple long profit-taking.
Active trade imbalance is -47.1%, the buy/sell ratio is 0.36. Sell pressure is nearly three times the buy orders. The closing price was directly driven through the lows of roughly the last 20 5m candles.
OI percentile is 89.1%, with an abnormal ranking in the entire pool at #15. Chasing shorts from here needs to be careful—the sentiment is already quite skewed. First, see whether it can reclaim the level; if it can’t, the lower boundary may turn into an upper boundary.
$UAI This 15m drop is down 2.56%; volume is 1.67x, and OI is still rising—price is falling while positions are increasing. This is a typical leveraged short entry rhythm; it’s not just simple long profit-taking.
Active trade imbalance is -47.1%, the buy/sell ratio is 0.36. Sell pressure is nearly three times the buy orders. The closing price was directly driven through the lows of roughly the last 20 5m candles.
OI percentile is 89.1%, with an abnormal ranking in the entire pool at #15. Chasing shorts from here needs to be careful—the sentiment is already quite skewed. First, see whether it can reclaim the level; if it can’t, the lower boundary may turn into an upper boundary.
Active trade imbalance is -47.1%, the buy/sell ratio is 0.36. Sell pressure is nearly three times the buy orders. The closing price was directly driven through the lows of roughly the last 20 5m candles.
OI percentile is 89.1%, with an abnormal ranking in the entire pool at #15. Chasing shorts from here needs to be careful—the sentiment is already quite skewed. First, see whether it can reclaim the level; if it can’t, the lower boundary may turn into an upper boundary.
3
·
--
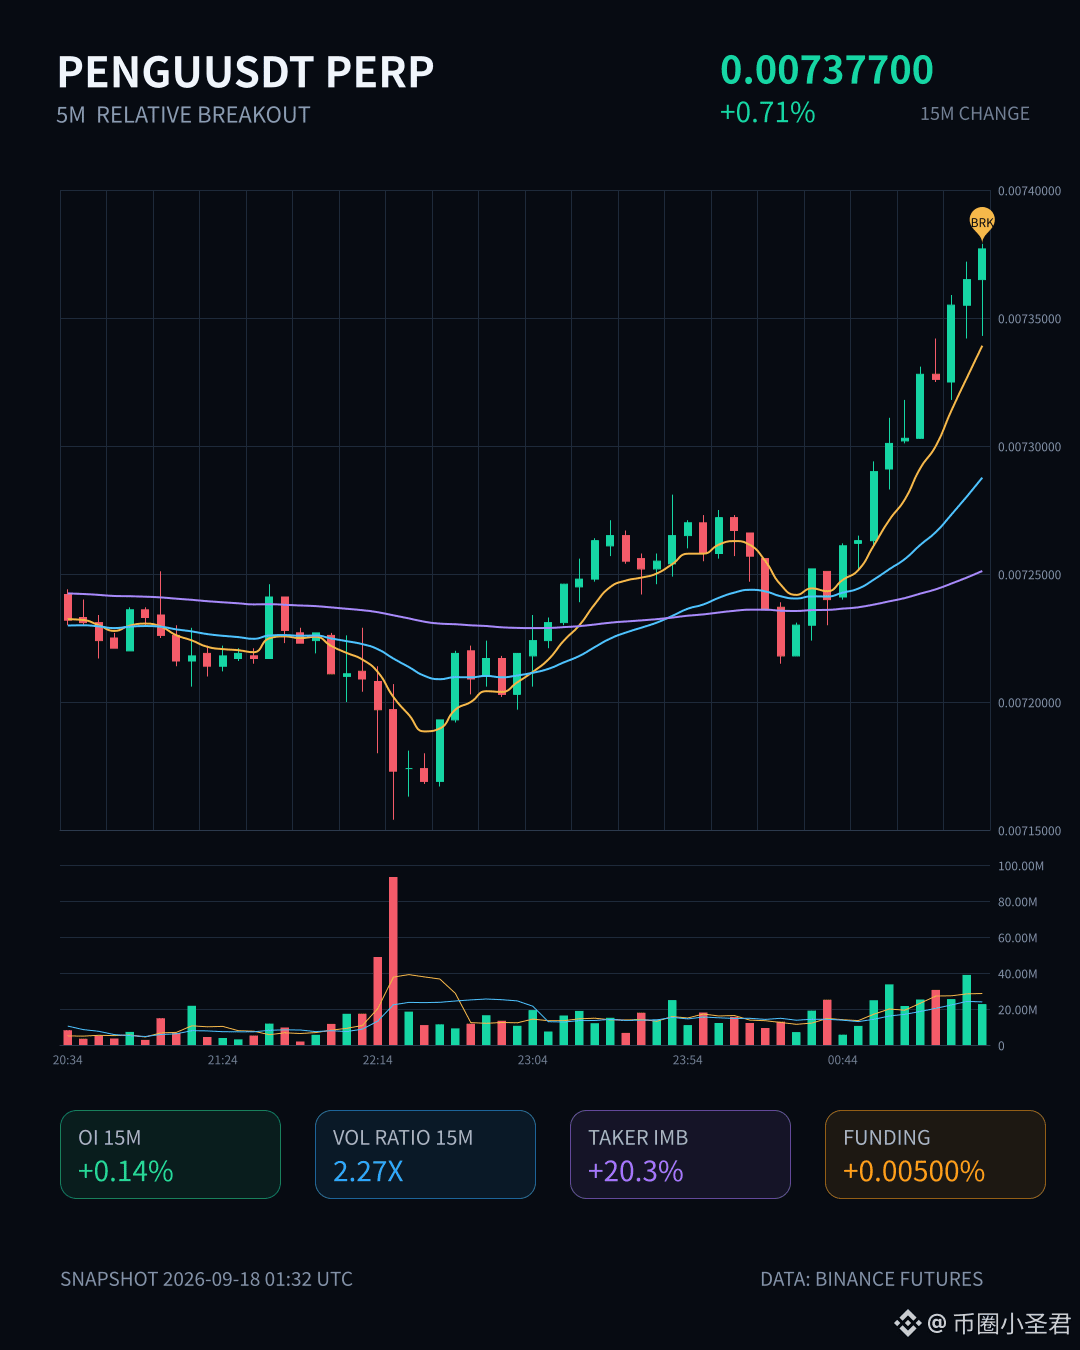
$PENGU This move is a bit interesting.
In the 15m timeframe, volume surged and it pulled up to 2.27x. At the close, it directly broke through the upper bound of the past nearly 20 5m bars. OI is up +1.02% over the past hour; about 1 million U in notional has been added—not like a short-covering fake-out. Price is rising, positions are rising, and the ratio of aggressive buying/selling is 1.51, which looks more like new longs are stepping in and taking the baton.
The percentile rank is 86.9%. In the entire pool it ranks #15, and the funding rate has also bumped up to a high percentile recently. This has continued across several consecutive cycles, suggesting it’s not just a one-off needle-like move.
In the last 24h, turnover is 43.88M, so depth is sufficient. The only thing to watch is that the funding rate is already not cheap; after leverage is pushed in, the pullback magnitude may not be small either.
First, let’s see if it can hold and stay above the top of this range.
$PENGU This move is a bit interesting.
In the 15m timeframe, volume surged and it pulled up to 2.27x. At the close, it directly broke through the upper bound of the past nearly 20 5m bars. OI is up +1.02% over the past hour; about 1 million U in notional has been added—not like a short-covering fake-out. Price is rising, positions are rising, and the ratio of aggressive buying/selling is 1.51, which looks more like new longs are stepping in and taking the baton.
The percentile rank is 86.9%. In the entire pool it ranks #15, and the funding rate has also bumped up to a high percentile recently. This has continued across several consecutive cycles, suggesting it’s not just a one-off needle-like move.
In the last 24h, turnover is 43.88M, so depth is sufficient. The only thing to watch is that the funding rate is already not cheap; after leverage is pushed in, the pullback magnitude may not be small either.
First, let’s see if it can hold and stay above the top of this range.
In the 15m timeframe, volume surged and it pulled up to 2.27x. At the close, it directly broke through the upper bound of the past nearly 20 5m bars. OI is up +1.02% over the past hour; about 1 million U in notional has been added—not like a short-covering fake-out. Price is rising, positions are rising, and the ratio of aggressive buying/selling is 1.51, which looks more like new longs are stepping in and taking the baton.
The percentile rank is 86.9%. In the entire pool it ranks #15, and the funding rate has also bumped up to a high percentile recently. This has continued across several consecutive cycles, suggesting it’s not just a one-off needle-like move.
In the last 24h, turnover is 43.88M, so depth is sufficient. The only thing to watch is that the funding rate is already not cheap; after leverage is pushed in, the pullback magnitude may not be small either.
First, let’s see if it can hold and stay above the top of this range.
84
·
--
SOL—this pump has some substance.
On the 15m timeframe: it’s up 0.53%. Volume directly spiked to 2.19x, and OI is rising in sync—15m OI +0.36%, with notional at 7.8M. On the 1h basis, the notional change is also close to 8.6M. Volume, price, and positions are moving together—classic leveraged longs entering, not that kind of fake pull-up from short covering.
A few details:
· OI percentile is unusually high at 95.6%, rank #15 in the whole pool; notional change is #1 across the whole pool
· Buy/sell ratio is 1.26; aggressive trades are 11.5% apart—buyers are clearly pushing
· Binance 5m liquidations: 361K, concentrated in the buy side direction
· Funding rate is at a recent high percentile
In the last 24h, turnover is 1685M, and depth looks fine. But OI has been in an abnormal range for several consecutive cycles. Combined with price already touching the upper edge of the recent range, the squeeze feeling is getting heavier.
If it can’t break through in one decisive move, the reversal will likely trigger a long liquidation cascade. Don’t let the 0.53% fool you—the structure is already in an extreme position.
SOL—this pump has some substance.
On the 15m timeframe: it’s up 0.53%. Volume directly spiked to 2.19x, and OI is rising in sync—15m OI +0.36%, with notional at 7.8M. On the 1h basis, the notional change is also close to 8.6M. Volume, price, and positions are moving together—classic leveraged longs entering, not that kind of fake pull-up from short covering.
A few details:
· OI percentile is unusually high at 95.6%, rank #15 in the whole pool; notional change is #1 across the whole pool
· Buy/sell ratio is 1.26; aggressive trades are 11.5% apart—buyers are clearly pushing
· Binance 5m liquidations: 361K, concentrated in the buy side direction
· Funding rate is at a recent high percentile
In the last 24h, turnover is 1685M, and depth looks fine. But OI has been in an abnormal range for several consecutive cycles. Combined with price already touching the upper edge of the recent range, the squeeze feeling is getting heavier.
If it can’t break through in one decisive move, the reversal will likely trigger a long liquidation cascade. Don’t let the 0.53% fool you—the structure is already in an extreme position.
On the 15m timeframe: it’s up 0.53%. Volume directly spiked to 2.19x, and OI is rising in sync—15m OI +0.36%, with notional at 7.8M. On the 1h basis, the notional change is also close to 8.6M. Volume, price, and positions are moving together—classic leveraged longs entering, not that kind of fake pull-up from short covering.
A few details:
· OI percentile is unusually high at 95.6%, rank #15 in the whole pool; notional change is #1 across the whole pool
· Buy/sell ratio is 1.26; aggressive trades are 11.5% apart—buyers are clearly pushing
· Binance 5m liquidations: 361K, concentrated in the buy side direction
· Funding rate is at a recent high percentile
In the last 24h, turnover is 1685M, and depth looks fine. But OI has been in an abnormal range for several consecutive cycles. Combined with price already touching the upper edge of the recent range, the squeeze feeling is getting heavier.
If it can’t break through in one decisive move, the reversal will likely trigger a long liquidation cascade. Don’t let the 0.53% fool you—the structure is already in an extreme position.
2
·
--
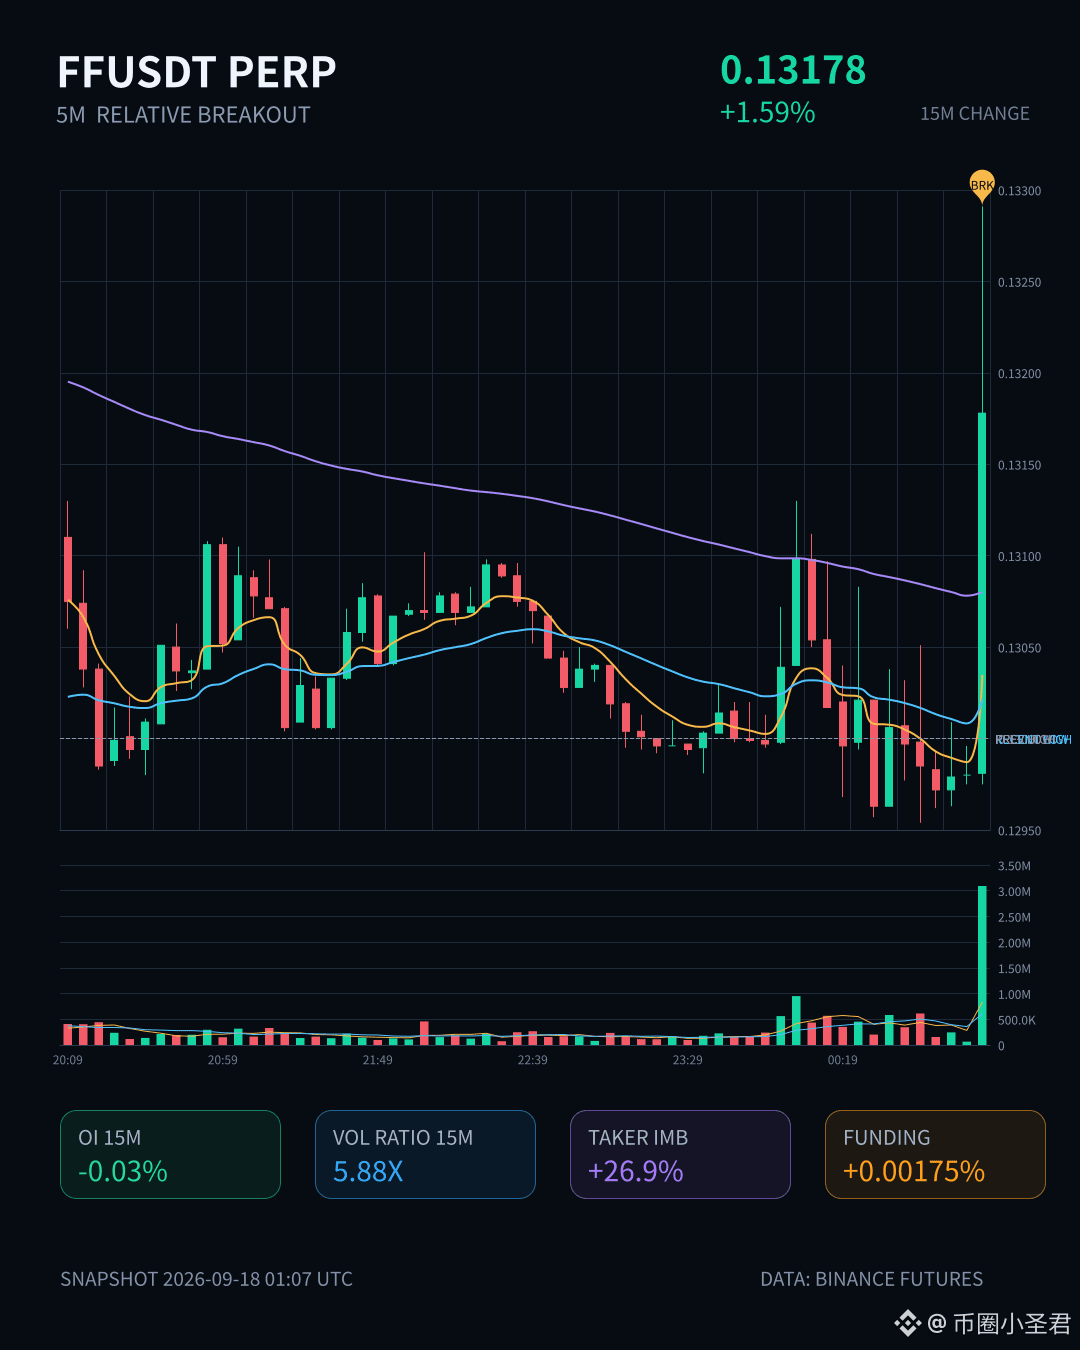
$FF This move is kind of interesting.
In 15m, it jumped up 1.59% directly; the volume hit 5.88x, with a Z value of 4.54—this is no longer ordinary fluctuation. Price broke above the upper edge of the last ~20 5m candles. The buy/sell aggressor ratio is 1.73, and the aggressive trade value is +26.9%. This suggests someone is really pushing prices higher, not a mirage propped up by resting orders.
But pay attention to one detail: OI is declining. In 15m it’s -0.03%, and in 1h it’s -0.02%. Although the notional is up, open interest is shrinking. This structure looks more like short covering or position unwinding, not brand-new long money piling in. In other words, the fuel for this rally may come from shorts that are trapped, rather than additional bullish inflows.
Abnormal percentile is 97.6%, full-pool abnormal #3, notional change #15. Being this high in the full-pool ranking means this isn’t just about FF alone—it’s an event that’s abnormal across the whole pool.
In the past 24h, turnover is only 14.65M, so liquidity isn’t particularly thick. With this size, a 5.88x volume can absolutely amplify and drive volatility—it’s not surprising. But on the other hand, once the covering phase ends, whether the relay capital can keep up is the key question.
My view: short-term sentiment has definitely been ignited, but the OI divergence signal shouldn’t be ignored. If OI starts rising in sync from here, then that’s when a real trend is starting; if OI keeps shrinking while price is still being pushed up, that’s the classic late stage of a squeeze—be careful about chasing.
$FF Keep an eye on it first; don’t rush to a conclusion.
$FF This move is kind of interesting.
In 15m, it jumped up 1.59% directly; the volume hit 5.88x, with a Z value of 4.54—this is no longer ordinary fluctuation. Price broke above the upper edge of the last ~20 5m candles. The buy/sell aggressor ratio is 1.73, and the aggressive trade value is +26.9%. This suggests someone is really pushing prices higher, not a mirage propped up by resting orders.
But pay attention to one detail: OI is declining. In 15m it’s -0.03%, and in 1h it’s -0.02%. Although the notional is up, open interest is shrinking. This structure looks more like short covering or position unwinding, not brand-new long money piling in. In other words, the fuel for this rally may come from shorts that are trapped, rather than additional bullish inflows.
Abnormal percentile is 97.6%, full-pool abnormal #3, notional change #15. Being this high in the full-pool ranking means this isn’t just about FF alone—it’s an event that’s abnormal across the whole pool.
In the past 24h, turnover is only 14.65M, so liquidity isn’t particularly thick. With this size, a 5.88x volume can absolutely amplify and drive volatility—it’s not surprising. But on the other hand, once the covering phase ends, whether the relay capital can keep up is the key question.
My view: short-term sentiment has definitely been ignited, but the OI divergence signal shouldn’t be ignored. If OI starts rising in sync from here, then that’s when a real trend is starting; if OI keeps shrinking while price is still being pushed up, that’s the classic late stage of a squeeze—be careful about chasing.
$FF Keep an eye on it first; don’t rush to a conclusion.
In 15m, it jumped up 1.59% directly; the volume hit 5.88x, with a Z value of 4.54—this is no longer ordinary fluctuation. Price broke above the upper edge of the last ~20 5m candles. The buy/sell aggressor ratio is 1.73, and the aggressive trade value is +26.9%. This suggests someone is really pushing prices higher, not a mirage propped up by resting orders.
But pay attention to one detail: OI is declining. In 15m it’s -0.03%, and in 1h it’s -0.02%. Although the notional is up, open interest is shrinking. This structure looks more like short covering or position unwinding, not brand-new long money piling in. In other words, the fuel for this rally may come from shorts that are trapped, rather than additional bullish inflows.
Abnormal percentile is 97.6%, full-pool abnormal #3, notional change #15. Being this high in the full-pool ranking means this isn’t just about FF alone—it’s an event that’s abnormal across the whole pool.
In the past 24h, turnover is only 14.65M, so liquidity isn’t particularly thick. With this size, a 5.88x volume can absolutely amplify and drive volatility—it’s not surprising. But on the other hand, once the covering phase ends, whether the relay capital can keep up is the key question.
My view: short-term sentiment has definitely been ignited, but the OI divergence signal shouldn’t be ignored. If OI starts rising in sync from here, then that’s when a real trend is starting; if OI keeps shrinking while price is still being pushed up, that’s the classic late stage of a squeeze—be careful about chasing.
$FF Keep an eye on it first; don’t rush to a conclusion.
49
·
--
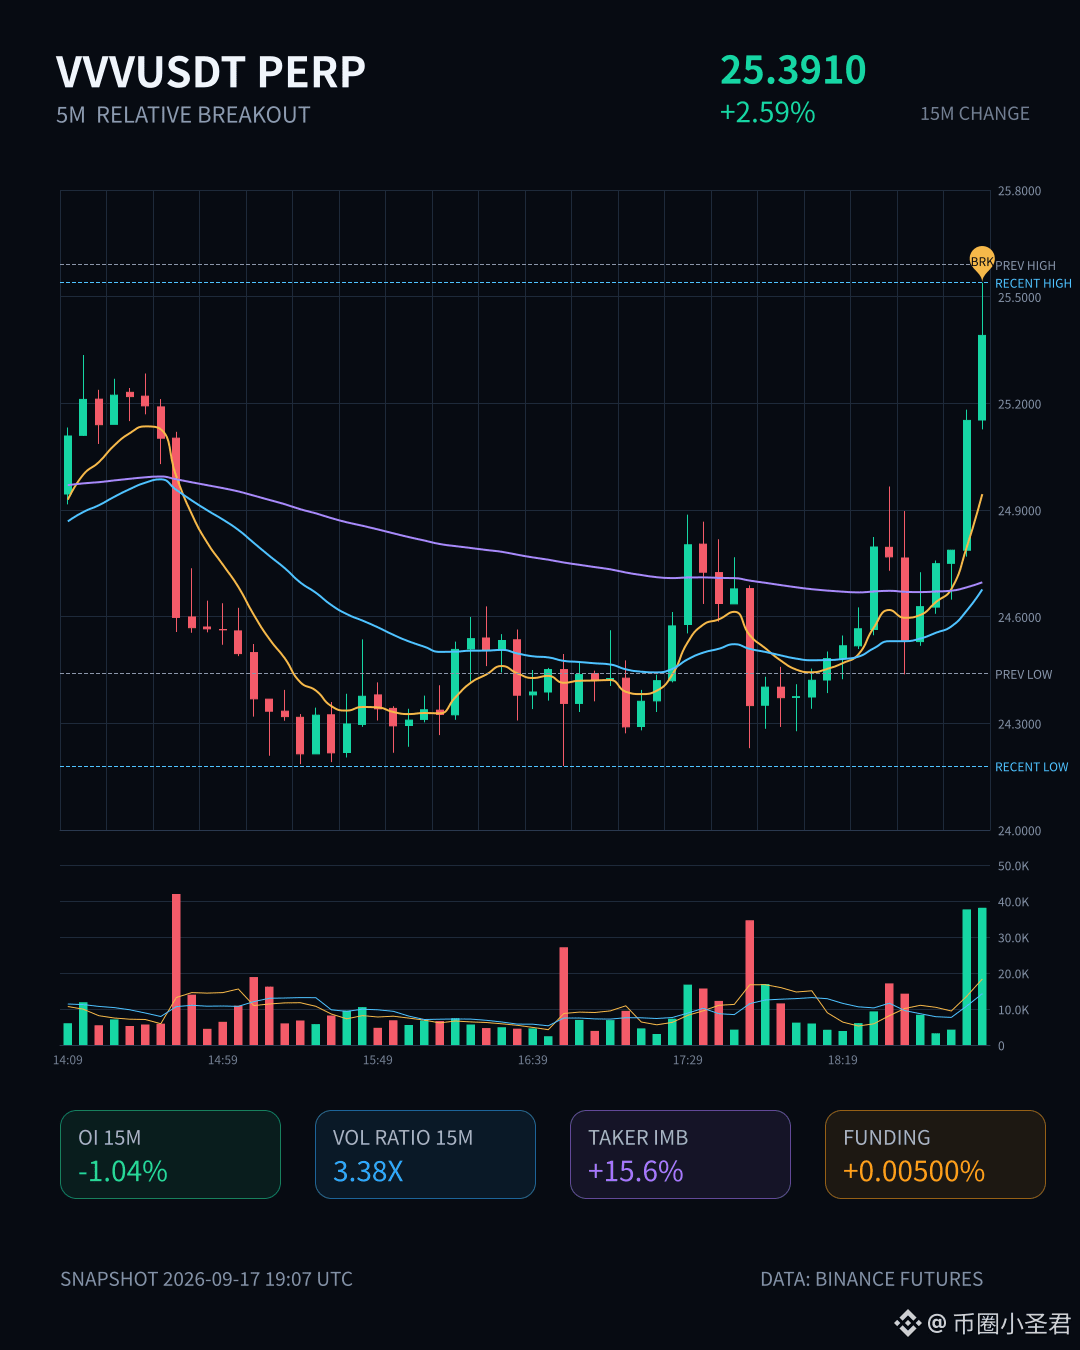
$VVV This move is quite decisive—at 15m it directly gained +2.59%. The volume hit 3.38x, and the closing price broke above the upper edge of the past ~20 5m candles.
But interestingly, OI is falling—15m -1.04%, 1h -1.87%. As price rises, positions are reduced, which is a typical short-covering tape. The buy/sell ratio is 1.37, and the active trade volume is +15.6%—suggesting someone is actively pushing upward.
The pool’s abnormal percentile is 91.1%; abnormal #10 and nominal #15. Multiple consecutive periods are continuing, not the kind of one-needle spike that’s over immediately. 24h turnover is 68M, so liquidity is sufficient.
With this kind of structure, I’m not very comfortable chasing longs. In a short-covering-driven trend, if the buy-side support can’t keep up, it’s easy for the move to die out. But if OI keeps falling and price continues pushing higher, then it means the shorts are getting squeezed and are likely feeling increasingly uncomfortable. In that case, you can watch whether there’s new positioning coming in to take over.
$VVV This move is quite decisive—at 15m it directly gained +2.59%. The volume hit 3.38x, and the closing price broke above the upper edge of the past ~20 5m candles.
But interestingly, OI is falling—15m -1.04%, 1h -1.87%. As price rises, positions are reduced, which is a typical short-covering tape. The buy/sell ratio is 1.37, and the active trade volume is +15.6%—suggesting someone is actively pushing upward.
The pool’s abnormal percentile is 91.1%; abnormal #10 and nominal #15. Multiple consecutive periods are continuing, not the kind of one-needle spike that’s over immediately. 24h turnover is 68M, so liquidity is sufficient.
With this kind of structure, I’m not very comfortable chasing longs. In a short-covering-driven trend, if the buy-side support can’t keep up, it’s easy for the move to die out. But if OI keeps falling and price continues pushing higher, then it means the shorts are getting squeezed and are likely feeling increasingly uncomfortable. In that case, you can watch whether there’s new positioning coming in to take over.
But interestingly, OI is falling—15m -1.04%, 1h -1.87%. As price rises, positions are reduced, which is a typical short-covering tape. The buy/sell ratio is 1.37, and the active trade volume is +15.6%—suggesting someone is actively pushing upward.
The pool’s abnormal percentile is 91.1%; abnormal #10 and nominal #15. Multiple consecutive periods are continuing, not the kind of one-needle spike that’s over immediately. 24h turnover is 68M, so liquidity is sufficient.
With this kind of structure, I’m not very comfortable chasing longs. In a short-covering-driven trend, if the buy-side support can’t keep up, it’s easy for the move to die out. But if OI keeps falling and price continues pushing higher, then it means the shorts are getting squeezed and are likely feeling increasingly uncomfortable. In that case, you can watch whether there’s new positioning coming in to take over.
1
·
--
$Lobster—this wave has something to it. In the 15m timeframe it pulled and nearly gained 3%; the trading volume went straight to 2.78x the usual level. The Z value is 3.33. The closing price broke above the upper band of the past 20 consecutive 5m candles—deep confirmation has been done, so it’s not a fake move. Even more important: OI. The 15m nominal change is +2.39M, and the 1h is also +2.29M. The abnormal percentile is 91.5%. In the whole pool, abnormal rank is #15, and nominal change rank is #4. Price rising together with OI lifting is a classic case of incremental-leverage longs entering—not the kind of price pop from short covering. Active trade volume is down 25.2%; the buy/sell ratio is 1.67, and the bid side’s stance is pretty clear. Over 24h, turnover is 228M—there’s definitely some attention from capital. Whether to chase from here is up to you to weigh, but the structure is genuinely cleaner than most small-cap alts.
$Lobster—this wave has something to it. In the 15m timeframe it pulled and nearly gained 3%; the trading volume went straight to 2.78x the usual level. The Z value is 3.33. The closing price broke above the upper band of the past 20 consecutive 5m candles—deep confirmation has been done, so it’s not a fake move. Even more important: OI. The 15m nominal change is +2.39M, and the 1h is also +2.29M. The abnormal percentile is 91.5%. In the whole pool, abnormal rank is #15, and nominal change rank is #4. Price rising together with OI lifting is a classic case of incremental-leverage longs entering—not the kind of price pop from short covering. Active trade volume is down 25.2%; the buy/sell ratio is 1.67, and the bid side’s stance is pretty clear. Over 24h, turnover is 228M—there’s definitely some attention from capital. Whether to chase from here is up to you to weigh, but the structure is genuinely cleaner than most small-cap alts.
3
·
--
UNI this move is kind of interesting.
In 15m, it’s up 0.89%. It doesn’t look like much, but the trading volume surged to 2.87x, the buy/sell ratio is 1.46, and the aggressive buy side is noticeably stronger. More importantly—OI didn’t rise with it. Both the 15m and 1h are seeing a mild pullback, and the nominal change is still positive. Price is going up while positions are shrinking—a classic short-covering structure. This isn’t new longs pushing the market higher; it’s shorts being squeezed and forced to close.
On Binance contracts for the 5m timeframe, liquidation agent 164K got triggered, with buy-direction concentration—suggesting shorts’ stop-loss orders are being passively filled. In the anomalous rankings for the whole pool, it’s #15; in nominal change it’s #7. Depth confirmation also passed, so the signal quality isn’t bad.
The question now is: can the upward move driven by short covering hold? If OI keeps dropping and price keeps lifting, then it’s just pure squeeze—once everyone’s squeezed out, it’ll dissipate. If later OI starts to climb along with price, then that’s when real fresh demand is stepping in.
At this UNI level, it’s sitting right on the boundary of the recent range. Watch whether this momentum can continue. In a short-covering行情, chasing higher is easy to get hit—waiting for a pullback to see whether there’s stronger support tends to be safer.
UNI this move is kind of interesting.
In 15m, it’s up 0.89%. It doesn’t look like much, but the trading volume surged to 2.87x, the buy/sell ratio is 1.46, and the aggressive buy side is noticeably stronger. More importantly—OI didn’t rise with it. Both the 15m and 1h are seeing a mild pullback, and the nominal change is still positive. Price is going up while positions are shrinking—a classic short-covering structure. This isn’t new longs pushing the market higher; it’s shorts being squeezed and forced to close.
On Binance contracts for the 5m timeframe, liquidation agent 164K got triggered, with buy-direction concentration—suggesting shorts’ stop-loss orders are being passively filled. In the anomalous rankings for the whole pool, it’s #15; in nominal change it’s #7. Depth confirmation also passed, so the signal quality isn’t bad.
The question now is: can the upward move driven by short covering hold? If OI keeps dropping and price keeps lifting, then it’s just pure squeeze—once everyone’s squeezed out, it’ll dissipate. If later OI starts to climb along with price, then that’s when real fresh demand is stepping in.
At this UNI level, it’s sitting right on the boundary of the recent range. Watch whether this momentum can continue. In a short-covering行情, chasing higher is easy to get hit—waiting for a pullback to see whether there’s stronger support tends to be safer.
In 15m, it’s up 0.89%. It doesn’t look like much, but the trading volume surged to 2.87x, the buy/sell ratio is 1.46, and the aggressive buy side is noticeably stronger. More importantly—OI didn’t rise with it. Both the 15m and 1h are seeing a mild pullback, and the nominal change is still positive. Price is going up while positions are shrinking—a classic short-covering structure. This isn’t new longs pushing the market higher; it’s shorts being squeezed and forced to close.
On Binance contracts for the 5m timeframe, liquidation agent 164K got triggered, with buy-direction concentration—suggesting shorts’ stop-loss orders are being passively filled. In the anomalous rankings for the whole pool, it’s #15; in nominal change it’s #7. Depth confirmation also passed, so the signal quality isn’t bad.
The question now is: can the upward move driven by short covering hold? If OI keeps dropping and price keeps lifting, then it’s just pure squeeze—once everyone’s squeezed out, it’ll dissipate. If later OI starts to climb along with price, then that’s when real fresh demand is stepping in.
At this UNI level, it’s sitting right on the boundary of the recent range. Watch whether this momentum can continue. In a short-covering行情, chasing higher is easy to get hit—waiting for a pullback to see whether there’s stronger support tends to be safer.
4
·
--
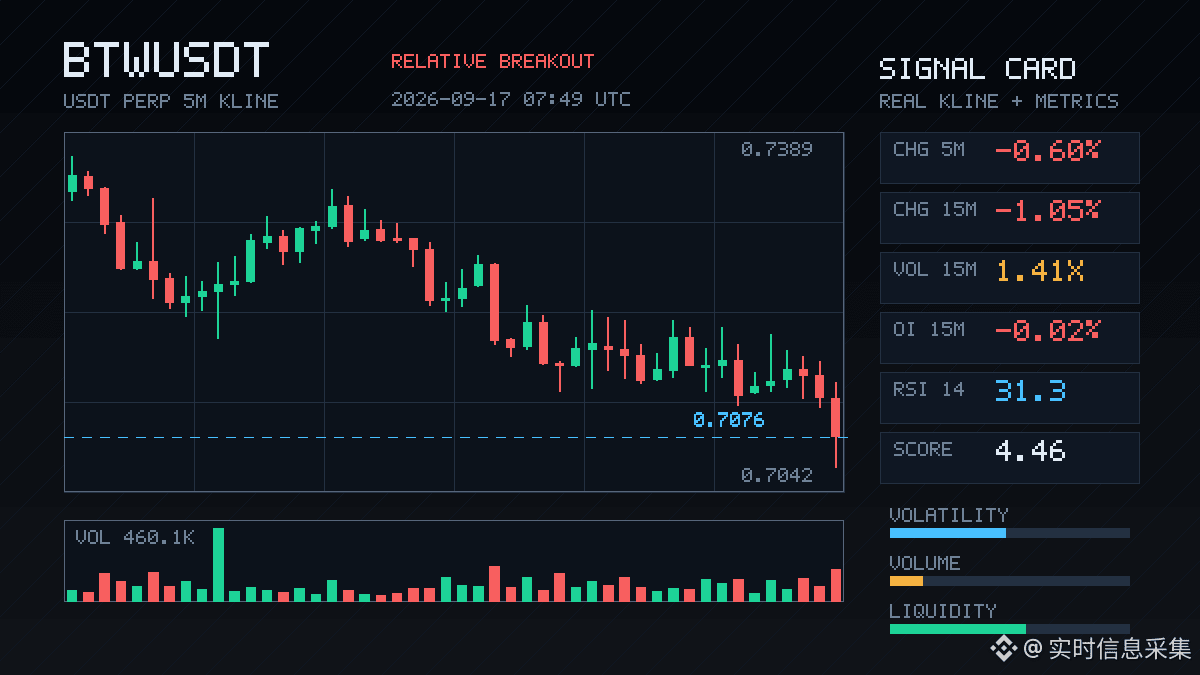
$BTW This spot is a bit interesting.
In the 15m timeframe, it dropped 1.05%. Volume was 1.41x. Price broke below the lower edge of the recent 20 5m-range. Aggressive trades were weaker by -23.3%, and the buy-sell ratio was 0.62—sell pressure is dominant, but it’s not that kind of panic-style dumping.
The key is the OI: 15m -0.02%, 1h -0.07%. Nominal change was -1.17M / -1.06M USDT. Price fell and OI also declined—typical of longs deleveraging or cutting losses. It’s not a case of fresh shorts entering. Also, the OI abnormal percentile is 84.5%. Across the whole pool, abnormal #15 and nominal change #4—this abnormality ranking is actually quite high.
In plain language: this wave is leverage being liquidated/cleared, not someone actively initiating a short. But the direction of aggressive trading is clearly sell-leaning, and the close smashed through the lower boundary of the range. If it can’t quickly reclaim that area, after the leverage flush is done, there may be a second leg.
Let’s wait and see how this 5m candle closes.
$BTW This spot is a bit interesting.
In the 15m timeframe, it dropped 1.05%. Volume was 1.41x. Price broke below the lower edge of the recent 20 5m-range. Aggressive trades were weaker by -23.3%, and the buy-sell ratio was 0.62—sell pressure is dominant, but it’s not that kind of panic-style dumping.
The key is the OI: 15m -0.02%, 1h -0.07%. Nominal change was -1.17M / -1.06M USDT. Price fell and OI also declined—typical of longs deleveraging or cutting losses. It’s not a case of fresh shorts entering. Also, the OI abnormal percentile is 84.5%. Across the whole pool, abnormal #15 and nominal change #4—this abnormality ranking is actually quite high.
In plain language: this wave is leverage being liquidated/cleared, not someone actively initiating a short. But the direction of aggressive trading is clearly sell-leaning, and the close smashed through the lower boundary of the range. If it can’t quickly reclaim that area, after the leverage flush is done, there may be a second leg.
Let’s wait and see how this 5m candle closes.
In the 15m timeframe, it dropped 1.05%. Volume was 1.41x. Price broke below the lower edge of the recent 20 5m-range. Aggressive trades were weaker by -23.3%, and the buy-sell ratio was 0.62—sell pressure is dominant, but it’s not that kind of panic-style dumping.
The key is the OI: 15m -0.02%, 1h -0.07%. Nominal change was -1.17M / -1.06M USDT. Price fell and OI also declined—typical of longs deleveraging or cutting losses. It’s not a case of fresh shorts entering. Also, the OI abnormal percentile is 84.5%. Across the whole pool, abnormal #15 and nominal change #4—this abnormality ranking is actually quite high.
In plain language: this wave is leverage being liquidated/cleared, not someone actively initiating a short. But the direction of aggressive trading is clearly sell-leaning, and the close smashed through the lower boundary of the range. If it can’t quickly reclaim that area, after the leverage flush is done, there may be a second leg.
Let’s wait and see how this 5m candle closes.
13
Log in to explore more content
Join global crypto users on Binance Square
⚡️ Get latest and useful information about crypto.
💬 Trusted by the world’s largest crypto exchange.
👍 Discover real insights from verified creators.
Email / Phone number
Trending Topics
1
#NEARRisesNearly80%InAWeek
4,865 views
380 Discussing
2
#MultiversXPlansHardForkRecovery
6,096 views
349 Discussing
3
#CircleLaunchesInstitutionalBTCBackedBorrowing
8,577 views
492 Discussing
4
#BitcoinHits$85K
11,774 views
230 Discussing
5
#ZetaChainVotesToMigrateZETAToSolana
7,644 views
311 Discussing
6
#ECBStartsBlockchainEuroSettlement
20,440 views
594 Discussing
7
#SouthAfricaProposesCryptoExchangeControls
32,083 views
782 Discussing
8
#SolanaCutsTargetSlotTimeTo250ms
34,845 views
701 Discussing
9
#EthereumSurpasses$2700
23,207 views
221 Discussing
10
#CanaryFilesSecondAmendmentForStakedSEIETF
50,854 views
1,038 Discussing