$BTW This spot is a bit interesting.
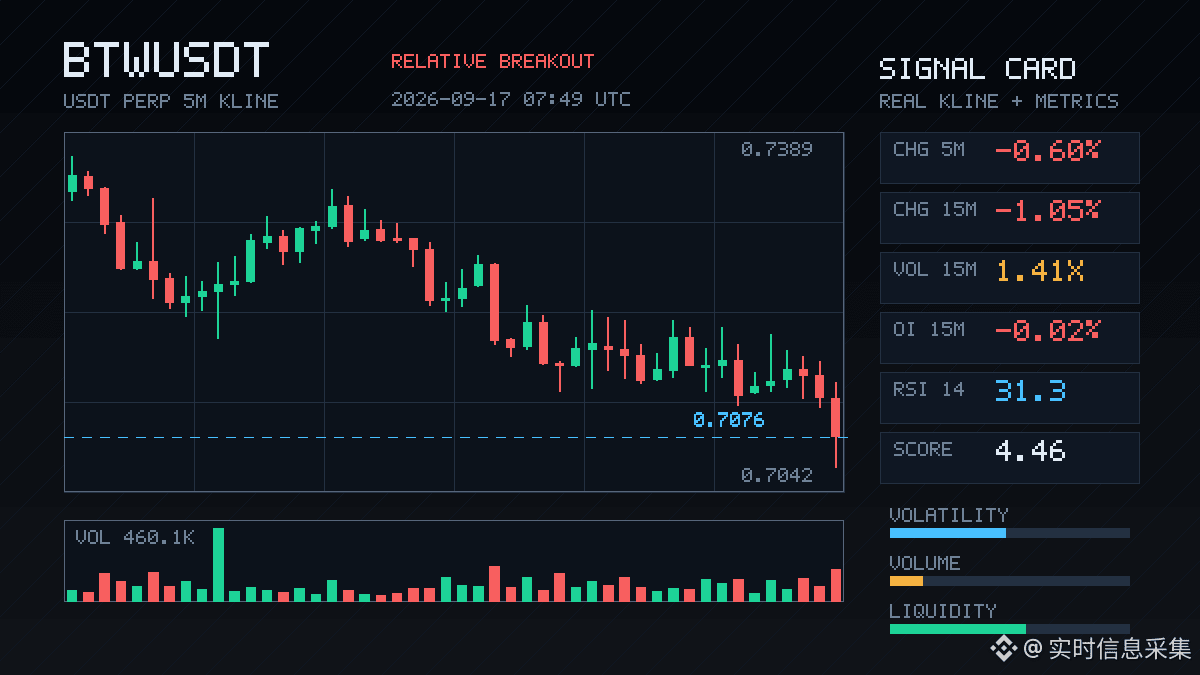
In the 15m timeframe, it dropped 1.05%. Volume was 1.41x. Price broke below the lower edge of the recent 20 5m-range. Aggressive trades were weaker by -23.3%, and the buy-sell ratio was 0.62—sell pressure is dominant, but it’s not that kind of panic-style dumping.
The key is the OI: 15m -0.02%, 1h -0.07%. Nominal change was -1.17M / -1.06M USDT. Price fell and OI also declined—typical of longs deleveraging or cutting losses. It’s not a case of fresh shorts entering. Also, the OI abnormal percentile is 84.5%. Across the whole pool, abnormal #15 and nominal change #4—this abnormality ranking is actually quite high.
In plain language: this wave is leverage being liquidated/cleared, not someone actively initiating a short. But the direction of aggressive trading is clearly sell-leaning, and the close smashed through the lower boundary of the range. If it can’t quickly reclaim that area, after the leverage flush is done, there may be a second leg.
Let’s wait and see how this 5m candle closes.
In the 15m timeframe, it dropped 1.05%. Volume was 1.41x. Price broke below the lower edge of the recent 20 5m-range. Aggressive trades were weaker by -23.3%, and the buy-sell ratio was 0.62—sell pressure is dominant, but it’s not that kind of panic-style dumping.
The key is the OI: 15m -0.02%, 1h -0.07%. Nominal change was -1.17M / -1.06M USDT. Price fell and OI also declined—typical of longs deleveraging or cutting losses. It’s not a case of fresh shorts entering. Also, the OI abnormal percentile is 84.5%. Across the whole pool, abnormal #15 and nominal change #4—this abnormality ranking is actually quite high.
In plain language: this wave is leverage being liquidated/cleared, not someone actively initiating a short. But the direction of aggressive trading is clearly sell-leaning, and the close smashed through the lower boundary of the range. If it can’t quickly reclaim that area, after the leverage flush is done, there may be a second leg.
Let’s wait and see how this 5m candle closes.