
#12
12
29,772 views
207 Discussing
Hot
Latest

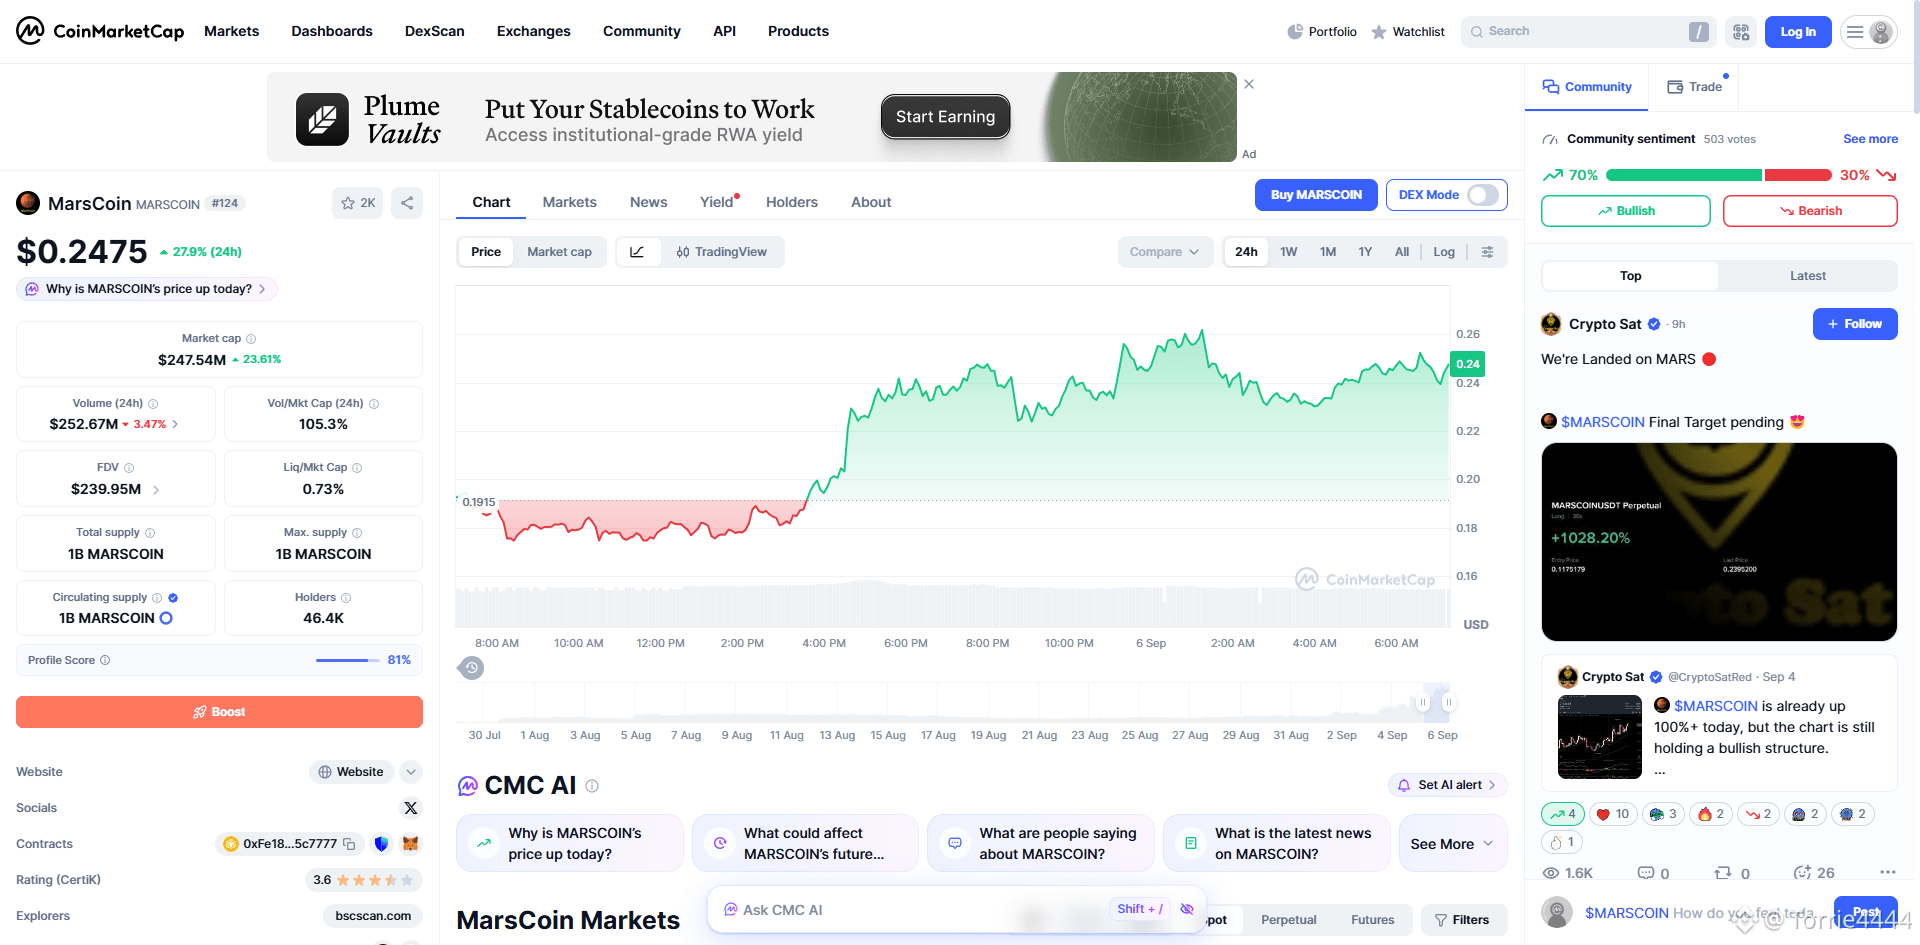
I checked the market briefly and found that MarsCoin ($MARSCOIN ) has quietly climbed to the #12 th spot on CoinMarketCap's trending list. This coin is also currently trading on Binance spot, and community discussion seems to be picking up. Short-term popularity is rising, but the battle between bulls and bears is still obvious. Everyone can add it to their watchlist first and see how the trend develops later. 👀 #MarsCoin #altcoin

$MAGMA this drop was pretty significant, with a straight -6.28% move in 15 minutes. Volume surged to 6.6x, with high volatility too, basically a heavy sell-off on expanded volume.
But the key point is that OI is still climbing. Open interest is up while price is down, clearly showing new short positions are stepping in. The anomaly ranking across the whole pool is #12, and notional change also made it into the top 22. It has been extending for several cycles in a row, so this is not the kind of one-off fake signal.
All in all, the quality of this leveraged short buildup is quite high. Short-term momentum is still bearish, so don’t rush to buy the dip; wait for an open-interest turning point before doing anything.
But the key point is that OI is still climbing. Open interest is up while price is down, clearly showing new short positions are stepping in. The anomaly ranking across the whole pool is #12, and notional change also made it into the top 22. It has been extending for several cycles in a row, so this is not the kind of one-off fake signal.
All in all, the quality of this leveraged short buildup is quite high. Short-term momentum is still bearish, so don’t rush to buy the dip; wait for an open-interest turning point before doing anything.
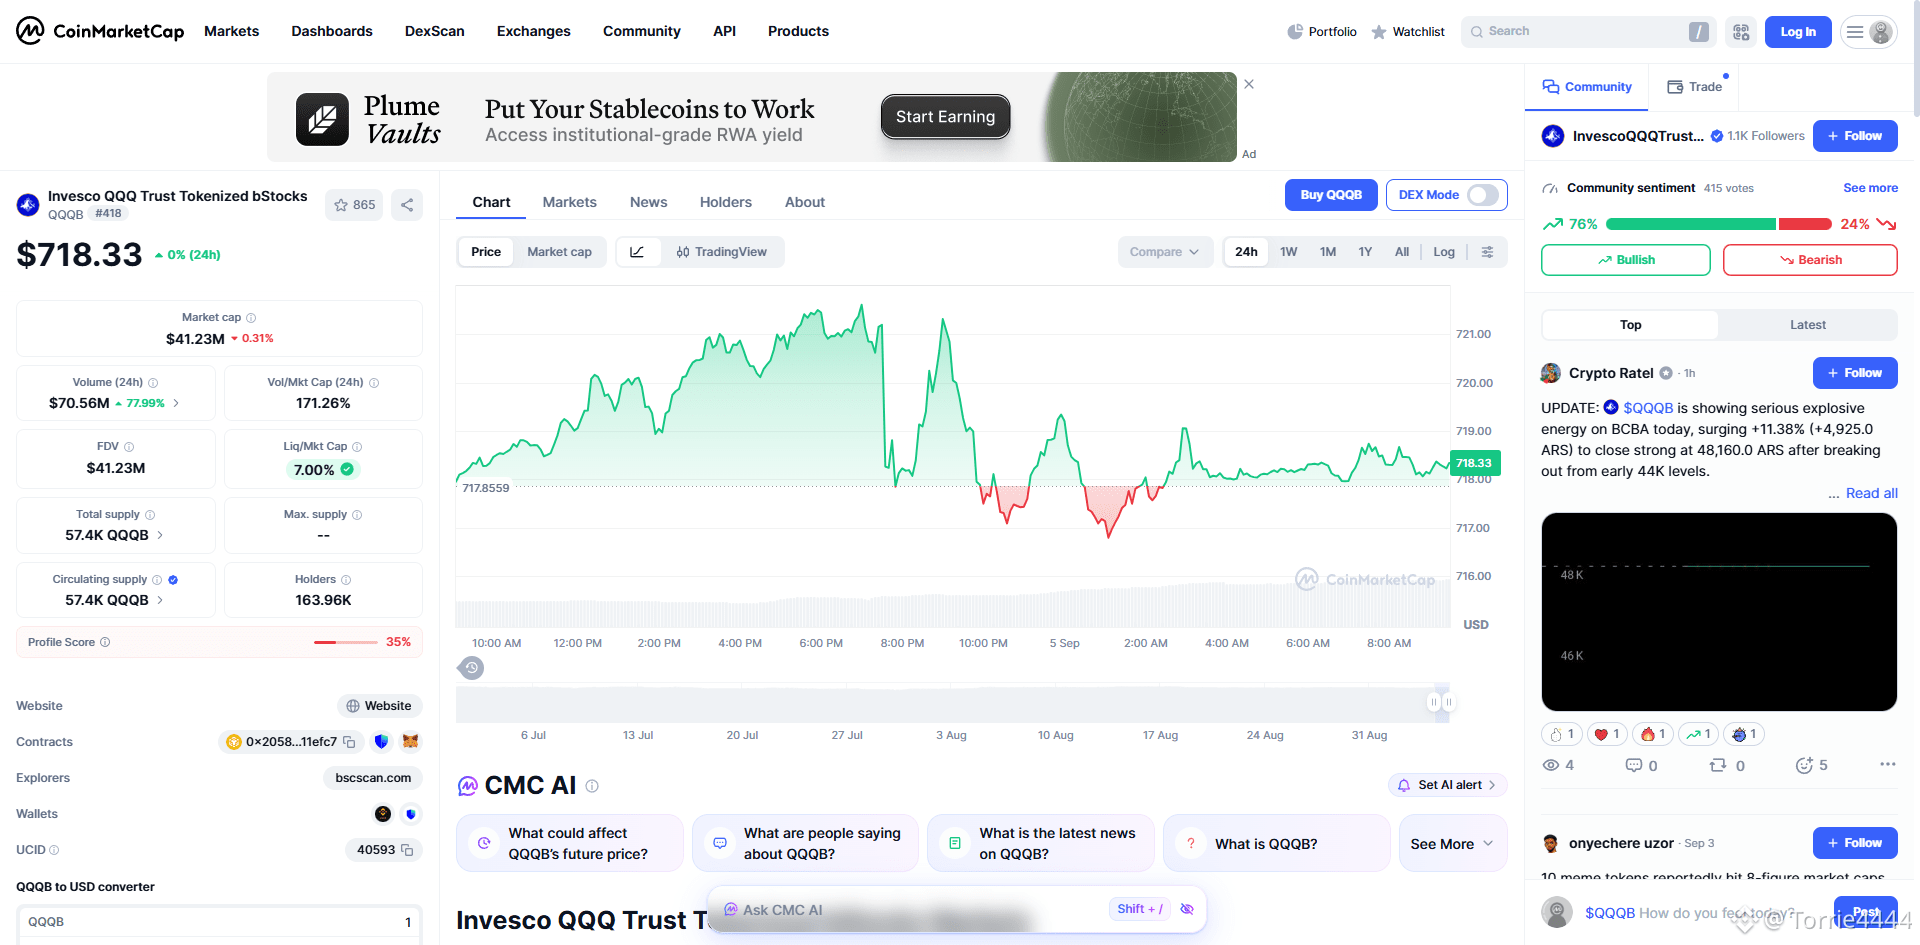
Today while checking the rankings, I saw that Invesco QQQ Trust Tokenized bStocks ($QQQB ) is currently ranked #12 th on CoinMarketCap's trending list. As a tokenized asset that mirrors a traditional index, it can also be traded on Binance spot, and funding attention is clearly increasing. What do you think this kind of asset will perform like next? 👀 #QQQB #RWA

$HEMI This 15m draw has a bit of strength 👀
The price broke through the top of the near-20x 5m K-line range. A 1.85% gain doesn’t look huge at first glance, but with the volume at 1.39x and the volatility Z value at 1.98, it actually already has the “building momentum” vibe. The key is OI—on the 15m contract, +0.25% looks mild, but the notional change directly jumped to 446K (+2.15%). On the 1h dimension it’s even 659K (+3.21%). This doesn’t look like short-covering; it looks more like newly added leveraged longs are actively entering.
Active execution is down 15.8%, buy-to-sell ratio 1.37, and in terms of direction, longs are truly in control. The abnormal ranking in the whole pool is #38, and the notional change has climbed to #12. The money isn’t randomly buying—it’s hitting the boundary of the range.
With this kind of capital structure on the 15-minute timeframe, short-term momentum may continue. However, since OI is rising so quickly, if volume can’t keep up, pullbacks will come fast too. Keep an eye on it—don’t chase the price.
The price broke through the top of the near-20x 5m K-line range. A 1.85% gain doesn’t look huge at first glance, but with the volume at 1.39x and the volatility Z value at 1.98, it actually already has the “building momentum” vibe. The key is OI—on the 15m contract, +0.25% looks mild, but the notional change directly jumped to 446K (+2.15%). On the 1h dimension it’s even 659K (+3.21%). This doesn’t look like short-covering; it looks more like newly added leveraged longs are actively entering.
Active execution is down 15.8%, buy-to-sell ratio 1.37, and in terms of direction, longs are truly in control. The abnormal ranking in the whole pool is #38, and the notional change has climbed to #12. The money isn’t randomly buying—it’s hitting the boundary of the range.
With this kind of capital structure on the 15-minute timeframe, short-term momentum may continue. However, since OI is rising so quickly, if volume can’t keep up, pullbacks will come fast too. Keep an eye on it—don’t chase the price.


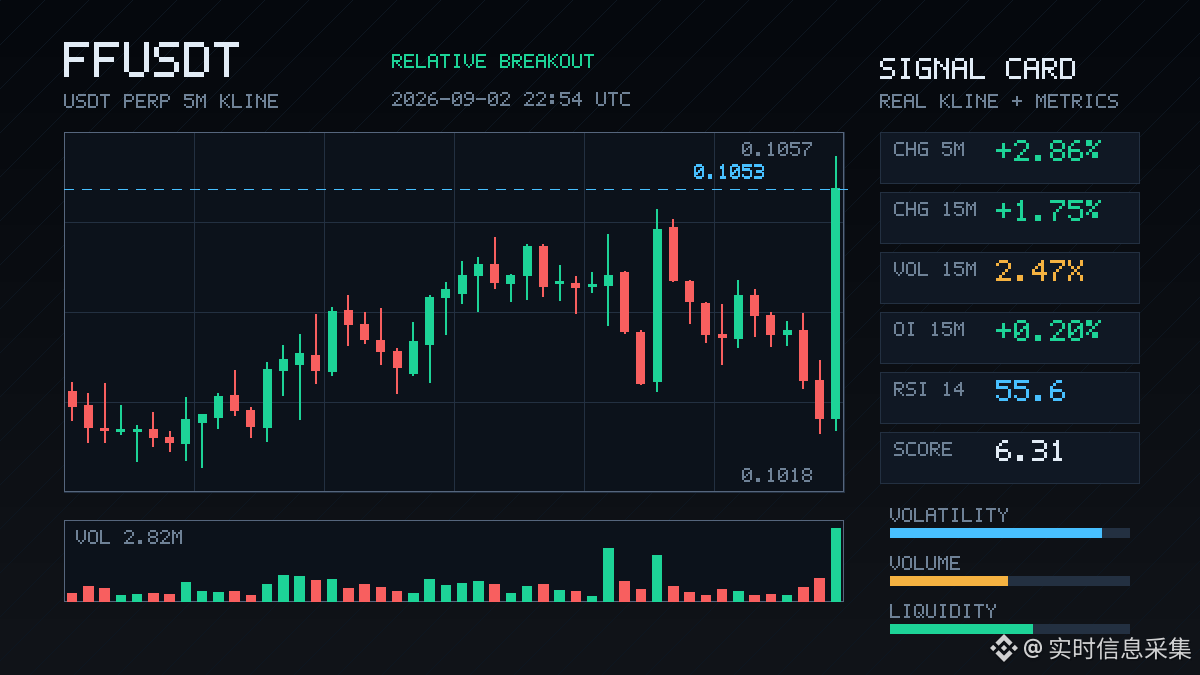
$FF This order book has something going on.
In 15 minutes it jumped 1.75%, with both volume and volatility clearly amplifying. The close directly broke through the upper edge of nearly 20 consecutive 5-minute K-lines—this isn’t a slow, grind-it-out breakout; it’s the kind where a single line just pierces straight through.
What’s interesting is that OI is also rising in sync. Over the 15-minute window, the nominal change is around 335K. Coupled with the aggressive trade delta of 18.1% and the buy-sell ratio of 1.44, this push is more likely driven by newly added leveraged long positions backed by real money—not just spot trading setting the tone.
The pool’s abnormal ranking is #36, while the nominal change has climbed to #12. Clearly, capital attention is moving upward.
But a reminder—this combination of “increased volume + breakdown/piercing + active buying” is indeed a great script. However, once it’s pulled to this level, if the intraday time-share rhythm gets messy, the tolerance for chasing highs drops sharply. First, see if it can hold the breakout level—then we’ll talk about the rest.
$FF
In 15 minutes it jumped 1.75%, with both volume and volatility clearly amplifying. The close directly broke through the upper edge of nearly 20 consecutive 5-minute K-lines—this isn’t a slow, grind-it-out breakout; it’s the kind where a single line just pierces straight through.
What’s interesting is that OI is also rising in sync. Over the 15-minute window, the nominal change is around 335K. Coupled with the aggressive trade delta of 18.1% and the buy-sell ratio of 1.44, this push is more likely driven by newly added leveraged long positions backed by real money—not just spot trading setting the tone.
The pool’s abnormal ranking is #36, while the nominal change has climbed to #12. Clearly, capital attention is moving upward.
But a reminder—this combination of “increased volume + breakdown/piercing + active buying” is indeed a great script. However, once it’s pulled to this level, if the intraday time-share rhythm gets messy, the tolerance for chasing highs drops sharply. First, see if it can hold the breakout level—then we’ll talk about the rest.
$FF

$STAR This 15-minute move directly dumped 2.36%. Volume surged to 2.8x of the usual level, with a volatility Z-score of 3.17—this isn’t just small-scale action; it’s a breakdown with volume.
The key thing to watch is OI: the 15-minute contract positions shrank by 0.66%, and the 1-hour positions fell by nearly 1%. In total, notional change came out to -470K USDT. This combination of “price down + OI down” basically means the longs are stopping out and deleveraging—active sell pressure is taking the upper hand (buy/sell ratio 0.63, passive-vs-active execution gap -22.9%).
At the close, price broke down directly below the lower bound of the recent ~20 five-minute candlestick range. The overall abnormality ranks #12 across the pool, and the notional change ranks #33—this depth confirmation looks fairly solid. In the past 24 hours, trading volume is over 30 million U; liquidity is still there, which suggests it’s not that nobody’s playing—there are people running the trade.
One more thing: with this kind of “relative breakout + high-volume selloff” pattern, don’t rush to catch the falling knife. Wait for a contraction in volume to stabilize before acting.
The key thing to watch is OI: the 15-minute contract positions shrank by 0.66%, and the 1-hour positions fell by nearly 1%. In total, notional change came out to -470K USDT. This combination of “price down + OI down” basically means the longs are stopping out and deleveraging—active sell pressure is taking the upper hand (buy/sell ratio 0.63, passive-vs-active execution gap -22.9%).
At the close, price broke down directly below the lower bound of the recent ~20 five-minute candlestick range. The overall abnormality ranks #12 across the pool, and the notional change ranks #33—this depth confirmation looks fairly solid. In the past 24 hours, trading volume is over 30 million U; liquidity is still there, which suggests it’s not that nobody’s playing—there are people running the trade.
One more thing: with this kind of “relative breakout + high-volume selloff” pattern, don’t rush to catch the falling knife. Wait for a contraction in volume to stabilize before acting.
$MAGMA This 15-minute move is up 11% 🚀
Volume has spiked to 3.98x, and the volatility “Z” is at 11.3. The aggressive buy side is short by 8.5%, and the buy/sell ratio is 1.19—real money is flowing in. But interestingly, the OI (open interest) contract over the same 15 minutes actually fell by 1.11%, and the 1-hour OI is also contracting. So this move looks more like a short covering/position-rebalancing driven price spike rather than a brand-new long buildup.
In terms of structure, price has already broken above the upper boundary of the recent range formed by nearly 20 5m candlesticks, and it’s now pushing toward the extreme edge of its own historical range. The order-book volume also matches the breakout. Add to that 24h trading value of 97.38 million, with abnormality rank #12 across the whole pool and nominal change rank #13—this state really has something going on.
My take: short-term strength has been confirmed, but the OI pullback casts doubt on sustainability. Don’t blindly chase. The pullback is a more important thing to watch.
$MAGMA #山寨季 #BTC
Volume has spiked to 3.98x, and the volatility “Z” is at 11.3. The aggressive buy side is short by 8.5%, and the buy/sell ratio is 1.19—real money is flowing in. But interestingly, the OI (open interest) contract over the same 15 minutes actually fell by 1.11%, and the 1-hour OI is also contracting. So this move looks more like a short covering/position-rebalancing driven price spike rather than a brand-new long buildup.
In terms of structure, price has already broken above the upper boundary of the recent range formed by nearly 20 5m candlesticks, and it’s now pushing toward the extreme edge of its own historical range. The order-book volume also matches the breakout. Add to that 24h trading value of 97.38 million, with abnormality rank #12 across the whole pool and nominal change rank #13—this state really has something going on.
My take: short-term strength has been confirmed, but the OI pullback casts doubt on sustainability. Don’t blindly chase. The pullback is a more important thing to watch.
$MAGMA #山寨季 #BTC

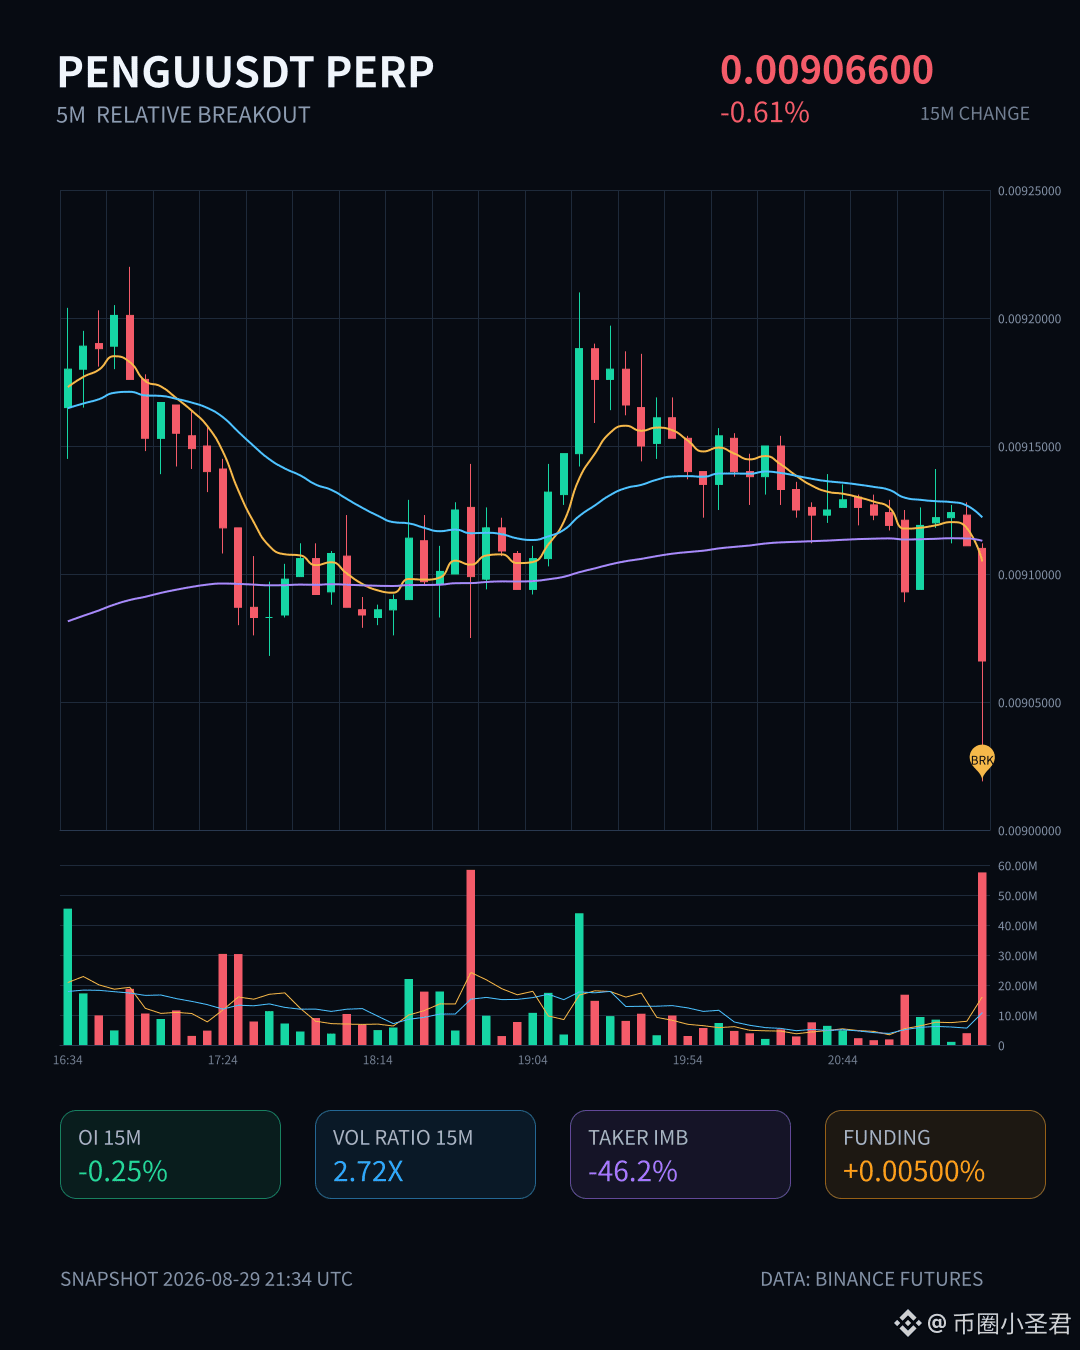
$PENGU This drop is kind of interesting.
On the 15-minute timeframe, it fell 0.61% while volume surged to 2.72x, but open interest didn’t move much—contracts on the 15-minute period only dropped 0.25%, with nominal change of -246K. This isn’t a traditional long-and-short double liquidation or something; it’s more like longs are exiting on their own—stop-losses getting triggered and positions being cut.
What’s especially interesting is that the closing price directly broke below the lower bound of the range of the past 20 five-minute candlesticks, plus the aggressive trade difference is -46.2% and the buy/sell ratio is 0.37—bears are pressing down very firmly.
I checked the whole-pool data: the abnormality level ranks at #12, nominal change at #17, and the funding rate is still in the higher percentile recently. At this point, emotionally it feels like a cooldown after being overheated.
The short-term trend looks a bit weak. Let’s first see if it can hold/support itself—don’t rush to buy the dip.
On the 15-minute timeframe, it fell 0.61% while volume surged to 2.72x, but open interest didn’t move much—contracts on the 15-minute period only dropped 0.25%, with nominal change of -246K. This isn’t a traditional long-and-short double liquidation or something; it’s more like longs are exiting on their own—stop-losses getting triggered and positions being cut.
What’s especially interesting is that the closing price directly broke below the lower bound of the range of the past 20 five-minute candlesticks, plus the aggressive trade difference is -46.2% and the buy/sell ratio is 0.37—bears are pressing down very firmly.
I checked the whole-pool data: the abnormality level ranks at #12, nominal change at #17, and the funding rate is still in the higher percentile recently. At this point, emotionally it feels like a cooldown after being overheated.
The short-term trend looks a bit weak. Let’s first see if it can hold/support itself—don’t rush to buy the dip.

On this consumer electronics line, I’ve been finding it more and more appealing lately.
It’s not that it’s going to suddenly become the most ferocious theme stock. It’s more like a big-cap that everyone actually uses, whose replacement cycle is slow and gradual—so when market sentiment isn’t that wildly excited, it can move more steadily. When rotation is fast, small caps can look different day to day. But when the funds really want something that can accommodate their position size, in the end they still circle back to a name like this.
$AAPL —right now I’m slightly bullish on it.
At first glance, it hasn’t looked overly dramatic today either. In the past 24 hours it’s up 1.83%, trading at $321.3, with a range of $315.26 to $322.48. But oddly, I actually like this kind of price action. It doesn’t feel like a stock that shoots straight up and lights people’s emotions on fire. It feels more like someone is willing to keep picking it up slowly near the highs.
There’s also a detail that really hits my taste.
On Binance’s US stock perpetual futures, it ranks #12 on the upside gainers list and #21 on the trading volume list. In the last 24 hours, it has $44.92M USDT in turnover. The funding rate is still +0.0000%, and the open interest is 59,783 contracts. This vibe clearly isn’t the kind of market where longs are piling into the same side and getting overheated. Yes, the heat is there, but the sentiment hasn’t spun out of control. Anyone who’s done futures knows: the worst is when a bunch of people crowd into the same direction, and then one last needle takes you out.
I’m bullish on it—not just based on the chart.
The strongest part of a company like this is that its brand, ecosystem, and user habits are tied together extremely deeply. You can dislike that it’s expensive, or complain that it doesn’t bring surprises. But when consumption picks back up and capital wants certainty, the market always seems to bring its attention back to companies like this—ones that can keep selling products consistently and also integrate services and hardware into a single loop. To put it simply: a lot of tech stocks are fueled by stories, while $AAPL is built on long-term habits.
Of course, it’s not blind optimism.
With a stock of this size, it’s hard to surge like a small-cap. If the market suddenly switches back to high-volatility theme plays, it may end up looking a bit dull. Also, the price is already sitting close to the 24-hour high. If you chase too aggressively, the short term can also easily turn into a roller coaster.
If it were me, I’d keep standing on the slightly bullish side—but I’d rather wait until it pulls back and stabilizes. If you can’t handle volatility, don’t force it. Honestly, I’m the kind of stubborn-mouth, scared-hand person—there have been plenty of losses for me from chasing highs.
$AAPL #USstocks
These are my thoughts. Your money—your call.
It’s not that it’s going to suddenly become the most ferocious theme stock. It’s more like a big-cap that everyone actually uses, whose replacement cycle is slow and gradual—so when market sentiment isn’t that wildly excited, it can move more steadily. When rotation is fast, small caps can look different day to day. But when the funds really want something that can accommodate their position size, in the end they still circle back to a name like this.
$AAPL —right now I’m slightly bullish on it.
At first glance, it hasn’t looked overly dramatic today either. In the past 24 hours it’s up 1.83%, trading at $321.3, with a range of $315.26 to $322.48. But oddly, I actually like this kind of price action. It doesn’t feel like a stock that shoots straight up and lights people’s emotions on fire. It feels more like someone is willing to keep picking it up slowly near the highs.
There’s also a detail that really hits my taste.
On Binance’s US stock perpetual futures, it ranks #12 on the upside gainers list and #21 on the trading volume list. In the last 24 hours, it has $44.92M USDT in turnover. The funding rate is still +0.0000%, and the open interest is 59,783 contracts. This vibe clearly isn’t the kind of market where longs are piling into the same side and getting overheated. Yes, the heat is there, but the sentiment hasn’t spun out of control. Anyone who’s done futures knows: the worst is when a bunch of people crowd into the same direction, and then one last needle takes you out.
I’m bullish on it—not just based on the chart.
The strongest part of a company like this is that its brand, ecosystem, and user habits are tied together extremely deeply. You can dislike that it’s expensive, or complain that it doesn’t bring surprises. But when consumption picks back up and capital wants certainty, the market always seems to bring its attention back to companies like this—ones that can keep selling products consistently and also integrate services and hardware into a single loop. To put it simply: a lot of tech stocks are fueled by stories, while $AAPL is built on long-term habits.
Of course, it’s not blind optimism.
With a stock of this size, it’s hard to surge like a small-cap. If the market suddenly switches back to high-volatility theme plays, it may end up looking a bit dull. Also, the price is already sitting close to the 24-hour high. If you chase too aggressively, the short term can also easily turn into a roller coaster.
If it were me, I’d keep standing on the slightly bullish side—but I’d rather wait until it pulls back and stabilizes. If you can’t handle volatility, don’t force it. Honestly, I’m the kind of stubborn-mouth, scared-hand person—there have been plenty of losses for me from chasing highs.
$AAPL #USstocks
These are my thoughts. Your money—your call.


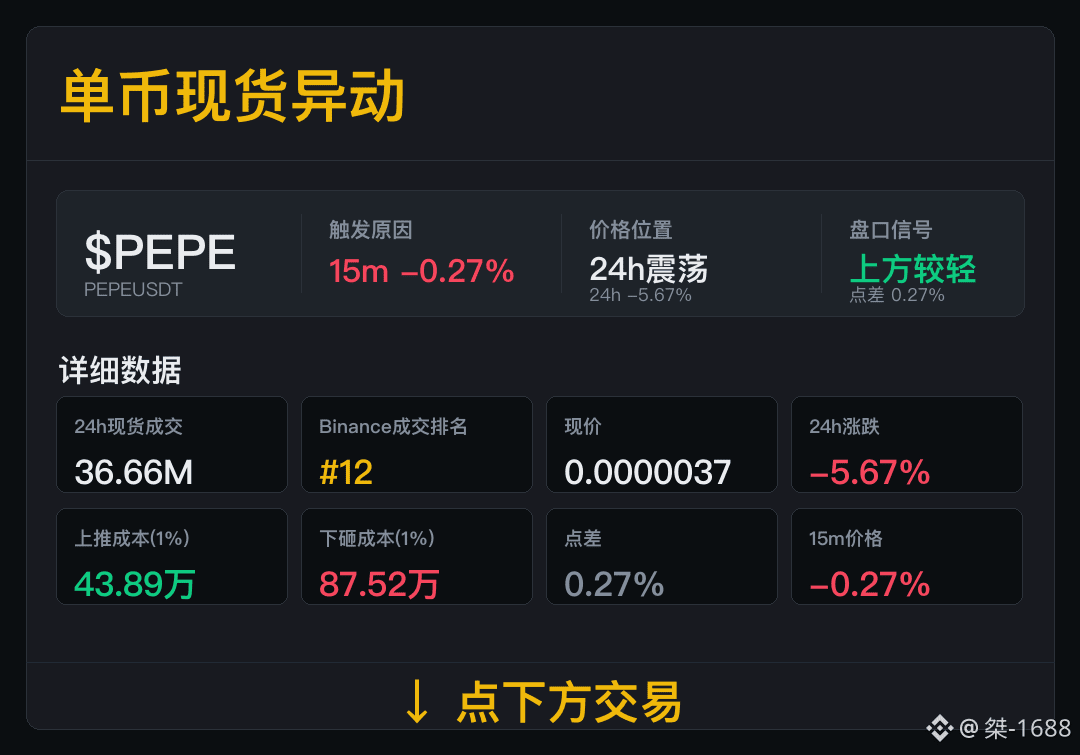
$PEPE 15m The breakout has been triggered; next, keep an eye on spot participation.
Spot trades: 36.66M, Binance trade ranking #12. The current participation size has already been listed—next round, continue to verify trades.
Now: 24h price change -5.67%; spread 0.27%. Upward cost: 0.4389M, downward cost: 0.8752M. Going forward, if both trades and spread stabilize at the same time, intraday breakout persistence will be higher.
In the next segment, first check volume strength, then check the buy-sell price spread.
Spot trades: 36.66M, Binance trade ranking #12. The current participation size has already been listed—next round, continue to verify trades.
Now: 24h price change -5.67%; spread 0.27%. Upward cost: 0.4389M, downward cost: 0.8752M. Going forward, if both trades and spread stabilize at the same time, intraday breakout persistence will be higher.
In the next segment, first check volume strength, then check the buy-sell price spread.

Zcash ($ZEC ) Gains Traction with Strong 24h Volume
Zcash ($ZEC ) is trending at #6 with a robust 24h volume of $1.12B, despite a slight dip of -0.73%. Traders are eyeing $ZEC for its robust privacy features and recent community engagement. The coin’s market cap rank at #12 highlights its enduring relevance in the crypto space. With strong fundamentals and a dedicated community, $ZEC remains a key player to watch. ⚡
Follow for more crypto setups.
#HahaProfit #Zcash
Zcash ($ZEC ) is trending at #6 with a robust 24h volume of $1.12B, despite a slight dip of -0.73%. Traders are eyeing $ZEC for its robust privacy features and recent community engagement. The coin’s market cap rank at #12 highlights its enduring relevance in the crypto space. With strong fundamentals and a dedicated community, $ZEC remains a key player to watch. ⚡
Follow for more crypto setups.
#HahaProfit #Zcash


Don’t focus on how much it’s up in a single day. For companies like Marvell, I’ll first look at where they sit in the industry chain. As I understand it, it roughly belongs to the semiconductor infrastructure segment—one that feeds on long-term demands such as compute power, data centers, and network interconnect. The market is trading AI over and over again now. It’s not just chasing the application layer at the very front; a lot of capital is starting to return to the layer where “someone moves the compute, transports data, connects data, and keeps the systems running smoothly.” As long as this direction doesn’t lose its momentum, valuations are likely to be brought up and re-priced repeatedly.
I’m bullish on it not because the name is hot, but because this space doesn’t look like a one-off theme. As AI keeps moving forward, the true bottlenecks are usually not the story—it’s the hard requirements like bandwidth, connection efficiency, and system throughput. Companies like Marvell, categorized under foundational chips and connectivity capabilities, tend to see their resilience come from industry capex continuing to move forward. As long as cloud and compute investments keep going, the market will continue to assign a premium to these stocks, even if there are big swings in between.
You can see a bit of the “feel” in the tape too. Today it ranks on the Binance US stock perpetuals by gain rate at #12 and by trading value at #16. The current price over 24 hours is $259.07, rising from $237.04 all the way to $259.14, up +7.71%. That suggests it’s not just someone lighting a fire—it’s sustained trading. The funding rate is +0.0251%, which isn’t outrageous; at least it hasn’t reached the point where sentiment is completely out of control. With 126,162 lots held, I wouldn’t chase higher here. Instead, I’d wait for a pullback and then decide whether to take a small position to ride the trend.
I haven’t opened $MRVL perpetuals, for a very simple reason: this move is too straight up, and the risk/reward ratio is worse than usual. If I were going to do it, I’d rather wait for it to rotate/turn over at a high level and confirm it’s not just a surge driven purely by sentiment. If I had to pick the key variable: once the market switches from AI hardware back toward defense, drawdowns for this kind of stock can come very quickly—especially after high-level volume expansion, when capital lets go and usually won’t be that gentle.
I’ll put this into my trading watchlist first, not chase it hard at this spot. $MRVL #US Stocks
The market turns faster than a book being flipped—keep some room in your position.
I’m bullish on it not because the name is hot, but because this space doesn’t look like a one-off theme. As AI keeps moving forward, the true bottlenecks are usually not the story—it’s the hard requirements like bandwidth, connection efficiency, and system throughput. Companies like Marvell, categorized under foundational chips and connectivity capabilities, tend to see their resilience come from industry capex continuing to move forward. As long as cloud and compute investments keep going, the market will continue to assign a premium to these stocks, even if there are big swings in between.
You can see a bit of the “feel” in the tape too. Today it ranks on the Binance US stock perpetuals by gain rate at #12 and by trading value at #16. The current price over 24 hours is $259.07, rising from $237.04 all the way to $259.14, up +7.71%. That suggests it’s not just someone lighting a fire—it’s sustained trading. The funding rate is +0.0251%, which isn’t outrageous; at least it hasn’t reached the point where sentiment is completely out of control. With 126,162 lots held, I wouldn’t chase higher here. Instead, I’d wait for a pullback and then decide whether to take a small position to ride the trend.
I haven’t opened $MRVL perpetuals, for a very simple reason: this move is too straight up, and the risk/reward ratio is worse than usual. If I were going to do it, I’d rather wait for it to rotate/turn over at a high level and confirm it’s not just a surge driven purely by sentiment. If I had to pick the key variable: once the market switches from AI hardware back toward defense, drawdowns for this kind of stock can come very quickly—especially after high-level volume expansion, when capital lets go and usually won’t be that gentle.
I’ll put this into my trading watchlist first, not chase it hard at this spot. $MRVL #US Stocks
The market turns faster than a book being flipped—keep some room in your position.

I’ve been tracking the CoinGecko trending list and noticed a few stand‑outs. Solana (SOL) jumped +2.8% today, keeping its spot in the top‑10. Hyperliquid (HYPE) surged +5.4%, a surprise for a token ranked #10. Cash Cat (CASHCAT) rallied +3.1%, showing the meme‑coin’s resilience. 🐱
I’m also keeping an eye on the mid‑cap crowd. Bitlayer (BTR) slipped ‑1.7% despite its #778 rank, while Zcash (ZEC) climbed +2.2% from #12. Dog (Bitcoin) (DOG) nudged +0.9%, hinting steady interest. 🚀
I’ve added Pons (PONS) and Dog (Bitcoin) (DOG) to my watchlist; Pons (+1.5%) is quietly moving at #296, and the quirky DOG (+0.9%) could surprise next week. Let’s see which token breaks out! 🌟
$BMT , $EDEN , $BTR
I’m also keeping an eye on the mid‑cap crowd. Bitlayer (BTR) slipped ‑1.7% despite its #778 rank, while Zcash (ZEC) climbed +2.2% from #12. Dog (Bitcoin) (DOG) nudged +0.9%, hinting steady interest. 🚀
I’ve added Pons (PONS) and Dog (Bitcoin) (DOG) to my watchlist; Pons (+1.5%) is quietly moving at #296, and the quirky DOG (+0.9%) could surprise next week. Let’s see which token breaks out! 🌟
$BMT , $EDEN , $BTR
Do you have this feeling? Once the market starts refocusing on computing power, the first thing that usually gets pulled into view is $NVDA .
This time I’m more bullish—not because I’m looking at how much it goes up in a single day, but because I’m seeing why money is willing to pile onto it first.
On Binance, in the U.S. stock perpetuals涨幅榜 it ranks as high as #20, and by trading volume it’s #12. Over the past 24 hours, volume is $128.11M USDT—this kind of heat isn’t just random noise.
More importantly, open contract positions are already 192,598 lots, while the funding rate is only +0.0026%.
This shows one thing: a lot of people are paying attention to it, but the sentiment hasn’t gotten hot.
If it were the kind of situation where everyone rushes in with frenzy, the funding rate usually wouldn’t be this mild.
I’ve lost too many times trading contracts like this myself. What I fear most is seeing everyone shouting, and the funding rate is still ridiculously high—where you step in, it’s easy to become the relay baton.
$NVDA has this vibe right now instead. It feels like big money has moved its focus onto it first; at the trading level, things haven’t gone out of control.
Looking further into the fundamentals—in plain human language—the market isn’t just watching one company; it’s watching the “computing power backbone” line.
From what I understand, regardless of how the conversation goes around AI, data centers, and enterprise-side computing power demand, it’s very hard to get around core chip companies like this.
Some companies get brought up just because they’re popular as a theme. Others get mentioned repeatedly because the industry truly needs to expand—orders, capital expenditures, and discussions across the industrial chain keep pointing back to them.
$NVDA feels more like the latter.
I also checked its price action today: over the past 24 hours it ranged from $210.29 to $214.83. The current price is $214.14, up +1.74%.
This kind of movement isn’t crazy—it looks like someone is steadily absorbing shares, not like an emotional stock that rockets up and then plunges in one go.
Of course, if you want to pick flaws, there aren’t zero variables.
The thing with stocks like this is that once the market starts worrying valuations are too full, or if overall risk appetite suddenly tightens, a pullback can come very quickly.
And since it’s hot and perpetuals can open directly, once there are more people on the short-term side, the volatility can be more punishing than the spot market.
But if you ask me why the market is watching it now, my answer is very straightforward: money is looking for the entry point of a leading dragon in a lane with certainty. $NVDA happens to be standing right at that position.
If it were me, I’d rather treat it as a stock to look for pullback opportunities within a strong trend. I don’t want to bet against it here. The market is changing—what’s true today may not be true tomorrow. $NVDA #U.S. stocks
This time I’m more bullish—not because I’m looking at how much it goes up in a single day, but because I’m seeing why money is willing to pile onto it first.
On Binance, in the U.S. stock perpetuals涨幅榜 it ranks as high as #20, and by trading volume it’s #12. Over the past 24 hours, volume is $128.11M USDT—this kind of heat isn’t just random noise.
More importantly, open contract positions are already 192,598 lots, while the funding rate is only +0.0026%.
This shows one thing: a lot of people are paying attention to it, but the sentiment hasn’t gotten hot.
If it were the kind of situation where everyone rushes in with frenzy, the funding rate usually wouldn’t be this mild.
I’ve lost too many times trading contracts like this myself. What I fear most is seeing everyone shouting, and the funding rate is still ridiculously high—where you step in, it’s easy to become the relay baton.
$NVDA has this vibe right now instead. It feels like big money has moved its focus onto it first; at the trading level, things haven’t gone out of control.
Looking further into the fundamentals—in plain human language—the market isn’t just watching one company; it’s watching the “computing power backbone” line.
From what I understand, regardless of how the conversation goes around AI, data centers, and enterprise-side computing power demand, it’s very hard to get around core chip companies like this.
Some companies get brought up just because they’re popular as a theme. Others get mentioned repeatedly because the industry truly needs to expand—orders, capital expenditures, and discussions across the industrial chain keep pointing back to them.
$NVDA feels more like the latter.
I also checked its price action today: over the past 24 hours it ranged from $210.29 to $214.83. The current price is $214.14, up +1.74%.
This kind of movement isn’t crazy—it looks like someone is steadily absorbing shares, not like an emotional stock that rockets up and then plunges in one go.
Of course, if you want to pick flaws, there aren’t zero variables.
The thing with stocks like this is that once the market starts worrying valuations are too full, or if overall risk appetite suddenly tightens, a pullback can come very quickly.
And since it’s hot and perpetuals can open directly, once there are more people on the short-term side, the volatility can be more punishing than the spot market.
But if you ask me why the market is watching it now, my answer is very straightforward: money is looking for the entry point of a leading dragon in a lane with certainty. $NVDA happens to be standing right at that position.
If it were me, I’d rather treat it as a stock to look for pullback opportunities within a strong trend. I don’t want to bet against it here. The market is changing—what’s true today may not be true tomorrow. $NVDA #U.S. stocks
$STAR This 15-minute move directly wiped out 3 points. The volume is still up to 2.2x—just doesn’t look like it’s play-acting. The price has already broken below the lower edge of the recent range of nearly 20 five-minute K-lines. Sell orders in the market have an absolute advantage; the bid side can’t really hold up.
Even more interesting is that the OI is shrinking at the same time—within the 15-minute timeframe, the contract positions were cut by 0.74%, and for the 1-hour dimension it’s also -0.63%. What does that mean? The longs are actively “admitting defeat” and deleveraging—not just a straightforward long-versus-short slugfest. Someone is genuinely cutting losses and exiting. The change in contract notional gets pushed to #12 across the whole pool; the abnormal percentile immediately jumps to 99.2%. At this level of data anomaly, textbooks would call it a “trend continuation” signal, not a reversal.
Don’t rush to catch the falling knife. First, watch when this deleveraging move actually stops.
Even more interesting is that the OI is shrinking at the same time—within the 15-minute timeframe, the contract positions were cut by 0.74%, and for the 1-hour dimension it’s also -0.63%. What does that mean? The longs are actively “admitting defeat” and deleveraging—not just a straightforward long-versus-short slugfest. Someone is genuinely cutting losses and exiting. The change in contract notional gets pushed to #12 across the whole pool; the abnormal percentile immediately jumps to 99.2%. At this level of data anomaly, textbooks would call it a “trend continuation” signal, not a reversal.
Don’t rush to catch the falling knife. First, watch when this deleveraging move actually stops.
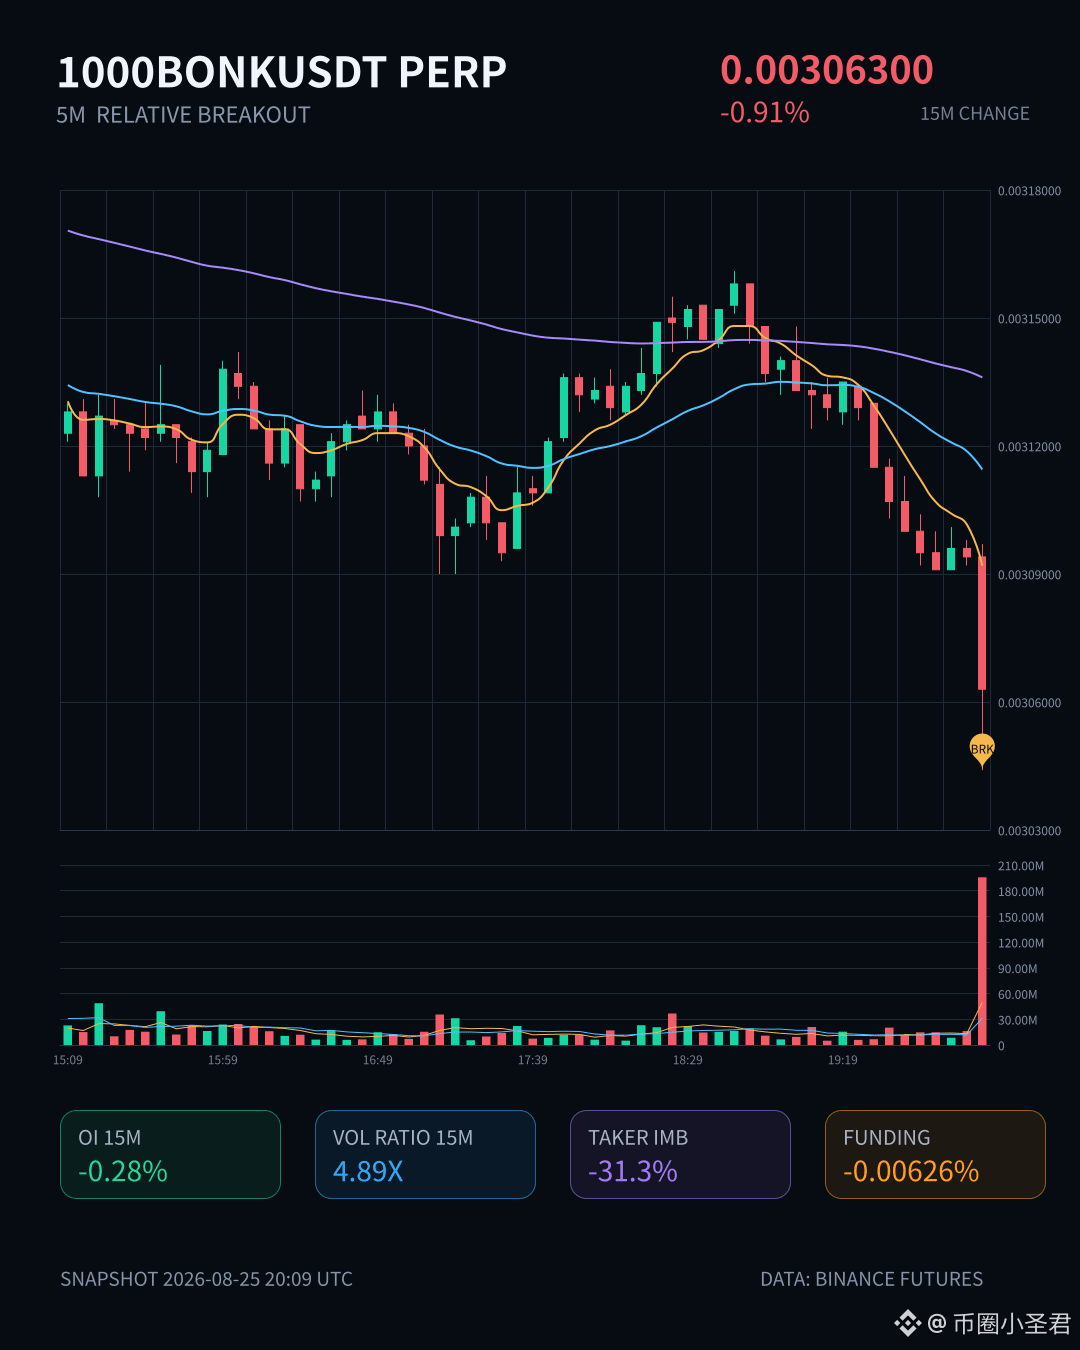
$1000BONK This move is kind of interesting. In the 15m timeframe it’s down -0.91% directly, volume surged to nearly 4.9x, and the price also broke below the lower band of the 20-period 5mK—this fits a standard range-break move.
But what I care about more is the OI. The 15m contract is -0.28%, and the 1h is also down -0.49%. Total notional change adds up to almost -600K. This suggests the sell-off wasn’t driven by fresh short selling; it looks more like longs are actively withdrawing—cutting positions. The aggressive trade imbalance is -31.3%, the buy/sell ratio is 0.52, so sell pressure is indeed stronger. But the main players didn’t add to their positions—instead, it feels more like they “scared off a round of leverage.”
Whole pool abnormal ranking #12, notional change ranking #33; on the depth side there is confirmation. With this kind of structure, the continuation of the downturn is a bit questionable—after all, the contracts have already cooled off, so the motivation for further decline may not be that strong. But don’t rush to catch it either. First, see whether it can reclaim and hold above the range’s lower band; otherwise it’s easy to get repeatedly swept.
24h volume is 36M; fundamentals don’t carry much weight here—this is mostly capital-driven. In a market like this, short-term trading is key—don’t get stuck fighting it out.
But what I care about more is the OI. The 15m contract is -0.28%, and the 1h is also down -0.49%. Total notional change adds up to almost -600K. This suggests the sell-off wasn’t driven by fresh short selling; it looks more like longs are actively withdrawing—cutting positions. The aggressive trade imbalance is -31.3%, the buy/sell ratio is 0.52, so sell pressure is indeed stronger. But the main players didn’t add to their positions—instead, it feels more like they “scared off a round of leverage.”
Whole pool abnormal ranking #12, notional change ranking #33; on the depth side there is confirmation. With this kind of structure, the continuation of the downturn is a bit questionable—after all, the contracts have already cooled off, so the motivation for further decline may not be that strong. But don’t rush to catch it either. First, see whether it can reclaim and hold above the range’s lower band; otherwise it’s easy to get repeatedly swept.
24h volume is 36M; fundamentals don’t carry much weight here—this is mostly capital-driven. In a market like this, short-term trading is key—don’t get stuck fighting it out.

XPL is at it again.
In just 15 minutes, it dropped 1.43%. Trading volume surged to more than three times, and the price even broke through the lower bound of nearly 20 five-minute candlestick ranges. On the order book, there’s a clear主动卖压 (active selling pressure). The buy/sell ratio is 0.58, and the主动成交差 (active trade imbalance) is -26.4%. In plain terms, this wasn’t a sideways-to-bearish slow bleed—someone is genuinely making a move.
What’s interesting is that OI is actually shrinking instead. The 15m nominal change is -1.60%, and the 1h is also a slight net outflow. Combined with the fee rate still being at a high level, this looks more like longs deleveraging—after liquidation and stop-losses get hit in a chain—followed by a contraction phase, rather than the kind of plunge caused by new short positions rushing in.
It ranks #14 in abnormal orders across the whole pool, and #12 by nominal change—arguably one of the most front-row anomaly moves today.
Positions are down, price is down, and volatility has expanded—textbook-style liquidation of long positions at high levels. Next comes the question: will it keep grinding lower to wash out liquidity, or will it drop and then pull up a single spike to lure people back? It depends on whether, at this level, the volume can stop growing and start contracting.
$XPL —keep an eye on it for now. Don’t rush to catch it.
In just 15 minutes, it dropped 1.43%. Trading volume surged to more than three times, and the price even broke through the lower bound of nearly 20 five-minute candlestick ranges. On the order book, there’s a clear主动卖压 (active selling pressure). The buy/sell ratio is 0.58, and the主动成交差 (active trade imbalance) is -26.4%. In plain terms, this wasn’t a sideways-to-bearish slow bleed—someone is genuinely making a move.
What’s interesting is that OI is actually shrinking instead. The 15m nominal change is -1.60%, and the 1h is also a slight net outflow. Combined with the fee rate still being at a high level, this looks more like longs deleveraging—after liquidation and stop-losses get hit in a chain—followed by a contraction phase, rather than the kind of plunge caused by new short positions rushing in.
It ranks #14 in abnormal orders across the whole pool, and #12 by nominal change—arguably one of the most front-row anomaly moves today.
Positions are down, price is down, and volatility has expanded—textbook-style liquidation of long positions at high levels. Next comes the question: will it keep grinding lower to wash out liquidity, or will it drop and then pull up a single spike to lure people back? It depends on whether, at this level, the volume can stop growing and start contracting.
$XPL —keep an eye on it for now. Don’t rush to catch it.
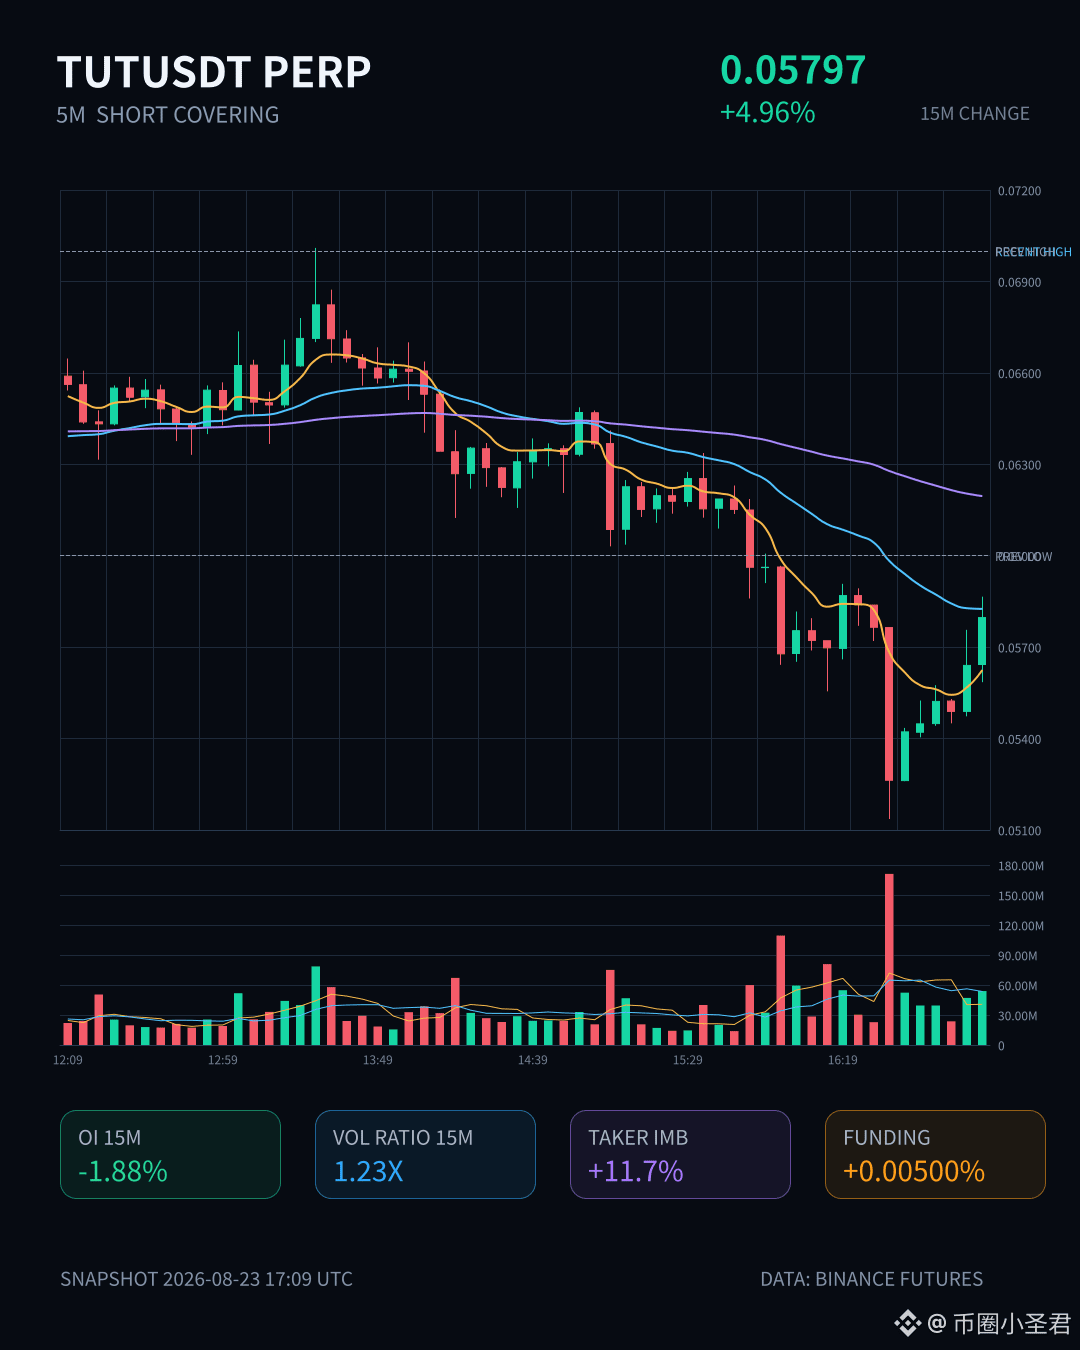
$TUT In these 15 minutes, there’s something going on: it surged straight up by 4.96%, and the volume also increased by 1.2 times. But what’s interesting is that the positions didn’t follow the rise—instead, they fell by nearly 2%. It looks like a short covering push brought on the move; it’s not fresh real money new longs entering the market.
The short-term trading funds are running out, yet the nominal trading volume still spikes to the whole pool #12. This kind of play with a volume-price divergence versus open interest is risky—could be a small bomb with big “thunder and little rain.” Don’t chase; just watch.
The short-term trading funds are running out, yet the nominal trading volume still spikes to the whole pool #12. This kind of play with a volume-price divergence versus open interest is risky—could be a small bomb with big “thunder and little rain.” Don’t chase; just watch.
Log in to explore more content