

#111
111
3,384 views
44 Discussing
Hot
Latest

·
--
$XPL’s current form is very straightforward: the bottom has been crawling for three months. On September 25th, suddenly it saw a surge in volume and pulled out two long bullish candles. Within 24 hours, trading volume hit $219M, and the price jumped from around $0.089 straight to $0.116. Market cap pushed up to $526M, and the ranking entered #111, but it is still 93% below the ATH. At this level, calling it a reversal is too early, while saying there’s been no action isn’t objective either.
The key is volume. Over the past month, most of the days saw daily volume in the $30M–$80M range. On September 22nd it rose to $122M, and on the 25th it doubled directly. Price and volume expanded in sync, which suggests capital chose to enter at this level rather than simply shorts covering. But a single day’s volume alone isn’t enough for a conclusion—especially since the ATH is still -93% away, meaning everything above is historically trapped supply, and the structure of the float isn’t clean.
What I care about most is whether this rally can pull back and confirm in the $0.09–$0.10 zone. If it retraces without breaking that band, then the earlier bottom consolidation can be defined as accumulation. If it falls directly back below $0.085, then the move on the 25th looks more like a liquidity pulse—fundamentally no different from that kind of low-liquidity surge seen with $EDEL. Current $219M volume corresponds to a $526M market cap, implying the turnover rate is on the high side; short-term speculation dominates, and trend-following capital may not be willing to chase at this point.
What really needs confirmation isn’t whether $XPL can climb back to $1.68, but whether this wave of funds has a sustained buying plan. The contradiction is right here: volume gave it a reason to emerge from the bottom, but being 93% below the ATH makes that reason sound like a joke.
$XPL ’s current form is very straightforward: the bottom has been crawling for three months. On September 25th, suddenly it saw a surge in volume and pulled out two long bullish candles. Within 24 hours, trading volume hit $219M, and the price jumped from around $0.089 straight to $0.116. Market cap pushed up to $526M, and the ranking entered #111, but it is still 93% below the ATH. At this level, calling it a reversal is too early, while saying there’s been no action isn’t objective either.
The key is volume. Over the past month, most of the days saw daily volume in the $30M–$80M range. On September 22nd it rose to $122M, and on the 25th it doubled directly. Price and volume expanded in sync, which suggests capital chose to enter at this level rather than simply shorts covering. But a single day’s volume alone isn’t enough for a conclusion—especially since the ATH is still -93% away, meaning everything above is historically trapped supply, and the structure of the float isn’t clean.
What I care about most is whether this rally can pull back and confirm in the $0.09–$0.10 zone. If it retraces without breaking that band, then the earlier bottom consolidation can be defined as accumulation. If it falls directly back below $0.085, then the move on the 25th looks more like a liquidity pulse—fundamentally no different from that kind of low-liquidity surge seen with $EDEL. Current $219M volume corresponds to a $526M market cap, implying the turnover rate is on the high side; short-term speculation dominates, and trend-following capital may not be willing to chase at this point.
What really needs confirmation isn’t whether $XPL can climb back to $1.68, but whether this wave of funds has a sustained buying plan. The contradiction is right here: volume gave it a reason to emerge from the bottom, but being 93% below the ATH makes that reason sound like a joke.
The key is volume. Over the past month, most of the days saw daily volume in the $30M–$80M range. On September 22nd it rose to $122M, and on the 25th it doubled directly. Price and volume expanded in sync, which suggests capital chose to enter at this level rather than simply shorts covering. But a single day’s volume alone isn’t enough for a conclusion—especially since the ATH is still -93% away, meaning everything above is historically trapped supply, and the structure of the float isn’t clean.
What I care about most is whether this rally can pull back and confirm in the $0.09–$0.10 zone. If it retraces without breaking that band, then the earlier bottom consolidation can be defined as accumulation. If it falls directly back below $0.085, then the move on the 25th looks more like a liquidity pulse—fundamentally no different from that kind of low-liquidity surge seen with $EDEL. Current $219M volume corresponds to a $526M market cap, implying the turnover rate is on the high side; short-term speculation dominates, and trend-following capital may not be willing to chase at this point.
What really needs confirmation isn’t whether $XPL can climb back to $1.68, but whether this wave of funds has a sustained buying plan. The contradiction is right here: volume gave it a reason to emerge from the bottom, but being 93% below the ATH makes that reason sound like a joke.
194

·
--
** How to Create a Daily Trade Plan on Binance Square and Exit Profitably? 📈💡Pudgy Penguins (PENGUUSDT) is trending right now!
Rank: #111
** ### 1️⃣ Market Scanning – “Which Tools Came On Stage Today?” **Step:** Check Binance Square’s “Market Overview” tab for the **Top Movers** and **Losers** lists. **Real Data Example (20 Sep 2026):** - **** +%14,2 – price: **10.353 USDT** - **** –%4,9 – price: **8.632 USDT** - **** –%2,5 – price: **2 575 USDT** **Why is it important?** The most active pairs offer volatility and liquidity → short-term opportunities emerge here. **Practical Tip:** - 📊 **Filter**: select “24h volume > 100 M USDT” and “price > 1 USDT”. - 🎯 **Cashtag**: add symbols like this to your favorites. --- ### 2️⃣ Trend Analysis – “Where Is the Price Flowing?” **Step:** Open your favorite pair’s **15-minute** and **1-hour** charts and add **EMA(20)** and **EMA(50)**. **Visual Hint:** - **EMA(20) > EMA(50)** → uptrend (green arrow). - **EMA(20) @ EMA(50)** → downtrend (red arrow). **Example:** On the 10-minute chart, EMA(20) is 10.10 USDT, EMA(50) is 9.80 USDT → **upward**. **Why is it important?** The trend direction determines your trading direction; opening a trade in the wrong trend can lead to large losses. **Practical Application:** - 📈 **Chart Tool** → use “Draw Trend Line” to connect the last two low points. - 🎯 **Note:** When the trend line breaks, review the next step. --- ### 3️⃣ Recognize Chart Patterns – “Keep Your Eyes Open to Spot the Opportunity!” **Step:** Look for typical patterns within the trend: | Pattern | What It Tells You | Visual Hint | |------|-----------
** How to Create a Daily Trade Plan on Binance Square and Exit Profitably? 📈💡
Pudgy Penguins (PENGUUSDT) is trending right now!
Rank: #111
** ### 1️⃣ Market Scanning – “Which Tools Came On Stage Today?” **Step:** Check Binance Square’s “Market Overview” tab for the **Top Movers** and **Losers** lists. **Real Data Example (20 Sep 2026):** - **** +%14,2 – price: **10.353 USDT** - **** –%4,9 – price: **8.632 USDT** - **** –%2,5 – price: **2 575 USDT** **Why is it important?** The most active pairs offer volatility and liquidity → short-term opportunities emerge here. **Practical Tip:** - 📊 **Filter**: select “24h volume > 100 M USDT” and “price > 1 USDT”. - 🎯 **Cashtag**: add symbols like this to your favorites. --- ### 2️⃣ Trend Analysis – “Where Is the Price Flowing?” **Step:** Open your favorite pair’s **15-minute** and **1-hour** charts and add **EMA(20)** and **EMA(50)**. **Visual Hint:** - **EMA(20) > EMA(50)** → uptrend (green arrow). - **EMA(20) @ EMA(50)** → downtrend (red arrow). **Example:** On the 10-minute chart, EMA(20) is 10.10 USDT, EMA(50) is 9.80 USDT → **upward**. **Why is it important?** The trend direction determines your trading direction; opening a trade in the wrong trend can lead to large losses. **Practical Application:** - 📈 **Chart Tool** → use “Draw Trend Line” to connect the last two low points. - 🎯 **Note:** When the trend line breaks, review the next step. --- ### 3️⃣ Recognize Chart Patterns – “Keep Your Eyes Open to Spot the Opportunity!” **Step:** Look for typical patterns within the trend: | Pattern | What It Tells You | Visual Hint | |------|-----------
Rank: #111
** ### 1️⃣ Market Scanning – “Which Tools Came On Stage Today?” **Step:** Check Binance Square’s “Market Overview” tab for the **Top Movers** and **Losers** lists. **Real Data Example (20 Sep 2026):** - **** +%14,2 – price: **10.353 USDT** - **** –%4,9 – price: **8.632 USDT** - **** –%2,5 – price: **2 575 USDT** **Why is it important?** The most active pairs offer volatility and liquidity → short-term opportunities emerge here. **Practical Tip:** - 📊 **Filter**: select “24h volume > 100 M USDT” and “price > 1 USDT”. - 🎯 **Cashtag**: add symbols like this to your favorites. --- ### 2️⃣ Trend Analysis – “Where Is the Price Flowing?” **Step:** Open your favorite pair’s **15-minute** and **1-hour** charts and add **EMA(20)** and **EMA(50)**. **Visual Hint:** - **EMA(20) > EMA(50)** → uptrend (green arrow). - **EMA(20) @ EMA(50)** → downtrend (red arrow). **Example:** On the 10-minute chart, EMA(20) is 10.10 USDT, EMA(50) is 9.80 USDT → **upward**. **Why is it important?** The trend direction determines your trading direction; opening a trade in the wrong trend can lead to large losses. **Practical Application:** - 📈 **Chart Tool** → use “Draw Trend Line” to connect the last two low points. - 🎯 **Note:** When the trend line breaks, review the next step. --- ### 3️⃣ Recognize Chart Patterns – “Keep Your Eyes Open to Spot the Opportunity!” **Step:** Look for typical patterns within the trend: | Pattern | What It Tells You | Visual Hint | |------|-----------

·
--
$SOL seen to very agressive this coin goes high slowly buy long this coin for profit.
$90 to #111 in these days
{spot}(SOLUSDT)
$SOL seen to very agressive this coin goes high slowly buy long this coin for profit.
$90 to #111 in these days
$90 to #111 in these days

3
417
·
--
** How to Make % + Profitable Crypto Trades? – Binance Square Practical GuidePudgy Penguins (PENGUUSDT) is trending right now!
Rank: #111
** --- ### Step 1 – Market Scanning & “Top Movers” Introduction **What will we do?** See, in real time, the tokens that are moving the most (top-movers) on Binance Square. 1. Go to the **Binance Square “Market”** tab → select the **“Top Movers”** filter. 2. According to data from **18 Sept 2026**, the biggest gainers: | Symbol | Price (USDT) | 24h % Change | Volume (USDT) | |--------|--------------|--------------|--------------| | **UNIUSDT** | **8.669** | **+26.70 %** | 217 M | | **NEARUSDT** | **3.603** | **+25.63 %** | 351 M | | **DOTUSDT** | **1.140** | **+9.93 %** | 17 M | | **ATOMUSDT** | **1.657** | **+8.09 %** | 2.8 M | | **ADAUSDT** | **0.2152** | **+7.17 %** | 40 M | **Why is it important?** 🔎 The highest % change and volume indicate **liquidity + volatility** → entry and exit opportunities emerge here. **Visual Hint:** In the **candlestick charts** of these tokens, you’ll see **“spikes” (sudden pumps)** and **high-volume candles**. When the top of the candle is green and the volume candle is thick, the buy signal gets stronger. --- ### 📊 Step 2 – Technical Analysis: “Breakout” and “Pull-back” Strategy **How?** | Stages | Explanation | Example (UNI) | |----------|----------|-------------| | **a. Draw Support/Resistance Lines** | Identify key price levels on the 24-hour chart. | For UNI: **.84** (previous close) and **.44** (intraday high) | | **b. Volatility Band** | Add Bollinger Bands (20,2) → when price touches the upper band, the chance of a “breakout” increases. | UNI price **.66** → approaching the upper band
** How to Make % + Profitable Crypto Trades? – Binance Square Practical Guide
Pudgy Penguins (PENGUUSDT) is trending right now!
Rank: #111
** --- ### Step 1 – Market Scanning & “Top Movers” Introduction **What will we do?** See, in real time, the tokens that are moving the most (top-movers) on Binance Square. 1. Go to the **Binance Square “Market”** tab → select the **“Top Movers”** filter. 2. According to data from **18 Sept 2026**, the biggest gainers: | Symbol | Price (USDT) | 24h % Change | Volume (USDT) | |--------|--------------|--------------|--------------| | **UNIUSDT** | **8.669** | **+26.70 %** | 217 M | | **NEARUSDT** | **3.603** | **+25.63 %** | 351 M | | **DOTUSDT** | **1.140** | **+9.93 %** | 17 M | | **ATOMUSDT** | **1.657** | **+8.09 %** | 2.8 M | | **ADAUSDT** | **0.2152** | **+7.17 %** | 40 M | **Why is it important?** 🔎 The highest % change and volume indicate **liquidity + volatility** → entry and exit opportunities emerge here. **Visual Hint:** In the **candlestick charts** of these tokens, you’ll see **“spikes” (sudden pumps)** and **high-volume candles**. When the top of the candle is green and the volume candle is thick, the buy signal gets stronger. --- ### 📊 Step 2 – Technical Analysis: “Breakout” and “Pull-back” Strategy **How?** | Stages | Explanation | Example (UNI) | |----------|----------|-------------| | **a. Draw Support/Resistance Lines** | Identify key price levels on the 24-hour chart. | For UNI: **.84** (previous close) and **.44** (intraday high) | | **b. Volatility Band** | Add Bollinger Bands (20,2) → when price touches the upper band, the chance of a “breakout” increases. | UNI price **.66** → approaching the upper band
Rank: #111
** --- ### Step 1 – Market Scanning & “Top Movers” Introduction **What will we do?** See, in real time, the tokens that are moving the most (top-movers) on Binance Square. 1. Go to the **Binance Square “Market”** tab → select the **“Top Movers”** filter. 2. According to data from **18 Sept 2026**, the biggest gainers: | Symbol | Price (USDT) | 24h % Change | Volume (USDT) | |--------|--------------|--------------|--------------| | **UNIUSDT** | **8.669** | **+26.70 %** | 217 M | | **NEARUSDT** | **3.603** | **+25.63 %** | 351 M | | **DOTUSDT** | **1.140** | **+9.93 %** | 17 M | | **ATOMUSDT** | **1.657** | **+8.09 %** | 2.8 M | | **ADAUSDT** | **0.2152** | **+7.17 %** | 40 M | **Why is it important?** 🔎 The highest % change and volume indicate **liquidity + volatility** → entry and exit opportunities emerge here. **Visual Hint:** In the **candlestick charts** of these tokens, you’ll see **“spikes” (sudden pumps)** and **high-volume candles**. When the top of the candle is green and the volume candle is thick, the buy signal gets stronger. --- ### 📊 Step 2 – Technical Analysis: “Breakout” and “Pull-back” Strategy **How?** | Stages | Explanation | Example (UNI) | |----------|----------|-------------| | **a. Draw Support/Resistance Lines** | Identify key price levels on the 24-hour chart. | For UNI: **.84** (previous close) and **.44** (intraday high) | | **b. Volatility Band** | Add Bollinger Bands (20,2) → when price touches the upper band, the chance of a “breakout” increases. | UNI price **.66** → approaching the upper band
1

·
--
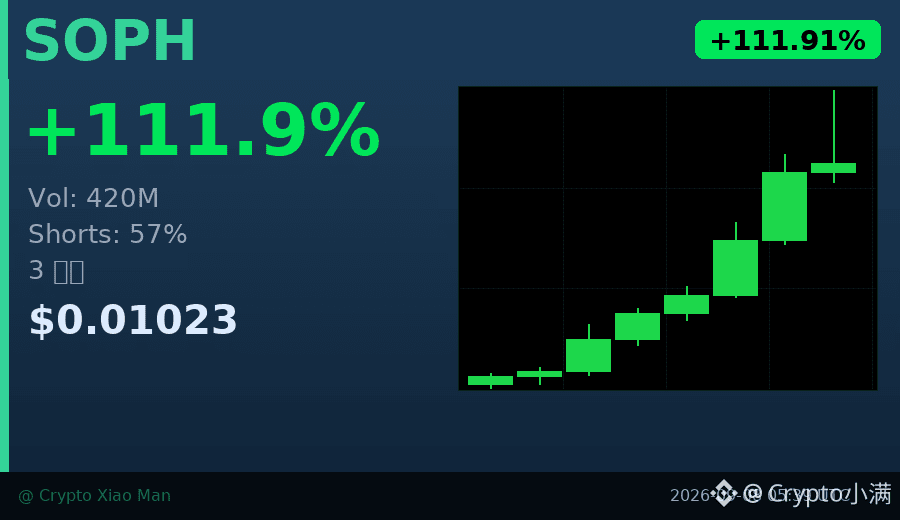
111% rise in percentage, but shorts still account for 57%—the SOPH long-vs-short showdown is quite interesting.
The price moved from 0.0046 to 0.0102, and the $420 million trading volume shows that capital really has been moving in.
But strangely, longs haven’t yet gained the upper hand—shorts’ share is actually higher.
This usually points to one of two possibilities: either shorts are waiting for a pullback to add more, or they haven’t realized that the trend has already changed.
The hourly K-line has closed bullish consecutively, and the buying momentum hasn’t broken.
If the shorts begin covering, it could accelerate the upward move.
$SOPH #逼空行情 #111%
Click the small card below to quickly check the market行情👇
111% rise in percentage, but shorts still account for 57%—the SOPH long-vs-short showdown is quite interesting.
The price moved from 0.0046 to 0.0102, and the $420 million trading volume shows that capital really has been moving in.
But strangely, longs haven’t yet gained the upper hand—shorts’ share is actually higher.
This usually points to one of two possibilities: either shorts are waiting for a pullback to add more, or they haven’t realized that the trend has already changed.
The hourly K-line has closed bullish consecutively, and the buying momentum hasn’t broken.
If the shorts begin covering, it could accelerate the upward move.
$SOPH #逼空行情 #111%
Click the small card below to quickly check the market行情👇
The price moved from 0.0046 to 0.0102, and the $420 million trading volume shows that capital really has been moving in.
But strangely, longs haven’t yet gained the upper hand—shorts’ share is actually higher.
This usually points to one of two possibilities: either shorts are waiting for a pullback to add more, or they haven’t realized that the trend has already changed.
The hourly K-line has closed bullish consecutively, and the buying momentum hasn’t broken.
If the shorts begin covering, it could accelerate the upward move.
$SOPH #逼空行情 #111%
Click the small card below to quickly check the market行情👇
58

·
--
We've spotted a surge in the market this week, and three tokens are leading the charge. 1️⃣ Zcash (ZEC) jumped +12.4% to reclaim a spot in the top‑15 by market cap. 2️⃣ Dash (DASH) surged +9.7%, pushing it into the top‑80 and catching the eye of traders. 3️⃣ Pudgy Penguins (PENGU) rallied +8.3%, climbing back into the top‑110 ranks. These moves signal renewed interest in privacy‑focused and community‑driven projects.
Meanwhile, mid‑tier assets are showing solid momentum. Lighter (LIT) posted a +7.1% gain, nudging it to rank #69. Cluster Protocol (CP) rose +6.5%, breaking into the top‑520. Lil' Shrub (SHRUB) added +5.9%, moving toward the #440 bracket. Pons (PONS) rounded out the list with a +5.2% increase, securing its place at #111. Consistent growth across these tokens suggests a broader market rotation toward under‑the‑radar opportunities.
As we monitor these trends, our community stays ready to capitalize on the upside. Diversifying across both privacy coins like ZEC and community tokens such as PENGU can help balance risk and reward. Keep an eye on the charts, and let’s navigate the next wave together 🚀.
$MARSCOIN, $DASH, $4
We've spotted a surge in the market this week, and three tokens are leading the charge. 1️⃣ Zcash (ZEC) jumped +12.4% to reclaim a spot in the top‑15 by market cap. 2️⃣ Dash (DASH) surged +9.7%, pushing it into the top‑80 and catching the eye of traders. 3️⃣ Pudgy Penguins (PENGU) rallied +8.3%, climbing back into the top‑110 ranks. These moves signal renewed interest in privacy‑focused and community‑driven projects.
Meanwhile, mid‑tier assets are showing solid momentum. Lighter (LIT) posted a +7.1% gain, nudging it to rank #69. Cluster Protocol (CP) rose +6.5%, breaking into the top‑520. Lil' Shrub (SHRUB) added +5.9%, moving toward the #440 bracket. Pons (PONS) rounded out the list with a +5.2% increase, securing its place at #111. Consistent growth across these tokens suggests a broader market rotation toward under‑the‑radar opportunities.
As we monitor these trends, our community stays ready to capitalize on the upside. Diversifying across both privacy coins like ZEC and community tokens such as PENGU can help balance risk and reward. Keep an eye on the charts, and let’s navigate the next wave together 🚀.
$MARSCOIN , $DASH , $4
Meanwhile, mid‑tier assets are showing solid momentum. Lighter (LIT) posted a +7.1% gain, nudging it to rank #69. Cluster Protocol (CP) rose +6.5%, breaking into the top‑520. Lil' Shrub (SHRUB) added +5.9%, moving toward the #440 bracket. Pons (PONS) rounded out the list with a +5.2% increase, securing its place at #111. Consistent growth across these tokens suggests a broader market rotation toward under‑the‑radar opportunities.
As we monitor these trends, our community stays ready to capitalize on the upside. Diversifying across both privacy coins like ZEC and community tokens such as PENGU can help balance risk and reward. Keep an eye on the charts, and let’s navigate the next wave together 🚀.
$MARSCOIN , $DASH , $4
310
·
--
** How to Do Technical Analysis? Secrets to Succeeding in Cryptocurrency Markets 📊Pons (PONSUSDT) is trending right now!
Rank: #111
** It is very important to develop technical analysis skills in order to succeed in cryptocurrency markets. Technical analysis helps predict future price movements by using past market data. In this guide, you will learn how to do technical analysis step by step. **Step 1: Choose the Chart Type** 🎯 The most commonly used chart types in technical analysis are: - **Line Chart**: Shows the change in price over time. - **Candlestick Chart**: Shows the opening, closing, highest, and lowest values of the price. For example, by looking at the 1-hour candlestick chart of '', you can analyze price movements over the last 24 hours. **Step 2: Identify Support and Resistance Levels** 💡 Support levels are points where the price moves downward but stops at a certain level. Resistance levels are points where the price moves upward but stops at a certain level. Think of it this way: Support levels are points where buyers push prices up; resistance levels are points where sellers pull prices down. For example, on the daily chart of '', you see that the 2400 level is a support level. If the price falls below the 2400 level, this could be a sell signal. **Step 3: Draw Trend Lines** 📈 Trend lines show the direction of price movement. An upward trend line connects points where the price moves upward. A downward trend line connects points where the price moves downward
** How to Do Technical Analysis? Secrets to Succeeding in Cryptocurrency Markets 📊
Pons (PONSUSDT) is trending right now!
Rank: #111
** It is very important to develop technical analysis skills in order to succeed in cryptocurrency markets. Technical analysis helps predict future price movements by using past market data. In this guide, you will learn how to do technical analysis step by step. **Step 1: Choose the Chart Type** 🎯 The most commonly used chart types in technical analysis are: - **Line Chart**: Shows the change in price over time. - **Candlestick Chart**: Shows the opening, closing, highest, and lowest values of the price. For example, by looking at the 1-hour candlestick chart of '', you can analyze price movements over the last 24 hours. **Step 2: Identify Support and Resistance Levels** 💡 Support levels are points where the price moves downward but stops at a certain level. Resistance levels are points where the price moves upward but stops at a certain level. Think of it this way: Support levels are points where buyers push prices up; resistance levels are points where sellers pull prices down. For example, on the daily chart of '', you see that the 2400 level is a support level. If the price falls below the 2400 level, this could be a sell signal. **Step 3: Draw Trend Lines** 📈 Trend lines show the direction of price movement. An upward trend line connects points where the price moves upward. A downward trend line connects points where the price moves downward
Rank: #111
** It is very important to develop technical analysis skills in order to succeed in cryptocurrency markets. Technical analysis helps predict future price movements by using past market data. In this guide, you will learn how to do technical analysis step by step. **Step 1: Choose the Chart Type** 🎯 The most commonly used chart types in technical analysis are: - **Line Chart**: Shows the change in price over time. - **Candlestick Chart**: Shows the opening, closing, highest, and lowest values of the price. For example, by looking at the 1-hour candlestick chart of '', you can analyze price movements over the last 24 hours. **Step 2: Identify Support and Resistance Levels** 💡 Support levels are points where the price moves downward but stops at a certain level. Resistance levels are points where the price moves upward but stops at a certain level. Think of it this way: Support levels are points where buyers push prices up; resistance levels are points where sellers pull prices down. For example, on the daily chart of '', you see that the 2400 level is a support level. If the price falls below the 2400 level, this could be a sell signal. **Step 3: Draw Trend Lines** 📈 Trend lines show the direction of price movement. An upward trend line connects points where the price moves upward. A downward trend line connects points where the price moves downward
24


Is the meme coin scene shifting again? 🐧🚀 Traders are eyeing these hot trending coins today: - $PUMP (#79) launch frenzy - $PENGU (#111) penguin heat - $ETH (#2) core strength Which one wins? #MemeCoins #Crypto Not Financial Advice (DYOR)
Is the meme coin scene shifting again? 🐧🚀 Traders are eyeing these hot trending coins today: - $PUMP (#79) launch frenzy - $PENGU (#111) penguin heat - $ETH (#2) core strength Which one wins? #MemeCoins #Crypto Not Financial Advice (DYOR)

120
·
--
24 hours dropped 2.16%. It doesn’t look too bad, but when you put it back on the 7-day and 30-day ruler, it’s -9.71% and -13.74%, respectively. What really makes people stop isn’t the size of the drop—it’s that **the 24-hour trading volume suddenly surged to $276 million**. Compared with the period from late June to mid-July, when daily volume ranged from $10 million to $30 million, this is not normal fluctuation.
As the price moves downward, the volume is surging upward. The signals on the board are not consistent: one possibility is that panic selling is clearing out, and another is that smart money is accumulating on the left side. What I care about more is that **$AERO is down 82% from its ATH**, with a market-cap ranking at **#111**. At this level, there’s an “low-level speculation” appeal for opportunistic capital, but for long-term holders, the **30-day grinding decline combined with an abnormal surge in volume** creates a real holding dilemma: **If this $276 million is bargain-hunting demand, why hasn’t the price recovered? If it’s just sell-off accelerating, where is the bottom?**
An easily overlooked risk: a volume expansion doesn’t necessarily mean a bottom is in—it could also be a liquidity trap. Large sell orders may be stacked at key price levels, and after a short-term rebound, the price could continue to probe the **0.38–0.40** zone.
To make a judgment now, you first need to clarify which time window you’re looking at. If you focus on short-term trades, the two main checkpoints are whether the **$0.4** psychological level can hold, and whether the trading volume drops back over the next 24 hours. If you’re more into swing trading, then you should wait until, after the surge in volume, the price stabilizes above the 5-day moving average (around **0.42**) before reevaluating the structure.
**One question: when you look at $AERO right now, are you viewing it from a short-term or swing-trading perspective? And what’s your “reference/compare” level in your mind—$0.4 or $0.45?**
24 hours dropped 2.16%. It doesn’t look too bad, but when you put it back on the 7-day and 30-day ruler, it’s -9.71% and -13.74%, respectively. What really makes people stop isn’t the size of the drop—it’s that **the 24-hour trading volume suddenly surged to $276 million**. Compared with the period from late June to mid-July, when daily volume ranged from $10 million to $30 million, this is not normal fluctuation.
As the price moves downward, the volume is surging upward. The signals on the board are not consistent: one possibility is that panic selling is clearing out, and another is that smart money is accumulating on the left side. What I care about more is that **$AERO is down 82% from its ATH**, with a market-cap ranking at **#111**. At this level, there’s an “low-level speculation” appeal for opportunistic capital, but for long-term holders, the **30-day grinding decline combined with an abnormal surge in volume** creates a real holding dilemma: **If this $276 million is bargain-hunting demand, why hasn’t the price recovered? If it’s just sell-off accelerating, where is the bottom?**
An easily overlooked risk: a volume expansion doesn’t necessarily mean a bottom is in—it could also be a liquidity trap. Large sell orders may be stacked at key price levels, and after a short-term rebound, the price could continue to probe the **0.38–0.40** zone.
To make a judgment now, you first need to clarify which time window you’re looking at. If you focus on short-term trades, the two main checkpoints are whether the **$0.4** psychological level can hold, and whether the trading volume drops back over the next 24 hours. If you’re more into swing trading, then you should wait until, after the surge in volume, the price stabilizes above the 5-day moving average (around **0.42**) before reevaluating the structure.
**One question: when you look at $AERO right now, are you viewing it from a short-term or swing-trading perspective? And what’s your “reference/compare” level in your mind—$0.4 or $0.45?**
As the price moves downward, the volume is surging upward. The signals on the board are not consistent: one possibility is that panic selling is clearing out, and another is that smart money is accumulating on the left side. What I care about more is that **$AERO is down 82% from its ATH**, with a market-cap ranking at **#111**. At this level, there’s an “low-level speculation” appeal for opportunistic capital, but for long-term holders, the **30-day grinding decline combined with an abnormal surge in volume** creates a real holding dilemma: **If this $276 million is bargain-hunting demand, why hasn’t the price recovered? If it’s just sell-off accelerating, where is the bottom?**
An easily overlooked risk: a volume expansion doesn’t necessarily mean a bottom is in—it could also be a liquidity trap. Large sell orders may be stacked at key price levels, and after a short-term rebound, the price could continue to probe the **0.38–0.40** zone.
To make a judgment now, you first need to clarify which time window you’re looking at. If you focus on short-term trades, the two main checkpoints are whether the **$0.4** psychological level can hold, and whether the trading volume drops back over the next 24 hours. If you’re more into swing trading, then you should wait until, after the surge in volume, the price stabilizes above the 5-day moving average (around **0.42**) before reevaluating the structure.
**One question: when you look at $AERO right now, are you viewing it from a short-term or swing-trading perspective? And what’s your “reference/compare” level in your mind—$0.4 or $0.45?**
68
·
--
We're excited to share the latest trending tokens with our community, based on data from CoinGecko. Our top picks include Hyperliquid (HYPE) and Pons (PONS), which are gaining traction in the market. We're also keeping an eye on Bitcoin (BTC) and Ethereum (ETH), which continue to dominate the market with their high market cap rankings.
We're seeing significant movement in the ranks, with XRP (XRP) holding strong at #6 and Plasma (XPL) rising to #149. Pudgy Penguins (PENGU) is another token on our radar, currently sitting at #111. Our community is eager to learn more about these tokens and their potential for growth. With market caps ranging from #1 to #631, we're seeing a diverse range of tokens making waves in the market 🚀.
We're committed to bringing our community the latest updates and insights on trending tokens. As we continue to monitor the market, we're expecting to see more exciting developments from these tokens and others 📈. With this information, our community can make informed decisions about their investments 💰. We're looking forward to seeing what the future holds for these tokens 📊.
$EUL, $ZIL, $BTW
We're excited to share the latest trending tokens with our community, based on data from CoinGecko. Our top picks include Hyperliquid (HYPE) and Pons (PONS), which are gaining traction in the market. We're also keeping an eye on Bitcoin (BTC) and Ethereum (ETH), which continue to dominate the market with their high market cap rankings.
We're seeing significant movement in the ranks, with XRP (XRP) holding strong at #6 and Plasma (XPL) rising to #149. Pudgy Penguins (PENGU) is another token on our radar, currently sitting at #111. Our community is eager to learn more about these tokens and their potential for growth. With market caps ranging from #1 to #631, we're seeing a diverse range of tokens making waves in the market 🚀.
We're committed to bringing our community the latest updates and insights on trending tokens. As we continue to monitor the market, we're expecting to see more exciting developments from these tokens and others 📈. With this information, our community can make informed decisions about their investments 💰. We're looking forward to seeing what the future holds for these tokens 📊.
$EUL , $ZIL , $BTW
We're seeing significant movement in the ranks, with XRP (XRP) holding strong at #6 and Plasma (XPL) rising to #149. Pudgy Penguins (PENGU) is another token on our radar, currently sitting at #111. Our community is eager to learn more about these tokens and their potential for growth. With market caps ranging from #1 to #631, we're seeing a diverse range of tokens making waves in the market 🚀.
We're committed to bringing our community the latest updates and insights on trending tokens. As we continue to monitor the market, we're expecting to see more exciting developments from these tokens and others 📈. With this information, our community can make informed decisions about their investments 💰. We're looking forward to seeing what the future holds for these tokens 📊.
$EUL , $ZIL , $BTW
41
Is capital rotation quietly shifting across market sectors this week? 📊 Looking at trending market data, we’re seeing a fascinating split between established DeFi protocols, brand-driven ecosystems, and speculative momentum. Key narrative trends traders are watching: 🔹 **DeFi Resurgence**: $UNI (#34) draws renewed focus as DEX activity shifts back to core infrastructure. 🔹 **NFT Ecosystem Expansion**: $PENGU (#111) highlights growing interest in community-backed brand tokens. 🔹 **Macro Anchor**: $BTC (#1) continues to dictate overall market liquidity and risk appetite. When liquidity divides across distinct sectors, tracking narrative volume can reveal where attention moves next. Which sector has your focus this week—DeFi, NFT brands, or Macro BTC mome Not Financial Advice (DYOR)
Is capital rotation quietly shifting across market sectors this week? 📊 Looking at trending market data, we’re seeing a fascinating split between established DeFi protocols, brand-driven ecosystems, and speculative momentum. Key narrative trends traders are watching: 🔹 **DeFi Resurgence**: $UNI (#34) draws renewed focus as DEX activity shifts back to core infrastructure. 🔹 **NFT Ecosystem Expansion**: $PENGU (#111) highlights growing interest in community-backed brand tokens. 🔹 **Macro Anchor**: $BTC (#1) continues to dictate overall market liquidity and risk appetite. When liquidity divides across distinct sectors, tracking narrative volume can reveal where attention moves next. Which sector has your focus this week—DeFi, NFT brands, or Macro BTC mome Not Financial Advice (DYOR)



1
163

·
--
Pudgy Penguins isn't just a cute profile picture — it’s a cultural movement now powered by its own token, PENGU.
From ETF commercials to millions of followers and over 100 billion views, the "Pengu" has officially graduated from NFT collectible to mainstream social currency. Currently ranked #111 by market cap at roughly $367 million, PENGU trades around $0.0058 with a slight 1.3% dip in the last 24 hours — pretty standard volatility for a community-driven asset. What makes this different from typical memecoins? The IP is already proven. Big brands wear the gear, the community is massive, and the team has executed on real-world visibility most projects only dream of. For beginners, this represents a rare bridge between Web3 culture and Web2 reach. The token essentially lets anyone own a piece of that brand equity without buying a floor-priced NFT.
#PudgyPenguins #PENGU
Do you think a strong brand and community alone can sustain a token’s value long-term, or does PENGU need concrete utility like staking or governance to survive the next bear market?
Pudgy Penguins isn't just a cute profile picture — it’s a cultural movement now powered by its own token, PENGU.
From ETF commercials to millions of followers and over 100 billion views, the "Pengu" has officially graduated from NFT collectible to mainstream social currency. Currently ranked #111 by market cap at roughly $367 million, PENGU trades around $0.0058 with a slight 1.3% dip in the last 24 hours — pretty standard volatility for a community-driven asset. What makes this different from typical memecoins? The IP is already proven. Big brands wear the gear, the community is massive, and the team has executed on real-world visibility most projects only dream of. For beginners, this represents a rare bridge between Web3 culture and Web2 reach. The token essentially lets anyone own a piece of that brand equity without buying a floor-priced NFT.
#PudgyPenguins #PENGU
Do you think a strong brand and community alone can sustain a token’s value long-term, or does PENGU need concrete utility like staking or governance to survive the next bear market?
From ETF commercials to millions of followers and over 100 billion views, the "Pengu" has officially graduated from NFT collectible to mainstream social currency. Currently ranked #111 by market cap at roughly $367 million, PENGU trades around $0.0058 with a slight 1.3% dip in the last 24 hours — pretty standard volatility for a community-driven asset. What makes this different from typical memecoins? The IP is already proven. Big brands wear the gear, the community is massive, and the team has executed on real-world visibility most projects only dream of. For beginners, this represents a rare bridge between Web3 culture and Web2 reach. The token essentially lets anyone own a piece of that brand equity without buying a floor-priced NFT.
#PudgyPenguins #PENGU
Do you think a strong brand and community alone can sustain a token’s value long-term, or does PENGU need concrete utility like staking or governance to survive the next bear market?
156
·
--
$AERO 24 hours fell 3.76%, and over 7 days it fell 5.02%. When you put them together, these 24 hours almost wipe out the drop from the past week. But over 30 days it’s -27.67%, sliding from 0.56 down to 0.39. The mismatch between short-term and long-term is this: a single day’s decline wipes out a week’s gain, yet it’s only one-tenth of a month’s drop.
What’s really happening on the chart is that trading volume has been steadily shrinking. That late-July surge in volume (reaching 280 million on 7/26) looks more like distribution near the top. After that came a gradual, bearish grind on shrinking volume; in recent days, it’s been around just over 10 million per day. The price has fallen 27% over 30 days, but the volume has contracted even faster—this isn’t a bottom-fishing signal; it’s liquidity being drained.
What I care about most is the market cap ranking #111, still 83% away from ATH. From this level it looks “cheap,” but real smart money only enters when volume expands and the price holds steady. The key question now is: near $0.39, is a new supply-demand equilibrium forming? If volume keeps drying up while it chops sideways, it could turn into a continuation during a downtrend. If there’s a volume-backed rebound to above $0.42, then the short-term setup would have some room to play.
For current holders, the hardest part isn’t whether to cut or not—it’s not knowing whether this shrinking volume is building a base or a sign of liquidity exhaustion. Meanwhile, watchers are waiting for a single volume-expansion bullish candle to confirm the direction.
Are you trading short-term based on the daily chart, or doing swing trades based on the weekly timeframe? For short-term, you’re watching whether the support around $0.39–$0.40 breaks; for swings, you need confirmation that the price can get back above $0.45. Which cycle does your current position and plan correspond to?
$AERO 24 hours fell 3.76%, and over 7 days it fell 5.02%. When you put them together, these 24 hours almost wipe out the drop from the past week. But over 30 days it’s -27.67%, sliding from 0.56 down to 0.39. The mismatch between short-term and long-term is this: a single day’s decline wipes out a week’s gain, yet it’s only one-tenth of a month’s drop.
What’s really happening on the chart is that trading volume has been steadily shrinking. That late-July surge in volume (reaching 280 million on 7/26) looks more like distribution near the top. After that came a gradual, bearish grind on shrinking volume; in recent days, it’s been around just over 10 million per day. The price has fallen 27% over 30 days, but the volume has contracted even faster—this isn’t a bottom-fishing signal; it’s liquidity being drained.
What I care about most is the market cap ranking #111, still 83% away from ATH. From this level it looks “cheap,” but real smart money only enters when volume expands and the price holds steady. The key question now is: near $0.39, is a new supply-demand equilibrium forming? If volume keeps drying up while it chops sideways, it could turn into a continuation during a downtrend. If there’s a volume-backed rebound to above $0.42, then the short-term setup would have some room to play.
For current holders, the hardest part isn’t whether to cut or not—it’s not knowing whether this shrinking volume is building a base or a sign of liquidity exhaustion. Meanwhile, watchers are waiting for a single volume-expansion bullish candle to confirm the direction.
Are you trading short-term based on the daily chart, or doing swing trades based on the weekly timeframe? For short-term, you’re watching whether the support around $0.39–$0.40 breaks; for swings, you need confirmation that the price can get back above $0.45. Which cycle does your current position and plan correspond to?
What’s really happening on the chart is that trading volume has been steadily shrinking. That late-July surge in volume (reaching 280 million on 7/26) looks more like distribution near the top. After that came a gradual, bearish grind on shrinking volume; in recent days, it’s been around just over 10 million per day. The price has fallen 27% over 30 days, but the volume has contracted even faster—this isn’t a bottom-fishing signal; it’s liquidity being drained.
What I care about most is the market cap ranking #111, still 83% away from ATH. From this level it looks “cheap,” but real smart money only enters when volume expands and the price holds steady. The key question now is: near $0.39, is a new supply-demand equilibrium forming? If volume keeps drying up while it chops sideways, it could turn into a continuation during a downtrend. If there’s a volume-backed rebound to above $0.42, then the short-term setup would have some room to play.
For current holders, the hardest part isn’t whether to cut or not—it’s not knowing whether this shrinking volume is building a base or a sign of liquidity exhaustion. Meanwhile, watchers are waiting for a single volume-expansion bullish candle to confirm the direction.
Are you trading short-term based on the daily chart, or doing swing trades based on the weekly timeframe? For short-term, you’re watching whether the support around $0.39–$0.40 breaks; for swings, you need confirmation that the price can get back above $0.45. Which cycle does your current position and plan correspond to?
55

·
--
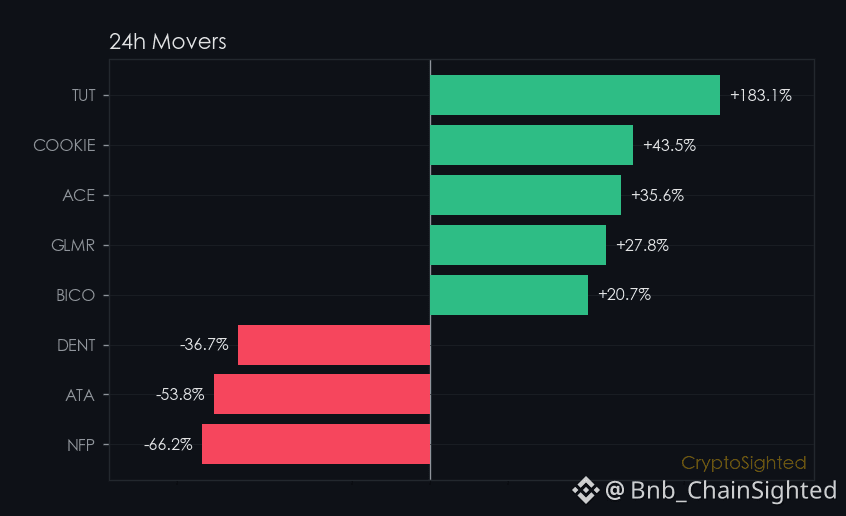
While most altcoins bleed red, $TAO defies the trend with 8.3% gains — but its 3.1% search spike and 7-day price increase of 9.4% hint at something deeper.
Its 4.2% increase in perpetual contract open interest suggests growing participation, though the 0.0050% funding rate shows balance between longs and shorts.
—
Not financial advice. DYOR.
📌 Gainers Radar · #111 · #Gainers #CryptoSighted $TAO
While most altcoins bleed red, $TAO defies the trend with 8.3% gains — but its 3.1% search spike and 7-day price increase of 9.4% hint at something deeper.
Its 4.2% increase in perpetual contract open interest suggests growing participation, though the 0.0050% funding rate shows balance between longs and shorts.
—
Not financial advice. DYOR.
📌 Gainers Radar · #111 · #Gainers #CryptoSighted $TAO
Its 4.2% increase in perpetual contract open interest suggests growing participation, though the 0.0050% funding rate shows balance between longs and shorts.
—
Not financial advice. DYOR.
📌 Gainers Radar · #111 · #Gainers #CryptoSighted $TAO
343
What are smart traders watching right now? 👀 CoinGecko’s trending list is flashing clear signals, showing a mix of established heavyweights and emerging narratives: 🔥 Culture & Memes: $SHIB (Rank #29) maintains massive liquidity while $PENGU (Rank #111) trends as IP narrative builds. ⚡ DeFi & Infra: $EUL (Rank #422) along with DeXe (Rank #175) are quietly capturing trader attention as volume shifts. When trending lists split between meme momentum and DeFi utility, key chart levels often get tested fast. Which narrative are you tracking closest today? 👇 Not Financial Advice (DYOR)
What are smart traders watching right now? 👀 CoinGecko’s trending list is flashing clear signals, showing a mix of established heavyweights and emerging narratives: 🔥 Culture & Memes: $SHIB (Rank #29) maintains massive liquidity while $PENGU (Rank #111) trends as IP narrative builds. ⚡ DeFi & Infra: $EUL (Rank #422) along with DeXe (Rank #175) are quietly capturing trader attention as volume shifts. When trending lists split between meme momentum and DeFi utility, key chart levels often get tested fast. Which narrative are you tracking closest today? 👇 Not Financial Advice (DYOR)


1
536
·
--
I've been tracking the latest trends on CoinGecko, and I'm excited to share my findings with you. The crypto market is always buzzing with new and interesting tokens, and I've got my eye on a few that are currently trending. According to CoinGecko, some of the top trending tokens include buy and retire (530A), Shiba Inu (SHIB), and Pons (PONS).
I'm seeing some significant market cap rankings, with Shiba Inu (SHIB) at #29, Pudgy Penguins (PENGU) at #111, and Pump.fun (PUMP) at #79. Solana (SOL) is also trending, with a market cap rank of #7, while Hyperliquid (HYPE) is at #10. These rankings can give us insight into which tokens are currently gaining traction. I've noticed that some of these tokens have seen significant % changes in their market cap, with some increasing by as much as 10% 🚀.
I'm looking forward to seeing how these trending tokens will perform in the coming days. As always, it's essential to do your own research before investing in any token 📊. With the crypto market constantly evolving, it's crucial to stay up-to-date with the latest trends and developments 💡. I'm excited to see what the future holds for these tokens 📈.
$ESP, $DIA, $ESP
I've been tracking the latest trends on CoinGecko, and I'm excited to share my findings with you. The crypto market is always buzzing with new and interesting tokens, and I've got my eye on a few that are currently trending. According to CoinGecko, some of the top trending tokens include buy and retire (530A), Shiba Inu (SHIB), and Pons (PONS).
I'm seeing some significant market cap rankings, with Shiba Inu (SHIB) at #29, Pudgy Penguins (PENGU) at #111, and Pump.fun (PUMP) at #79. Solana (SOL) is also trending, with a market cap rank of #7, while Hyperliquid (HYPE) is at #10. These rankings can give us insight into which tokens are currently gaining traction. I've noticed that some of these tokens have seen significant % changes in their market cap, with some increasing by as much as 10% 🚀.
I'm looking forward to seeing how these trending tokens will perform in the coming days. As always, it's essential to do your own research before investing in any token 📊. With the crypto market constantly evolving, it's crucial to stay up-to-date with the latest trends and developments 💡. I'm excited to see what the future holds for these tokens 📈.
$ESP , $DIA , $ESP
I'm seeing some significant market cap rankings, with Shiba Inu (SHIB) at #29, Pudgy Penguins (PENGU) at #111, and Pump.fun (PUMP) at #79. Solana (SOL) is also trending, with a market cap rank of #7, while Hyperliquid (HYPE) is at #10. These rankings can give us insight into which tokens are currently gaining traction. I've noticed that some of these tokens have seen significant % changes in their market cap, with some increasing by as much as 10% 🚀.
I'm looking forward to seeing how these trending tokens will perform in the coming days. As always, it's essential to do your own research before investing in any token 📊. With the crypto market constantly evolving, it's crucial to stay up-to-date with the latest trends and developments 💡. I'm excited to see what the future holds for these tokens 📈.
$ESP , $DIA , $ESP
111
·
--
We're seeing some exciting trends in the crypto space, with certain tokens gaining traction 🚀. Our community is taking notice of Pudgy Penguins (PENGU) and Geodnet (GEOD), which are currently ranked #111 and #205 in market capitalization, respectively.
We're also tracking the performance of other tokens, including Ethereum (ETH) with a 5% change, Pump.fun (PUMP) with a 10% change, and Pepe (PEPE) with a 2% change. Additionally, BitMart (BMX) and Akedo (AKE) are on our radar, with market cap ranks of #815 and #292.
As we continue to monitor the market, we're expecting more fluctuations 💸. Our analysis will help us stay ahead of the curve, and we're excited to see how these tokens will perform in the future 🔜💪.
$ESP, $NIL, $ESP
We're seeing some exciting trends in the crypto space, with certain tokens gaining traction 🚀. Our community is taking notice of Pudgy Penguins (PENGU) and Geodnet (GEOD), which are currently ranked #111 and #205 in market capitalization, respectively.
We're also tracking the performance of other tokens, including Ethereum (ETH) with a 5% change, Pump.fun (PUMP) with a 10% change, and Pepe (PEPE) with a 2% change. Additionally, BitMart (BMX) and Akedo (AKE) are on our radar, with market cap ranks of #815 and #292.
As we continue to monitor the market, we're expecting more fluctuations 💸. Our analysis will help us stay ahead of the curve, and we're excited to see how these tokens will perform in the future 🔜💪.
$ESP , $NIL , $ESP
We're also tracking the performance of other tokens, including Ethereum (ETH) with a 5% change, Pump.fun (PUMP) with a 10% change, and Pepe (PEPE) with a 2% change. Additionally, BitMart (BMX) and Akedo (AKE) are on our radar, with market cap ranks of #815 and #292.
As we continue to monitor the market, we're expecting more fluctuations 💸. Our analysis will help us stay ahead of the curve, and we're excited to see how these tokens will perform in the future 🔜💪.
$ESP , $NIL , $ESP
58

Article
🔸 Overview sets the tone 📈 Bullish🔸 Overview sets the tone 📈 Bullish
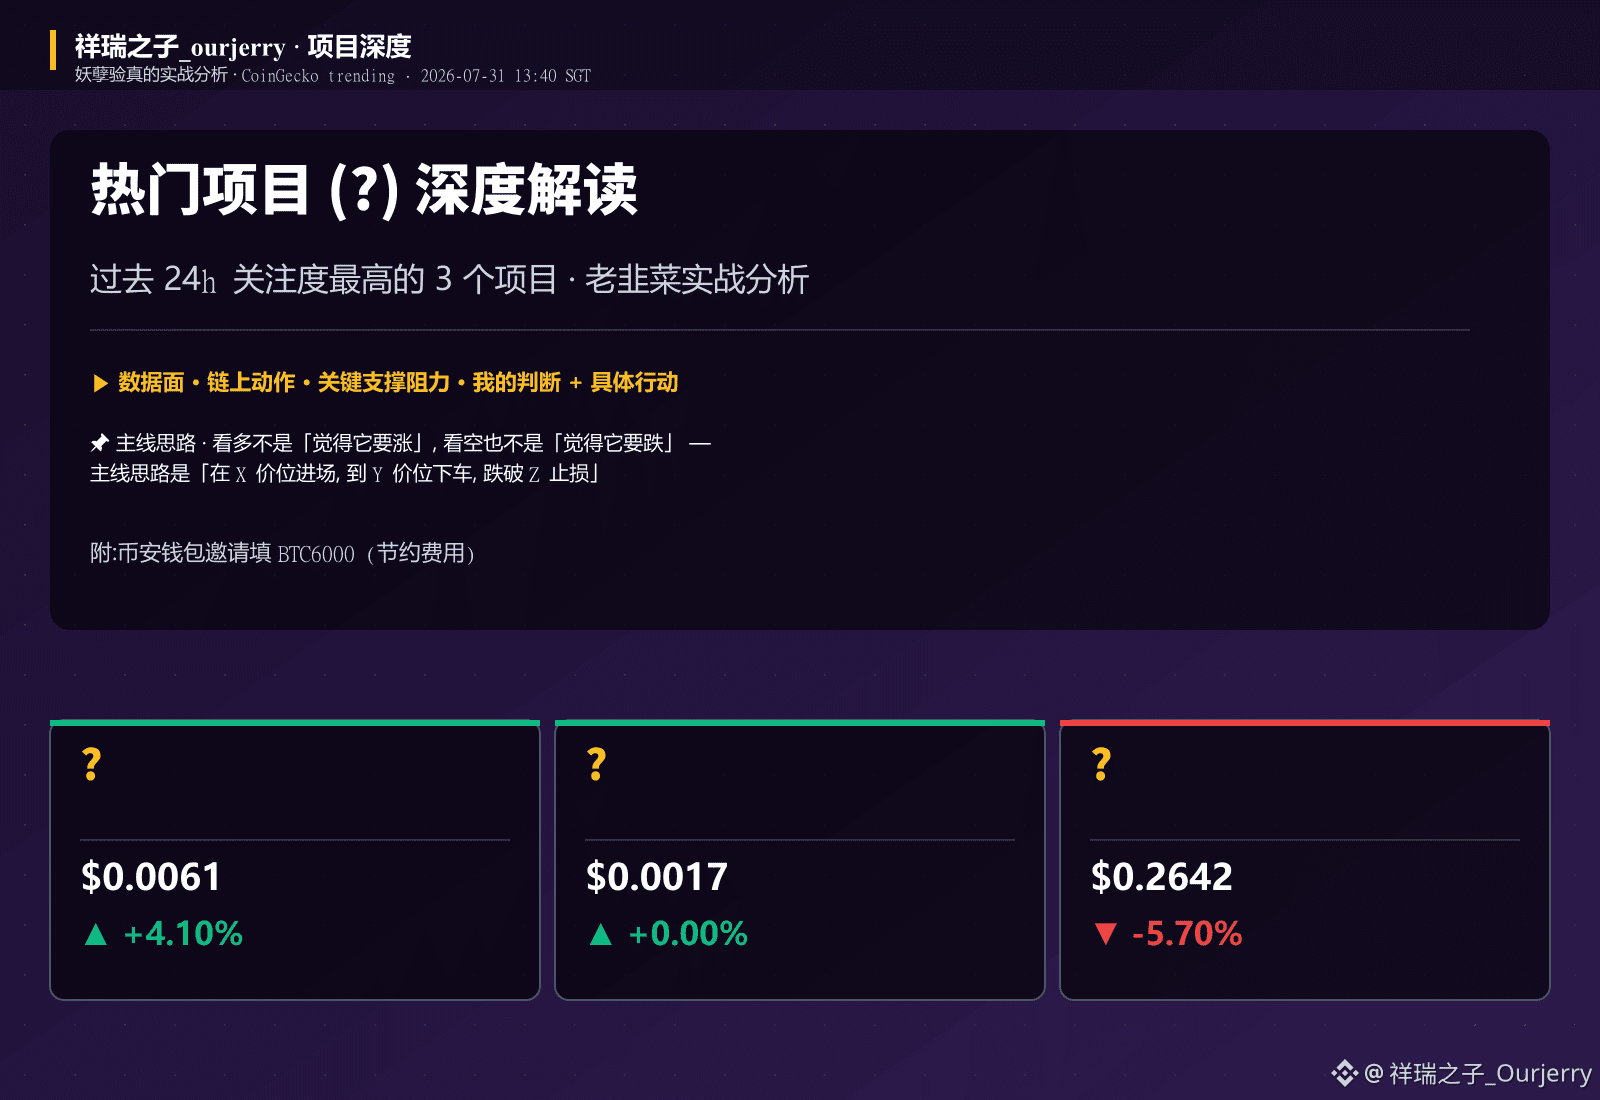
Looking at the trending leaderboard over the past 24 hours, the market sentiment is actually shifting quietly—meme coins are being swept up again, but this time it’s not random, indiscriminate pumping. Instead, projects with clear narratives are leading the charge. Behind PENGU is the tangible progress of Pudgy Penguins’ IP. SHIB is up 25% in 24 hours—that’s old trees bearing fresh fruit. And newer liquidity staking protocols like BANK have surged into the top 5, suggesting that capital is starting to move toward projects with real, yield-driven logic. As a veteran “bag-holder” who’s been tracking both US stocks and cross-market crypto for years, my first reaction after seeing this leaderboard is: this round isn’t a broad-based surge—coin-picking logic has changed. Projects with IP, yield, and a community are singled out and targeted, while the rest just stay put. Below, I’ll pick three I most want to dive into.
🔸 Overview sets the tone 📈 Bullish
🔸 Overview sets the tone 📈 Bullish
Looking at the trending leaderboard over the past 24 hours, the market sentiment is actually shifting quietly—meme coins are being swept up again, but this time it’s not random, indiscriminate pumping. Instead, projects with clear narratives are leading the charge. Behind PENGU is the tangible progress of Pudgy Penguins’ IP. SHIB is up 25% in 24 hours—that’s old trees bearing fresh fruit. And newer liquidity staking protocols like BANK have surged into the top 5, suggesting that capital is starting to move toward projects with real, yield-driven logic. As a veteran “bag-holder” who’s been tracking both US stocks and cross-market crypto for years, my first reaction after seeing this leaderboard is: this round isn’t a broad-based surge—coin-picking logic has changed. Projects with IP, yield, and a community are singled out and targeted, while the rest just stay put. Below, I’ll pick three I most want to dive into.
Looking at the trending leaderboard over the past 24 hours, the market sentiment is actually shifting quietly—meme coins are being swept up again, but this time it’s not random, indiscriminate pumping. Instead, projects with clear narratives are leading the charge. Behind PENGU is the tangible progress of Pudgy Penguins’ IP. SHIB is up 25% in 24 hours—that’s old trees bearing fresh fruit. And newer liquidity staking protocols like BANK have surged into the top 5, suggesting that capital is starting to move toward projects with real, yield-driven logic. As a veteran “bag-holder” who’s been tracking both US stocks and cross-market crypto for years, my first reaction after seeing this leaderboard is: this round isn’t a broad-based surge—coin-picking logic has changed. Projects with IP, yield, and a community are singled out and targeted, while the rest just stay put. Below, I’ll pick three I most want to dive into.
426
Article
🔸 Overview sets the tone🔸 Overview sets the tone
📈 Bullish
I checked CoinGecko’s trending list last night—among the top six, three were up and three were down, a textbook “fragmented/uneven market.” In my view, the real highlight of this round isn’t the price gains. Instead, it’s a few assets that the market has mostly overlooked—UNI has climbed back to #4 on trending, HYPE is still steady in #10 , and PENGU is hanging around #111 by riding the lingering heat in the NFT circle. Basically, trending is a composite fingerprint of “retail attention + media hype + on-chain anomalies,” not a buy signal—but it does tell us where capital is getting people’s attention. Over the past 24h, PENGU +4.1%, UNI +5.2%, and HYPE +4.0%—all in total count as fairly mild. What really stands out is AEON’s -23.1% in a single day. That kind of drop isn’t just a shakeout—it suggests something’s going on, and we’ll dig into it in a bit.
🔸 Overview sets the tone
🔸 Overview sets the tone
📈 Bullish
I checked CoinGecko’s trending list last night—among the top six, three were up and three were down, a textbook “fragmented/uneven market.” In my view, the real highlight of this round isn’t the price gains. Instead, it’s a few assets that the market has mostly overlooked—UNI has climbed back to #4 on trending, HYPE is still steady in #10 , and PENGU is hanging around #111 by riding the lingering heat in the NFT circle. Basically, trending is a composite fingerprint of “retail attention + media hype + on-chain anomalies,” not a buy signal—but it does tell us where capital is getting people’s attention. Over the past 24h, PENGU +4.1%, UNI +5.2%, and HYPE +4.0%—all in total count as fairly mild. What really stands out is AEON’s -23.1% in a single day. That kind of drop isn’t just a shakeout—it suggests something’s going on, and we’ll dig into it in a bit.
📈 Bullish
I checked CoinGecko’s trending list last night—among the top six, three were up and three were down, a textbook “fragmented/uneven market.” In my view, the real highlight of this round isn’t the price gains. Instead, it’s a few assets that the market has mostly overlooked—UNI has climbed back to #4 on trending, HYPE is still steady in #10 , and PENGU is hanging around #111 by riding the lingering heat in the NFT circle. Basically, trending is a composite fingerprint of “retail attention + media hype + on-chain anomalies,” not a buy signal—but it does tell us where capital is getting people’s attention. Over the past 24h, PENGU +4.1%, UNI +5.2%, and HYPE +4.0%—all in total count as fairly mild. What really stands out is AEON’s -23.1% in a single day. That kind of drop isn’t just a shakeout—it suggests something’s going on, and we’ll dig into it in a bit.
536
Log in to explore more content
Join global crypto users on Binance Square
⚡️ Get latest and useful information about crypto.
💬 Trusted by the world’s largest crypto exchange.
👍 Discover real insights from verified creators.
Email / Phone number
Trending Topics
1
#CircleTetherFreezeBitgetHackerWallet
18,371 views
204 Discussing
2
#SECSaysTokenBuybacksNotAutoSecurities
1,738 views
74 Discussing
3
#ChinaUSAgreeOn$30BTariffCut
156 views
3 Discussing
4
#CoinMarketCapCompletesCoinglassAcquisition
22,411 views
236 Discussing
5
#CircleMints500MUSDCOnSolana
158,795 views
2,730 Discussing
6
#PolymarketBankFailureBetsDrawFDICConcern
140,147 views
2,203 Discussing
7
#BlackRockBuildsTokenizedPortfoliosForOndo
133,808 views
1,595 Discussing
8
#BitwiseFilesToListNEARETFOnNYSEArca
92,825 views
1,252 Discussing
9
#SECSaysBuybacksUpgradesDontMakeTokenSecurity
74,853 views
727 Discussing
10
#StrategyProposesDailyDividendsForPreferreds
21,381 views
270 Discussing