

CryptoTradeMask
9.8k ပို့စ်များ

CryptoTradeMask
တိုင်ကြားမည်
သုံးစွဲသူကို ဘလော့မည်
Cryptocurrency market news, financial reviews, courses and training, all about cryptocurrencies and blockchain | 📊Technical analyses, Trading Strategy | 🦈
Open Trade
High-Frequency Trader
8.3 Years
233 ဖော်လိုလုပ်ထားသည်
1.8K+ ဖော်လိုလုပ်သူများ
12.2K+ လိုက်ခ်လုပ်ထားသည်
ပို့စ်များ
ပိုင်ဆိုင်မှုစာရင်း
အားလုံး
Quotes
ဗီဒီယိုများ
ပုံသေထားသည်
Article
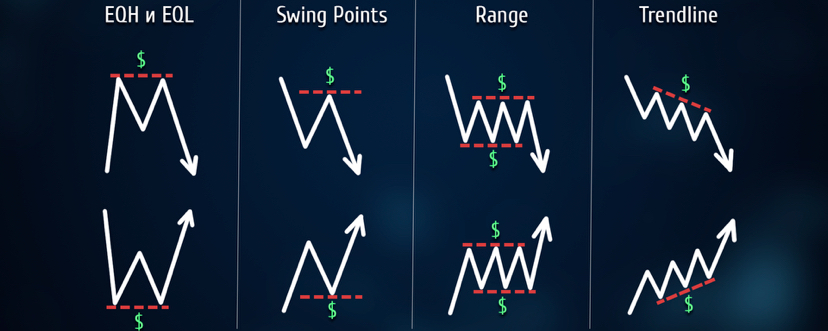
«Про що мовчать графіки? Таємна мова осциляторів, ліквідність та Smart Money»Це детальний посібник із просунутих інструментів та механіки ринку. Якщо ви вже переросли базовий технічний аналіз (на кшталт звичайних ліній тренду чи простих ковзних середніх), ці чотири блоки допоможуть вам зазирнути за лаштунки цінового графіка та зрозуміти, чому насправді рухається ціна.
{future}(BTCUSDT)
Тема №1: Дивергенція — таємна мова осциляторів
Дивергенція (розбіжність) — це явище, коли напрямок руху ціни на графіку не збігається з напрямком руху технічного індикатора (осцилятора, як-от [RSI](https://app.binance.com/uni-qr/cpos/34003602691465?r=ho8lubrb&l=uk-ua&uco=5vkgl9tq36cfnvkodfwkkw&uc=app_square_share_link&us=copylink) або [MACD](https://app.binance.com/uni-qr/cart/34003282689417?r=ho8lubrb&l=uk-ua&uco=5vkgl9tq36cfnvkodfwkkw&uc=app_square_share_link&us=copylink)). Це головний випереджальний сигнал, який показує, що поточний тренд втрачає силу ("видихається"), і невдовзі можливий розворот або глибока корекція.
Для пошуку дивергенцій ми порівнюємо максимуми (Highs) та мінімуми (Lows) ціни з відповідними екстремумами на індикаторах.
1. Класична дивергенція (Сигнал розвороту тренду)
Вона з'являється наприкінці сильного руху і попереджає, що великі гравці починають фіксувати позиції або розвертати ринок.
Бичача класична дивергенція: Ціна оновлює мінімуми й падає нижче (Lower Low), але індикатор (наприклад, лінія RSI) малює вищий мінімум (Higher Low). Це означає, що попри падіння ціни, сила продавців вичерпана, і назріває ріст.
Ведмежа класична дивергенція: Ціна оновлює максимуми й росте (Higher High), а індикатор показує нижчий максимум (Lower High). Покупці штовхають ціну вгору за інерцією, але реального імпульсу для росту вже немає — попереду падіння.
2. Прихована дивергенція (Сигнал продовження тренду)
Багато трейдерів її ігнорують, хоча вона є надзвичайно точною. Вона шукається виключно всередині існуючого тренду під час локальних відкатів (корекцій).
Бичача прихована дивергенція: На висхідному тренді ціна робить вищий мінімум (Higher Low), а індикатор у цей же час опускається нижче (Lower Low). Це сигнал того, що ринок "розвантажив" індикатор, накопичив сили, і висхідний тренд продовжиться.
Ведмежа прихована дивергенція: На низхідному тренді ціна робить нижчий максимум (Lower High), а індикатор підіймається вище (Higher High). Це показує, що локальний відскік ціни вгору був штучним, і падіння триватиме.
❗️ Як застосовувати: Не відкривайте угоду лише тому, що побачили дивергенцію. Використовуйте її як попередження. Вхід в угоду краще шукати, коли дивергенція підтверджується свічковим патерном або зламом структури на меншому таймфреймі.❗️
{future}(BNBUSDT)
Тема №2: Об'єми ринку — горизонтальний об'єм проти вертикального
Більшість новачків дивляться на вертикальний об'єм (стовпчики внизу графіка). Вони показують лише коли (в яку хвилину чи годину) відбулися торги. Проте для професійного розуміння набагато важливіший горизонтальний об'єм (Volume Profile / VRVP). Він показує, за якою саме ціною було проторговано найбільше контрактів чи монет.
Що таке POC (Point of Control)?
POC (Точка контролю) — це найдовша лінія на гістограмі горизонтального об'єму всередині обраного діапазону. Це рівень ціни, де було укладено найбільшу кількість угод (купівлі та продажу) за певний проміжок часу.
POC — це "справедлива вартість" активу на думку ринку. Тут накопичено найбільше грошей.
Як використовувати горизонтальний об'єм на практиці?
1 Магніт для ціни:
Якщо ціна швидко летить вгору або вниз, вона майже завжди буде прагнути повернутися до свого POC, щоб протестувати зону максимального інтересу гравців.
2 Залізобетонна підтримка та опір:
Якщо ціна знаходиться вище великого горизонтального об'єму і починає падати, цей об'єм виступить як потужна зона підтримки. Великі гравці захищатимуть свої позиції, відкриті на цьому рівні.
Якщо ціна знаходиться нижче об'єму і росте вгору, цей об'єм стане сильним зоною опору, подолати яку без нових великих грошей неможливо.
3 Торгівля "порожнечі":
Зони, де горизонтального об'єму майже немає (тонкі ділянки профілю), ціна зазвичай пролітає дуже швидко, бо там немає ордерів, які могли б її зупинити.
{future}(XRPUSDT)
Тема №3: [Анатомія ліквідності](https://app.binance.com/uni-qr/cart/296804838053729?r=ho8lubrb&l=uk-ua&uco=5vkgl9tq36cfnvkodfwkkw&uc=app_square_share_link&us=copylink) — де ховаються "крупні гравці"
Найголовніше правило ринку: щоб хтось купив великий об'єм активу, хтось інший повинен йомуцей об'єм продати.
Якщо інституційний інвестор (фонд або маркетмейкер) захоче купити Bitcoin на $50 мільйонів за поточною ціною, він просто "задере" графік у космос і купить за невигідною ціною. Йому потрібна ліквідність — велике скупчення зустрічних ордерів.
Де ховаються пули ліквідності?
Пули ліквідності — це зони, де роздрібні трейдери масово виставляють свої обмеження збитків [(Stop-Loss ордери)](https://app.binance.com/uni-qr/cart/305346012259793?r=ho8lubrb&l=uk-ua&uco=5vkgl9tq36cfnvkodfwkkw&uc=app_square_share_link&us=copylink).
Стоп-лосси покупців (тих, хто грає в лонг) — це ордери на продаж. Вони ховаються під локальними мінімумами (Lows).
Стоп-лосси продавців (тих, хто грає в шорт) — це ордери на купівлю. Вони ховаються над локальними максимумами (Highs).
Чому ціна рухається від одного пулу до іншого?
Великі гравці бачать ці зони. Щоб набрати свою позицію в лонг, маркетмейкеру потрібно штучно штовхнути ціну вниз — туди, де стоять стоп-лосси звичайних трейдерів. Коли стоп-лосси покупців спрацьовують, вони перетворюються на масові ринкові продажі. Маркетмейкер радо викуповує ці продажі за низькою ціною.
Це називається зняттям ліквідності (Liquidity Sweep) або "вибиванням стопів". Саме тому ринок часто рухається зигзагами: зняли ліквідність зверху (забрали гроші шортистів) -> розвернулися -> пішли знімати ліквідність знизу (забрали гроші лонгістів).
Тема №4: Концепція Smart Money (Розумні гроші)
Концепція [Smart Money (SMC)](https://app.binance.com/uni-qr/cart/34906072854242?r=ho8lubrb&l=uk-ua&uco=5vkgl9tq36cfnvkodfwkkw&uc=app_square_share_link&us=copylink) — це спроба аналізувати графік з позиції логіки великого капіталу, а не класичних фігур теханалізу (накшталт "трикутників" чи "голови та плечей", які часто створюються саме для того, щоб заманити натовп у пастку).
Давайте розберемо три базові кити SMC простою мовою:
1.[MSB](https://app.binance.com/uni-qr/cart/297505669785201?r=ho8lubrb&l=uk-ua&uco=5vkgl9tq36cfnvkodfwkkw&uc=app_square_share_link&us=copylink) ([Market Structure Break](https://app.binance.com/uni-qr/cart/297505669785201?r=ho8lubrb&l=uk-ua&uco=5vkgl9tq36cfnvkodfwkkw&uc=app_square_share_link&us=copylink) — Злам структури ринку)
Коли ринок росте, він рухається сходинками вгору: кожен наступний пік вищий за попередній, кожен мінімум теж вищий.
[MSB](https://app.binance.com/uni-qr/cart/297505669785201?r=ho8lubrb&l=uk-ua&uco=5vkgl9tq36cfnvkodfwkkw&uc=app_square_share_link&us=copylink)— це момент, коли ціна замість чергового росту раптом пробиває свій останній (найнижчий) локальний мінімум і закріплюється нижче нього. Це сигнал, що висхідний тренд зламано, ініціативу перехопили ведмеді, і тепер пріоритет — шукати угоди на продаж (шорт).
2.[Order Block](https://app.binance.com/uni-qr/cart/35065149580346?r=ho8lubrb&l=uk-ua&uco=5vkgl9tq36cfnvkodfwkkw&uc=app_square_share_link&us=copylink) (Ордерблок)
Це остання свічка перед сильним, імпульсним рухом, який оновив максимум або мінімум ринку.
Чому це важливо: У цій свічці великий гравець вливав свої гроші, щоб штовхнути ринок. Оскільки його об'єм занадто великий, частина його ордерів залишилася не заповненою (лімітки в "режимі очікування").
Як використовувати: Коли ціна з часом повертається назад до цієї свічки ([Order Block](https://app.binance.com/uni-qr/cart/35065149580346?r=ho8lubrb&l=uk-ua&uco=5vkgl9tq36cfnvkodfwkkw&uc=app_square_share_link&us=copylink)), вона активує залишені ордери великого гравця і майже завжди отримує сильний відскік у протилежний бік.
3. Imbalance ([Імбаланс / Дисбаланс ціни або FVG](https://app.binance.com/uni-qr/cart/35073398985841?r=ho8lubrb&l=uk-ua&uco=5vkgl9tq36cfnvkodfwkkw&uc=app_square_share_link&us=copylink))
Це трисвічкова формація, де між тінню першої свічки та тінню третьої свічки залишається порожній простір (діра), заповнений лише тілом другої, імпульсної свічки.
Це зона, де ринок рухався занадто швидко через агресивні покупки чи продажі. У цій зоні не було справедливого розподілу між покупцями та продавцями. Ринок не любить хаосу, тому Імбаланс працює як магніт: ціна прагне повернутися і перекрити цю порожнечу (мінімум на 50%), щоб "вирівняти" баланс ордерів, і лише потім продовжити свій рух.
⚠️ Головний висновок: Поєднавши ці інструменти, ви отримуєте чітку логіку. Ви шукаєте класичну дивергенцію на [RSI](https://app.binance.com/uni-qr/cpos/34003602691465?r=ho8lubrb&l=uk-ua&uco=5vkgl9tq36cfnvkodfwkkw&uc=app_square_share_link&us=copylink), чекаєте на злам структури ([MSB](https://app.binance.com/uni-qr/cart/297505669785201?r=ho8lubrb&l=uk-ua&uco=5vkgl9tq36cfnvkodfwkkw&uc=app_square_share_link&us=copylink)), знаходите на графіку Імбаланс та Ордерблок, який збігається з рівнем POC на горизонтальному об'ємі, і відкриваєте філігранну угоду разом із "розумними грошима", а не проти них.
[Еволюція аналізу: Топ-індикатори для криптотрейдингу в 2026 році](https://app.binance.com/uni-qr/cart/299421250666289?r=ho8lubrb&l=uk-ua&uco=5vkgl9tq36cfnvkodfwkkw&uc=app_square_share_link&us=copylink)
«Про що мовчать графіки? Таємна мова осциляторів, ліквідність та Smart Money»
Це детальний посібник із просунутих інструментів та механіки ринку. Якщо ви вже переросли базовий технічний аналіз (на кшталт звичайних ліній тренду чи простих ковзних середніх), ці чотири блоки допоможуть вам зазирнути за лаштунки цінового графіка та зрозуміти, чому насправді рухається ціна.
Тема №1: Дивергенція — таємна мова осциляторів
Дивергенція (розбіжність) — це явище, коли напрямок руху ціни на графіку не збігається з напрямком руху технічного індикатора (осцилятора, як-от RSI або MACD). Це головний випереджальний сигнал, який показує, що поточний тренд втрачає силу ("видихається"), і невдовзі можливий розворот або глибока корекція.
Для пошуку дивергенцій ми порівнюємо максимуми (Highs) та мінімуми (Lows) ціни з відповідними екстремумами на індикаторах.
1. Класична дивергенція (Сигнал розвороту тренду)
Вона з'являється наприкінці сильного руху і попереджає, що великі гравці починають фіксувати позиції або розвертати ринок.
Бичача класична дивергенція: Ціна оновлює мінімуми й падає нижче (Lower Low), але індикатор (наприклад, лінія RSI) малює вищий мінімум (Higher Low). Це означає, що попри падіння ціни, сила продавців вичерпана, і назріває ріст.
Ведмежа класична дивергенція: Ціна оновлює максимуми й росте (Higher High), а індикатор показує нижчий максимум (Lower High). Покупці штовхають ціну вгору за інерцією, але реального імпульсу для росту вже немає — попереду падіння.
2. Прихована дивергенція (Сигнал продовження тренду)
Багато трейдерів її ігнорують, хоча вона є надзвичайно точною. Вона шукається виключно всередині існуючого тренду під час локальних відкатів (корекцій).
Бичача прихована дивергенція: На висхідному тренді ціна робить вищий мінімум (Higher Low), а індикатор у цей же час опускається нижче (Lower Low). Це сигнал того, що ринок "розвантажив" індикатор, накопичив сили, і висхідний тренд продовжиться.
Ведмежа прихована дивергенція: На низхідному тренді ціна робить нижчий максимум (Lower High), а індикатор підіймається вище (Higher High). Це показує, що локальний відскік ціни вгору був штучним, і падіння триватиме.
❗️ Як застосовувати: Не відкривайте угоду лише тому, що побачили дивергенцію. Використовуйте її як попередження. Вхід в угоду краще шукати, коли дивергенція підтверджується свічковим патерном або зламом структури на меншому таймфреймі.❗️
Тема №2: Об'єми ринку — горизонтальний об'єм проти вертикального
Більшість новачків дивляться на вертикальний об'єм (стовпчики внизу графіка). Вони показують лише коли (в яку хвилину чи годину) відбулися торги. Проте для професійного розуміння набагато важливіший горизонтальний об'єм (Volume Profile / VRVP). Він показує, за якою саме ціною було проторговано найбільше контрактів чи монет.
Що таке POC (Point of Control)?
POC (Точка контролю) — це найдовша лінія на гістограмі горизонтального об'єму всередині обраного діапазону. Це рівень ціни, де було укладено найбільшу кількість угод (купівлі та продажу) за певний проміжок часу.
POC — це "справедлива вартість" активу на думку ринку. Тут накопичено найбільше грошей.
Як використовувати горизонтальний об'єм на практиці?
1 Магніт для ціни:
Якщо ціна швидко летить вгору або вниз, вона майже завжди буде прагнути повернутися до свого POC, щоб протестувати зону максимального інтересу гравців.
2 Залізобетонна підтримка та опір:
Якщо ціна знаходиться вище великого горизонтального об'єму і починає падати, цей об'єм виступить як потужна зона підтримки. Великі гравці захищатимуть свої позиції, відкриті на цьому рівні.
Якщо ціна знаходиться нижче об'єму і росте вгору, цей об'єм стане сильним зоною опору, подолати яку без нових великих грошей неможливо.
3 Торгівля "порожнечі":
Зони, де горизонтального об'єму майже немає (тонкі ділянки профілю), ціна зазвичай пролітає дуже швидко, бо там немає ордерів, які могли б її зупинити.
Тема №3: Анатомія ліквідності — де ховаються "крупні гравці"
Найголовніше правило ринку: щоб хтось купив великий об'єм активу, хтось інший повинен йомуцей об'єм продати.
Якщо інституційний інвестор (фонд або маркетмейкер) захоче купити Bitcoin на $50 мільйонів за поточною ціною, він просто "задере" графік у космос і купить за невигідною ціною. Йому потрібна ліквідність — велике скупчення зустрічних ордерів.
Де ховаються пули ліквідності?
Пули ліквідності — це зони, де роздрібні трейдери масово виставляють свої обмеження збитків (Stop-Loss ордери).
Стоп-лосси покупців (тих, хто грає в лонг) — це ордери на продаж. Вони ховаються під локальними мінімумами (Lows).
Стоп-лосси продавців (тих, хто грає в шорт) — це ордери на купівлю. Вони ховаються над локальними максимумами (Highs).
Чому ціна рухається від одного пулу до іншого?
Великі гравці бачать ці зони. Щоб набрати свою позицію в лонг, маркетмейкеру потрібно штучно штовхнути ціну вниз — туди, де стоять стоп-лосси звичайних трейдерів. Коли стоп-лосси покупців спрацьовують, вони перетворюються на масові ринкові продажі. Маркетмейкер радо викуповує ці продажі за низькою ціною.
Це називається зняттям ліквідності (Liquidity Sweep) або "вибиванням стопів". Саме тому ринок часто рухається зигзагами: зняли ліквідність зверху (забрали гроші шортистів) -> розвернулися -> пішли знімати ліквідність знизу (забрали гроші лонгістів).
Тема №4: Концепція Smart Money (Розумні гроші)
Концепція Smart Money (SMC) — це спроба аналізувати графік з позиції логіки великого капіталу, а не класичних фігур теханалізу (накшталт "трикутників" чи "голови та плечей", які часто створюються саме для того, щоб заманити натовп у пастку).
Давайте розберемо три базові кити SMC простою мовою:
1.MSB (Market Structure Break — Злам структури ринку)
Коли ринок росте, він рухається сходинками вгору: кожен наступний пік вищий за попередній, кожен мінімум теж вищий.
MSB— це момент, коли ціна замість чергового росту раптом пробиває свій останній (найнижчий) локальний мінімум і закріплюється нижче нього. Це сигнал, що висхідний тренд зламано, ініціативу перехопили ведмеді, і тепер пріоритет — шукати угоди на продаж (шорт).
2.Order Block (Ордерблок)
Це остання свічка перед сильним, імпульсним рухом, який оновив максимум або мінімум ринку.
Чому це важливо: У цій свічці великий гравець вливав свої гроші, щоб штовхнути ринок. Оскільки його об'єм занадто великий, частина його ордерів залишилася не заповненою (лімітки в "режимі очікування").
Як використовувати: Коли ціна з часом повертається назад до цієї свічки (Order Block), вона активує залишені ордери великого гравця і майже завжди отримує сильний відскік у протилежний бік.
3. Imbalance (Імбаланс / Дисбаланс ціни або FVG)
Це трисвічкова формація, де між тінню першої свічки та тінню третьої свічки залишається порожній простір (діра), заповнений лише тілом другої, імпульсної свічки.
Це зона, де ринок рухався занадто швидко через агресивні покупки чи продажі. У цій зоні не було справедливого розподілу між покупцями та продавцями. Ринок не любить хаосу, тому Імбаланс працює як магніт: ціна прагне повернутися і перекрити цю порожнечу (мінімум на 50%), щоб "вирівняти" баланс ордерів, і лише потім продовжити свій рух.
⚠️ Головний висновок: Поєднавши ці інструменти, ви отримуєте чітку логіку. Ви шукаєте класичну дивергенцію на RSI, чекаєте на злам структури (MSB), знаходите на графіку Імбаланс та Ордерблок, який збігається з рівнем POC на горизонтальному об'ємі, і відкриваєте філігранну угоду разом із "розумними грошима", а не проти них.
Еволюція аналізу: Топ-індикатори для криптотрейдингу в 2026 році
Тема №1: Дивергенція — таємна мова осциляторів
Дивергенція (розбіжність) — це явище, коли напрямок руху ціни на графіку не збігається з напрямком руху технічного індикатора (осцилятора, як-от RSI або MACD). Це головний випереджальний сигнал, який показує, що поточний тренд втрачає силу ("видихається"), і невдовзі можливий розворот або глибока корекція.
Для пошуку дивергенцій ми порівнюємо максимуми (Highs) та мінімуми (Lows) ціни з відповідними екстремумами на індикаторах.
1. Класична дивергенція (Сигнал розвороту тренду)
Вона з'являється наприкінці сильного руху і попереджає, що великі гравці починають фіксувати позиції або розвертати ринок.
Бичача класична дивергенція: Ціна оновлює мінімуми й падає нижче (Lower Low), але індикатор (наприклад, лінія RSI) малює вищий мінімум (Higher Low). Це означає, що попри падіння ціни, сила продавців вичерпана, і назріває ріст.
Ведмежа класична дивергенція: Ціна оновлює максимуми й росте (Higher High), а індикатор показує нижчий максимум (Lower High). Покупці штовхають ціну вгору за інерцією, але реального імпульсу для росту вже немає — попереду падіння.
2. Прихована дивергенція (Сигнал продовження тренду)
Багато трейдерів її ігнорують, хоча вона є надзвичайно точною. Вона шукається виключно всередині існуючого тренду під час локальних відкатів (корекцій).
Бичача прихована дивергенція: На висхідному тренді ціна робить вищий мінімум (Higher Low), а індикатор у цей же час опускається нижче (Lower Low). Це сигнал того, що ринок "розвантажив" індикатор, накопичив сили, і висхідний тренд продовжиться.
Ведмежа прихована дивергенція: На низхідному тренді ціна робить нижчий максимум (Lower High), а індикатор підіймається вище (Higher High). Це показує, що локальний відскік ціни вгору був штучним, і падіння триватиме.
❗️ Як застосовувати: Не відкривайте угоду лише тому, що побачили дивергенцію. Використовуйте її як попередження. Вхід в угоду краще шукати, коли дивергенція підтверджується свічковим патерном або зламом структури на меншому таймфреймі.❗️
Тема №2: Об'єми ринку — горизонтальний об'єм проти вертикального
Більшість новачків дивляться на вертикальний об'єм (стовпчики внизу графіка). Вони показують лише коли (в яку хвилину чи годину) відбулися торги. Проте для професійного розуміння набагато важливіший горизонтальний об'єм (Volume Profile / VRVP). Він показує, за якою саме ціною було проторговано найбільше контрактів чи монет.
Що таке POC (Point of Control)?
POC (Точка контролю) — це найдовша лінія на гістограмі горизонтального об'єму всередині обраного діапазону. Це рівень ціни, де було укладено найбільшу кількість угод (купівлі та продажу) за певний проміжок часу.
POC — це "справедлива вартість" активу на думку ринку. Тут накопичено найбільше грошей.
Як використовувати горизонтальний об'єм на практиці?
1 Магніт для ціни:
Якщо ціна швидко летить вгору або вниз, вона майже завжди буде прагнути повернутися до свого POC, щоб протестувати зону максимального інтересу гравців.
2 Залізобетонна підтримка та опір:
Якщо ціна знаходиться вище великого горизонтального об'єму і починає падати, цей об'єм виступить як потужна зона підтримки. Великі гравці захищатимуть свої позиції, відкриті на цьому рівні.
Якщо ціна знаходиться нижче об'єму і росте вгору, цей об'єм стане сильним зоною опору, подолати яку без нових великих грошей неможливо.
3 Торгівля "порожнечі":
Зони, де горизонтального об'єму майже немає (тонкі ділянки профілю), ціна зазвичай пролітає дуже швидко, бо там немає ордерів, які могли б її зупинити.
Тема №3: Анатомія ліквідності — де ховаються "крупні гравці"
Найголовніше правило ринку: щоб хтось купив великий об'єм активу, хтось інший повинен йомуцей об'єм продати.
Якщо інституційний інвестор (фонд або маркетмейкер) захоче купити Bitcoin на $50 мільйонів за поточною ціною, він просто "задере" графік у космос і купить за невигідною ціною. Йому потрібна ліквідність — велике скупчення зустрічних ордерів.
Де ховаються пули ліквідності?
Пули ліквідності — це зони, де роздрібні трейдери масово виставляють свої обмеження збитків (Stop-Loss ордери).
Стоп-лосси покупців (тих, хто грає в лонг) — це ордери на продаж. Вони ховаються під локальними мінімумами (Lows).
Стоп-лосси продавців (тих, хто грає в шорт) — це ордери на купівлю. Вони ховаються над локальними максимумами (Highs).
Чому ціна рухається від одного пулу до іншого?
Великі гравці бачать ці зони. Щоб набрати свою позицію в лонг, маркетмейкеру потрібно штучно штовхнути ціну вниз — туди, де стоять стоп-лосси звичайних трейдерів. Коли стоп-лосси покупців спрацьовують, вони перетворюються на масові ринкові продажі. Маркетмейкер радо викуповує ці продажі за низькою ціною.
Це називається зняттям ліквідності (Liquidity Sweep) або "вибиванням стопів". Саме тому ринок часто рухається зигзагами: зняли ліквідність зверху (забрали гроші шортистів) -> розвернулися -> пішли знімати ліквідність знизу (забрали гроші лонгістів).
Тема №4: Концепція Smart Money (Розумні гроші)
Концепція Smart Money (SMC) — це спроба аналізувати графік з позиції логіки великого капіталу, а не класичних фігур теханалізу (накшталт "трикутників" чи "голови та плечей", які часто створюються саме для того, щоб заманити натовп у пастку).
Давайте розберемо три базові кити SMC простою мовою:
1.MSB (Market Structure Break — Злам структури ринку)
Коли ринок росте, він рухається сходинками вгору: кожен наступний пік вищий за попередній, кожен мінімум теж вищий.
MSB— це момент, коли ціна замість чергового росту раптом пробиває свій останній (найнижчий) локальний мінімум і закріплюється нижче нього. Це сигнал, що висхідний тренд зламано, ініціативу перехопили ведмеді, і тепер пріоритет — шукати угоди на продаж (шорт).
2.Order Block (Ордерблок)
Це остання свічка перед сильним, імпульсним рухом, який оновив максимум або мінімум ринку.
Чому це важливо: У цій свічці великий гравець вливав свої гроші, щоб штовхнути ринок. Оскільки його об'єм занадто великий, частина його ордерів залишилася не заповненою (лімітки в "режимі очікування").
Як використовувати: Коли ціна з часом повертається назад до цієї свічки (Order Block), вона активує залишені ордери великого гравця і майже завжди отримує сильний відскік у протилежний бік.
3. Imbalance (Імбаланс / Дисбаланс ціни або FVG)
Це трисвічкова формація, де між тінню першої свічки та тінню третьої свічки залишається порожній простір (діра), заповнений лише тілом другої, імпульсної свічки.
Це зона, де ринок рухався занадто швидко через агресивні покупки чи продажі. У цій зоні не було справедливого розподілу між покупцями та продавцями. Ринок не любить хаосу, тому Імбаланс працює як магніт: ціна прагне повернутися і перекрити цю порожнечу (мінімум на 50%), щоб "вирівняти" баланс ордерів, і лише потім продовжити свій рух.
⚠️ Головний висновок: Поєднавши ці інструменти, ви отримуєте чітку логіку. Ви шукаєте класичну дивергенцію на RSI, чекаєте на злам структури (MSB), знаходите на графіку Імбаланс та Ордерблок, який збігається з рівнем POC на горизонтальному об'ємі, і відкриваєте філігранну угоду разом із "розумними грошима", а не проти них.
Еволюція аналізу: Топ-індикатори для криптотрейдингу в 2026 році
1
141
ပုံသေထားသည်
Article
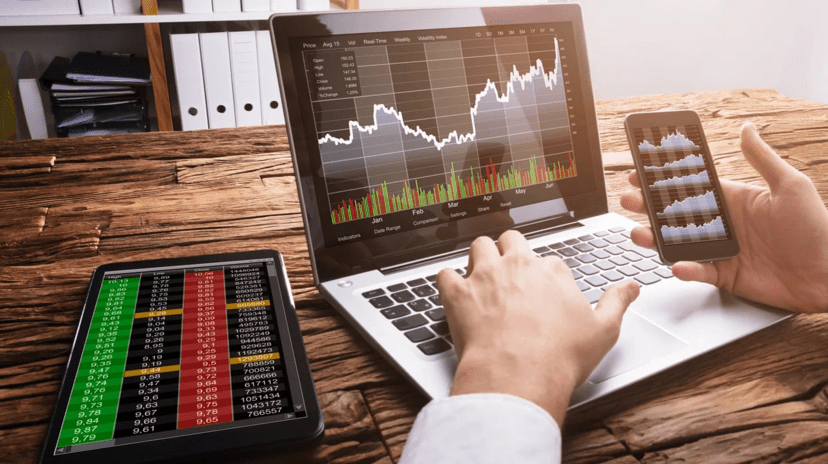
📖Енциклопедія сучасного трейдингу: Від концепцій Smart Money до квантових алгоритмів📊Трейдинг — це не просто купівля та продаж. Це інтелектуальна війна, де кожен учасник використовує свою зброю: від класичної геометрії до штучного інтелекту. У цій статті ми розберемо повну карту методів, які формують фінансові ринки.
{future}(BNBUSDT)
🧠 I. КОНЦЕПТУАЛЬНІ МЕТОДИ: Як мислять професіонали
Ці методи шукають відповідь на питання «Чому ціна рухається?», фокусуючись на діях великих гравців.
1.[Метод Річарда Вайкоффа (Wyckoff)](https://app.binance.com/uni-qr/cart/33052504968874?r=ho8lubrb&l=uk-ua&uco=5vkgl9tq36cfnvkodfwkkw&uc=app_square_share_link&us=copylink)
Фундамент, створений на початку XX століття. Головна ідея — ринком керує "Composite Man"(комбінований гравець).
•[Цикли](https://app.binance.com/uni-qr/cart/34776042391217?r=ho8lubrb&l=uk-ua&uco=5vkgl9tq36cfnvkodfwkkw&uc=app_square_share_link&us=copylink): Накопичення ([Accumulation](https://app.binance.com/uni-qr/cart/34776042391217?r=ho8lubrb&l=uk-ua&uco=5vkgl9tq36cfnvkodfwkkw&uc=app_square_share_link&us=copylink)) та Розподіл ([Distribution](https://app.binance.com/uni-qr/cart/34776042391217?r=ho8lubrb&l=uk-ua&uco=5vkgl9tq36cfnvkodfwkkw&uc=app_square_share_link&us=copylink)).
•[Маніпуляції](https://app.binance.com/uni-qr/cart/35211576377570?r=ho8lubrb&l=uk-ua&uco=5vkgl9tq36cfnvkodfwkkw&uc=app_square_share_link&us=copylink): [Spring](https://app.binance.com/uni-qr/cart/35211576377570?r=ho8lubrb&l=uk-ua&uco=5vkgl9tq36cfnvkodfwkkw&uc=app_square_share_link&us=copylink) (пастка для продавців) та [Upthrust](https://app.binance.com/uni-qr/cart/35211576377570?r=ho8lubrb&l=uk-ua&uco=5vkgl9tq36cfnvkodfwkkw&uc=app_square_share_link&us=copylink) (пастка для покупців).
• Закони: Зусилля проти результату ([об'єм проти руху ціни](https://app.binance.com/uni-qr/cart/35260490659098?r=ho8lubrb&l=uk-ua&uco=5vkgl9tq36cfnvkodfwkkw&uc=app_square_share_link&us=copylink)).
2.[Smart Money Concepts (SMC)](https://app.binance.com/uni-qr/cart/34906072854242?r=ho8lubrb&l=uk-ua&uco=5vkgl9tq36cfnvkodfwkkw&uc=app_square_share_link&us=copylink)
Еволюція Вайкоффа. Базується на тому, що маркетмейкери маніпулюють ціною для збору ліквідності.
•[BOS (Break of Structure)](https://app.binance.com/uni-qr/cart/34759737443497?r=ho8lubrb&l=uk-ua&uco=5vkgl9tq36cfnvkodfwkkw&uc=app_square_share_link&us=copylink): Підтвердження тренду.
•[CHoCH (Change of Character)](https://app.binance.com/uni-qr/cart/34946529719578?r=ho8lubrb&l=uk-ua&uco=5vkgl9tq36cfnvkodfwkkw&uc=app_square_share_link&us=copylink): Перший сигнал зміни тренду.
•[Order Blocks](https://app.binance.com/uni-qr/cart/35065149580346?r=ho8lubrb&l=uk-ua&uco=5vkgl9tq36cfnvkodfwkkw&uc=app_square_share_link&us=copylink): Зони, де великий гравець відкривав позицію.
3.[ICT (Inner Circle Trader)](https://app.binance.com/uni-qr/cart/34330913863281?r=ho8lubrb&l=uk-ua&uco=5vkgl9tq36cfnvkodfwkkw&uc=app_square_share_link&us=copylink)
Авторська методика Майкла Хаддлстона.
•[Fair Value Gaps (FVG)](https://app.binance.com/uni-qr/cart/35073398985841?r=ho8lubrb&l=uk-ua&uco=5vkgl9tq36cfnvkodfwkkw&uc=app_square_share_link&us=copylink): Цінові дисбаланси.
•[Power of 3](https://app.binance.com/uni-qr/cart/35261234104946?r=ho8lubrb&l=uk-ua&uco=5vkgl9tq36cfnvkodfwkkw&uc=app_square_share_link&us=copylink): Маніпулятивний цикл (Accumulation, Manipulation, Distribution).
•[Kill Zones](https://app.binance.com/uni-qr/cart/35285926861481?r=ho8lubrb&l=uk-ua&uco=5vkgl9tq36cfnvkodfwkkw&uc=app_square_share_link&us=copylink): Конкретні часові проміжки для торгівлі.
4.[Об'ємний аналіз (Market/Volume Profile)](https://app.binance.com/uni-qr/cart/34731017821521?r=ho8lubrb&l=uk-ua&uco=5vkgl9tq36cfnvkodfwkkw&uc=app_square_share_link&us=copylink)
Використання POC (Point of Control — ціна з найбільшим об'ємом), HVN та LVN (вузли високого та низького об'єму) для пошуку справжньої вартості активу.
{future}(ETHUSDT)
📊[II. PRICE ACTION: Мистецтво чистого графіка](https://app.binance.com/uni-qr/cart/33625026050329?r=ho8lubrb&l=uk-ua&uco=5vkgl9tq36cfnvkodfwkkw&uc=app_square_share_link&us=copylink)
Торгівля без запізнілих індикаторів, заснована на русі самої ціни.
• Класика: [Підтримка/Опір](https://app.binance.com/uni-qr/cart/33052024321874?r=ho8lubrb&l=uk-ua&uco=5vkgl9tq36cfnvkodfwkkw&uc=app_square_share_link&us=copylink), максимуми та мінімуми ([HH, HL](https://app.binance.com/uni-qr/cart/34805372163354?r=ho8lubrb&l=uk-ua&uco=5vkgl9tq36cfnvkodfwkkw&uc=app_square_share_link&us=copylink)).
•[Свічкові патерни](https://app.binance.com/uni-qr/cart/34851200685737?r=ho8lubrb&l=uk-ua&uco=5vkgl9tq36cfnvkodfwkkw&uc=app_square_share_link&us=copylink): [Pin Bar](https://app.binance.com/uni-qr/cart/34244608216122?r=ho8lubrb&l=uk-ua&uco=5vkgl9tq36cfnvkodfwkkw&uc=app_square_share_link&us=copylink) (відмова), [Engulfing](https://app.binance.com/uni-qr/cart/34820951330362?r=ho8lubrb&l=uk-ua&uco=5vkgl9tq36cfnvkodfwkkw&uc=app_square_share_link&us=copylink) (поглинання), [Doji](https://app.binance.com/uni-qr/cart/34311888883081?r=ho8lubrb&l=uk-ua&uco=5vkgl9tq36cfnvkodfwkkw&uc=app_square_share_link&us=copylink) (невизначеність), Inside Bar.
•[Supply & Demand](https://app.binance.com/uni-qr/cart/35286947795569?r=ho8lubrb&l=uk-ua&uco=5vkgl9tq36cfnvkodfwkkw&uc=app_square_share_link&us=copylink): Пошук зон, де пропозиція перевищує попит, і навпаки.
{future}(XRPUSDT)
‼️[💎 CryptoTradeMask: Торгуй не картинки, а логіку ринку](https://app.binance.com/uni-qr/cart/35195268158689?r=ho8lubrb&l=uk-ua&uco=5vkgl9tq36cfnvkodfwkkw&uc=app_square_share_link&us=copylink)‼️
📈 III. ТРЕНДОВІ ТА ПРОБІЙНІ СТРАТЕГІЇ
Спроба «осідлати» інерцію ринку.
•[Trend Following](https://app.binance.com/uni-qr/cart/34675135210777?r=ho8lubrb&l=uk-ua&uco=5vkgl9tq36cfnvkodfwkkw&uc=app_square_share_link&us=copylink): Купівля на зростанні, продаж на падінні.
•[Moving Averages](https://app.binance.com/uni-qr/cart/34688240803777?r=ho8lubrb&l=uk-ua&uco=5vkgl9tq36cfnvkodfwkkw&uc=app_square_share_link&us=copylink): Використання EMA 20/50/200 та перетинів («Золотий хрест»).
•[Breakout Trading](https://app.binance.com/uni-qr/cart/35153945859697?r=ho8lubrb&l=uk-ua&uco=5vkgl9tq36cfnvkodfwkkw&uc=app_square_share_link&us=copylink): Торгівля на пробій рівнів або «стиснення» (трикутники).
•[False Breakout (Fakeout)](https://app.binance.com/uni-qr/cart/34906863271994?r=ho8lubrb&l=uk-ua&uco=5vkgl9tq36cfnvkodfwkkw&uc=app_square_share_link&us=copylink): Торгівля проти тих, хто зайшов на хибному пробої (Stop Hunt).
•[Gap Trading](https://app.binance.com/uni-qr/cart/35418149857674?r=ho8lubrb&l=uk-ua&uco=5vkgl9tq36cfnvkodfwkkw&uc=app_square_share_link&us=copylink): Робота з розривами цін (Gap & Go або закриття гепу).
🔄 IV. MEAN REVERSION: Повернення до середнього
Стратегії, що базуються на ідеї, що ціна завжди занадто сильно відхиляється від норми, але потім повертається.
•[Range Trading](https://app.binance.com/uni-qr/cart/35330261488978?r=ho8lubrb&l=uk-ua&uco=5vkgl9tq36cfnvkodfwkkw&uc=app_square_share_link&us=copylink): Торгівля в боковику від межі до межі.
•[VWAP Reversion](https://app.binance.com/uni-qr/cart/35375648792857?r=ho8lubrb&l=uk-ua&uco=5vkgl9tq36cfnvkodfwkkw&uc=app_square_share_link&us=copylink): Використання середньозваженої за об'ємом ціни як магніту.
‼️[📈 15 порад для прибуткового криптотрейдингу](https://app.binance.com/uni-qr/cart/33051084135249?r=ho8lubrb&l=uk-ua&uco=5vkgl9tq36cfnvkodfwkkw&uc=app_square_share_link&us=copylink)‼️
📐 V. ТЕХНІЧНІ ІНДИКАТОРИ ТА ФІБО-МАТЕМАТИКА
Математична обробка ціни для візуалізації сигналів.
• Осцилятори: [RSI (дивергенції)](https://app.binance.com/uni-qr/cpos/34003602691465?r=ho8lubrb&l=uk-ua&uco=5vkgl9tq36cfnvkodfwkkw&uc=app_square_share_link&us=copylink), [MACD](https://app.binance.com/uni-qr/cart/34003282689417?r=ho8lubrb&l=uk-ua&uco=5vkgl9tq36cfnvkodfwkkw&uc=app_square_share_link&us=copylink), [Stochastic](https://app.binance.com/uni-qr/cart/34626669917754?r=ho8lubrb&l=uk-ua&uco=5vkgl9tq36cfnvkodfwkkw&uc=app_square_share_link&us=copylink).
• Волатильність: [Bollinger Bands](https://app.binance.com/uni-qr/cpos/34002994577177?r=ho8lubrb&l=uk-ua&uco=5vkgl9tq36cfnvkodfwkkw&uc=app_square_share_link&us=copylink) (стиснення) та ATR (для виставлення стопів).
•[Числа Фібоначчі](https://app.binance.com/uni-qr/cart/34494463146433?r=ho8lubrb&l=uk-ua&uco=5vkgl9tq36cfnvkodfwkkw&uc=app_square_share_link&us=copylink): Рівні корекції (0.618) та розширення для визначення цілей.
🌊 VI. ХВИЛЬОВА ТЕОРІЯ ТА ГАРМОНІКА
Пошук циклічності та повторюваних геометричних структур.
•[Elliott Wave Theory](https://app.binance.com/uni-qr/cart/35338247451529?r=ho8lubrb&l=uk-ua&uco=5vkgl9tq36cfnvkodfwkkw&uc=app_square_share_link&us=copylink): Ринок рухається хвилями 1-2-3-4-5 та A-B-C.
•[Harmonic Patterns](https://app.binance.com/uni-qr/cart/35463089958001?r=ho8lubrb&l=uk-ua&uco=5vkgl9tq36cfnvkodfwkkw&uc=app_square_share_link&us=copylink): Складні фігури на основі Фібоначчі (Gartley, Bat, Butterfly).
•[Wolfe Waves](https://app.binance.com/uni-qr/cart/35425231015081?r=ho8lubrb&l=uk-ua&uco=5vkgl9tq36cfnvkodfwkkw&uc=app_square_share_link&us=copylink): П’ятихвильовий патерн для пошуку точок розвороту.
⏱️ [VII. ЧАС ТА КОНТЕКСТ (SESSIONS & MACRO)](https://app.binance.com/uni-qr/cpos/34333008184202?r=ho8lubrb&l=uk-ua&uco=5vkgl9tq36cfnvkodfwkkw&uc=app_square_share_link&us=copylink)
Ринок працює по годинах, і його настрій залежить від глобальних новин.
•[Session Trading](https://app.binance.com/uni-qr/cpos/34333008184202?r=ho8lubrb&l=uk-ua&uco=5vkgl9tq36cfnvkodfwkkw&uc=app_square_share_link&us=copylink): Розуміння особливостей Азії (флет), Лондона (тренд) та Нью-Йорка (реверс).
•[News Trading](https://app.binance.com/uni-qr/cart/35397880999081?r=ho8lubrb&l=uk-ua&uco=5vkgl9tq36cfnvkodfwkkw&uc=app_square_share_link&us=copylink): Реакція на інфляцію (CPI), безробіття (NFP) та ставки ФРС (FOMC).
•[Fundamental Analysis](https://app.binance.com/uni-qr/cart/35488091547249?r=ho8lubrb&l=uk-ua&uco=5vkgl9tq36cfnvkodfwkkw&uc=app_square_share_link&us=copylink): Оцінка макроекономіки, токеноміки (для крипто) або фінансових звітів компаній (Earnings).
‼️[🚀 Криптотрейдинг з нуля за 30 днів — покроковий план, щоб навчитися і впевнено торгувати](https://app.binance.com/uni-qr/cart/34930601182490?r=ho8lubrb&l=uk-ua&uco=5vkgl9tq36cfnvkodfwkkw&uc=app_square_share_link&us=copylink)‼️
🤖 VIII. АЛГОРИТМІЧНИЙ ТА КВАНТОВИЙ ТРЕЙДИНГ
Світ роботів та високої математики.
•[HFT (High Frequency)](https://app.binance.com/uni-qr/cart/35525682794889?r=ho8lubrb&l=uk-ua&uco=5vkgl9tq36cfnvkodfwkkw&uc=app_square_share_link&us=copylink): Торгівля з мікросекундною швидкістю.
•[Statistical Arbitrage](https://app.binance.com/uni-qr/cart/35532088894745?r=ho8lubrb&l=uk-ua&uco=5vkgl9tq36cfnvkodfwkkw&uc=app_square_share_link&us=copylink): Пошук математичних розбіжностей між активами.
•[Market Making](https://app.binance.com/uni-qr/cart/35551386418802?r=ho8lubrb&l=uk-ua&uco=5vkgl9tq36cfnvkodfwkkw&uc=app_square_share_link&us=copylink): Надання ліквідності ринку за рахунок спреду.
•[Machine Learning](https://app.binance.com/uni-qr/cart/35660617901114?r=ho8lubrb&l=uk-ua&uco=5vkgl9tq36cfnvkodfwkkw&uc=app_square_share_link&us=copylink): Навчання нейромереж розпізнавати сетапи.
🔀 IX. АРБІТРАЖ ТА НІШЕВІ МЕТОДИ
•[Arbitrage](https://app.binance.com/uni-qr/cart/35507078103098?r=ho8lubrb&l=uk-ua&uco=5vkgl9tq36cfnvkodfwkkw&uc=app_square_share_link&us=copylink): Просторовий (різниця цін на біржах) або трикутний (всередині однієї біржі).
•[Order Flow](https://app.binance.com/uni-qr/cart/35601499169906?r=ho8lubrb&l=uk-ua&uco=5vkgl9tq36cfnvkodfwkkw&uc=app_square_share_link&us=copylink): Читання «стрічки» (Time & Sales) та «стакана» (DOM).
•[On-chain](https://app.binance.com/uni-qr/cart/35565266873793?r=ho8lubrb&l=uk-ua&uco=5vkgl9tq36cfnvkodfwkkw&uc=app_square_share_link&us=copylink): Аналіз переказів китів та потоків на гаманцях блокчейну.
🧠 X. ПСИХОЛОГІЯ ТА РИЗИК: Фундамент виживання
Без цього розділу всі попередні методи не мають сенсу.
•[Risk Management](https://app.binance.com/uni-qr/cpos/33081979215753?r=ho8lubrb&l=uk-ua&uco=5vkgl9tq36cfnvkodfwkkw&uc=app_square_share_link&us=copylink): Розрахунок розміру позиції та R:R ([Risk/Reward](https://app.binance.com/uni-qr/cart/34936701777065?r=ho8lubrb&l=uk-ua&uco=5vkgl9tq36cfnvkodfwkkw&uc=app_square_share_link&us=copylink)).
•[Expectancy](https://app.binance.com/uni-qr/cart/35660057079234?r=ho8lubrb&l=uk-ua&uco=5vkgl9tq36cfnvkodfwkkw&uc=app_square_share_link&us=copylink): Розуміння математичного очікування вашої системи.
•[Anti-Martingale](https://app.binance.com/uni-qr/cart/35603347206258?r=ho8lubrb&l=uk-ua&uco=5vkgl9tq36cfnvkodfwkkw&uc=app_square_share_link&us=copylink): Збільшення позиції під час прибутку, а не збитку.
🏁 ВИСНОВОК: Яку форму обрати?
Ваш стиль торгівлі залежить від вашого психотипу:
1.[Scalping](https://app.binance.com/uni-qr/cart/35085596593602?r=ho8lubrb&l=uk-ua&uco=5vkgl9tq36cfnvkodfwkkw&uc=app_square_share_link&us=copylink): Угоди на хвилини.
2.[Day Trading](https://app.binance.com/uni-qr/cart/35555277962922?r=ho8lubrb&l=uk-ua&uco=5vkgl9tq36cfnvkodfwkkw&uc=app_square_share_link&us=copylink): Закриття всіх позицій до кінця дня.
3.[Swing Trading](https://app.binance.com/uni-qr/cart/35112991496305?r=ho8lubrb&l=uk-ua&uco=5vkgl9tq36cfnvkodfwkkw&uc=app_square_share_link&us=copylink): Утримання позицій кілька днів/тижнів.
4.[Position/Investment](https://app.binance.com/uni-qr/cart/35643706816113?r=ho8lubrb&l=uk-ua&uco=5vkgl9tq36cfnvkodfwkkw&uc=app_square_share_link&us=copylink): Робота на місяці та роки.
⚠️Порада професіонала: Найкращий результат дає комбінація. Використовуйте Wyckoff для розуміння контексту, SMC/Price Action для точки входу та суворий Risk Management для збереження капіталу.
"Крипторинок — це океан можливостей, але без навігатора тут легко піти на дно. Ви коли-небудь відчували, що купуєте на самому піку, а продаєте саме тоді, коли ціна ось-ось розвернеться вгору? Припиніть гадати на кавовій гущі! Справжній успіх у трейдингу — це не інтуїція, а математика та дисципліна. Ми зібрали для вас 'золоту тринадцятку' інструментів, які перетворять хаотичні графіки на чітку карту прибутку. Час дізнатися, як читати ринок між рядків!"
‼️[📊13 Найкращих Індикаторів для Криптотрейдингу: Повний Посібник з Денної та Свінг-Торгівлі📈📉](https://app.binance.com/uni-qr/cart/35857916400978?r=ho8lubrb&l=uk-ua&uco=5vkgl9tq36cfnvkodfwkkw&uc=app_square_share_link&us=copylink)‼️
📖Енциклопедія сучасного трейдингу: Від концепцій Smart Money до квантових алгоритмів📊
Трейдинг — це не просто купівля та продаж. Це інтелектуальна війна, де кожен учасник використовує свою зброю: від класичної геометрії до штучного інтелекту. У цій статті ми розберемо повну карту методів, які формують фінансові ринки.
🧠 I. КОНЦЕПТУАЛЬНІ МЕТОДИ: Як мислять професіонали
Ці методи шукають відповідь на питання «Чому ціна рухається?», фокусуючись на діях великих гравців.
1.Метод Річарда Вайкоффа (Wyckoff)
Фундамент, створений на початку XX століття. Головна ідея — ринком керує "Composite Man"(комбінований гравець).
•Цикли: Накопичення (Accumulation) та Розподіл (Distribution).
•Маніпуляції: Spring (пастка для продавців) та Upthrust (пастка для покупців).
• Закони: Зусилля проти результату (об'єм проти руху ціни).
2.Smart Money Concepts (SMC)
Еволюція Вайкоффа. Базується на тому, що маркетмейкери маніпулюють ціною для збору ліквідності.
•BOS (Break of Structure): Підтвердження тренду.
•CHoCH (Change of Character): Перший сигнал зміни тренду.
•Order Blocks: Зони, де великий гравець відкривав позицію.
3.ICT (Inner Circle Trader)
Авторська методика Майкла Хаддлстона.
•Fair Value Gaps (FVG): Цінові дисбаланси.
•Power of 3: Маніпулятивний цикл (Accumulation, Manipulation, Distribution).
•Kill Zones: Конкретні часові проміжки для торгівлі.
4.Об'ємний аналіз (Market/Volume Profile)
Використання POC (Point of Control — ціна з найбільшим об'ємом), HVN та LVN (вузли високого та низького об'єму) для пошуку справжньої вартості активу.
📊II. PRICE ACTION: Мистецтво чистого графіка
Торгівля без запізнілих індикаторів, заснована на русі самої ціни.
• Класика: Підтримка/Опір, максимуми та мінімуми (HH, HL).
•Свічкові патерни: Pin Bar (відмова), Engulfing (поглинання), Doji (невизначеність), Inside Bar.
•Supply & Demand: Пошук зон, де пропозиція перевищує попит, і навпаки.
‼️💎 CryptoTradeMask: Торгуй не картинки, а логіку ринку‼️
📈 III. ТРЕНДОВІ ТА ПРОБІЙНІ СТРАТЕГІЇ
Спроба «осідлати» інерцію ринку.
•Trend Following: Купівля на зростанні, продаж на падінні.
•Moving Averages: Використання EMA 20/50/200 та перетинів («Золотий хрест»).
•Breakout Trading: Торгівля на пробій рівнів або «стиснення» (трикутники).
•False Breakout (Fakeout): Торгівля проти тих, хто зайшов на хибному пробої (Stop Hunt).
•Gap Trading: Робота з розривами цін (Gap & Go або закриття гепу).
🔄 IV. MEAN REVERSION: Повернення до середнього
Стратегії, що базуються на ідеї, що ціна завжди занадто сильно відхиляється від норми, але потім повертається.
•Range Trading: Торгівля в боковику від межі до межі.
•VWAP Reversion: Використання середньозваженої за об'ємом ціни як магніту.
‼️📈 15 порад для прибуткового криптотрейдингу‼️
📐 V. ТЕХНІЧНІ ІНДИКАТОРИ ТА ФІБО-МАТЕМАТИКА
Математична обробка ціни для візуалізації сигналів.
• Осцилятори: RSI (дивергенції), MACD, Stochastic.
• Волатильність: Bollinger Bands (стиснення) та ATR (для виставлення стопів).
•Числа Фібоначчі: Рівні корекції (0.618) та розширення для визначення цілей.
🌊 VI. ХВИЛЬОВА ТЕОРІЯ ТА ГАРМОНІКА
Пошук циклічності та повторюваних геометричних структур.
•Elliott Wave Theory: Ринок рухається хвилями 1-2-3-4-5 та A-B-C.
•Harmonic Patterns: Складні фігури на основі Фібоначчі (Gartley, Bat, Butterfly).
•Wolfe Waves: П’ятихвильовий патерн для пошуку точок розвороту.
⏱️ VII. ЧАС ТА КОНТЕКСТ (SESSIONS & MACRO)
Ринок працює по годинах, і його настрій залежить від глобальних новин.
•Session Trading: Розуміння особливостей Азії (флет), Лондона (тренд) та Нью-Йорка (реверс).
•News Trading: Реакція на інфляцію (CPI), безробіття (NFP) та ставки ФРС (FOMC).
•Fundamental Analysis: Оцінка макроекономіки, токеноміки (для крипто) або фінансових звітів компаній (Earnings).
‼️🚀 Криптотрейдинг з нуля за 30 днів — покроковий план, щоб навчитися і впевнено торгувати‼️
🤖 VIII. АЛГОРИТМІЧНИЙ ТА КВАНТОВИЙ ТРЕЙДИНГ
Світ роботів та високої математики.
•HFT (High Frequency): Торгівля з мікросекундною швидкістю.
•Statistical Arbitrage: Пошук математичних розбіжностей між активами.
•Market Making: Надання ліквідності ринку за рахунок спреду.
•Machine Learning: Навчання нейромереж розпізнавати сетапи.
🔀 IX. АРБІТРАЖ ТА НІШЕВІ МЕТОДИ
•Arbitrage: Просторовий (різниця цін на біржах) або трикутний (всередині однієї біржі).
•Order Flow: Читання «стрічки» (Time & Sales) та «стакана» (DOM).
•On-chain: Аналіз переказів китів та потоків на гаманцях блокчейну.
🧠 X. ПСИХОЛОГІЯ ТА РИЗИК: Фундамент виживання
Без цього розділу всі попередні методи не мають сенсу.
•Risk Management: Розрахунок розміру позиції та R:R (Risk/Reward).
•Expectancy: Розуміння математичного очікування вашої системи.
•Anti-Martingale: Збільшення позиції під час прибутку, а не збитку.
🏁 ВИСНОВОК: Яку форму обрати?
Ваш стиль торгівлі залежить від вашого психотипу:
1.Scalping: Угоди на хвилини.
2.Day Trading: Закриття всіх позицій до кінця дня.
3.Swing Trading: Утримання позицій кілька днів/тижнів.
4.Position/Investment: Робота на місяці та роки.
⚠️Порада професіонала: Найкращий результат дає комбінація. Використовуйте Wyckoff для розуміння контексту, SMC/Price Action для точки входу та суворий Risk Management для збереження капіталу.
"Крипторинок — це океан можливостей, але без навігатора тут легко піти на дно. Ви коли-небудь відчували, що купуєте на самому піку, а продаєте саме тоді, коли ціна ось-ось розвернеться вгору? Припиніть гадати на кавовій гущі! Справжній успіх у трейдингу — це не інтуїція, а математика та дисципліна. Ми зібрали для вас 'золоту тринадцятку' інструментів, які перетворять хаотичні графіки на чітку карту прибутку. Час дізнатися, як читати ринок між рядків!"
‼️📊13 Найкращих Індикаторів для Криптотрейдингу: Повний Посібник з Денної та Свінг-Торгівлі📈📉‼️
🧠 I. КОНЦЕПТУАЛЬНІ МЕТОДИ: Як мислять професіонали
Ці методи шукають відповідь на питання «Чому ціна рухається?», фокусуючись на діях великих гравців.
1.Метод Річарда Вайкоффа (Wyckoff)
Фундамент, створений на початку XX століття. Головна ідея — ринком керує "Composite Man"(комбінований гравець).
•Цикли: Накопичення (Accumulation) та Розподіл (Distribution).
•Маніпуляції: Spring (пастка для продавців) та Upthrust (пастка для покупців).
• Закони: Зусилля проти результату (об'єм проти руху ціни).
2.Smart Money Concepts (SMC)
Еволюція Вайкоффа. Базується на тому, що маркетмейкери маніпулюють ціною для збору ліквідності.
•BOS (Break of Structure): Підтвердження тренду.
•CHoCH (Change of Character): Перший сигнал зміни тренду.
•Order Blocks: Зони, де великий гравець відкривав позицію.
3.ICT (Inner Circle Trader)
Авторська методика Майкла Хаддлстона.
•Fair Value Gaps (FVG): Цінові дисбаланси.
•Power of 3: Маніпулятивний цикл (Accumulation, Manipulation, Distribution).
•Kill Zones: Конкретні часові проміжки для торгівлі.
4.Об'ємний аналіз (Market/Volume Profile)
Використання POC (Point of Control — ціна з найбільшим об'ємом), HVN та LVN (вузли високого та низького об'єму) для пошуку справжньої вартості активу.
📊II. PRICE ACTION: Мистецтво чистого графіка
Торгівля без запізнілих індикаторів, заснована на русі самої ціни.
• Класика: Підтримка/Опір, максимуми та мінімуми (HH, HL).
•Свічкові патерни: Pin Bar (відмова), Engulfing (поглинання), Doji (невизначеність), Inside Bar.
•Supply & Demand: Пошук зон, де пропозиція перевищує попит, і навпаки.
‼️💎 CryptoTradeMask: Торгуй не картинки, а логіку ринку‼️
📈 III. ТРЕНДОВІ ТА ПРОБІЙНІ СТРАТЕГІЇ
Спроба «осідлати» інерцію ринку.
•Trend Following: Купівля на зростанні, продаж на падінні.
•Moving Averages: Використання EMA 20/50/200 та перетинів («Золотий хрест»).
•Breakout Trading: Торгівля на пробій рівнів або «стиснення» (трикутники).
•False Breakout (Fakeout): Торгівля проти тих, хто зайшов на хибному пробої (Stop Hunt).
•Gap Trading: Робота з розривами цін (Gap & Go або закриття гепу).
🔄 IV. MEAN REVERSION: Повернення до середнього
Стратегії, що базуються на ідеї, що ціна завжди занадто сильно відхиляється від норми, але потім повертається.
•Range Trading: Торгівля в боковику від межі до межі.
•VWAP Reversion: Використання середньозваженої за об'ємом ціни як магніту.
‼️📈 15 порад для прибуткового криптотрейдингу‼️
📐 V. ТЕХНІЧНІ ІНДИКАТОРИ ТА ФІБО-МАТЕМАТИКА
Математична обробка ціни для візуалізації сигналів.
• Осцилятори: RSI (дивергенції), MACD, Stochastic.
• Волатильність: Bollinger Bands (стиснення) та ATR (для виставлення стопів).
•Числа Фібоначчі: Рівні корекції (0.618) та розширення для визначення цілей.
🌊 VI. ХВИЛЬОВА ТЕОРІЯ ТА ГАРМОНІКА
Пошук циклічності та повторюваних геометричних структур.
•Elliott Wave Theory: Ринок рухається хвилями 1-2-3-4-5 та A-B-C.
•Harmonic Patterns: Складні фігури на основі Фібоначчі (Gartley, Bat, Butterfly).
•Wolfe Waves: П’ятихвильовий патерн для пошуку точок розвороту.
⏱️ VII. ЧАС ТА КОНТЕКСТ (SESSIONS & MACRO)
Ринок працює по годинах, і його настрій залежить від глобальних новин.
•Session Trading: Розуміння особливостей Азії (флет), Лондона (тренд) та Нью-Йорка (реверс).
•News Trading: Реакція на інфляцію (CPI), безробіття (NFP) та ставки ФРС (FOMC).
•Fundamental Analysis: Оцінка макроекономіки, токеноміки (для крипто) або фінансових звітів компаній (Earnings).
‼️🚀 Криптотрейдинг з нуля за 30 днів — покроковий план, щоб навчитися і впевнено торгувати‼️
🤖 VIII. АЛГОРИТМІЧНИЙ ТА КВАНТОВИЙ ТРЕЙДИНГ
Світ роботів та високої математики.
•HFT (High Frequency): Торгівля з мікросекундною швидкістю.
•Statistical Arbitrage: Пошук математичних розбіжностей між активами.
•Market Making: Надання ліквідності ринку за рахунок спреду.
•Machine Learning: Навчання нейромереж розпізнавати сетапи.
🔀 IX. АРБІТРАЖ ТА НІШЕВІ МЕТОДИ
•Arbitrage: Просторовий (різниця цін на біржах) або трикутний (всередині однієї біржі).
•Order Flow: Читання «стрічки» (Time & Sales) та «стакана» (DOM).
•On-chain: Аналіз переказів китів та потоків на гаманцях блокчейну.
🧠 X. ПСИХОЛОГІЯ ТА РИЗИК: Фундамент виживання
Без цього розділу всі попередні методи не мають сенсу.
•Risk Management: Розрахунок розміру позиції та R:R (Risk/Reward).
•Expectancy: Розуміння математичного очікування вашої системи.
•Anti-Martingale: Збільшення позиції під час прибутку, а не збитку.
🏁 ВИСНОВОК: Яку форму обрати?
Ваш стиль торгівлі залежить від вашого психотипу:
1.Scalping: Угоди на хвилини.
2.Day Trading: Закриття всіх позицій до кінця дня.
3.Swing Trading: Утримання позицій кілька днів/тижнів.
4.Position/Investment: Робота на місяці та роки.
⚠️Порада професіонала: Найкращий результат дає комбінація. Використовуйте Wyckoff для розуміння контексту, SMC/Price Action для точки входу та суворий Risk Management для збереження капіталу.
"Крипторинок — це океан можливостей, але без навігатора тут легко піти на дно. Ви коли-небудь відчували, що купуєте на самому піку, а продаєте саме тоді, коли ціна ось-ось розвернеться вгору? Припиніть гадати на кавовій гущі! Справжній успіх у трейдингу — це не інтуїція, а математика та дисципліна. Ми зібрали для вас 'золоту тринадцятку' інструментів, які перетворять хаотичні графіки на чітку карту прибутку. Час дізнатися, як читати ринок між рядків!"
‼️📊13 Найкращих Індикаторів для Криптотрейдингу: Повний Посібник з Денної та Свінг-Торгівлі📈📉‼️
10
3
41
410
#metaplanet
Metaplanet grows Bitcoin reserves to 44,000 $BTC ($3.8 billion) by the end of Q3 2026 🚀
Japanese company Metaplanet (3350) continues to execute its aggressive Bitcoin strategy, adding a net 1,000 BTC during the third quarter. As of September 30, its holdings reached 44,000 BTC.
📊 Key report details:
➡️ Liquidity maneuver: The company sold 10,000 BTC for $789.2 million ($78,925 per coin) and temporarily held the cash to demonstrate to creditors its ability to cover interest obligations. Subsequently, Metaplanet repurchased 11,000 BTC for $948.7 million ($86,246 per coin).
➡️ Total cost basis: The total cost of all 44,000 BTC on the balance sheet is approximately $4.33 billion, with an average purchase price of $98,454 per BTC.
➡️ New strategy (Net Interest Income): Metaplanet plans to allocate 10–15% of its assets into preferred securities of other companies with significant Bitcoin treasuries to generate a yield exceeding its cost of capital.
➡️ Options revenue: The options business (Bitcoin Income Generation) generated $5.4 million in revenue for Q3 (a 51% drop compared to Q2), but total revenue for the nine-month period reached $35.2 million (marking the eighth consecutive profitable quarter).
➡️ Market reaction: Metaplanet shares in Tokyo closed 2% higher at 297 yen ($1.88).
⚠️ CEO Simon Gerovich emphasized that the company's goal is to move beyond mere BTC accumulation and become a leading Bitcoin financial company in Asia.
{future}(BTCUSDT)
#metaplanet
Metaplanet grows Bitcoin reserves to 44,000 $BTC ($3.8 billion) by the end of Q3 2026 🚀
Japanese company Metaplanet (3350) continues to execute its aggressive Bitcoin strategy, adding a net 1,000 BTC during the third quarter. As of September 30, its holdings reached 44,000 BTC.
📊 Key report details:
➡️ Liquidity maneuver: The company sold 10,000 BTC for $789.2 million ($78,925 per coin) and temporarily held the cash to demonstrate to creditors its ability to cover interest obligations. Subsequently, Metaplanet repurchased 11,000 BTC for $948.7 million ($86,246 per coin).
➡️ Total cost basis: The total cost of all 44,000 BTC on the balance sheet is approximately $4.33 billion, with an average purchase price of $98,454 per BTC.
➡️ New strategy (Net Interest Income): Metaplanet plans to allocate 10–15% of its assets into preferred securities of other companies with significant Bitcoin treasuries to generate a yield exceeding its cost of capital.
➡️ Options revenue: The options business (Bitcoin Income Generation) generated $5.4 million in revenue for Q3 (a 51% drop compared to Q2), but total revenue for the nine-month period reached $35.2 million (marking the eighth consecutive profitable quarter).
➡️ Market reaction: Metaplanet shares in Tokyo closed 2% higher at 297 yen ($1.88).
⚠️ CEO Simon Gerovich emphasized that the company's goal is to move beyond mere BTC accumulation and become a leading Bitcoin financial company in Asia.
Metaplanet grows Bitcoin reserves to 44,000 $BTC ($3.8 billion) by the end of Q3 2026 🚀
Japanese company Metaplanet (3350) continues to execute its aggressive Bitcoin strategy, adding a net 1,000 BTC during the third quarter. As of September 30, its holdings reached 44,000 BTC.
📊 Key report details:
➡️ Liquidity maneuver: The company sold 10,000 BTC for $789.2 million ($78,925 per coin) and temporarily held the cash to demonstrate to creditors its ability to cover interest obligations. Subsequently, Metaplanet repurchased 11,000 BTC for $948.7 million ($86,246 per coin).
➡️ Total cost basis: The total cost of all 44,000 BTC on the balance sheet is approximately $4.33 billion, with an average purchase price of $98,454 per BTC.
➡️ New strategy (Net Interest Income): Metaplanet plans to allocate 10–15% of its assets into preferred securities of other companies with significant Bitcoin treasuries to generate a yield exceeding its cost of capital.
➡️ Options revenue: The options business (Bitcoin Income Generation) generated $5.4 million in revenue for Q3 (a 51% drop compared to Q2), but total revenue for the nine-month period reached $35.2 million (marking the eighth consecutive profitable quarter).
➡️ Market reaction: Metaplanet shares in Tokyo closed 2% higher at 297 yen ($1.88).
⚠️ CEO Simon Gerovich emphasized that the company's goal is to move beyond mere BTC accumulation and become a leading Bitcoin financial company in Asia.
4
#CryptoMarketMoves
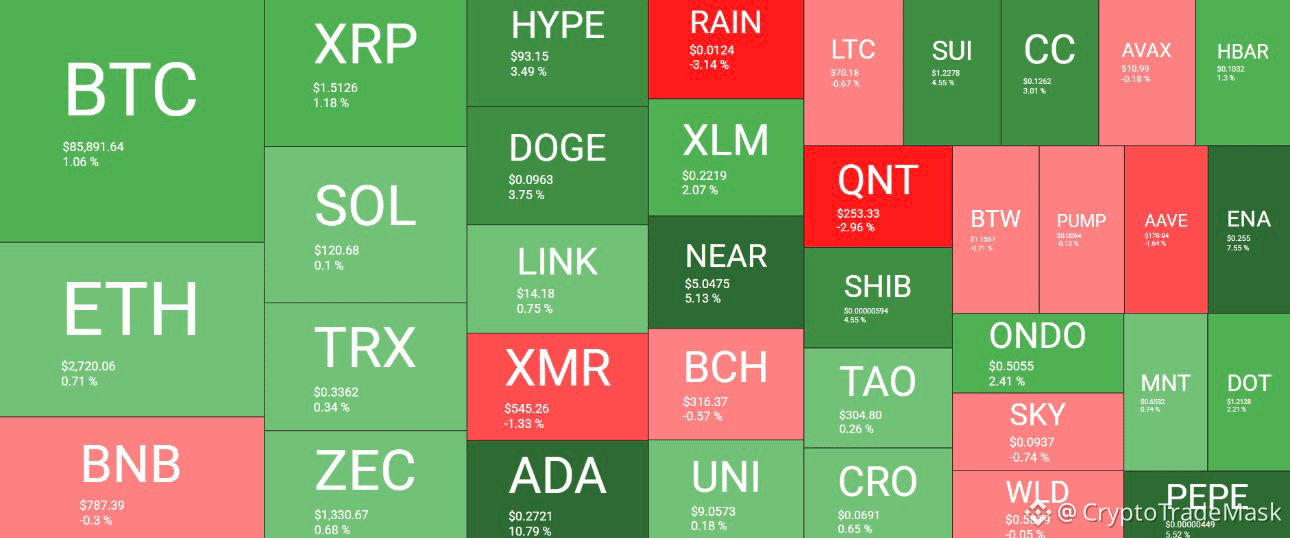
Bitcoin bounces off $87K again, while Cardano surges 11%: Market Overview
Despite renewed tensions in the Middle East, the cryptocurrency market is off to a dynamic start this week. Total market capitalization rose by 1% to reach $2.93 trillion.
📊 Key Market Highlights:
Bitcoin (#BTC ) climbed to $87,000 on Monday morning but once again faced strong selling pressure. After pulling back to $85,500, the price stabilized around the $86,000 mark. BTC's market cap stands at $1.72 trillion, with its dominance index holding steady at 59%.
Cardano (#ADA ) emerged as the clear leader among top altcoins, surging nearly 11% to reach the $0.27 level.
🚀 Altcoin Surge:
$FET rose by over 15%.
$VIRTUAL gained 12%.
$NEAR climbed 5%, reclaiming the $5 mark.
#DOGE (+3.75%), HYPE (+3.5%), and ENA (+7.5%) were also among the day's top performers.
Large caps: Ethereum (#ETH ) consolidated slightly above $2,700, while XRP is trading above $1.50.
{future}(NEARUSDT)
{future}(VIRTUALUSDT)
{future}(FETUSDT)
#CryptoMarketMoves
Bitcoin bounces off $87K again, while Cardano surges 11%: Market Overview
Despite renewed tensions in the Middle East, the cryptocurrency market is off to a dynamic start this week. Total market capitalization rose by 1% to reach $2.93 trillion.
📊 Key Market Highlights:
Bitcoin (#BTC ) climbed to $87,000 on Monday morning but once again faced strong selling pressure. After pulling back to $85,500, the price stabilized around the $86,000 mark. BTC's market cap stands at $1.72 trillion, with its dominance index holding steady at 59%.
Cardano (#ADA ) emerged as the clear leader among top altcoins, surging nearly 11% to reach the $0.27 level.
🚀 Altcoin Surge:
$FET rose by over 15%.
$VIRTUAL gained 12%.
$NEAR climbed 5%, reclaiming the $5 mark.
#DOGE (+3.75%), HYPE (+3.5%), and ENA (+7.5%) were also among the day's top performers.
Large caps: Ethereum (#ETH ) consolidated slightly above $2,700, while XRP is trading above $1.50.
Bitcoin bounces off $87K again, while Cardano surges 11%: Market Overview
Despite renewed tensions in the Middle East, the cryptocurrency market is off to a dynamic start this week. Total market capitalization rose by 1% to reach $2.93 trillion.
📊 Key Market Highlights:
Bitcoin (#BTC ) climbed to $87,000 on Monday morning but once again faced strong selling pressure. After pulling back to $85,500, the price stabilized around the $86,000 mark. BTC's market cap stands at $1.72 trillion, with its dominance index holding steady at 59%.
Cardano (#ADA ) emerged as the clear leader among top altcoins, surging nearly 11% to reach the $0.27 level.
🚀 Altcoin Surge:
$FET rose by over 15%.
$VIRTUAL gained 12%.
$NEAR climbed 5%, reclaiming the $5 mark.
#DOGE (+3.75%), HYPE (+3.5%), and ENA (+7.5%) were also among the day's top performers.
Large caps: Ethereum (#ETH ) consolidated slightly above $2,700, while XRP is trading above $1.50.
81
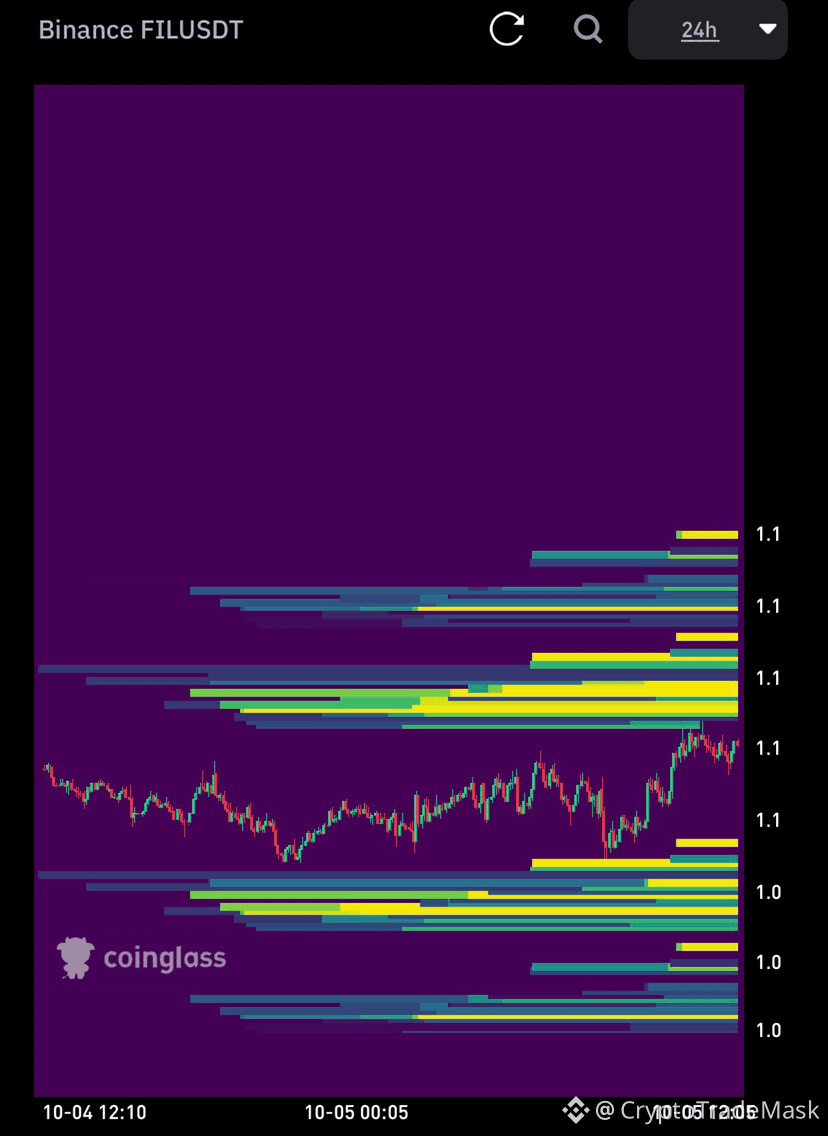
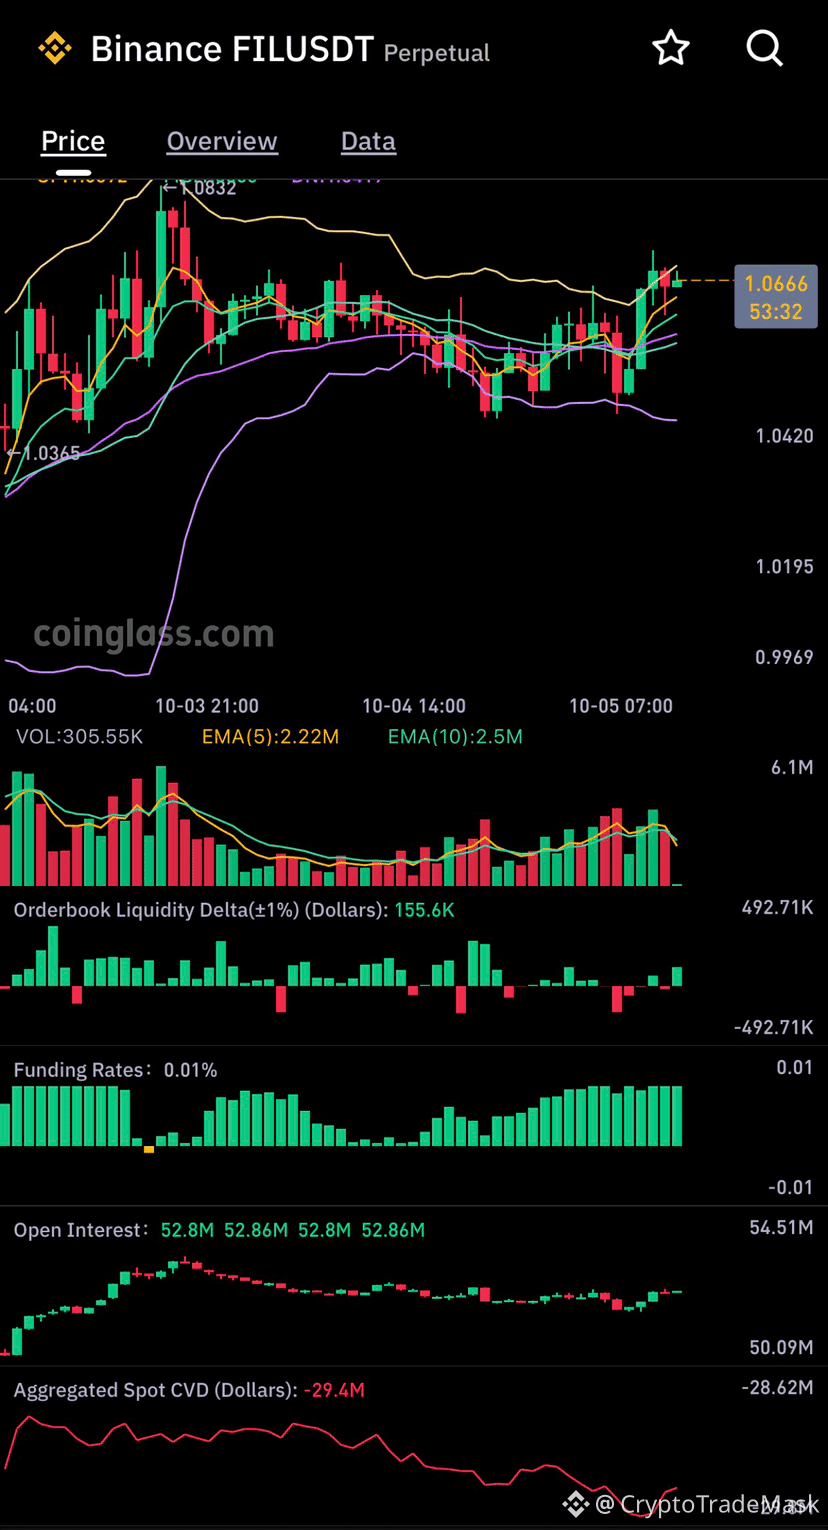
🚀 $FIL /USDT: Local Setup 📊
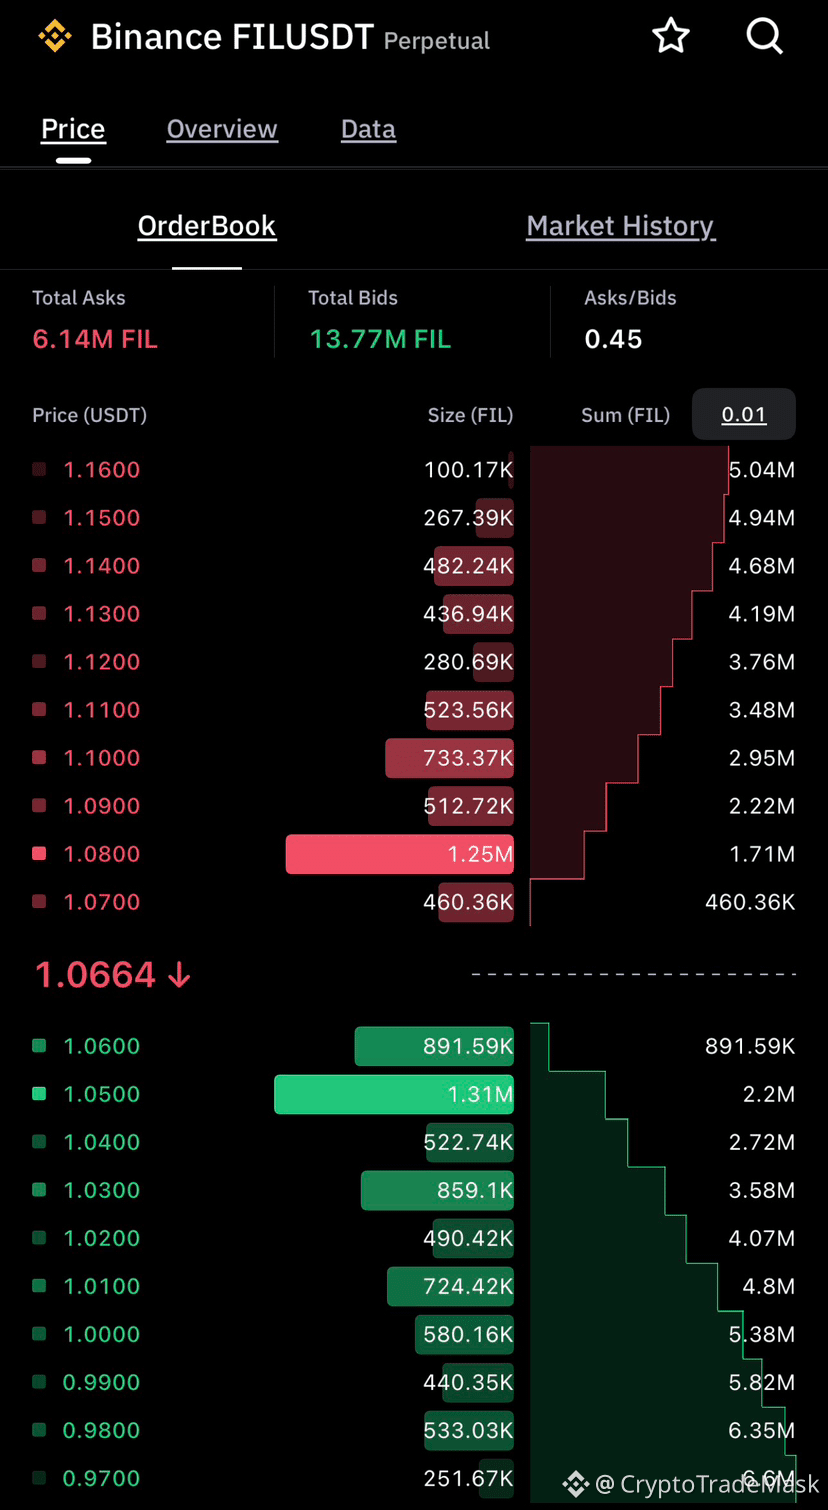
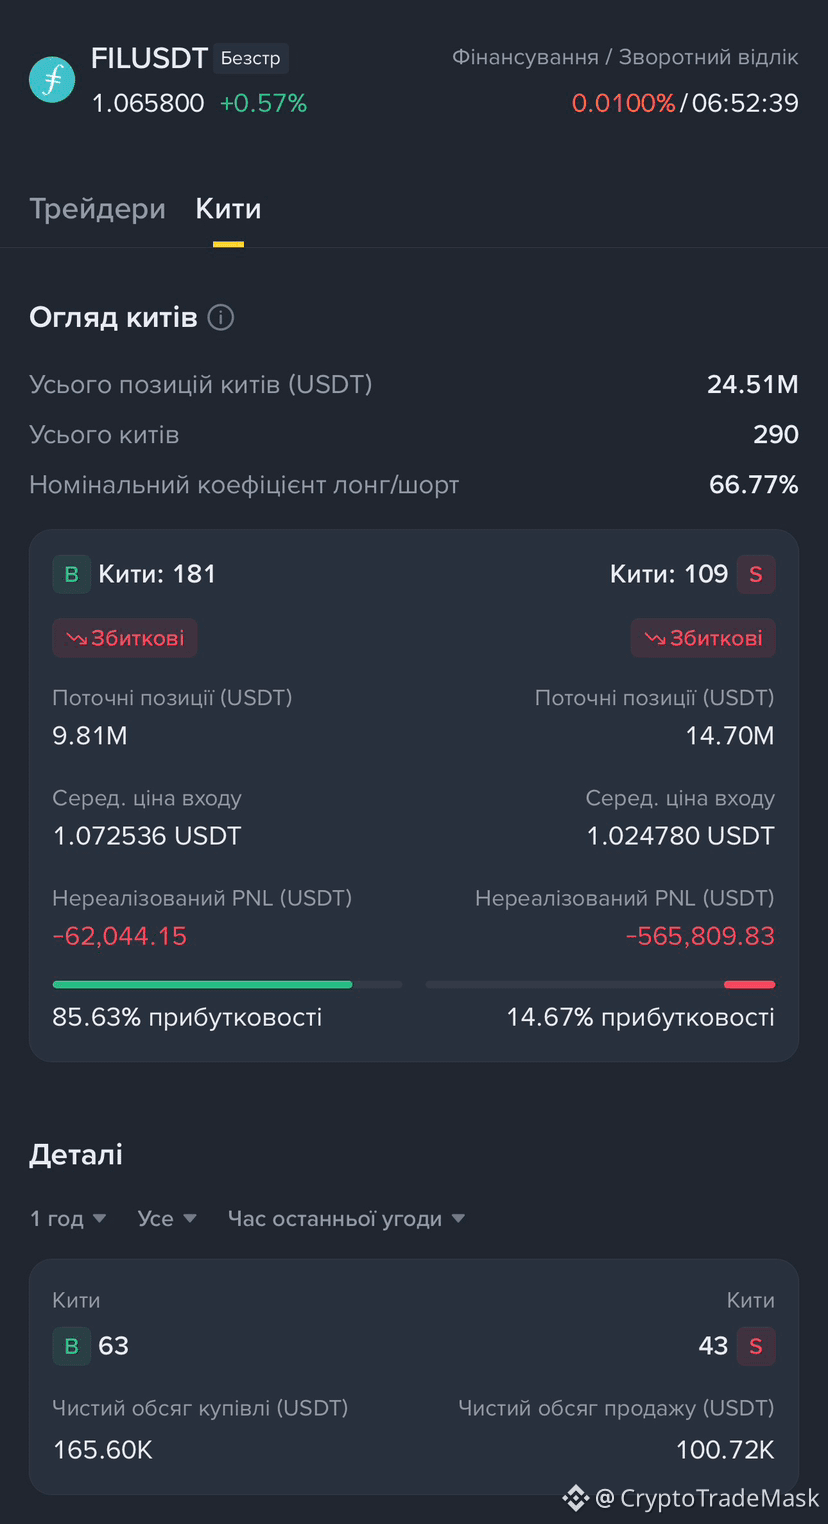
The price is squeezed within the 1.06–1.07 USDT range. There is significant buying pressure in the order book (Bids: 13.77M vs. Asks: 6.14M), and short-selling whales are sitting on losses—conditions are ripe for sweeping liquidity to the upside!
🟢 LONG (Main Scenario)
Entry: 1.0550 – 1.0650 USDT
Stop-Loss: 1.0380 USDT
Take-Profit: 1.0800 | 1.1000 USDT
🔴 SHORT (Counter-trend from resistance)
Entry: 1.0800 – 1.0950 USDT
Stop-Loss: 1.1120 USDT
Take-Profit: 1.0600 | 1.0450 USDT
⚠️ Don't forget risk management: leverage up to 10x, risk up to 2% per trade.
{future}(FILUSDT)
🚀 $FIL /USDT: Local Setup 📊
The price is squeezed within the 1.06–1.07 USDT range. There is significant buying pressure in the order book (Bids: 13.77M vs. Asks: 6.14M), and short-selling whales are sitting on losses—conditions are ripe for sweeping liquidity to the upside!
🟢 LONG (Main Scenario)
Entry: 1.0550 – 1.0650 USDT
Stop-Loss: 1.0380 USDT
Take-Profit: 1.0800 | 1.1000 USDT
🔴 SHORT (Counter-trend from resistance)
Entry: 1.0800 – 1.0950 USDT
Stop-Loss: 1.1120 USDT
Take-Profit: 1.0600 | 1.0450 USDT
⚠️ Don't forget risk management: leverage up to 10x, risk up to 2% per trade.
The price is squeezed within the 1.06–1.07 USDT range. There is significant buying pressure in the order book (Bids: 13.77M vs. Asks: 6.14M), and short-selling whales are sitting on losses—conditions are ripe for sweeping liquidity to the upside!
🟢 LONG (Main Scenario)
Entry: 1.0550 – 1.0650 USDT
Stop-Loss: 1.0380 USDT
Take-Profit: 1.0800 | 1.1000 USDT
🔴 SHORT (Counter-trend from resistance)
Entry: 1.0800 – 1.0950 USDT
Stop-Loss: 1.1120 USDT
Take-Profit: 1.0600 | 1.0450 USDT
⚠️ Don't forget risk management: leverage up to 10x, risk up to 2% per trade.
54
#zcash
⚡ Zcash ($ZEC ) has launched the NU7 upgrade on the testnet: 25-second blocks and a new economic model!
Zcash has activated the major NU7 (Network Upgrade 7) on the public testnet (at block height 4,465,026). The primary goal is to prepare for the full Mainnet launch scheduled for November 5, 2026.
🔑 Key NU7 changes:
➡️ 3x faster block times (ZIP 218): Block generation time has been reduced from 75 to 25 seconds. This will significantly speed up initial transaction confirmations—critical for POS terminals, exchanges, and cross-chain bridges.
Note: Total ZEC supply, the 21-million-coin cap, and the 4-year halving schedule remain unchanged.
➡️ Network resilience mechanism (ZIP 235 & 237): A special reserve is being introduced to ensure long-term network security.
60% of fees from each block are removed from circulation and placed into the reserve, while 40% go to miners.
The reserve periodically redistributes small portions of accumulated funds as an additional block reward. This ensures continued funding for miners even after traditional rewards are significantly reduced by halvings.
➡️ Optimization and spam protection: New limits have been established for private (shielded) transactions. The throughput of the Orchard protocol will more than double, and the potential load from spam attacks on light wallets will decrease by approximately 37%.
🗓 What’s next?
All node operators are urged to update their software and test NU7 on the testnet. A final decision regarding the Mainnet launch date will be made on October 20. If testing is successful, the update will be activated on the main network on November 5.
{future}(ZECUSDT)
#zcash
⚡ Zcash ($ZEC ) has launched the NU7 upgrade on the testnet: 25-second blocks and a new economic model!
Zcash has activated the major NU7 (Network Upgrade 7) on the public testnet (at block height 4,465,026). The primary goal is to prepare for the full Mainnet launch scheduled for November 5, 2026.
🔑 Key NU7 changes:
➡️ 3x faster block times (ZIP 218): Block generation time has been reduced from 75 to 25 seconds. This will significantly speed up initial transaction confirmations—critical for POS terminals, exchanges, and cross-chain bridges.
Note: Total ZEC supply, the 21-million-coin cap, and the 4-year halving schedule remain unchanged.
➡️ Network resilience mechanism (ZIP 235 & 237): A special reserve is being introduced to ensure long-term network security.
60% of fees from each block are removed from circulation and placed into the reserve, while 40% go to miners.
The reserve periodically redistributes small portions of accumulated funds as an additional block reward. This ensures continued funding for miners even after traditional rewards are significantly reduced by halvings.
➡️ Optimization and spam protection: New limits have been established for private (shielded) transactions. The throughput of the Orchard protocol will more than double, and the potential load from spam attacks on light wallets will decrease by approximately 37%.
🗓 What’s next?
All node operators are urged to update their software and test NU7 on the testnet. A final decision regarding the Mainnet launch date will be made on October 20. If testing is successful, the update will be activated on the main network on November 5.
⚡ Zcash ($ZEC ) has launched the NU7 upgrade on the testnet: 25-second blocks and a new economic model!
Zcash has activated the major NU7 (Network Upgrade 7) on the public testnet (at block height 4,465,026). The primary goal is to prepare for the full Mainnet launch scheduled for November 5, 2026.
🔑 Key NU7 changes:
➡️ 3x faster block times (ZIP 218): Block generation time has been reduced from 75 to 25 seconds. This will significantly speed up initial transaction confirmations—critical for POS terminals, exchanges, and cross-chain bridges.
Note: Total ZEC supply, the 21-million-coin cap, and the 4-year halving schedule remain unchanged.
➡️ Network resilience mechanism (ZIP 235 & 237): A special reserve is being introduced to ensure long-term network security.
60% of fees from each block are removed from circulation and placed into the reserve, while 40% go to miners.
The reserve periodically redistributes small portions of accumulated funds as an additional block reward. This ensures continued funding for miners even after traditional rewards are significantly reduced by halvings.
➡️ Optimization and spam protection: New limits have been established for private (shielded) transactions. The throughput of the Orchard protocol will more than double, and the potential load from spam attacks on light wallets will decrease by approximately 37%.
🗓 What’s next?
All node operators are urged to update their software and test NU7 on the testnet. A final decision regarding the Mainnet launch date will be made on October 20. If testing is successful, the update will be activated on the main network on November 5.
50
#Near
🚀 $NEAR Protocol: Will the rally continue after the reversal?
After an impressive rally from $1.60 in August to over $5.00, the NEAR token entered a consolidation phase. However, buyers continue to buy the dips.
🔍 What’s happening on the chart?
Bounce from $4.70: Sellers' attempts to deepen the correction stalled. Bulls regained the initiative and pushed the price back above the $5.00 mark.
RSI Cooling Off: The Relative Strength Index has cooled down from the overheated overbought zone and reset without significantly losing the gains made. This is a healthy signal for further movement.
Trend Stronger Than Correction: The price is trading well above key moving averages (MAs).
‼️ Key levels to watch:
➡️ Resistance ($5.40 – $5.60): NEAR has faced rejection at the $5.00+ level several times, evidenced by long upper wicks. A daily candle close above $5.60 would confirm readiness to push toward $6.00 and beyond.
➡️ Support ($4.60): Losing this zone would weaken the bullish reversal scenario and open the path to $4.20.
⚠️ Conclusion: From a technical standpoint, the NEAR rally is not yet exhausted. However, following a +200% surge, the token's future trajectory depends on whether buyers can flip the $5.40–$5.60 resistance zone into solid support.
{future}(NEARUSDT)
#Near
🚀 $NEAR Protocol: Will the rally continue after the reversal?
After an impressive rally from $1.60 in August to over $5.00, the NEAR token entered a consolidation phase. However, buyers continue to buy the dips.
🔍 What’s happening on the chart?
Bounce from $4.70: Sellers' attempts to deepen the correction stalled. Bulls regained the initiative and pushed the price back above the $5.00 mark.
RSI Cooling Off: The Relative Strength Index has cooled down from the overheated overbought zone and reset without significantly losing the gains made. This is a healthy signal for further movement.
Trend Stronger Than Correction: The price is trading well above key moving averages (MAs).
‼️ Key levels to watch:
➡️ Resistance ($5.40 – $5.60): NEAR has faced rejection at the $5.00+ level several times, evidenced by long upper wicks. A daily candle close above $5.60 would confirm readiness to push toward $6.00 and beyond.
➡️ Support ($4.60): Losing this zone would weaken the bullish reversal scenario and open the path to $4.20.
⚠️ Conclusion: From a technical standpoint, the NEAR rally is not yet exhausted. However, following a +200% surge, the token's future trajectory depends on whether buyers can flip the $5.40–$5.60 resistance zone into solid support.
🚀 $NEAR Protocol: Will the rally continue after the reversal?
After an impressive rally from $1.60 in August to over $5.00, the NEAR token entered a consolidation phase. However, buyers continue to buy the dips.
🔍 What’s happening on the chart?
Bounce from $4.70: Sellers' attempts to deepen the correction stalled. Bulls regained the initiative and pushed the price back above the $5.00 mark.
RSI Cooling Off: The Relative Strength Index has cooled down from the overheated overbought zone and reset without significantly losing the gains made. This is a healthy signal for further movement.
Trend Stronger Than Correction: The price is trading well above key moving averages (MAs).
‼️ Key levels to watch:
➡️ Resistance ($5.40 – $5.60): NEAR has faced rejection at the $5.00+ level several times, evidenced by long upper wicks. A daily candle close above $5.60 would confirm readiness to push toward $6.00 and beyond.
➡️ Support ($4.60): Losing this zone would weaken the bullish reversal scenario and open the path to $4.20.
⚠️ Conclusion: From a technical standpoint, the NEAR rally is not yet exhausted. However, following a +200% surge, the token's future trajectory depends on whether buyers can flip the $5.40–$5.60 resistance zone into solid support.

73
#GrowthFall
📈⏱️ Growth/Fall 24h 📉
📊 Futures Market Update 📊
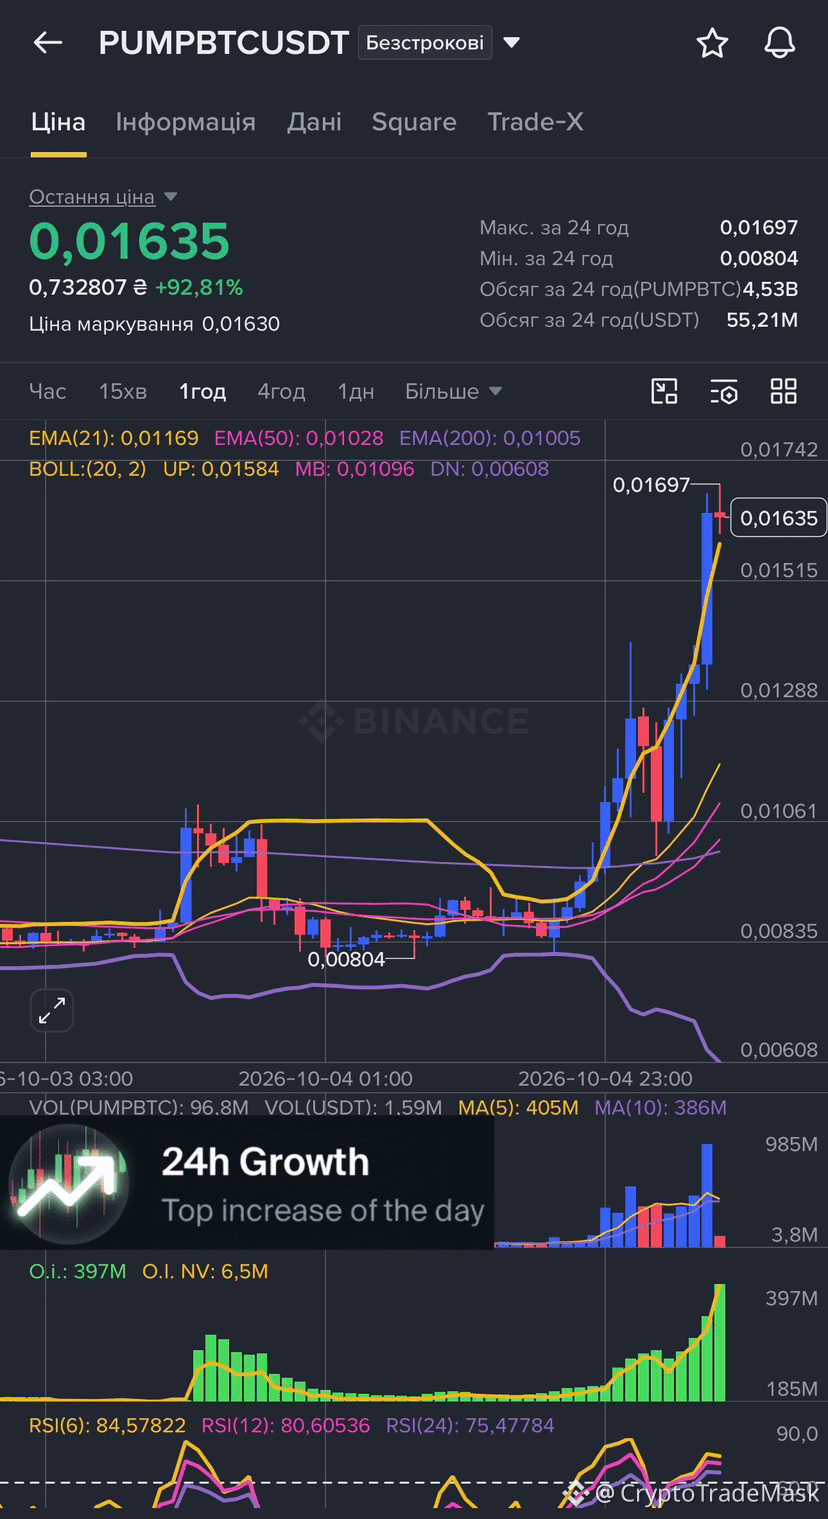
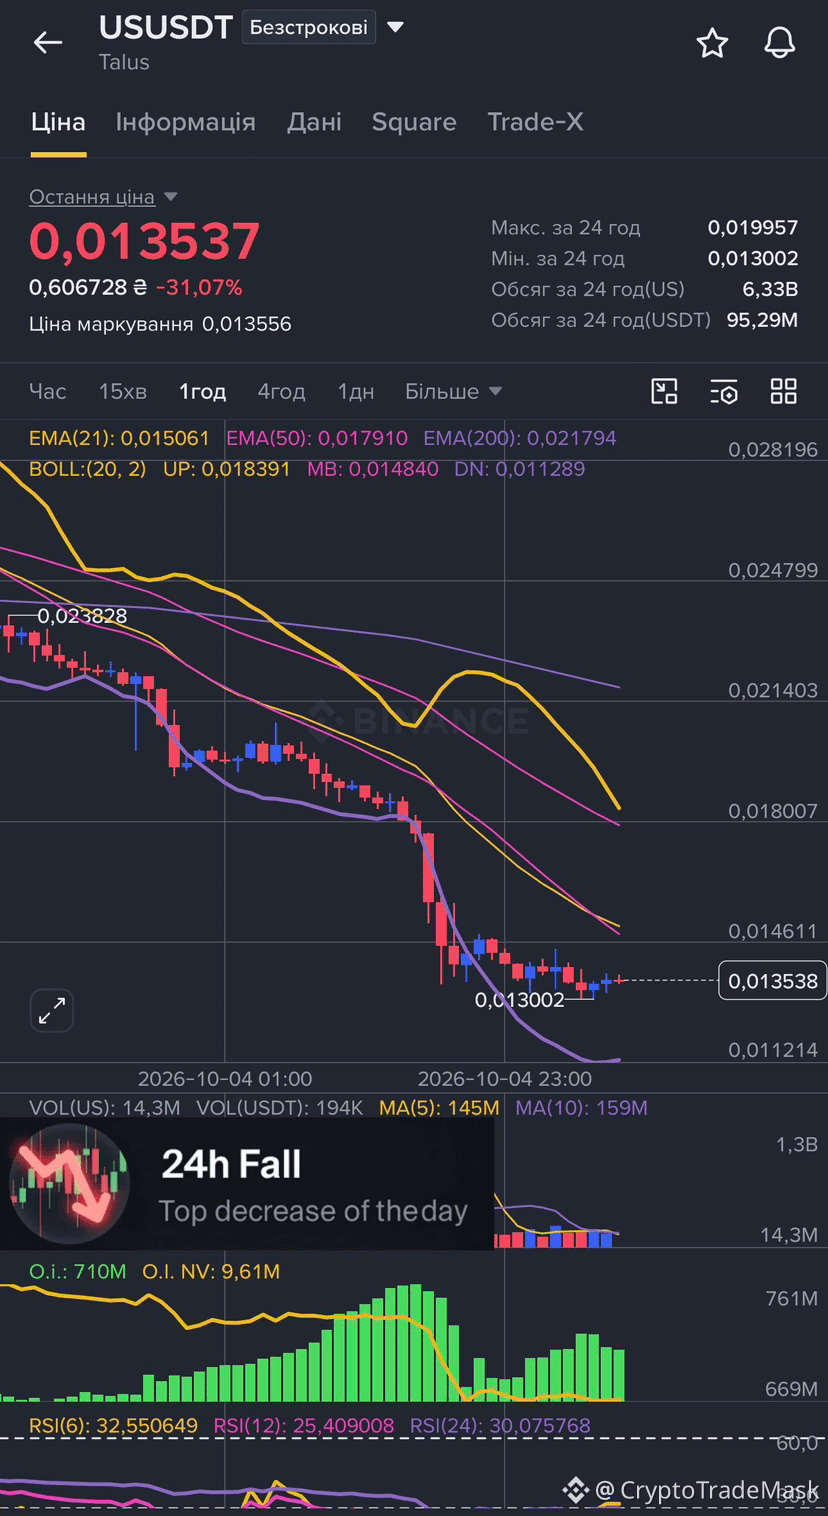
$PUMPBTC $US
🚀 Over the past 24 hours, the market has shown strong fluctuations.
🔻 Some coins fell, others gave rapid growth - volatility at its maximum.
⚠️ Reminder:
• High volatility = high risk = potentially large profits.
• Always set a stop-loss.
• Risk management is the key to stable trading.
💹 Keep your finger on the pulse of the market! DYOR
{future}(USUSDT)
{future}(PUMPBTCUSDT)
#GrowthFall
📈⏱️ Growth/Fall 24h 📉
📊 Futures Market Update 📊
$PUMPBTC $US
🚀 Over the past 24 hours, the market has shown strong fluctuations.
🔻 Some coins fell, others gave rapid growth - volatility at its maximum.
⚠️ Reminder:
• High volatility = high risk = potentially large profits.
• Always set a stop-loss.
• Risk management is the key to stable trading.
💹 Keep your finger on the pulse of the market! DYOR
📈⏱️ Growth/Fall 24h 📉
📊 Futures Market Update 📊
$PUMPBTC $US
🚀 Over the past 24 hours, the market has shown strong fluctuations.
🔻 Some coins fell, others gave rapid growth - volatility at its maximum.
⚠️ Reminder:
• High volatility = high risk = potentially large profits.
• Always set a stop-loss.
• Risk management is the key to stable trading.
💹 Keep your finger on the pulse of the market! DYOR
119
#Dogecoin
Market Analysis: Dogecoin ($DOGE ) Pressing Against Local Sideways Range, Preparing for a Rebound 📊🐕
The September rally, which peaked locally at $0.1056, gave way to a correction down to $0.0940. While institutional and futures demand remains weak, a clear pattern is forming on the chart that suggests a potential local recovery.
📊 Key Takeaways & On-Chain Metrics:
ETFs and Futures: Inflows into spot DOGE ETFs for September totaled just $3.16M (for comparison: ZEC ETFs saw $245M, XRP $121M). Futures Open Interest dropped from a September peak of $1.65B to $1.45B.
Capital Rotation: Liquidity is shifting toward sectors with strong fundamentals—privacy tokens (ZEC) and artificial intelligence (NEAR, WLD).
Technical Status: The price is holding above the 50 EMA on the 4-hour chart, having formed a classic Bullish Flag pattern.
🎯 Technical Target and Scenario:
Immediate Resistance: The psychological level of $0.100.
Setup Confirmation: Breaking and holding above the upper boundary of the flag's descending channel.
Bullish Scenario Invalidation: Breaking below the channel's lower boundary and losing support in the $0.090–$0.093 range.
{future}(DOGEUSDT)
#Dogecoin
Market Analysis: Dogecoin ($DOGE ) Pressing Against Local Sideways Range, Preparing for a Rebound 📊🐕
The September rally, which peaked locally at $0.1056, gave way to a correction down to $0.0940. While institutional and futures demand remains weak, a clear pattern is forming on the chart that suggests a potential local recovery.
📊 Key Takeaways & On-Chain Metrics:
ETFs and Futures: Inflows into spot DOGE ETFs for September totaled just $3.16M (for comparison: ZEC ETFs saw $245M, XRP $121M). Futures Open Interest dropped from a September peak of $1.65B to $1.45B.
Capital Rotation: Liquidity is shifting toward sectors with strong fundamentals—privacy tokens (ZEC) and artificial intelligence (NEAR, WLD).
Technical Status: The price is holding above the 50 EMA on the 4-hour chart, having formed a classic Bullish Flag pattern.
🎯 Technical Target and Scenario:
Immediate Resistance: The psychological level of $0.100.
Setup Confirmation: Breaking and holding above the upper boundary of the flag's descending channel.
Bullish Scenario Invalidation: Breaking below the channel's lower boundary and losing support in the $0.090–$0.093 range.
Market Analysis: Dogecoin ($DOGE ) Pressing Against Local Sideways Range, Preparing for a Rebound 📊🐕
The September rally, which peaked locally at $0.1056, gave way to a correction down to $0.0940. While institutional and futures demand remains weak, a clear pattern is forming on the chart that suggests a potential local recovery.
📊 Key Takeaways & On-Chain Metrics:
ETFs and Futures: Inflows into spot DOGE ETFs for September totaled just $3.16M (for comparison: ZEC ETFs saw $245M, XRP $121M). Futures Open Interest dropped from a September peak of $1.65B to $1.45B.
Capital Rotation: Liquidity is shifting toward sectors with strong fundamentals—privacy tokens (ZEC) and artificial intelligence (NEAR, WLD).
Technical Status: The price is holding above the 50 EMA on the 4-hour chart, having formed a classic Bullish Flag pattern.
🎯 Technical Target and Scenario:
Immediate Resistance: The psychological level of $0.100.
Setup Confirmation: Breaking and holding above the upper boundary of the flag's descending channel.
Bullish Scenario Invalidation: Breaking below the channel's lower boundary and losing support in the $0.090–$0.093 range.

1
43
#UMA
🔮 Why should you pay attention to $UMA ? 3 key growth factors
The $UMA project (Optimistic Oracle) develops infrastructure for prediction markets and DeFi, enabling real-world data verification without centralized intermediaries.
📊 Here are three main reasons why this oracle has strong prospects:
1️⃣ Polymarket dominance and expanding brand reach
UMA’s Optimistic Oracle is the "heart" of the Polymarket prediction market. In the first quarter of 2025 alone, the oracle processed over 7,000 requests and resolved disputes involving $1 billion. Polymarket’s official X (Twitter) account regularly posts content about UMA’s mechanics, continuously boosting the project's visibility.
2️⃣ Technological upgrade: Launch of MOOV2
In 2025, UMA unveiled the Managed Optimistic Oracle V2 (MOOV2) update, which allows for the deployment of custom oracles in minutes without writing code. Furthermore, the updated token-burning mechanism—triggered by every dispute resolution—creates deflationary pressure on UMA's supply.
3️⃣ Revenue and staking growth
In the first quarter of 2026, protocol revenue hit a record $520,000, and staking volumes continue to rise. Additionally, the integration ecosystem is expanding; the UMA oracle has been integrated into advanced markets on Hyperliquid.
⚠️ Conclusion: $UMA is not merely a utility token but the foundation for the world's largest prediction market. Revenue growth, token burns, and new integrations make it one of the most compelling assets in the infrastructure sector.
{future}(UMAUSDT)
#UMA
🔮 Why should you pay attention to $UMA ? 3 key growth factors
The $UMA project (Optimistic Oracle) develops infrastructure for prediction markets and DeFi, enabling real-world data verification without centralized intermediaries.
📊 Here are three main reasons why this oracle has strong prospects:
1️⃣ Polymarket dominance and expanding brand reach
UMA’s Optimistic Oracle is the "heart" of the Polymarket prediction market. In the first quarter of 2025 alone, the oracle processed over 7,000 requests and resolved disputes involving $1 billion. Polymarket’s official X (Twitter) account regularly posts content about UMA’s mechanics, continuously boosting the project's visibility.
2️⃣ Technological upgrade: Launch of MOOV2
In 2025, UMA unveiled the Managed Optimistic Oracle V2 (MOOV2) update, which allows for the deployment of custom oracles in minutes without writing code. Furthermore, the updated token-burning mechanism—triggered by every dispute resolution—creates deflationary pressure on UMA's supply.
3️⃣ Revenue and staking growth
In the first quarter of 2026, protocol revenue hit a record $520,000, and staking volumes continue to rise. Additionally, the integration ecosystem is expanding; the UMA oracle has been integrated into advanced markets on Hyperliquid.
⚠️ Conclusion: $UMA is not merely a utility token but the foundation for the world's largest prediction market. Revenue growth, token burns, and new integrations make it one of the most compelling assets in the infrastructure sector.
🔮 Why should you pay attention to $UMA ? 3 key growth factors
The $UMA project (Optimistic Oracle) develops infrastructure for prediction markets and DeFi, enabling real-world data verification without centralized intermediaries.
📊 Here are three main reasons why this oracle has strong prospects:
1️⃣ Polymarket dominance and expanding brand reach
UMA’s Optimistic Oracle is the "heart" of the Polymarket prediction market. In the first quarter of 2025 alone, the oracle processed over 7,000 requests and resolved disputes involving $1 billion. Polymarket’s official X (Twitter) account regularly posts content about UMA’s mechanics, continuously boosting the project's visibility.
2️⃣ Technological upgrade: Launch of MOOV2
In 2025, UMA unveiled the Managed Optimistic Oracle V2 (MOOV2) update, which allows for the deployment of custom oracles in minutes without writing code. Furthermore, the updated token-burning mechanism—triggered by every dispute resolution—creates deflationary pressure on UMA's supply.
3️⃣ Revenue and staking growth
In the first quarter of 2026, protocol revenue hit a record $520,000, and staking volumes continue to rise. Additionally, the integration ecosystem is expanding; the UMA oracle has been integrated into advanced markets on Hyperliquid.
⚠️ Conclusion: $UMA is not merely a utility token but the foundation for the world's largest prediction market. Revenue growth, token burns, and new integrations make it one of the most compelling assets in the infrastructure sector.
1
129
#ThetaFuel
🚀 The Future of Theta Fuel ($TFUEL ): 3 Key Growth Factors for 2026
Theta Fuel ($TFUEL ) remains the native "fuel" of the Theta Network, and significant technological upgrades lie ahead. Here are the main drivers that could positively impact TFUEL's value and demand in 2026:
1️⃣ Generative AI (Early 2026)
The Concept: The network is introducing support for Large Language Models (LLMs). Developers and companies will be able to deploy and train AI models using decentralized computing power.
Impact on TFUEL: All transactions and computations will be paid for in TFUEL, enhancing its network utility. A portion of the fees will be burned, while the rest will be distributed among node operators, supporting the token's price.
2️⃣ Crypto Gaming (2026)
The Concept: One of Theta's main areas of focus in 2026 is the Web3 gaming sector. New gaming projects are launching where players can earn real rewards for in-game achievements.
Impact on TFUEL: Players will withdraw rewards directly in TFUEL, creating a steady stream of transactions. The more active players the platform attracts, the higher the demand for the token will be.
3️⃣ Partnerships and institutional support
Essence: Theta continues to expand its ecosystem through collaborations with major technology and crypto companies (e.g., the partnership with ZAN to develop EdgeCloud).
Impact on TFUEL: Attracting corporate partners increases overall EdgeCloud usage. Higher network load translates to a greater volume of TFUEL burning and stable payouts to stakers.
⚠️ Summary: Theta Fuel remains directly linked to the activity and popularity of the Theta Network. The launch of AI tools, the expansion of the gaming segment, and partnerships in 2026 create a solid foundation for growth.
{spot}(TFUELUSDT)
#ThetaFuel
🚀 The Future of Theta Fuel ($TFUEL ): 3 Key Growth Factors for 2026
Theta Fuel ($TFUEL ) remains the native "fuel" of the Theta Network, and significant technological upgrades lie ahead. Here are the main drivers that could positively impact TFUEL's value and demand in 2026:
1️⃣ Generative AI (Early 2026)
The Concept: The network is introducing support for Large Language Models (LLMs). Developers and companies will be able to deploy and train AI models using decentralized computing power.
Impact on TFUEL: All transactions and computations will be paid for in TFUEL, enhancing its network utility. A portion of the fees will be burned, while the rest will be distributed among node operators, supporting the token's price.
2️⃣ Crypto Gaming (2026)
The Concept: One of Theta's main areas of focus in 2026 is the Web3 gaming sector. New gaming projects are launching where players can earn real rewards for in-game achievements.
Impact on TFUEL: Players will withdraw rewards directly in TFUEL, creating a steady stream of transactions. The more active players the platform attracts, the higher the demand for the token will be.
3️⃣ Partnerships and institutional support
Essence: Theta continues to expand its ecosystem through collaborations with major technology and crypto companies (e.g., the partnership with ZAN to develop EdgeCloud).
Impact on TFUEL: Attracting corporate partners increases overall EdgeCloud usage. Higher network load translates to a greater volume of TFUEL burning and stable payouts to stakers.
⚠️ Summary: Theta Fuel remains directly linked to the activity and popularity of the Theta Network. The launch of AI tools, the expansion of the gaming segment, and partnerships in 2026 create a solid foundation for growth.
🚀 The Future of Theta Fuel ($TFUEL ): 3 Key Growth Factors for 2026
Theta Fuel ($TFUEL ) remains the native "fuel" of the Theta Network, and significant technological upgrades lie ahead. Here are the main drivers that could positively impact TFUEL's value and demand in 2026:
1️⃣ Generative AI (Early 2026)
The Concept: The network is introducing support for Large Language Models (LLMs). Developers and companies will be able to deploy and train AI models using decentralized computing power.
Impact on TFUEL: All transactions and computations will be paid for in TFUEL, enhancing its network utility. A portion of the fees will be burned, while the rest will be distributed among node operators, supporting the token's price.
2️⃣ Crypto Gaming (2026)
The Concept: One of Theta's main areas of focus in 2026 is the Web3 gaming sector. New gaming projects are launching where players can earn real rewards for in-game achievements.
Impact on TFUEL: Players will withdraw rewards directly in TFUEL, creating a steady stream of transactions. The more active players the platform attracts, the higher the demand for the token will be.
3️⃣ Partnerships and institutional support
Essence: Theta continues to expand its ecosystem through collaborations with major technology and crypto companies (e.g., the partnership with ZAN to develop EdgeCloud).
Impact on TFUEL: Attracting corporate partners increases overall EdgeCloud usage. Higher network load translates to a greater volume of TFUEL burning and stable payouts to stakers.
⚠️ Summary: Theta Fuel remains directly linked to the activity and popularity of the Theta Network. The launch of AI tools, the expansion of the gaming segment, and partnerships in 2026 create a solid foundation for growth.
1
33
🚀 $DEXE /USDT: Order Book and Whale Position Analysis
DEXE is trading within a tight range of $1.80 -$2.00. Analysis of liquidity and the actions of major players indicates clear boundaries for this sideways movement:
📊 What the metrics show:
Support: A strong buyer zone has formed on the heatmap in the $1.75 - $1.80 range.
Resistance: Over 130 whales hold short positions with an average entry price of ~$2.005 (78% in profit), creating a powerful sell wall at the $1.98 – $2.05 level.
Delta & OI: Spot CVD remains negative, while Open Interest has stabilized (~3.64M) - the market is awaiting momentum.
🚦 Trading Scenarios:
🟢 LONG (from the lower boundary):
Entry: $1.800 - $1.820
Take-profits: $1.890 / $1.970
Stop-loss: $1.745
🔴 SHORT (from the resistance zone):
Entry: $1.970 - $2.000
Take-profits: $1.890 / $1.810
Stop-loss: $2.055
⚠️ Priority: Trade the range boundaries while strictly adhering to risk management.
{future}(DEXEUSDT)
🚀 $DEXE /USDT: Order Book and Whale Position Analysis
DEXE is trading within a tight range of $1.80 -$2.00. Analysis of liquidity and the actions of major players indicates clear boundaries for this sideways movement:
📊 What the metrics show:
Support: A strong buyer zone has formed on the heatmap in the $1.75 - $1.80 range.
Resistance: Over 130 whales hold short positions with an average entry price of ~$2.005 (78% in profit), creating a powerful sell wall at the $1.98 – $2.05 level.
Delta & OI: Spot CVD remains negative, while Open Interest has stabilized (~3.64M) - the market is awaiting momentum.
🚦 Trading Scenarios:
🟢 LONG (from the lower boundary):
Entry: $1.800 - $1.820
Take-profits: $1.890 / $1.970
Stop-loss: $1.745
🔴 SHORT (from the resistance zone):
Entry: $1.970 - $2.000
Take-profits: $1.890 / $1.810
Stop-loss: $2.055
⚠️ Priority: Trade the range boundaries while strictly adhering to risk management.
DEXE is trading within a tight range of $1.80 -$2.00. Analysis of liquidity and the actions of major players indicates clear boundaries for this sideways movement:
📊 What the metrics show:
Support: A strong buyer zone has formed on the heatmap in the $1.75 - $1.80 range.
Resistance: Over 130 whales hold short positions with an average entry price of ~$2.005 (78% in profit), creating a powerful sell wall at the $1.98 – $2.05 level.
Delta & OI: Spot CVD remains negative, while Open Interest has stabilized (~3.64M) - the market is awaiting momentum.
🚦 Trading Scenarios:
🟢 LONG (from the lower boundary):
Entry: $1.800 - $1.820
Take-profits: $1.890 / $1.970
Stop-loss: $1.745
🔴 SHORT (from the resistance zone):
Entry: $1.970 - $2.000
Take-profits: $1.890 / $1.810
Stop-loss: $2.055
⚠️ Priority: Trade the range boundaries while strictly adhering to risk management.
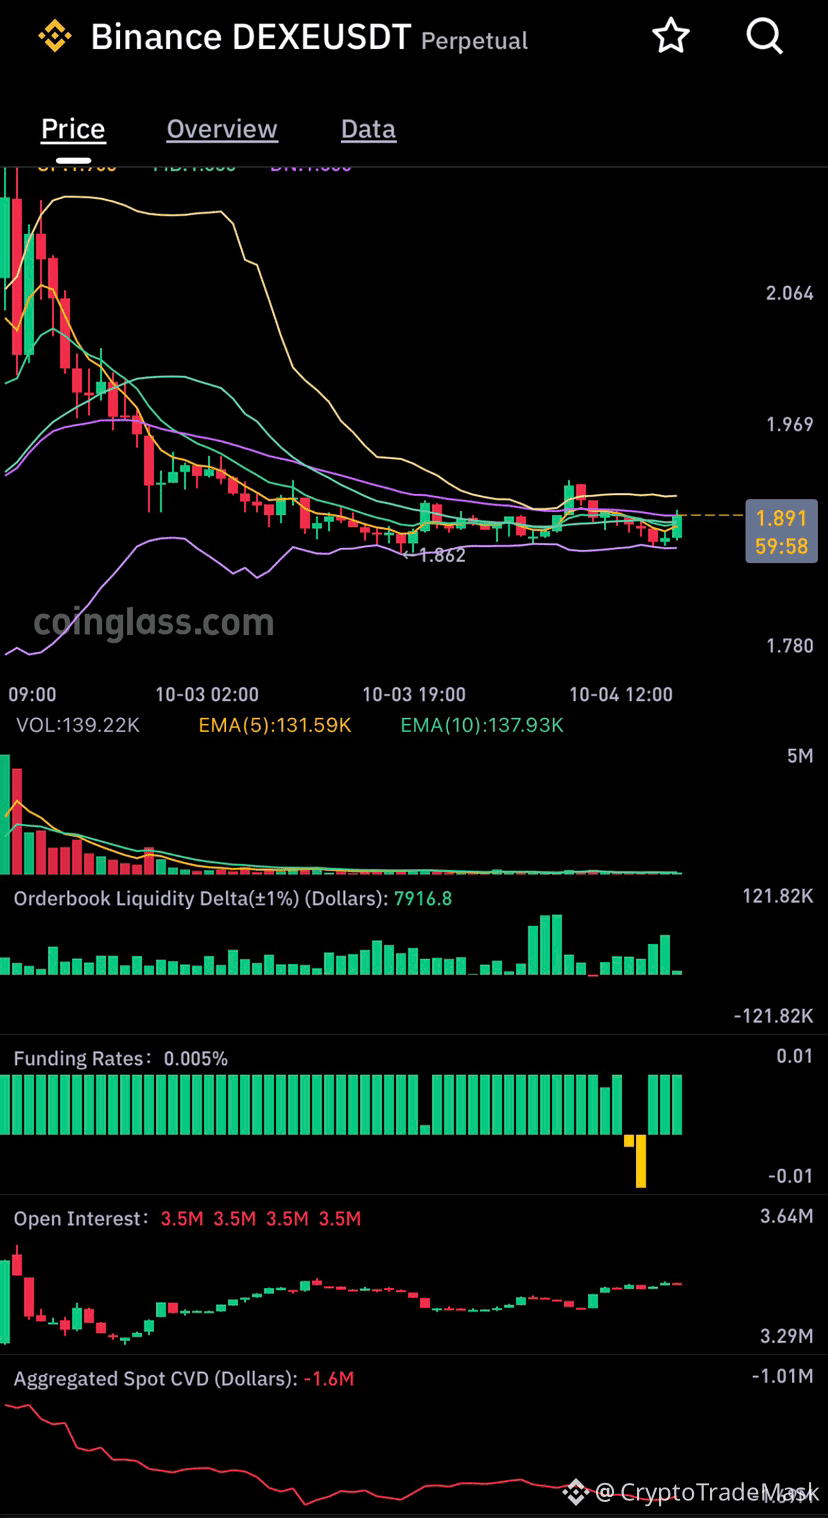
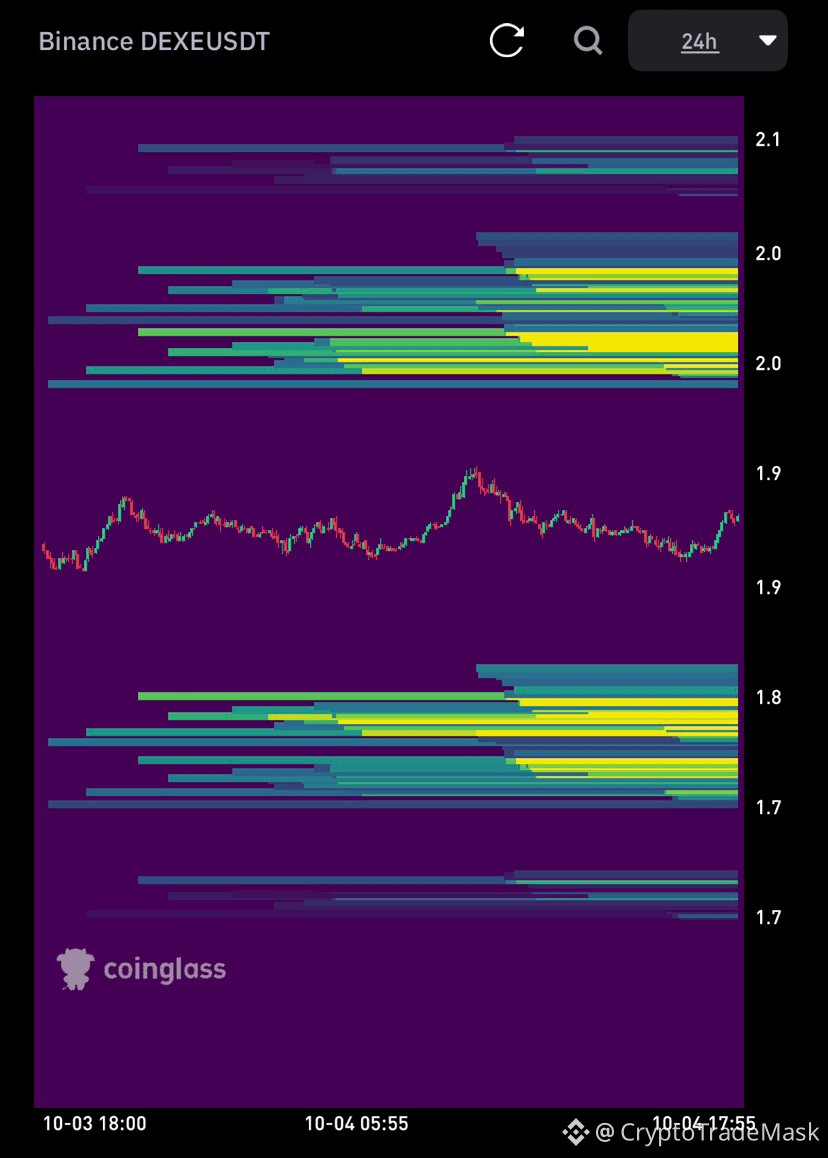
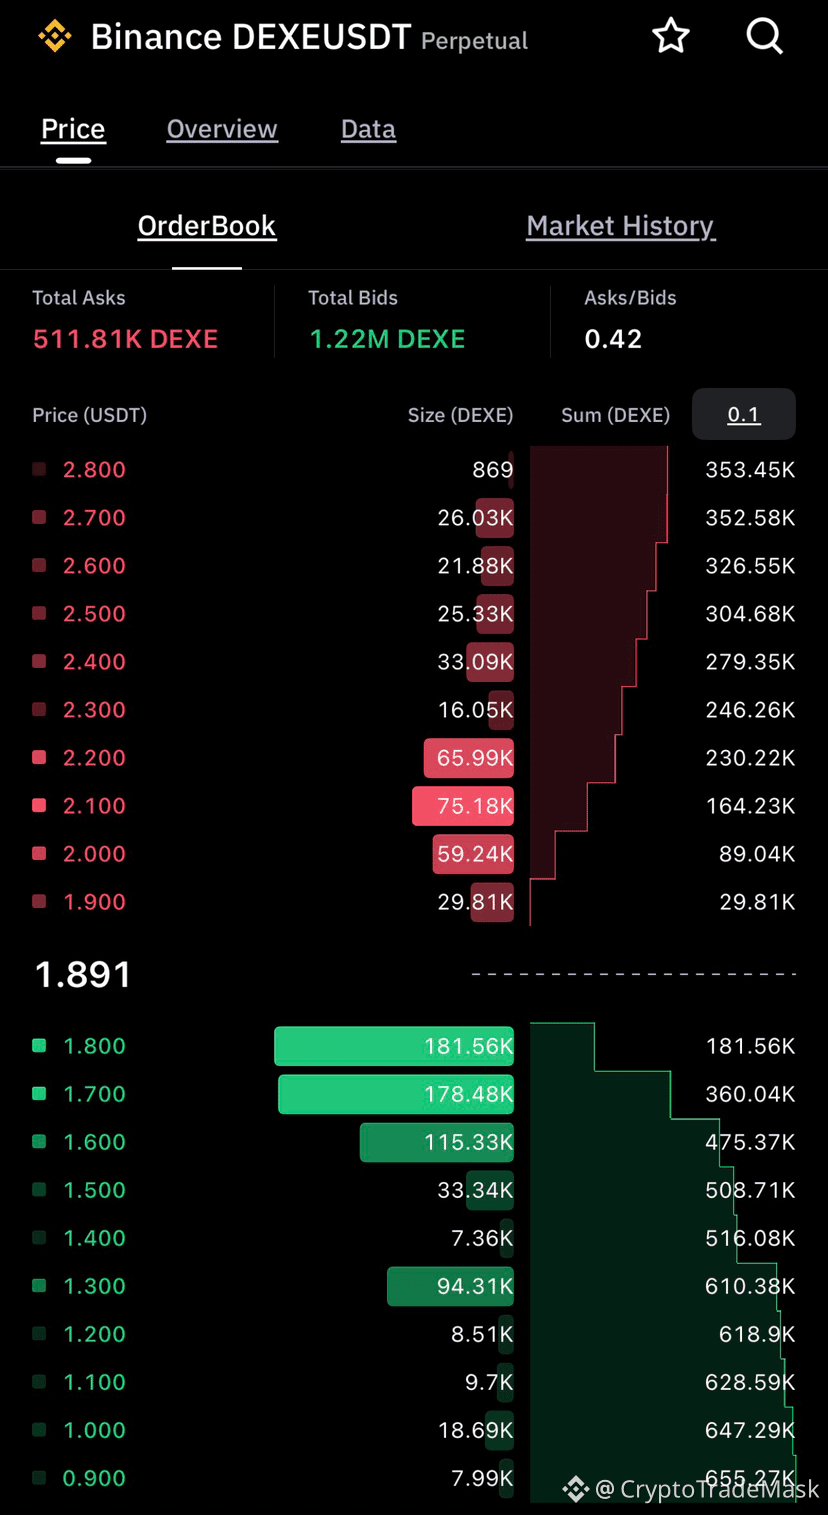
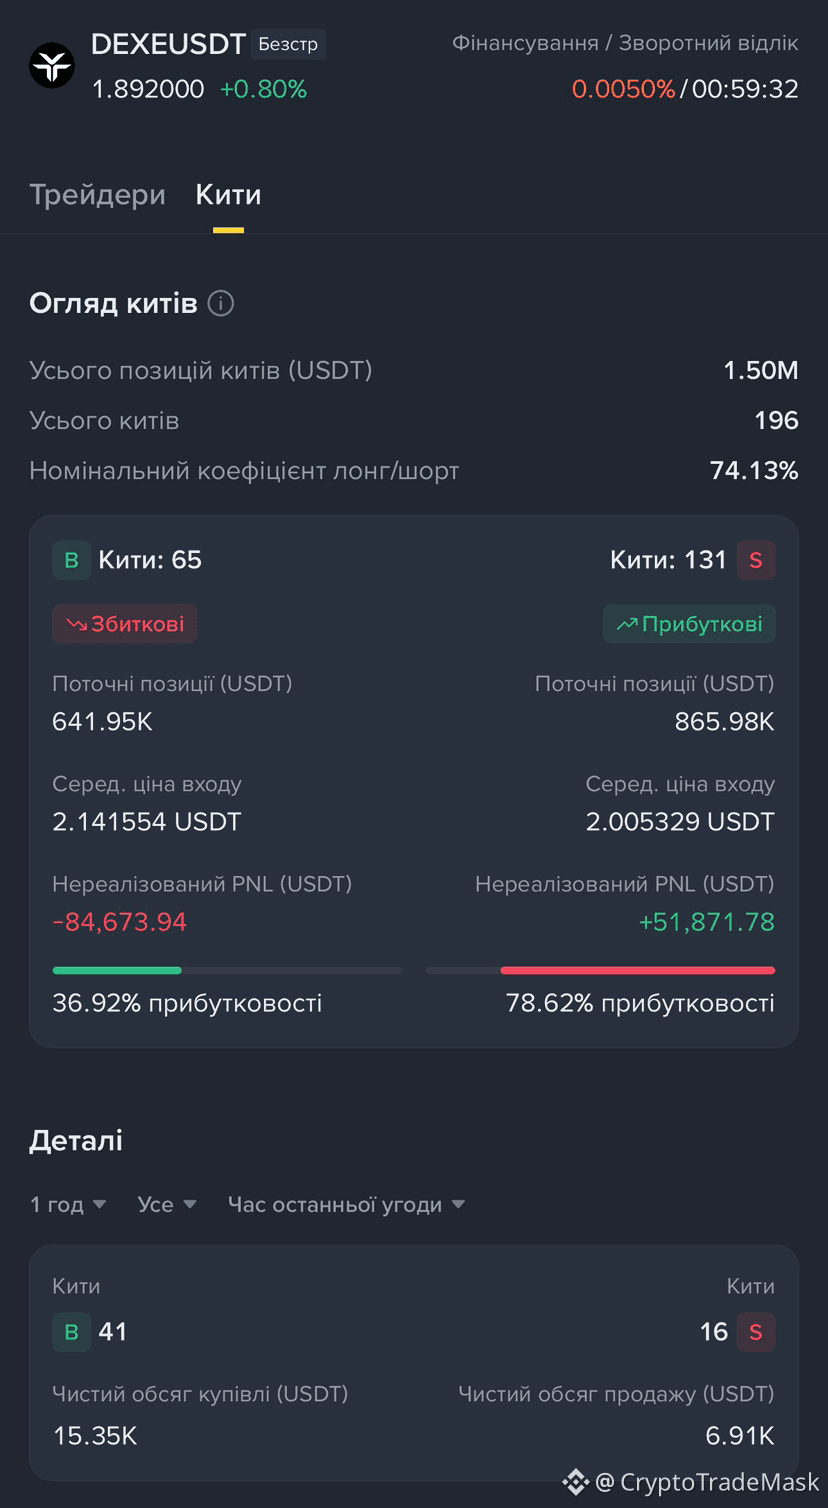
37
🚀 Technical and On-Chain Overview: $ENA /USDT
The current price of $0.2371 is in a consolidation zone following a pullback from the $0.2947 peak. On-chain metrics and the order book indicate that buyers retain the advantage.
📊 Key Observations:
Order Book: Bids significantly outweigh Asks (91.4M vs. 45.63M ENA); major buyer support is established at $0.2300 and $0.2200.
Whale Positions: The Long/Short ratio stands at 186.84%. The average whale entry price for long positions is $0.2287, and net buying volume has exceeded selling volume over the last hour.
Liquidity Map: Major liquidity pools are located at $0.2349–$0.2312 (support) and $0.2423–$0.2498 (resistance).
🟢 Trading Plan (LONG)
Entry Zone: $0.2320 – $0.2370
Stop Loss: $0.2260
Take Profit: $0.2420 / $0.2490 / $0.2590
⚠️ Don't forget risk management (no more than 1–2% of your deposit per trade).
{future}(ENAUSDT)
🚀 Technical and On-Chain Overview: $ENA /USDT
The current price of $0.2371 is in a consolidation zone following a pullback from the $0.2947 peak. On-chain metrics and the order book indicate that buyers retain the advantage.
📊 Key Observations:
Order Book: Bids significantly outweigh Asks (91.4M vs. 45.63M ENA); major buyer support is established at $0.2300 and $0.2200.
Whale Positions: The Long/Short ratio stands at 186.84%. The average whale entry price for long positions is $0.2287, and net buying volume has exceeded selling volume over the last hour.
Liquidity Map: Major liquidity pools are located at $0.2349–$0.2312 (support) and $0.2423–$0.2498 (resistance).
🟢 Trading Plan (LONG)
Entry Zone: $0.2320 – $0.2370
Stop Loss: $0.2260
Take Profit: $0.2420 / $0.2490 / $0.2590
⚠️ Don't forget risk management (no more than 1–2% of your deposit per trade).
The current price of $0.2371 is in a consolidation zone following a pullback from the $0.2947 peak. On-chain metrics and the order book indicate that buyers retain the advantage.
📊 Key Observations:
Order Book: Bids significantly outweigh Asks (91.4M vs. 45.63M ENA); major buyer support is established at $0.2300 and $0.2200.
Whale Positions: The Long/Short ratio stands at 186.84%. The average whale entry price for long positions is $0.2287, and net buying volume has exceeded selling volume over the last hour.
Liquidity Map: Major liquidity pools are located at $0.2349–$0.2312 (support) and $0.2423–$0.2498 (resistance).
🟢 Trading Plan (LONG)
Entry Zone: $0.2320 – $0.2370
Stop Loss: $0.2260
Take Profit: $0.2420 / $0.2490 / $0.2590
⚠️ Don't forget risk management (no more than 1–2% of your deposit per trade).
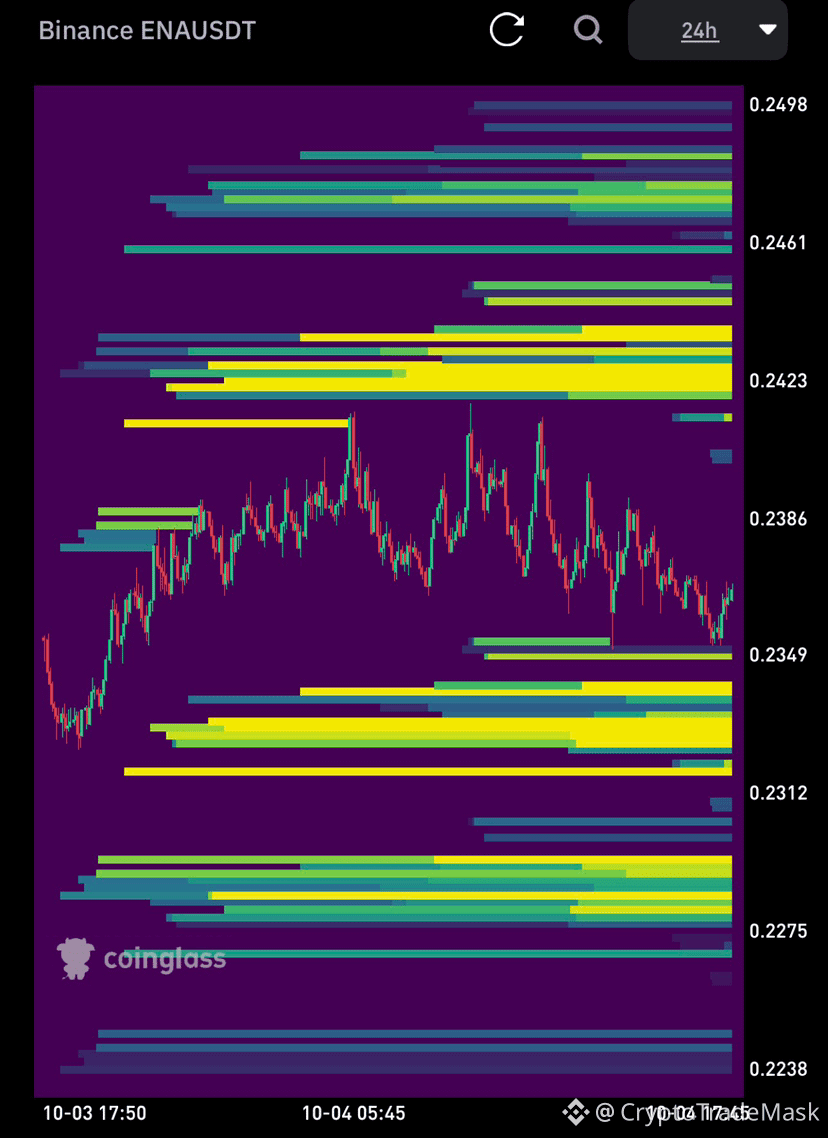
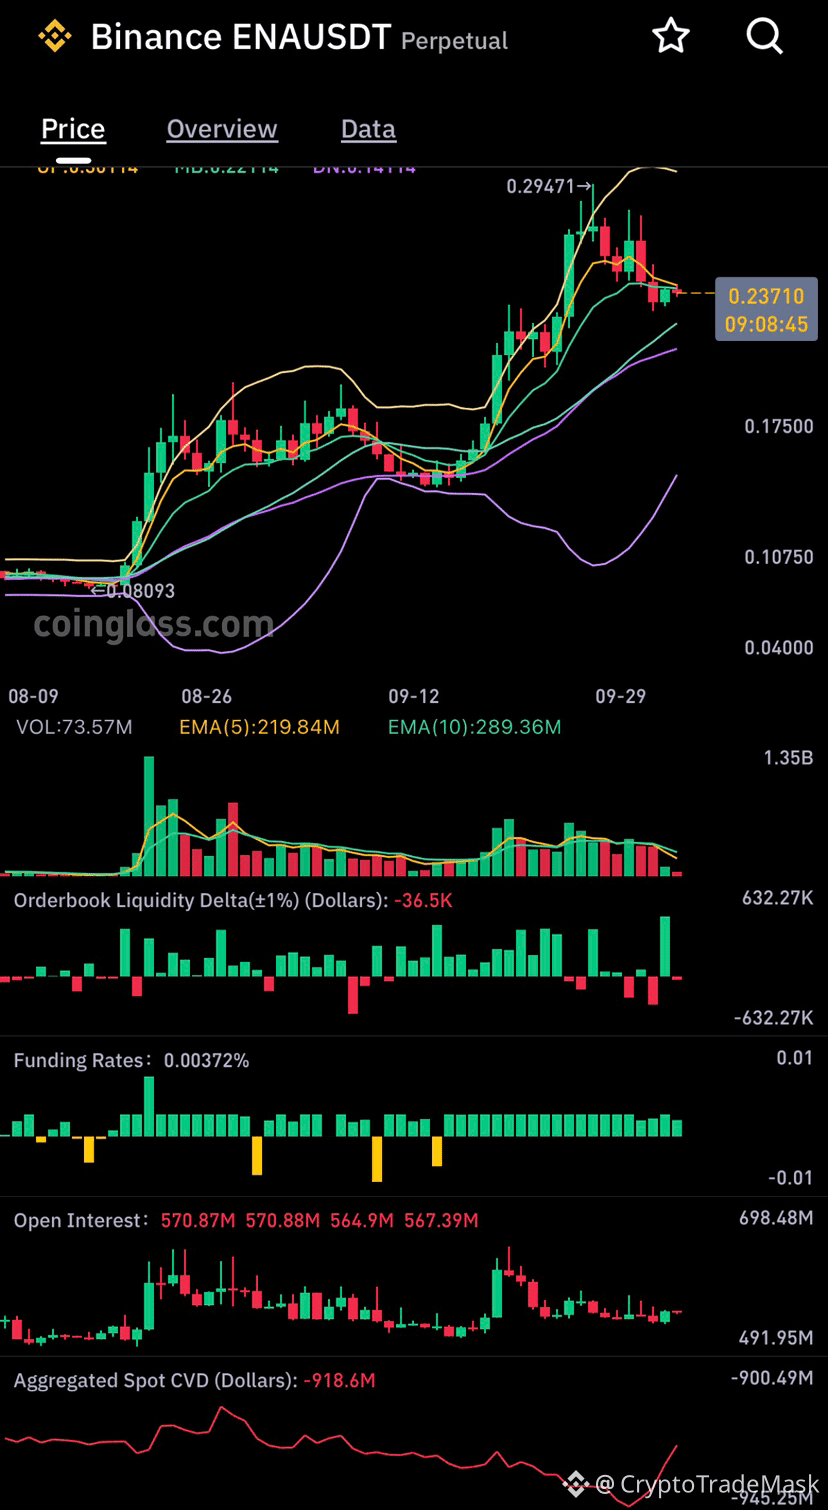
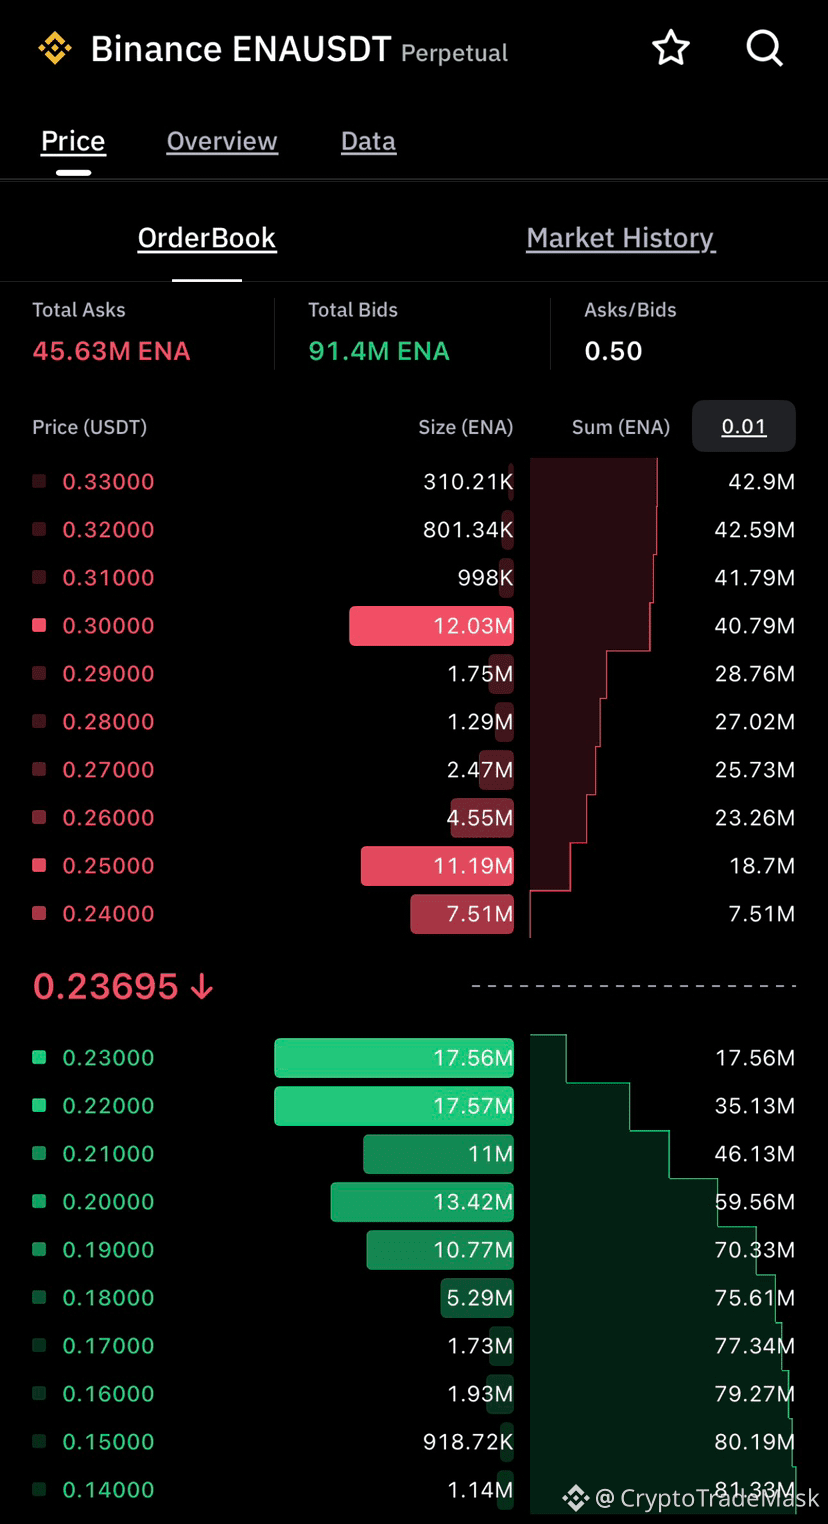
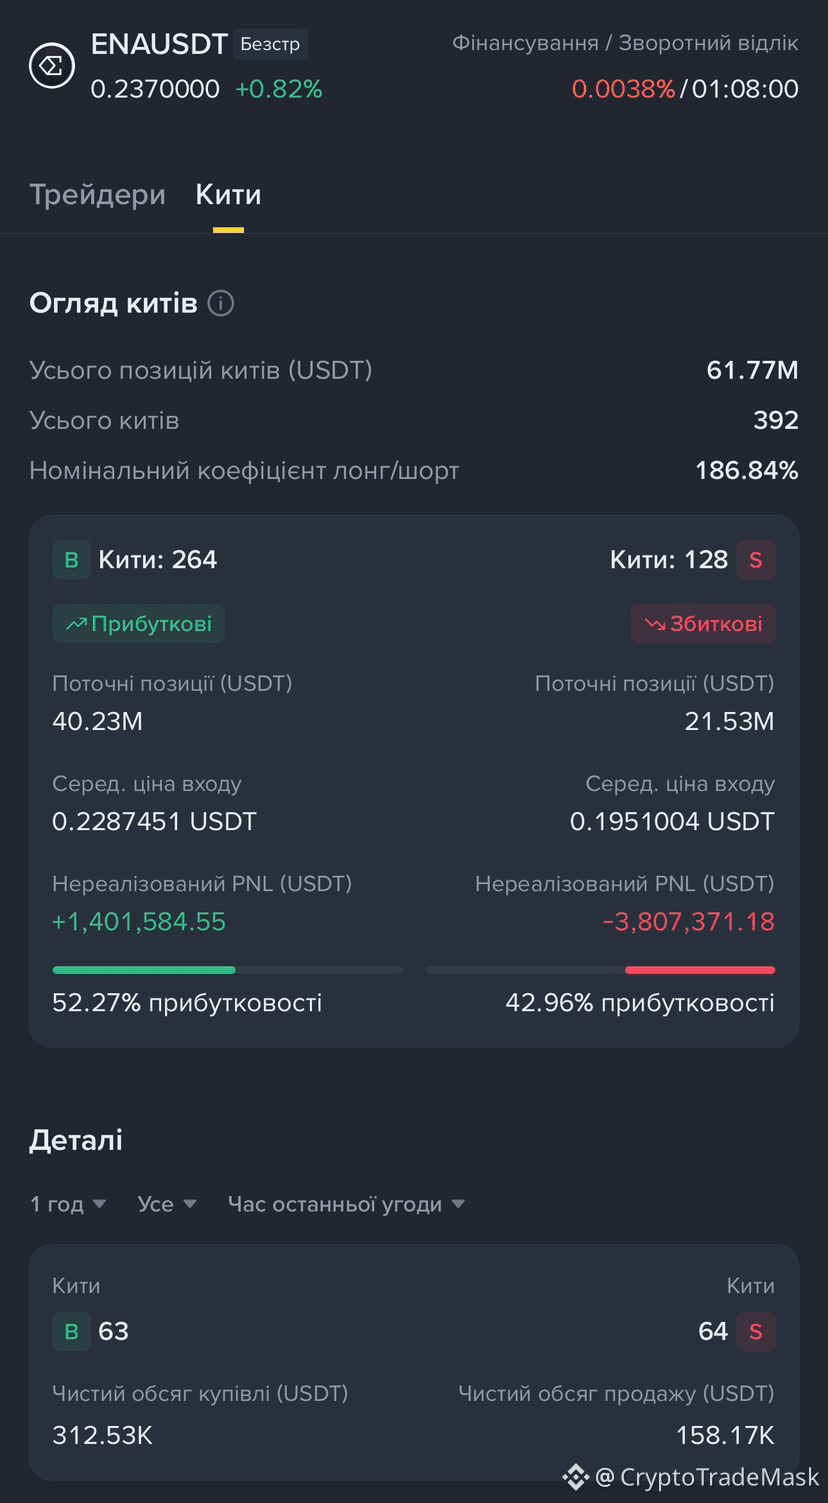
1
46
#hacks
🚨 September saw a record number of crypto hacks: losses surged by 462%
According to security firm PeckShieldAlert, there were 55 major breaches in September, with total losses reaching a staggering $766.49 million—a 462% increase compared to August ($136.3 million).
🔍 Key incidents of the month and top YTD offenders:
• Bitget: ~$387 million — a new record high for losses this year.
• Liquid Network: ~$320 million ($285 million of which was recovered).
• MEV bot front-run: $7.81 million (fully recovered).
• Duelbits: $7 million.
• Payment Processor V2: $6.6 million ($3.4 million recovered).
• DCENT Wallet: $6.57 million.
• Astroport: $4.9 million.
• Drop: $4.4 million.
• Near Intents: $3.865 million — according to ZachXBT, a hot wallet on BSC experienced anomalous outflows. Funds were withdrawn via KuCoin and converted to BTC; the attacker's address is linked to the North Korean group Lazarus Group.
• NostraFinance: $3.5 million.
• Nomic nBTC Bridge: $3.15 million.
⚠️ Conclusion: While on-chain detectives and protocols manage to recover some funds, hacker activity—particularly by state-sponsored groups like Lazarus—has reached critical levels.
#hacks
🚨 September saw a record number of crypto hacks: losses surged by 462%
According to security firm PeckShieldAlert, there were 55 major breaches in September, with total losses reaching a staggering $766.49 million—a 462% increase compared to August ($136.3 million).
🔍 Key incidents of the month and top YTD offenders:
• Bitget: ~$387 million — a new record high for losses this year.
• Liquid Network: ~$320 million ($285 million of which was recovered).
• MEV bot front-run: $7.81 million (fully recovered).
• Duelbits: $7 million.
• Payment Processor V2: $6.6 million ($3.4 million recovered).
• DCENT Wallet: $6.57 million.
• Astroport: $4.9 million.
• Drop: $4.4 million.
• Near Intents: $3.865 million — according to ZachXBT, a hot wallet on BSC experienced anomalous outflows. Funds were withdrawn via KuCoin and converted to BTC; the attacker's address is linked to the North Korean group Lazarus Group.
• NostraFinance: $3.5 million.
• Nomic nBTC Bridge: $3.15 million.
⚠️ Conclusion: While on-chain detectives and protocols manage to recover some funds, hacker activity—particularly by state-sponsored groups like Lazarus—has reached critical levels.
🚨 September saw a record number of crypto hacks: losses surged by 462%
According to security firm PeckShieldAlert, there were 55 major breaches in September, with total losses reaching a staggering $766.49 million—a 462% increase compared to August ($136.3 million).
🔍 Key incidents of the month and top YTD offenders:
• Bitget: ~$387 million — a new record high for losses this year.
• Liquid Network: ~$320 million ($285 million of which was recovered).
• MEV bot front-run: $7.81 million (fully recovered).
• Duelbits: $7 million.
• Payment Processor V2: $6.6 million ($3.4 million recovered).
• DCENT Wallet: $6.57 million.
• Astroport: $4.9 million.
• Drop: $4.4 million.
• Near Intents: $3.865 million — according to ZachXBT, a hot wallet on BSC experienced anomalous outflows. Funds were withdrawn via KuCoin and converted to BTC; the attacker's address is linked to the North Korean group Lazarus Group.
• NostraFinance: $3.5 million.
• Nomic nBTC Bridge: $3.15 million.
⚠️ Conclusion: While on-chain detectives and protocols manage to recover some funds, hacker activity—particularly by state-sponsored groups like Lazarus—has reached critical levels.
29
#Ripple
🚀 $100 for $XRP in 3 years: a realistic scenario or financial utopianism?
Analyst and developer Vincent Van Code has reignited the debate around XRP, claiming the token could hit the $100+ mark within the next three years.
His main argument: the market doesn't price in long-term prospects instantly. Investor confidence grows gradually, so $XRP will likely follow a "saw-tooth" trend-much like Bitcoin and Ethereum did back when no one yet believed in their success.
📊 What does this mean in terms of numbers?
XRP is currently trading around $1.49 with a market cap of ~$94 billion (based on a circulating supply of ~63 billion XRP).
• XRP at $20 ➡️ market cap of ~$1.26 trillion (on par with current Bitcoin or top tech giants).
• XRP at $100 ➡️ market cap of ~$6.3 trillion.
This would make XRP one of the world's largest financial assets, surpassing the combined market capitalization of many global giants.
🧠 Two opposing market philosophies:
1️⃣ The critics' stance (including former Ripple CTO David Schwartz): If institutional investors truly saw a realistic path to such scale, the market would have priced it in already, and XRP wouldn't be trading below $2.
2️⃣ Vincent Van Code's stance: Conviction and adoption build in waves. Building liquidity and institutional trust is a gradual process, not an overnight surge.
🎯 Alternative analyst targets:
A more conservative-yet still bullish-scenario from Ali Martinez points to $60; however, for this rally to kick off, XRP must first decisively close a monthly candle above the historical resistance level of $3.66.
{future}(XRPUSDT)
#Ripple
🚀 $100 for $XRP in 3 years: a realistic scenario or financial utopianism?
Analyst and developer Vincent Van Code has reignited the debate around XRP, claiming the token could hit the $100+ mark within the next three years.
His main argument: the market doesn't price in long-term prospects instantly. Investor confidence grows gradually, so $XRP will likely follow a "saw-tooth" trend-much like Bitcoin and Ethereum did back when no one yet believed in their success.
📊 What does this mean in terms of numbers?
XRP is currently trading around $1.49 with a market cap of ~$94 billion (based on a circulating supply of ~63 billion XRP).
• XRP at $20 ➡️ market cap of ~$1.26 trillion (on par with current Bitcoin or top tech giants).
• XRP at $100 ➡️ market cap of ~$6.3 trillion.
This would make XRP one of the world's largest financial assets, surpassing the combined market capitalization of many global giants.
🧠 Two opposing market philosophies:
1️⃣ The critics' stance (including former Ripple CTO David Schwartz): If institutional investors truly saw a realistic path to such scale, the market would have priced it in already, and XRP wouldn't be trading below $2.
2️⃣ Vincent Van Code's stance: Conviction and adoption build in waves. Building liquidity and institutional trust is a gradual process, not an overnight surge.
🎯 Alternative analyst targets:
A more conservative-yet still bullish-scenario from Ali Martinez points to $60; however, for this rally to kick off, XRP must first decisively close a monthly candle above the historical resistance level of $3.66.
🚀 $100 for $XRP in 3 years: a realistic scenario or financial utopianism?
Analyst and developer Vincent Van Code has reignited the debate around XRP, claiming the token could hit the $100+ mark within the next three years.
His main argument: the market doesn't price in long-term prospects instantly. Investor confidence grows gradually, so $XRP will likely follow a "saw-tooth" trend-much like Bitcoin and Ethereum did back when no one yet believed in their success.
📊 What does this mean in terms of numbers?
XRP is currently trading around $1.49 with a market cap of ~$94 billion (based on a circulating supply of ~63 billion XRP).
• XRP at $20 ➡️ market cap of ~$1.26 trillion (on par with current Bitcoin or top tech giants).
• XRP at $100 ➡️ market cap of ~$6.3 trillion.
This would make XRP one of the world's largest financial assets, surpassing the combined market capitalization of many global giants.
🧠 Two opposing market philosophies:
1️⃣ The critics' stance (including former Ripple CTO David Schwartz): If institutional investors truly saw a realistic path to such scale, the market would have priced it in already, and XRP wouldn't be trading below $2.
2️⃣ Vincent Van Code's stance: Conviction and adoption build in waves. Building liquidity and institutional trust is a gradual process, not an overnight surge.
🎯 Alternative analyst targets:
A more conservative-yet still bullish-scenario from Ali Martinez points to $60; however, for this rally to kick off, XRP must first decisively close a monthly candle above the historical resistance level of $3.66.
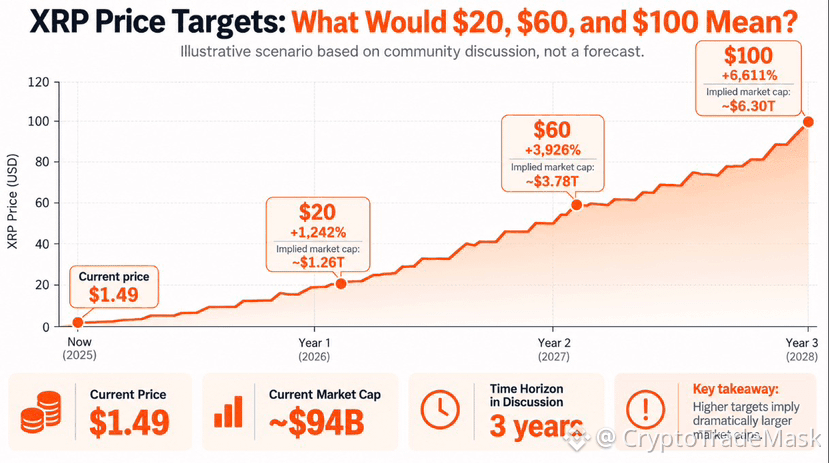
45
#Clrcle
🚀 Circle ($CRCL ): The Institutional Bridge Between Wall Street and Web3
While the market discusses the latest altcoin surges, one of the most interesting assets at the intersection of TradFi and DeFi is quietly strengthening its position. We are talking about Circle Internet Group (NYSE / RWA: CRCL)—the company behind USDC, the world's second-largest stablecoin.
Why is CRCL attracting increasing attention from analysts and institutional investors? Here are the key points and metrics:
📊 Why is Circle a fundamental play?
1. Transparency and Regulation: Unlike offshore competitors, Circle prioritizes full regulatory compliance (US laws, European MiCA). This makes USDC the top choice for banks and corporations.
2. Cash-Generating Business Model: Circle earns interest on the reserves backing USDC (short-term US Treasury bonds and cash deposits).
3. Ecosystem Integration: Through protocols like CCTP (Cross-Chain Transfer Protocol) and direct partnerships with banking providers, Circle is gradually becoming a foundational payment rail for global transfers.
📊 Current Status and Figures
Asset Format: On traditional markets, it exists as company stock; in the DeFi space, as tokenized shares (Real World Assets / RWA).
Market Valuation: ~$22 billion (shares trading in the $80–$83 range).
Key Driver: Growth in USDC market capitalization and the onboarding of banking clients.
⚠️ What to consider before buying?
Sensitivity to Fed rates: A loosening of monetary policy and lower interest rates in the US reduce bond yields, directly impacting the company's net income.
Banking competition: Major financial giants are developing their own settlement coins and banking solutions for instant payments.
‼️ Verdict
$CRCL is neither a speculative memecoin nor a high-risk DEX token; rather, it represents a fundamental bet on the institutional adoption of cryptocurrency. For those seeking exposure to the crypto market through a classic business model with real revenue, this asset is definitely worth a spot on your watchlist.
{future}(CRCLUSDT)
#Clrcle
🚀 Circle ($CRCL ): The Institutional Bridge Between Wall Street and Web3
While the market discusses the latest altcoin surges, one of the most interesting assets at the intersection of TradFi and DeFi is quietly strengthening its position. We are talking about Circle Internet Group (NYSE / RWA: CRCL)—the company behind USDC, the world's second-largest stablecoin.
Why is CRCL attracting increasing attention from analysts and institutional investors? Here are the key points and metrics:
📊 Why is Circle a fundamental play?
1. Transparency and Regulation: Unlike offshore competitors, Circle prioritizes full regulatory compliance (US laws, European MiCA). This makes USDC the top choice for banks and corporations.
2. Cash-Generating Business Model: Circle earns interest on the reserves backing USDC (short-term US Treasury bonds and cash deposits).
3. Ecosystem Integration: Through protocols like CCTP (Cross-Chain Transfer Protocol) and direct partnerships with banking providers, Circle is gradually becoming a foundational payment rail for global transfers.
📊 Current Status and Figures
Asset Format: On traditional markets, it exists as company stock; in the DeFi space, as tokenized shares (Real World Assets / RWA).
Market Valuation: ~$22 billion (shares trading in the $80–$83 range).
Key Driver: Growth in USDC market capitalization and the onboarding of banking clients.
⚠️ What to consider before buying?
Sensitivity to Fed rates: A loosening of monetary policy and lower interest rates in the US reduce bond yields, directly impacting the company's net income.
Banking competition: Major financial giants are developing their own settlement coins and banking solutions for instant payments.
‼️ Verdict
$CRCL is neither a speculative memecoin nor a high-risk DEX token; rather, it represents a fundamental bet on the institutional adoption of cryptocurrency. For those seeking exposure to the crypto market through a classic business model with real revenue, this asset is definitely worth a spot on your watchlist.
🚀 Circle ($CRCL ): The Institutional Bridge Between Wall Street and Web3
While the market discusses the latest altcoin surges, one of the most interesting assets at the intersection of TradFi and DeFi is quietly strengthening its position. We are talking about Circle Internet Group (NYSE / RWA: CRCL)—the company behind USDC, the world's second-largest stablecoin.
Why is CRCL attracting increasing attention from analysts and institutional investors? Here are the key points and metrics:
📊 Why is Circle a fundamental play?
1. Transparency and Regulation: Unlike offshore competitors, Circle prioritizes full regulatory compliance (US laws, European MiCA). This makes USDC the top choice for banks and corporations.
2. Cash-Generating Business Model: Circle earns interest on the reserves backing USDC (short-term US Treasury bonds and cash deposits).
3. Ecosystem Integration: Through protocols like CCTP (Cross-Chain Transfer Protocol) and direct partnerships with banking providers, Circle is gradually becoming a foundational payment rail for global transfers.
📊 Current Status and Figures
Asset Format: On traditional markets, it exists as company stock; in the DeFi space, as tokenized shares (Real World Assets / RWA).
Market Valuation: ~$22 billion (shares trading in the $80–$83 range).
Key Driver: Growth in USDC market capitalization and the onboarding of banking clients.
⚠️ What to consider before buying?
Sensitivity to Fed rates: A loosening of monetary policy and lower interest rates in the US reduce bond yields, directly impacting the company's net income.
Banking competition: Major financial giants are developing their own settlement coins and banking solutions for instant payments.
‼️ Verdict
$CRCL is neither a speculative memecoin nor a high-risk DEX token; rather, it represents a fundamental bet on the institutional adoption of cryptocurrency. For those seeking exposure to the crypto market through a classic business model with real revenue, this asset is definitely worth a spot on your watchlist.
445

Article
Жовтневий шторм чи затишшя? Макроекономічний календар та криптоподії тижня (5–11 жовтня)Перший повний тиждень жовтня готує для крипторинку випробування на міцність. Після динамічного початку осені трейдери та інвестори уважно стежать за сигнальними прапорцями з боку США: від стану сфери послуг до внутрішніх ризиків, пов'язаних із великими розблокуваннями токенів.
Розбираємо головні події тижня, які визначать вектор руху Bitcoin та альткоїнів.
1. Макроекономічний фронт США: Ліквідність та ставки
Зараз цифрово-активні ринки залишаються надчутливими до будь-яких змін у монетарній політиці Федеральної резервної системи США (ФРС). Наступного тижня ключова увага буде прикута до трьох подій:
➡️ ISM Services PMI (Понеділок, 5 жовтня):
Індекс ділової активності у сфері послуг США є прямою оцінкою здоров’я американської економіки. Якщо показник виявиться вищим за очікування, долар США (DXY) отримає додатковий імпульс для зростання, що традиційно створює короткостроковий тиск на криптовалюти. Натомість слабкі дані розцінюватимуться ринком як аргумент для подальшого пом'якшення процентних ставок.
➡️ Первинні звернення по безробіттю (Четвер, 8 жовтня):
Щотижневі дані Initial Jobless Claims залишаються барометром стану ринку праці. Різке зростання кількості заявок може посилити побоювання щодо рецесії, але водночас це підштовхує ФРС до розшириння грошово-кредитної стимуляції.
➡️ Протоколи засідання ФРС / FOMC Minutes (Четвер–П'ятниця, 8–9 жовтня):
Публікація протоколів попереднього засідання та виступи представників регулятора дозволять розшифрувати внутрішні настрої членів FOMC напередодні вирішальних засідань осені. Ринок виловлюватиме будь-які «голубині» сигнали щодо подальшого зниження ставок.
2. Крипто-специфічні драйвери: Капітал, конференції та кліфи розблокувань
Окрім глобальної макроекономіки, внутрішньогалузевий порядок денний формуватимуть декілька фундаментальних та технічних факторів.
➡️ Волатильність через Token Unlocks
Тиждень відкривається масштабним розблокуванням монет. 5 жовтня відбудеться розблокування понад 1,4 млрд токенів Ethena ($ENA ). Такий суттєвий приплив нової пропозиції на ринок традиційно супроводжується підвищеною волатильністю та високим ризиком локального тиску з боку продавців. Також на тижні заплановане розблокування токенів Movement (MOVE) (9 жовтня).
➡️ Галузевий фокус: TOKEN2049 Singapore (7–8 жовтня)
Один із наймасштабніших криптосамітів року в Сінгапурі часто стає каталізатором локальних ралі для окремих секторів. У ці дні варто очікувати хвилю анонсів, стратегічних партнерств та оновлень продуктів від провідних L1/L2-проєктів та DeFi-протоколів.
➡️ Технічні оновлення
На 8–9 жовтня очікується активація чергових пакетних оновлень (Batch Amendments) у мережі XRP Ledger, що може підігріти інтерес до екосистеми Ripple.
Підсумок та сценарії для трейдерів
1️⃣ Фактор ETF: Головним фундаментом підтримки для Bitcoin на початку місяця залишається стабільний позитивний приплив капіталу в спотові BTC-ETF. Якщо інституційній попит збережеться, ринок легко поглине короткостроковий негатив від локальних розблокувань токенів.
2️⃣ Стратегія дій: Перша половина тижня буде більш чутливою до новин із TOKEN2049 та даних ISM PMI, тоді як четвер і п'ятниця вимагатимуть обережності через протоколи ФРС.
⚠️ Для середньострокових інвесторів цей тиждень — можливість оцінити, чи готовий ринок до традиційного жовтневого ралі, чи перед цим знадобиться ще одна хвиля накопичення.
Жовтневий шторм чи затишшя? Макроекономічний календар та криптоподії тижня (5–11 жовтня)
Перший повний тиждень жовтня готує для крипторинку випробування на міцність. Після динамічного початку осені трейдери та інвестори уважно стежать за сигнальними прапорцями з боку США: від стану сфери послуг до внутрішніх ризиків, пов'язаних із великими розблокуваннями токенів.
Розбираємо головні події тижня, які визначать вектор руху Bitcoin та альткоїнів.
1. Макроекономічний фронт США: Ліквідність та ставки
Зараз цифрово-активні ринки залишаються надчутливими до будь-яких змін у монетарній політиці Федеральної резервної системи США (ФРС). Наступного тижня ключова увага буде прикута до трьох подій:
➡️ ISM Services PMI (Понеділок, 5 жовтня):
Індекс ділової активності у сфері послуг США є прямою оцінкою здоров’я американської економіки. Якщо показник виявиться вищим за очікування, долар США (DXY) отримає додатковий імпульс для зростання, що традиційно створює короткостроковий тиск на криптовалюти. Натомість слабкі дані розцінюватимуться ринком як аргумент для подальшого пом'якшення процентних ставок.
➡️ Первинні звернення по безробіттю (Четвер, 8 жовтня):
Щотижневі дані Initial Jobless Claims залишаються барометром стану ринку праці. Різке зростання кількості заявок може посилити побоювання щодо рецесії, але водночас це підштовхує ФРС до розшириння грошово-кредитної стимуляції.
➡️ Протоколи засідання ФРС / FOMC Minutes (Четвер–П'ятниця, 8–9 жовтня):
Публікація протоколів попереднього засідання та виступи представників регулятора дозволять розшифрувати внутрішні настрої членів FOMC напередодні вирішальних засідань осені. Ринок виловлюватиме будь-які «голубині» сигнали щодо подальшого зниження ставок.
2. Крипто-специфічні драйвери: Капітал, конференції та кліфи розблокувань
Окрім глобальної макроекономіки, внутрішньогалузевий порядок денний формуватимуть декілька фундаментальних та технічних факторів.
➡️ Волатильність через Token Unlocks
Тиждень відкривається масштабним розблокуванням монет. 5 жовтня відбудеться розблокування понад 1,4 млрд токенів Ethena ($ENA ). Такий суттєвий приплив нової пропозиції на ринок традиційно супроводжується підвищеною волатильністю та високим ризиком локального тиску з боку продавців. Також на тижні заплановане розблокування токенів Movement (MOVE) (9 жовтня).
➡️ Галузевий фокус: TOKEN2049 Singapore (7–8 жовтня)
Один із наймасштабніших криптосамітів року в Сінгапурі часто стає каталізатором локальних ралі для окремих секторів. У ці дні варто очікувати хвилю анонсів, стратегічних партнерств та оновлень продуктів від провідних L1/L2-проєктів та DeFi-протоколів.
➡️ Технічні оновлення
На 8–9 жовтня очікується активація чергових пакетних оновлень (Batch Amendments) у мережі XRP Ledger, що може підігріти інтерес до екосистеми Ripple.
Підсумок та сценарії для трейдерів
1️⃣ Фактор ETF: Головним фундаментом підтримки для Bitcoin на початку місяця залишається стабільний позитивний приплив капіталу в спотові BTC-ETF. Якщо інституційній попит збережеться, ринок легко поглине короткостроковий негатив від локальних розблокувань токенів.
2️⃣ Стратегія дій: Перша половина тижня буде більш чутливою до новин із TOKEN2049 та даних ISM PMI, тоді як четвер і п'ятниця вимагатимуть обережності через протоколи ФРС.
⚠️ Для середньострокових інвесторів цей тиждень — можливість оцінити, чи готовий ринок до традиційного жовтневого ралі, чи перед цим знадобиться ще одна хвиля накопичення.
Розбираємо головні події тижня, які визначать вектор руху Bitcoin та альткоїнів.
1. Макроекономічний фронт США: Ліквідність та ставки
Зараз цифрово-активні ринки залишаються надчутливими до будь-яких змін у монетарній політиці Федеральної резервної системи США (ФРС). Наступного тижня ключова увага буде прикута до трьох подій:
➡️ ISM Services PMI (Понеділок, 5 жовтня):
Індекс ділової активності у сфері послуг США є прямою оцінкою здоров’я американської економіки. Якщо показник виявиться вищим за очікування, долар США (DXY) отримає додатковий імпульс для зростання, що традиційно створює короткостроковий тиск на криптовалюти. Натомість слабкі дані розцінюватимуться ринком як аргумент для подальшого пом'якшення процентних ставок.
➡️ Первинні звернення по безробіттю (Четвер, 8 жовтня):
Щотижневі дані Initial Jobless Claims залишаються барометром стану ринку праці. Різке зростання кількості заявок може посилити побоювання щодо рецесії, але водночас це підштовхує ФРС до розшириння грошово-кредитної стимуляції.
➡️ Протоколи засідання ФРС / FOMC Minutes (Четвер–П'ятниця, 8–9 жовтня):
Публікація протоколів попереднього засідання та виступи представників регулятора дозволять розшифрувати внутрішні настрої членів FOMC напередодні вирішальних засідань осені. Ринок виловлюватиме будь-які «голубині» сигнали щодо подальшого зниження ставок.
2. Крипто-специфічні драйвери: Капітал, конференції та кліфи розблокувань
Окрім глобальної макроекономіки, внутрішньогалузевий порядок денний формуватимуть декілька фундаментальних та технічних факторів.
➡️ Волатильність через Token Unlocks
Тиждень відкривається масштабним розблокуванням монет. 5 жовтня відбудеться розблокування понад 1,4 млрд токенів Ethena ($ENA ). Такий суттєвий приплив нової пропозиції на ринок традиційно супроводжується підвищеною волатильністю та високим ризиком локального тиску з боку продавців. Також на тижні заплановане розблокування токенів Movement (MOVE) (9 жовтня).
➡️ Галузевий фокус: TOKEN2049 Singapore (7–8 жовтня)
Один із наймасштабніших криптосамітів року в Сінгапурі часто стає каталізатором локальних ралі для окремих секторів. У ці дні варто очікувати хвилю анонсів, стратегічних партнерств та оновлень продуктів від провідних L1/L2-проєктів та DeFi-протоколів.
➡️ Технічні оновлення
На 8–9 жовтня очікується активація чергових пакетних оновлень (Batch Amendments) у мережі XRP Ledger, що може підігріти інтерес до екосистеми Ripple.
Підсумок та сценарії для трейдерів
1️⃣ Фактор ETF: Головним фундаментом підтримки для Bitcoin на початку місяця залишається стабільний позитивний приплив капіталу в спотові BTC-ETF. Якщо інституційній попит збережеться, ринок легко поглине короткостроковий негатив від локальних розблокувань токенів.
2️⃣ Стратегія дій: Перша половина тижня буде більш чутливою до новин із TOKEN2049 та даних ISM PMI, тоді як четвер і п'ятниця вимагатимуть обережності через протоколи ФРС.
⚠️ Для середньострокових інвесторів цей тиждень — можливість оцінити, чи готовий ринок до традиційного жовтневого ралі, чи перед цим знадобиться ще одна хвиля накопичення.
87
🔥 $BEAMX /USDT Analysis: Outlook After the Surge
Following a powerful jump to $0.003043 (+48%), the price corrected to the ~$0.00278 level.
📊 Data Insights:
Futures: Open Interest (OI) surged to $5.06 billion. The move was driven by new futures positions.
Whale Positions: 84 "long whales" are currently underwater with an average entry price of $0.00300. Meanwhile, "short whales" are in profit ($0.00279).
Liquidity: Key resistance lies at $0.00295–$0.00310. Strong support is found at $0.00233–$0.00249.
🚦 Trading Scenarios:
🟢 LONG (on pullback / at support):
Entry: $0.00240 – $0.00250
Targets: $0.00280 / $0.00300 / $0.00310
Stop Loss: $0.00228
🔴 SHORT (at resistance / targeting underwater longs):
Entry: $0.00290 – $0.00300
Targets: $0.00265 / $0.00245
Stop Loss: $0.00312
⚠️ Practice risk management! Leverage: 3x–5x; risk: no more than 1–2% per trade.
{future}(BEAMXUSDT)
🔥 $BEAMX /USDT Analysis: Outlook After the Surge
Following a powerful jump to $0.003043 (+48%), the price corrected to the ~$0.00278 level.
📊 Data Insights:
Futures: Open Interest (OI) surged to $5.06 billion. The move was driven by new futures positions.
Whale Positions: 84 "long whales" are currently underwater with an average entry price of $0.00300. Meanwhile, "short whales" are in profit ($0.00279).
Liquidity: Key resistance lies at $0.00295–$0.00310. Strong support is found at $0.00233–$0.00249.
🚦 Trading Scenarios:
🟢 LONG (on pullback / at support):
Entry: $0.00240 – $0.00250
Targets: $0.00280 / $0.00300 / $0.00310
Stop Loss: $0.00228
🔴 SHORT (at resistance / targeting underwater longs):
Entry: $0.00290 – $0.00300
Targets: $0.00265 / $0.00245
Stop Loss: $0.00312
⚠️ Practice risk management! Leverage: 3x–5x; risk: no more than 1–2% per trade.
Following a powerful jump to $0.003043 (+48%), the price corrected to the ~$0.00278 level.
📊 Data Insights:
Futures: Open Interest (OI) surged to $5.06 billion. The move was driven by new futures positions.
Whale Positions: 84 "long whales" are currently underwater with an average entry price of $0.00300. Meanwhile, "short whales" are in profit ($0.00279).
Liquidity: Key resistance lies at $0.00295–$0.00310. Strong support is found at $0.00233–$0.00249.
🚦 Trading Scenarios:
🟢 LONG (on pullback / at support):
Entry: $0.00240 – $0.00250
Targets: $0.00280 / $0.00300 / $0.00310
Stop Loss: $0.00228
🔴 SHORT (at resistance / targeting underwater longs):
Entry: $0.00290 – $0.00300
Targets: $0.00265 / $0.00245
Stop Loss: $0.00312
⚠️ Practice risk management! Leverage: 3x–5x; risk: no more than 1–2% per trade.
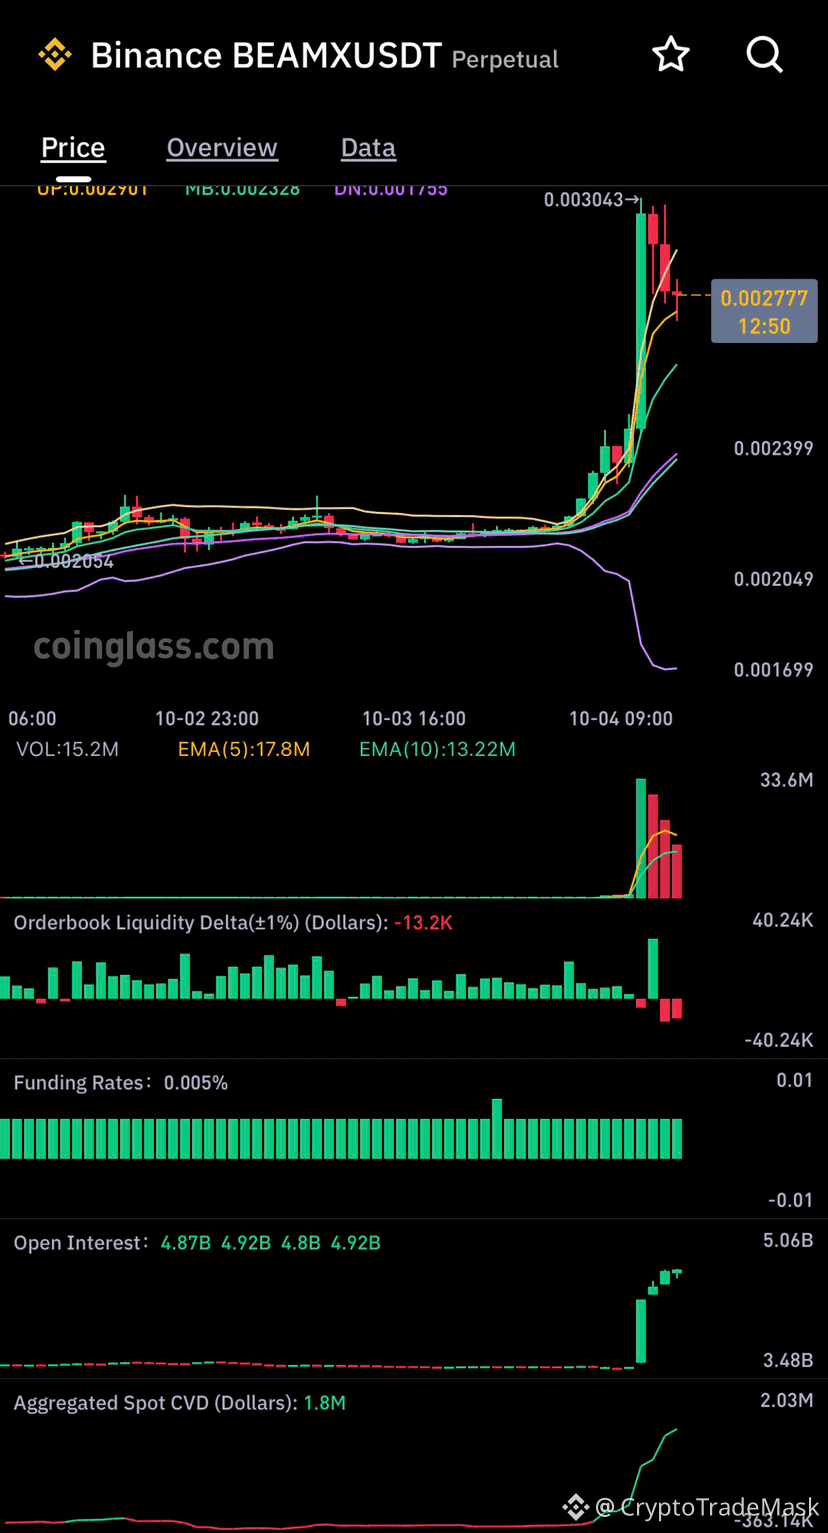
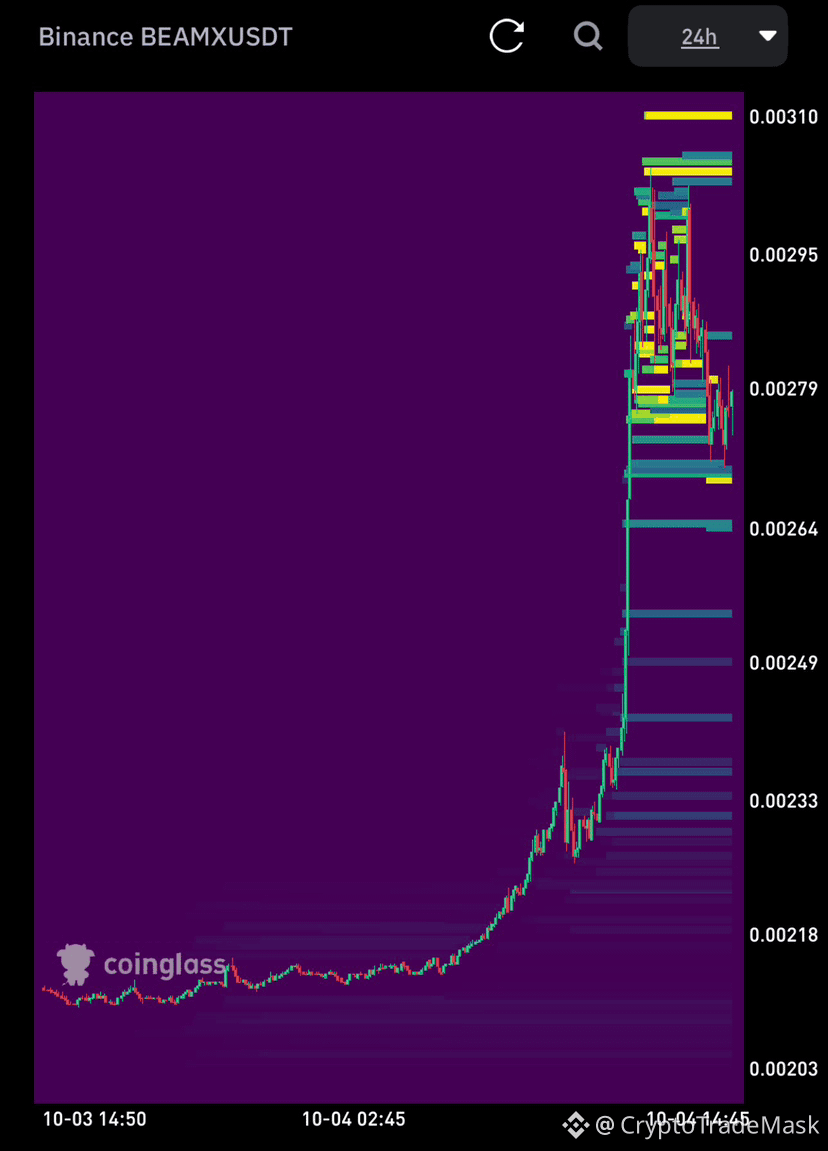
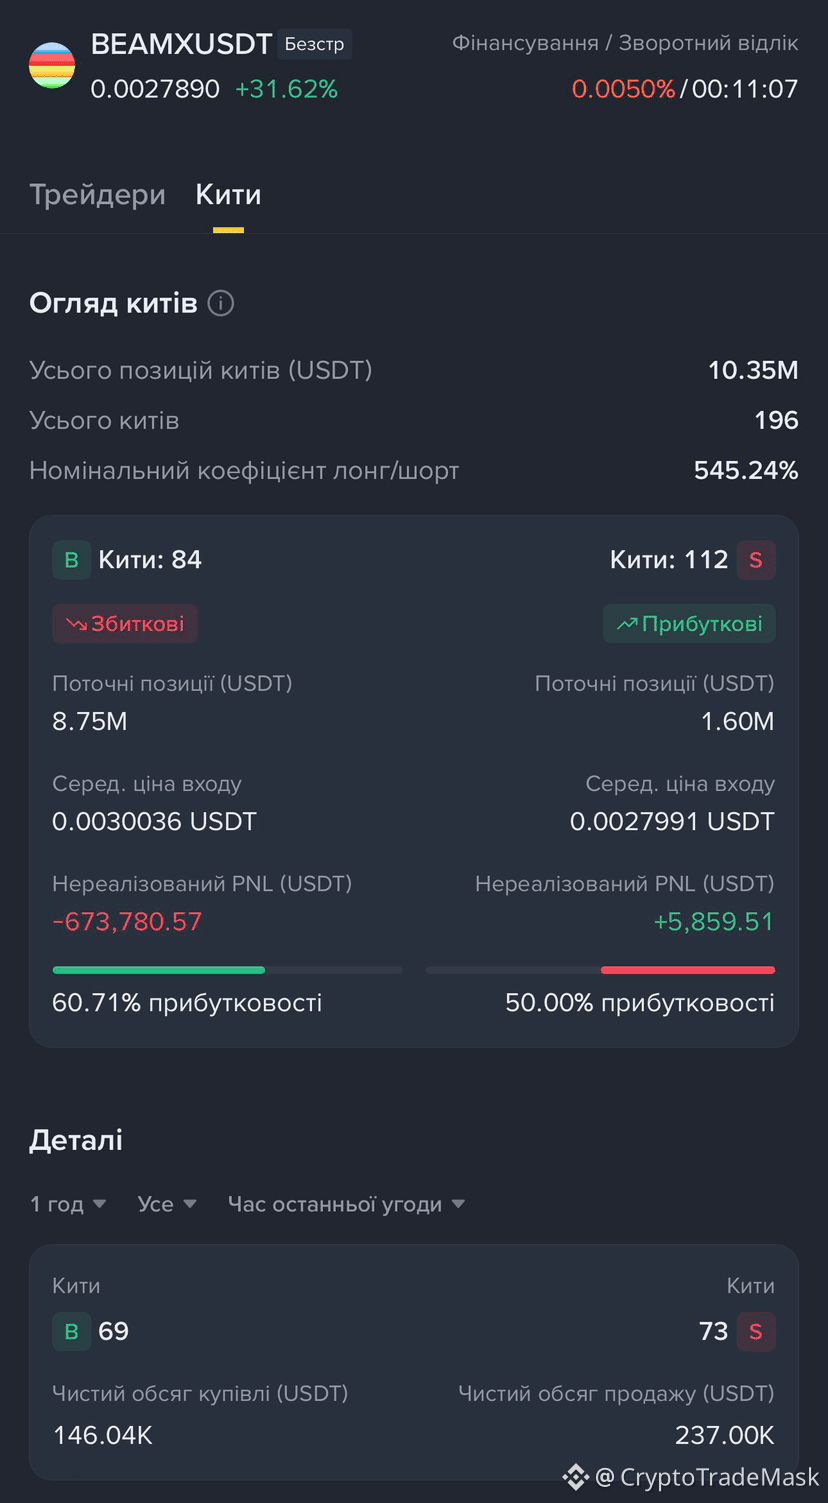
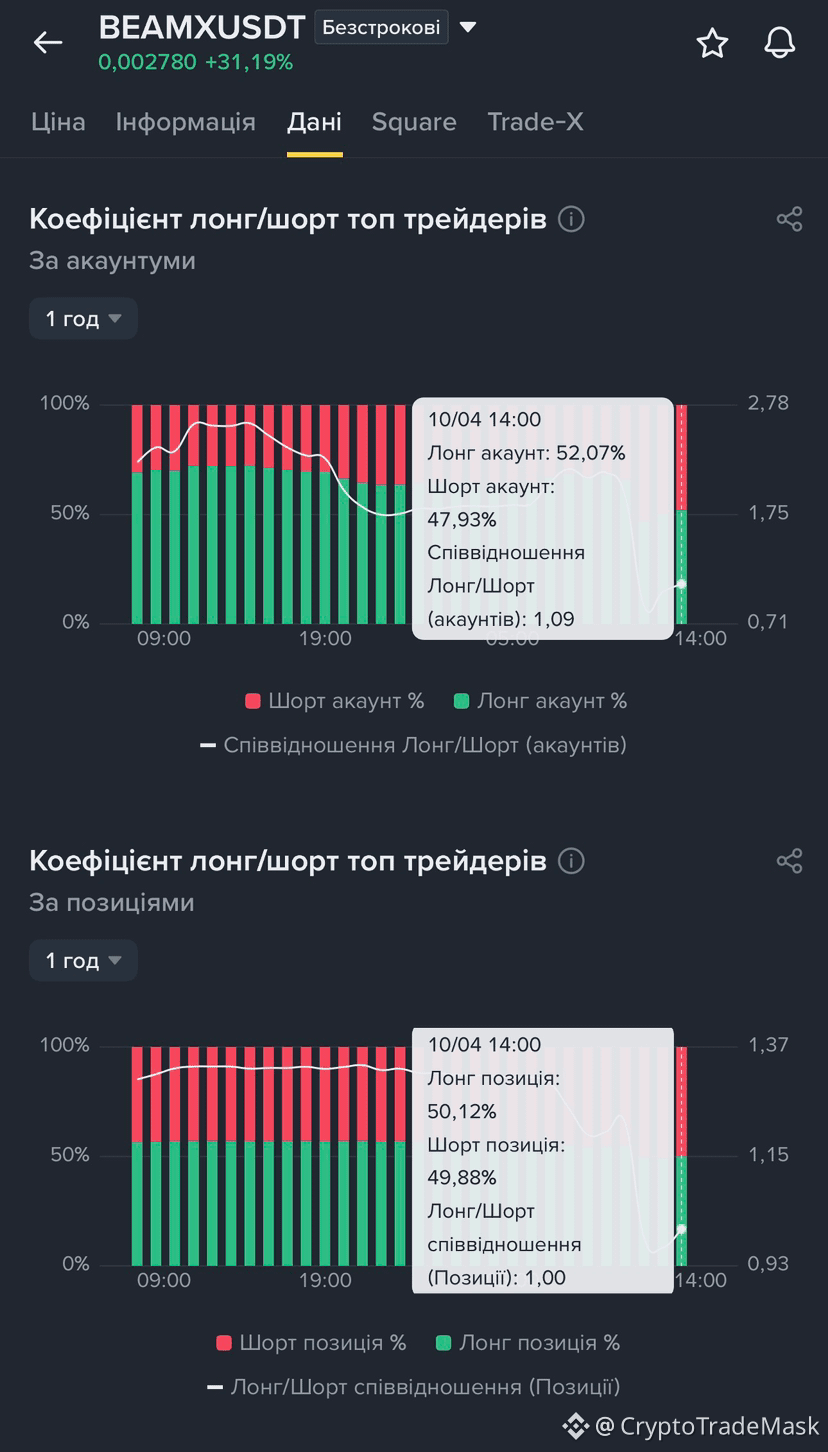
57
🚀 $AIN /USDT: Situation Analysis and Trading Ideas
Following a massive rally (+143%), the asset has entered a consolidation phase near 0.0564 USDT. The market shows signs of overheating: the funding rate has reached an extreme 0.237%, and 60% of top traders hold long positions. Whales are maintaining large long positions with an average entry price of 0.0335 USDT but are beginning to take profits and open short positions locally.
🟢 Long (Buy on pullback)
Buying at current levels is risky due to high funding rates. We are waiting for a correction into the liquidity zone:
Entry: 0.0480 – 0.0510 USDT
Take-profit: 0.0585 / 0.0665 / 0.0750 USDT
Stop-loss: 0.0450 USDT
🔴 Short (Counter-trend)
Aims to sweep liquidity and shake out over-leveraged long positions:
Entry: 0.0610 – 0.0640 USDT
Take-profit: 0.0520 / 0.0470 USDT
Stop-loss: 0.0675 USDT
⚠️ Follow risk management rules: risk no more than 1–2% of your deposit per trade.
{future}(AINUSDT)
🚀 $AIN /USDT: Situation Analysis and Trading Ideas
Following a massive rally (+143%), the asset has entered a consolidation phase near 0.0564 USDT. The market shows signs of overheating: the funding rate has reached an extreme 0.237%, and 60% of top traders hold long positions. Whales are maintaining large long positions with an average entry price of 0.0335 USDT but are beginning to take profits and open short positions locally.
🟢 Long (Buy on pullback)
Buying at current levels is risky due to high funding rates. We are waiting for a correction into the liquidity zone:
Entry: 0.0480 – 0.0510 USDT
Take-profit: 0.0585 / 0.0665 / 0.0750 USDT
Stop-loss: 0.0450 USDT
🔴 Short (Counter-trend)
Aims to sweep liquidity and shake out over-leveraged long positions:
Entry: 0.0610 – 0.0640 USDT
Take-profit: 0.0520 / 0.0470 USDT
Stop-loss: 0.0675 USDT
⚠️ Follow risk management rules: risk no more than 1–2% of your deposit per trade.
Following a massive rally (+143%), the asset has entered a consolidation phase near 0.0564 USDT. The market shows signs of overheating: the funding rate has reached an extreme 0.237%, and 60% of top traders hold long positions. Whales are maintaining large long positions with an average entry price of 0.0335 USDT but are beginning to take profits and open short positions locally.
🟢 Long (Buy on pullback)
Buying at current levels is risky due to high funding rates. We are waiting for a correction into the liquidity zone:
Entry: 0.0480 – 0.0510 USDT
Take-profit: 0.0585 / 0.0665 / 0.0750 USDT
Stop-loss: 0.0450 USDT
🔴 Short (Counter-trend)
Aims to sweep liquidity and shake out over-leveraged long positions:
Entry: 0.0610 – 0.0640 USDT
Take-profit: 0.0520 / 0.0470 USDT
Stop-loss: 0.0675 USDT
⚠️ Follow risk management rules: risk no more than 1–2% of your deposit per trade.
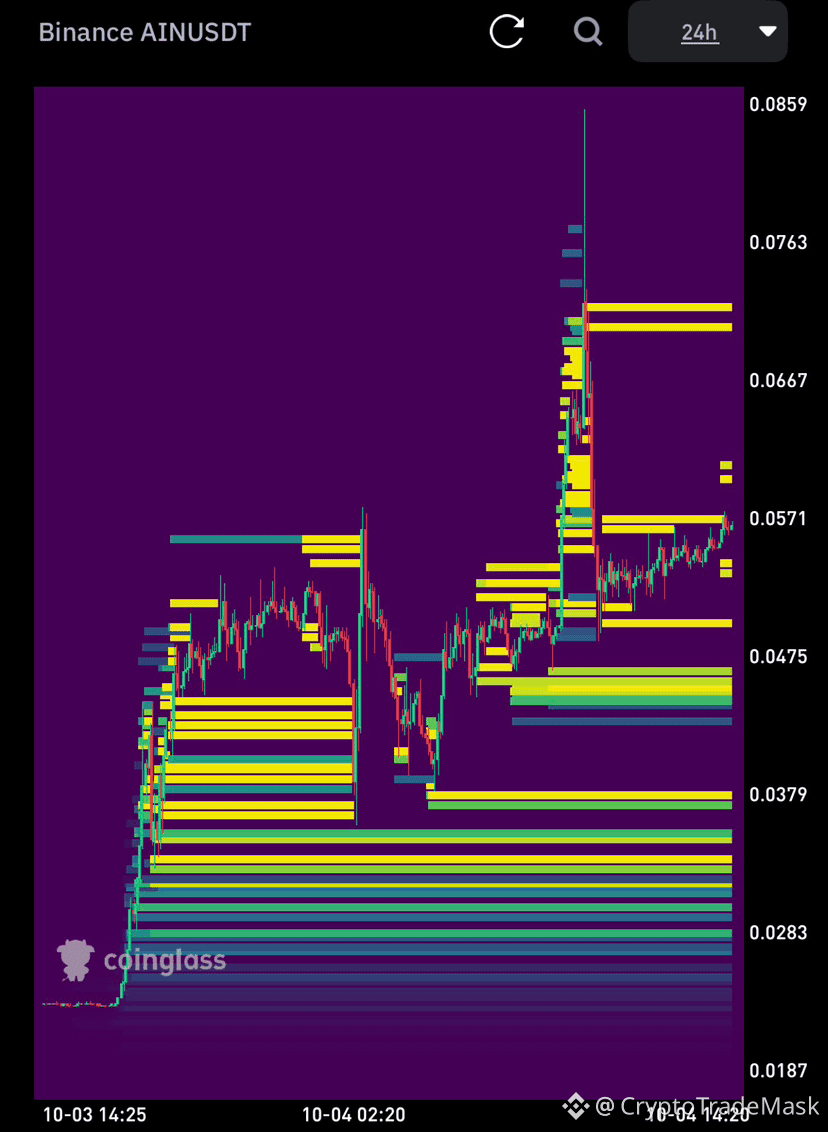
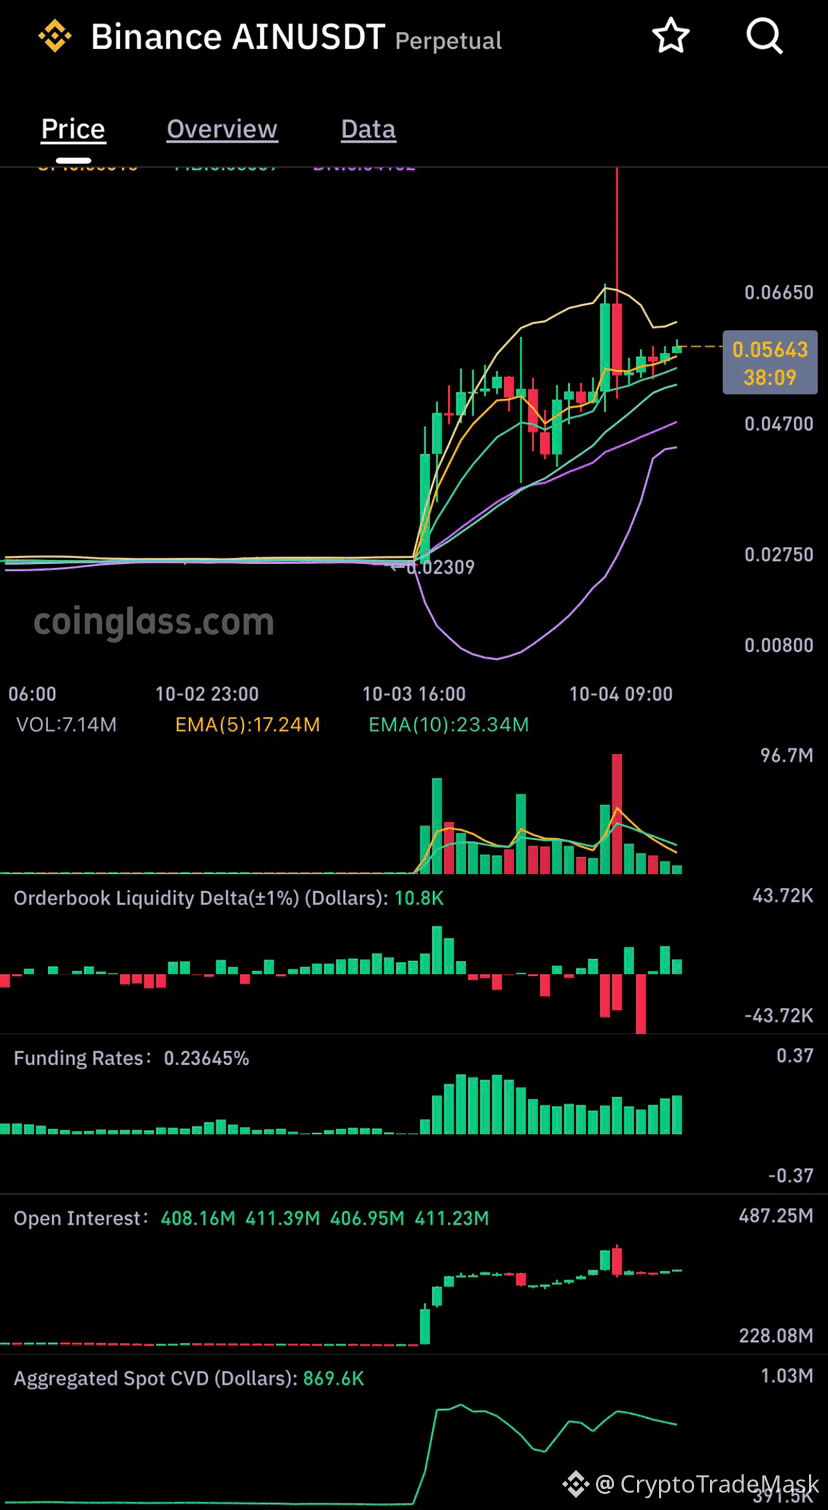
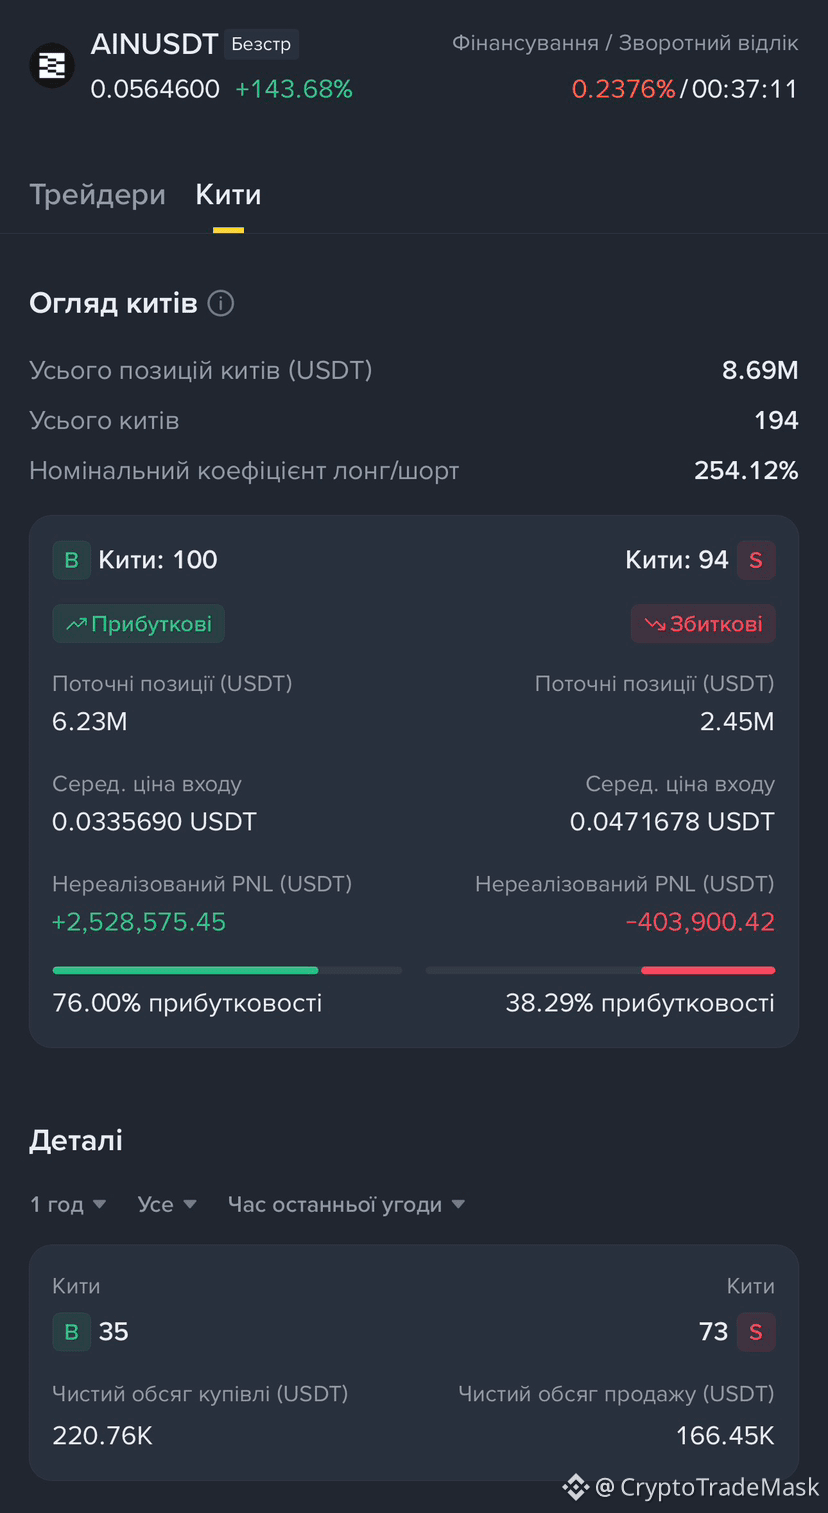
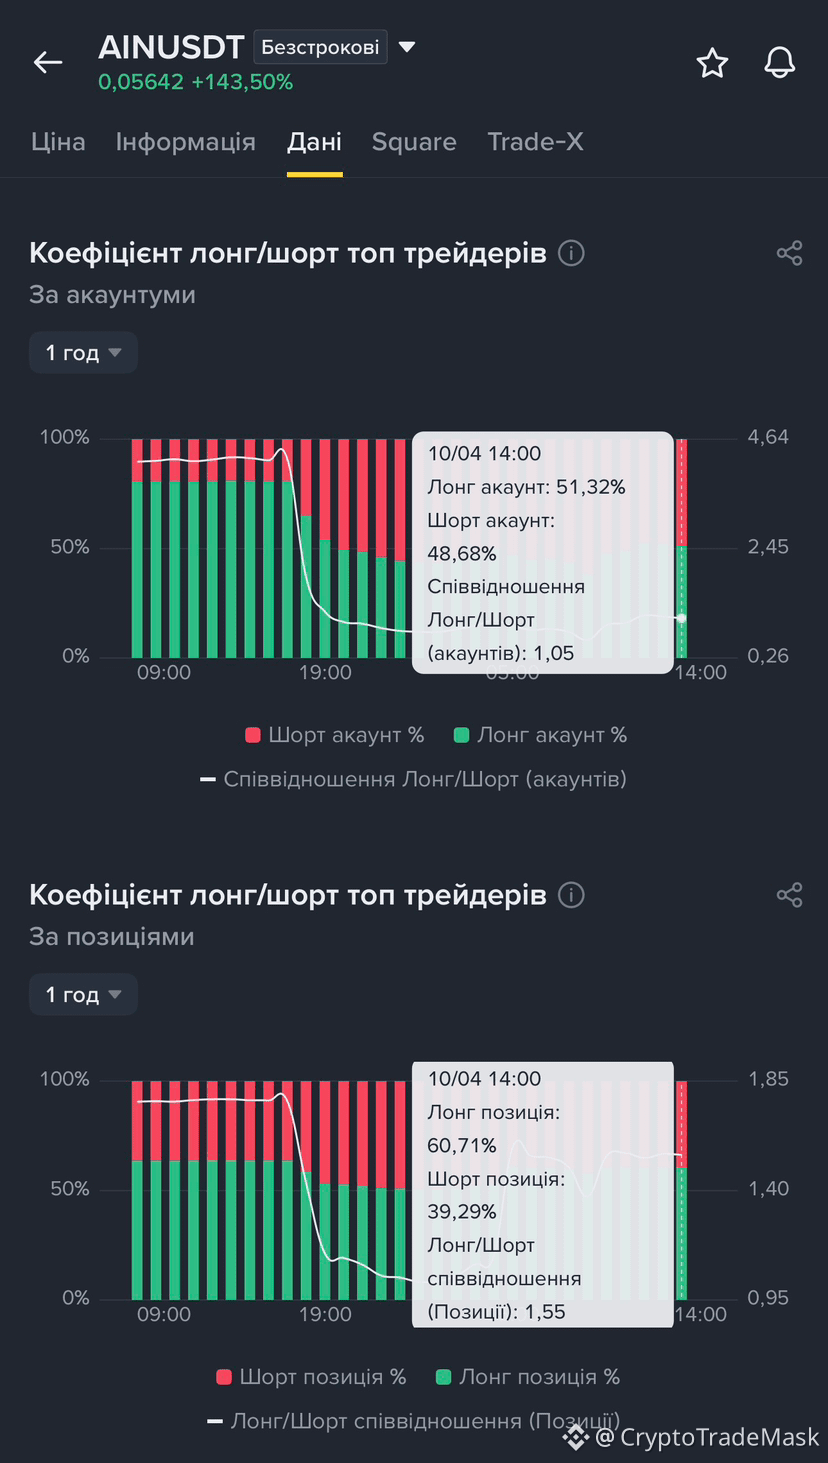
96
#CryptoMarkets
🚀 #pump surges (+16%) and Bitcoin returns to $85K: weekend recap
After a volatile and exhausting week, the crypto market has shifted into recovery mode. Over the last 24 hours, total market capitalization added approximately $30 billion, reaching $2.91 trillion.
🔑 Weekend highlights:
➡️ Bitcoin (BTC) back above $85,000:
After sharp turbulence on Friday triggered by a weak US labor market report (BTC initially spiked above $87,000 before dropping sharply below $84,000), the bulls regained control. The price is currently holding above $85,000 again.
• BTC market cap: $1.71 trillion
• BTC dominance: 59%
➡️ Altcoins in the green:
#ETH : testing resistance near $2,700
#xrp : heading toward $1.50 (+1.1%)
#bnb : approaching $800 (+2.9%)
Positive momentum is also seen in $HYPE (+3%, >$90), CRO, $NEAR , and $TAO (up to +4.5%).
Top gainers of the day:
• PUMP: +16% (to $0.0063)
• RAIN: +14%
Significant gains are also being shown by ZRO and AERO.
📈 The market is demonstrating resilience following a work week packed with macroeconomic data (PCE and NFP).
{future}(TAOUSDT)
{future}(NEARUSDT)
{future}(HYPEUSDT)
#CryptoMarkets
🚀 #pump surges (+16%) and Bitcoin returns to $85K: weekend recap
After a volatile and exhausting week, the crypto market has shifted into recovery mode. Over the last 24 hours, total market capitalization added approximately $30 billion, reaching $2.91 trillion.
🔑 Weekend highlights:
➡️ Bitcoin (BTC) back above $85,000:
After sharp turbulence on Friday triggered by a weak US labor market report (BTC initially spiked above $87,000 before dropping sharply below $84,000), the bulls regained control. The price is currently holding above $85,000 again.
• BTC market cap: $1.71 trillion
• BTC dominance: 59%
➡️ Altcoins in the green:
#ETH : testing resistance near $2,700
#xrp : heading toward $1.50 (+1.1%)
#bnb : approaching $800 (+2.9%)
Positive momentum is also seen in $HYPE (+3%, >$90), CRO, $NEAR , and $TAO (up to +4.5%).
Top gainers of the day:
• PUMP: +16% (to $0.0063)
• RAIN: +14%
Significant gains are also being shown by ZRO and AERO.
📈 The market is demonstrating resilience following a work week packed with macroeconomic data (PCE and NFP).
🚀 #pump surges (+16%) and Bitcoin returns to $85K: weekend recap
After a volatile and exhausting week, the crypto market has shifted into recovery mode. Over the last 24 hours, total market capitalization added approximately $30 billion, reaching $2.91 trillion.
🔑 Weekend highlights:
➡️ Bitcoin (BTC) back above $85,000:
After sharp turbulence on Friday triggered by a weak US labor market report (BTC initially spiked above $87,000 before dropping sharply below $84,000), the bulls regained control. The price is currently holding above $85,000 again.
• BTC market cap: $1.71 trillion
• BTC dominance: 59%
➡️ Altcoins in the green:
#ETH : testing resistance near $2,700
#xrp : heading toward $1.50 (+1.1%)
#bnb : approaching $800 (+2.9%)
Positive momentum is also seen in $HYPE (+3%, >$90), CRO, $NEAR , and $TAO (up to +4.5%).
Top gainers of the day:
• PUMP: +16% (to $0.0063)
• RAIN: +14%
Significant gains are also being shown by ZRO and AERO.
📈 The market is demonstrating resilience following a work week packed with macroeconomic data (PCE and NFP).
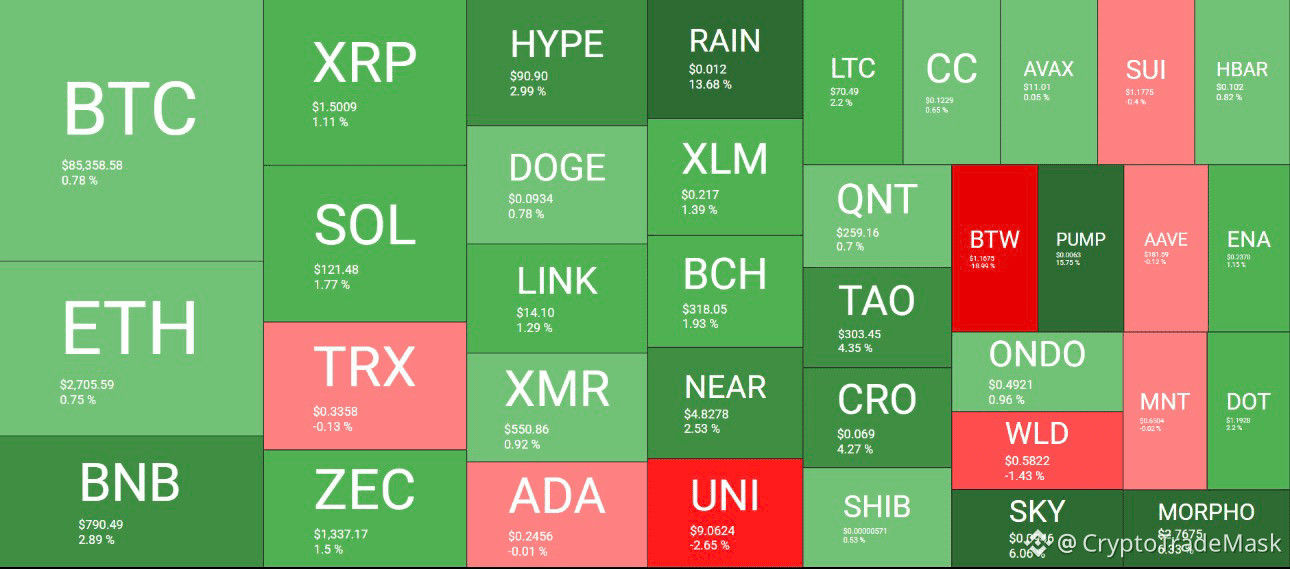
21
Log in to explore more content
Join global crypto users on Binance Square
⚡️ Get latest and useful information about crypto.
💬 Trusted by the world’s largest crypto exchange.
👍 Discover real insights from verified creators.
အီးမေးလ် / ဖုန်းနံပါတ်
ရေပန်းစားနေသော ခေါင်းစဉ်များ
Nikkei225Jumps2.5%ToThreeMonthHigh
5,870 views
187 Discussing
#Nikkei225Jumps2.5%ToThreeMonthHigh
🚀 Nikkei 225 Jumps 2.45% to Reach a 3-Month High!
Japan’s benchmark Nikkei 225 surged impressively on Monday, closing at 69,946.86 after briefly breaking above the milestone 70,000 level for the first time in three months.
💡 What’s Driving the Surge?
AI & Semiconductor Boom: Major tech leaders like Advantest and Tokyo Electron led the charge with robust gains.
Wall Street Momentum: Positive spillover from U.S. markets boosted overall investor confidence.
Macro Shifts: Cooler-than-expected U.S. jobs data eased fears, reducing expectations of an aggressive October Fed rate hike.
📊 Market Takeaway:
This powerful rally signals a strong resurgence of investor appetite for technology and AI-driven assets. However, traders should keep a close eye on elevated bond yields as an ongoing risk factor.
Do you think the Nikkei can successfully hold above 70,000 and power toward brand-new highs? Let us know your thoughts!
#JapanStocks #StockMarket" #AIStocks #Semiconductors #Investing #Nikkei225
$EWJ
Nurul Hasnat Samir
·နှစ်သက်မှု 0 ခု
·26 views
DriftHackVictimsBeginClaims
80,706 views
879 Discussing
SolanaTokenizedStockVolumeTops$4.4BInSeptember
8,125 views
91 Discussing