

阿尔法灰
8.2k Жариялаулар

阿尔法灰
Хабарлау
Пайдаланушыны блоктау
先人一步,做 Alpha 🔥 Join me on X @Alpha_Grey8
Ашық сауда
Жиі сауда жасайтын трейдер
4.1 жыл
774 Жазылым
10.2K+ Жазылушылар
3.6K+ лайк басылған
Жазбалар
Портфолио
Барлығы
Баға ұсыныстары
Тікелей эфир
·
--
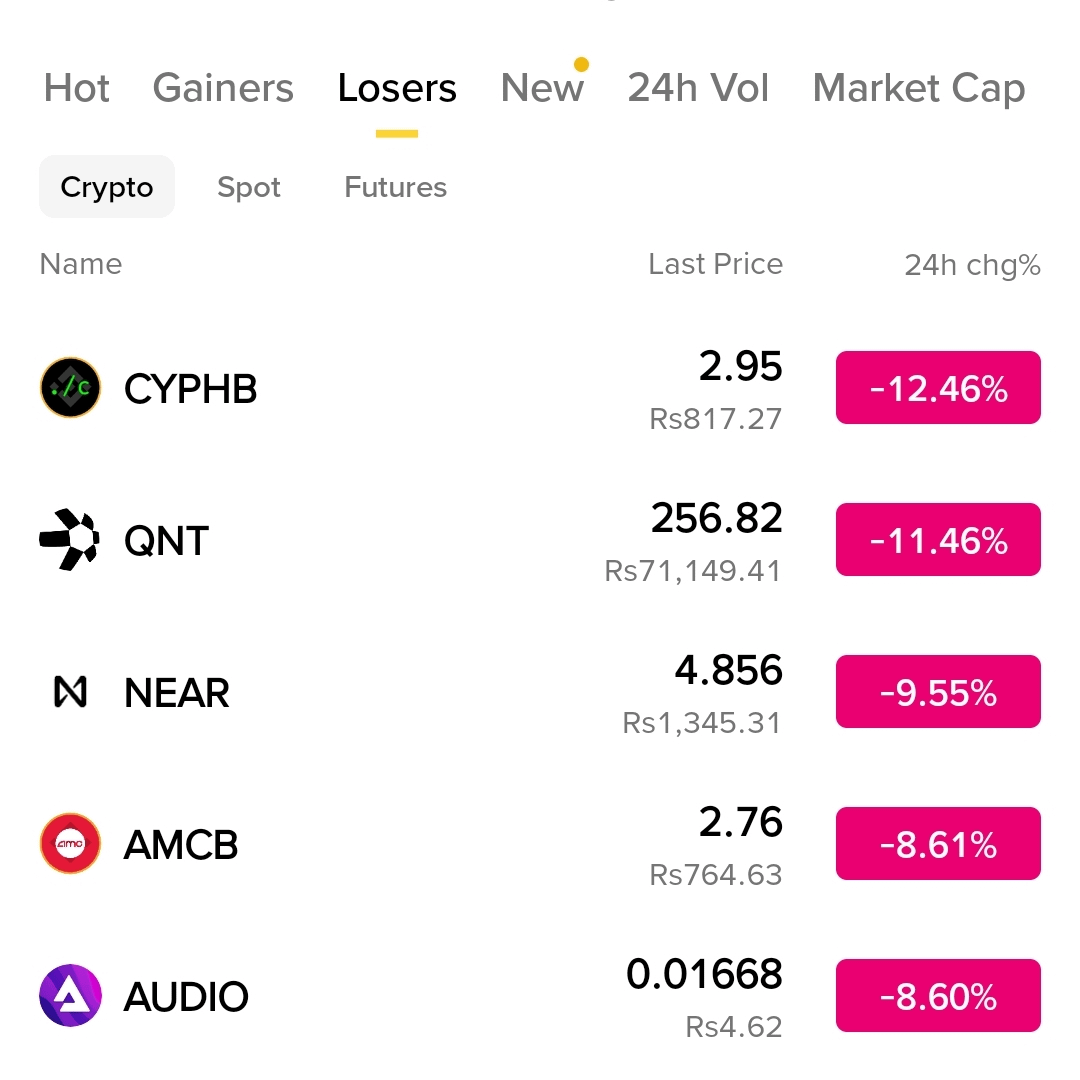
Good Night My Sweet Square Family...😴😴 with top loser of today..👀🔥🔥$NEAR
$QNT
{future}(QNTUSDT)
{future}(NEARUSDT)
Good Night My Sweet Square Family...😴😴 with top loser of today..👀🔥🔥$NEAR
$QNT
$QNT
1
755
·
--
Ішінара рас
🔥🔥 Micron's data center revenue reportedly jumped 11x
$MUB is up 2.21% to $1,090.49 after earnings. AI servers and cloud buildouts are pulling hard on memory, and the AI trade is moving deeper into the chip supply chain. 👀
The key question now is whether supply catches up before pricing cools.
#MicronBeatsEarningsLiftsGuidance
🔥🔥 Micron's data center revenue reportedly jumped 11x
$MUB is up 2.21% to $1,090.49 after earnings. AI servers and cloud buildouts are pulling hard on memory, and the AI trade is moving deeper into the chip supply chain. 👀
The key question now is whether supply catches up before pricing cools.
#MicronBeatsEarningsLiftsGuidance
$MUB is up 2.21% to $1,090.49 after earnings. AI servers and cloud buildouts are pulling hard on memory, and the AI trade is moving deeper into the chip supply chain. 👀
The key question now is whether supply catches up before pricing cools.
#MicronBeatsEarningsLiftsGuidance

2
325
·
--
Төмен (кемімелі)
Ішінара рас
🚨 BLACKROCK IS SELLING BTC
🇺🇸 BlackRock-linked wallets reportedly moved 1,313 BTC, worth around $110M.
And the selling activity appears to be continuing.
That’s a pretty big amount of Bitcoin hitting the market, especially with BTC already sitting near key levels.
The big question is why are they selling now? 👀
Profit-taking? Portfolio rebalancing? Or something bigger happening behind the scenes?
Either way, this is definitely worth watching.
$MOVR
{spot}(MOVRUSDT)
$ALICE
{spot}(ALICEUSDT)
$MEGA
{spot}(MEGAUSDT)
🚨 BLACKROCK IS SELLING BTC
🇺🇸 BlackRock-linked wallets reportedly moved 1,313 BTC, worth around $110M.
And the selling activity appears to be continuing.
That’s a pretty big amount of Bitcoin hitting the market, especially with BTC already sitting near key levels.
The big question is why are they selling now? 👀
Profit-taking? Portfolio rebalancing? Or something bigger happening behind the scenes?
Either way, this is definitely worth watching.
$MOVR
$ALICE
$MEGA
🇺🇸 BlackRock-linked wallets reportedly moved 1,313 BTC, worth around $110M.
And the selling activity appears to be continuing.
That’s a pretty big amount of Bitcoin hitting the market, especially with BTC already sitting near key levels.
The big question is why are they selling now? 👀
Profit-taking? Portfolio rebalancing? Or something bigger happening behind the scenes?
Either way, this is definitely worth watching.
$MOVR
$ALICE
$MEGA

1
695
·
--
Жоғары (өспелі)
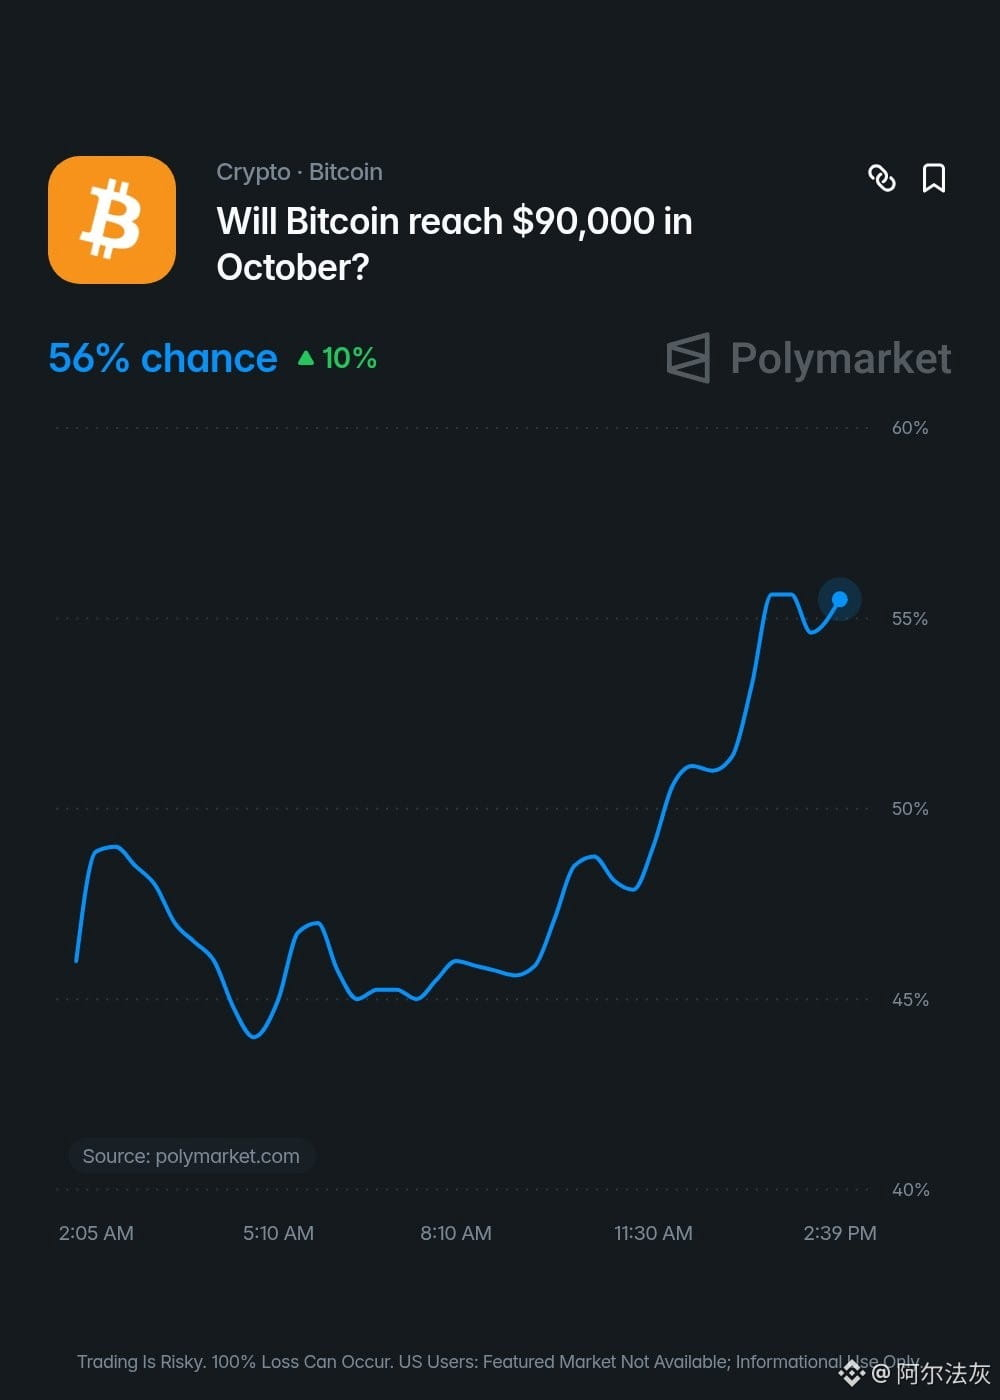
🚨 CAN BITCOIN REACH $90K THIS OCTOBER?
There's now a 56% chance Bitcoin will be above $90,000 this month, according to Polymarket.com 🚀
BTC is around $84.6K right now.
That means we’re only about 6.4% away from $90K.
Honestly, the setup is getting pretty interesting.
$82K–$82.5K is the level I’d want to see hold.
Then there’s $86K.
If BTC breaks above that and actually holds it as support, I think the path toward $90K starts looking a lot cleaner.
And with ETF demand picking up again, there’s definitely some fuel behind this move.
But I wouldn’t get too excited just yet.
BTC needs to prove $86K first.
If it does, things could get interesting very quickly. 👀
{spot}(BTCUSDT)
🚨 CAN BITCOIN REACH $90K THIS OCTOBER?
There's now a 56% chance Bitcoin will be above $90,000 this month, according to Polymarket.com 🚀
BTC is around $84.6K right now.
That means we’re only about 6.4% away from $90K.
Honestly, the setup is getting pretty interesting.
$82K–$82.5K is the level I’d want to see hold.
Then there’s $86K.
If BTC breaks above that and actually holds it as support, I think the path toward $90K starts looking a lot cleaner.
And with ETF demand picking up again, there’s definitely some fuel behind this move.
But I wouldn’t get too excited just yet.
BTC needs to prove $86K first.
If it does, things could get interesting very quickly. 👀
There's now a 56% chance Bitcoin will be above $90,000 this month, according to Polymarket.com 🚀
BTC is around $84.6K right now.
That means we’re only about 6.4% away from $90K.
Honestly, the setup is getting pretty interesting.
$82K–$82.5K is the level I’d want to see hold.
Then there’s $86K.
If BTC breaks above that and actually holds it as support, I think the path toward $90K starts looking a lot cleaner.
And with ETF demand picking up again, there’s definitely some fuel behind this move.
But I wouldn’t get too excited just yet.
BTC needs to prove $86K first.
If it does, things could get interesting very quickly. 👀
1
126
·
--
LOL.... Bitcoin hitting new highs🤧
Me at 50K: "I'll wait for a pullback"😂😂😂
What a bad luck😤
$BTC
{future}(BTCUSDT)
LOL.... Bitcoin hitting new highs🤧
Me at 50K: "I'll wait for a pullback"😂😂😂
What a bad luck😤
$BTC
Me at 50K: "I'll wait for a pullback"😂😂😂
What a bad luck😤
$BTC

1
315
·
--
A $1.72M Bitcoin Headline That Hasn't Actually Happened Yet
A Bitcoin wallet dormant since May 2011 moved 20.43 BTC today, worth about $1.7 million at current prices. Headlines are calling this a "$1.72 million profit realized."
Here's what the on-chain data actually shows.
None of that BTC has touched a known exchange deposit address yet. Moving coins out of a dormant wallet and realizing an actual profit are two different events. The first confirms activity. The second requires an actual sale.
I think that distinction matters, tbh, since it's a gap showing up elsewhere this week too, an authorization isn't an executed purchase, an approval isn't a completed trade, a wallet movement isn't a confirmed sale. The headline assumes the last step already happened. The data doesn't confirm that yet.
Worth noting the origin story here too. Arkham's tracing shows this wallet originally received Slush Pool mining payouts, not a simple purchase at $3-4 a coin. This person was likely mining Bitcoin directly back in 2011, not buying it off an exchange.
Over its life, the address took in 429.88 BTC across 43 separate payments. What moved today, 20.43 BTC, is a small remainder of that, not the full historical position.
There's one more timing detail worth flagging, tbh. This movement lands about a month before Mt. Gox's October 31 creditor compensation deadline, and the same wallet shows a transaction to a Mt. Gox deposit address back in 2011.
Whether that's connected or just coincidence, honestly, I haven't seen it confirmed either way.
Not dismissing the story. A 2011 miner's wallet waking up after 15 years is genuinely rare. Just noting "profit realized" is doing more work in these headlines than the data currently supports.
$BTC
#MicronBeatsEarningsLiftsGuidance
#KoreaProposesTokenizingStocksAndBonds
#DollarIndexHitsHighestSinceMay2025
#US10YearYieldNears5.3%
{future}(BTCUSDT)
A $1.72M Bitcoin Headline That Hasn't Actually Happened Yet
A Bitcoin wallet dormant since May 2011 moved 20.43 BTC today, worth about $1.7 million at current prices. Headlines are calling this a "$1.72 million profit realized."
Here's what the on-chain data actually shows.
None of that BTC has touched a known exchange deposit address yet. Moving coins out of a dormant wallet and realizing an actual profit are two different events. The first confirms activity. The second requires an actual sale.
I think that distinction matters, tbh, since it's a gap showing up elsewhere this week too, an authorization isn't an executed purchase, an approval isn't a completed trade, a wallet movement isn't a confirmed sale. The headline assumes the last step already happened. The data doesn't confirm that yet.
Worth noting the origin story here too. Arkham's tracing shows this wallet originally received Slush Pool mining payouts, not a simple purchase at $3-4 a coin. This person was likely mining Bitcoin directly back in 2011, not buying it off an exchange.
Over its life, the address took in 429.88 BTC across 43 separate payments. What moved today, 20.43 BTC, is a small remainder of that, not the full historical position.
There's one more timing detail worth flagging, tbh. This movement lands about a month before Mt. Gox's October 31 creditor compensation deadline, and the same wallet shows a transaction to a Mt. Gox deposit address back in 2011.
Whether that's connected or just coincidence, honestly, I haven't seen it confirmed either way.
Not dismissing the story. A 2011 miner's wallet waking up after 15 years is genuinely rare. Just noting "profit realized" is doing more work in these headlines than the data currently supports.
$BTC
#MicronBeatsEarningsLiftsGuidance
#KoreaProposesTokenizingStocksAndBonds
#DollarIndexHitsHighestSinceMay2025
#US10YearYieldNears5.3%
A Bitcoin wallet dormant since May 2011 moved 20.43 BTC today, worth about $1.7 million at current prices. Headlines are calling this a "$1.72 million profit realized."
Here's what the on-chain data actually shows.
None of that BTC has touched a known exchange deposit address yet. Moving coins out of a dormant wallet and realizing an actual profit are two different events. The first confirms activity. The second requires an actual sale.
I think that distinction matters, tbh, since it's a gap showing up elsewhere this week too, an authorization isn't an executed purchase, an approval isn't a completed trade, a wallet movement isn't a confirmed sale. The headline assumes the last step already happened. The data doesn't confirm that yet.
Worth noting the origin story here too. Arkham's tracing shows this wallet originally received Slush Pool mining payouts, not a simple purchase at $3-4 a coin. This person was likely mining Bitcoin directly back in 2011, not buying it off an exchange.
Over its life, the address took in 429.88 BTC across 43 separate payments. What moved today, 20.43 BTC, is a small remainder of that, not the full historical position.
There's one more timing detail worth flagging, tbh. This movement lands about a month before Mt. Gox's October 31 creditor compensation deadline, and the same wallet shows a transaction to a Mt. Gox deposit address back in 2011.
Whether that's connected or just coincidence, honestly, I haven't seen it confirmed either way.
Not dismissing the story. A 2011 miner's wallet waking up after 15 years is genuinely rare. Just noting "profit realized" is doing more work in these headlines than the data currently supports.
$BTC
#MicronBeatsEarningsLiftsGuidance
#KoreaProposesTokenizingStocksAndBonds
#DollarIndexHitsHighestSinceMay2025
#US10YearYieldNears5.3%

2
255
·
--

Мақала
🚨WHY BITCOIN NEEDS ITS OWN SEATDarius Dale just said Bitcoin deserves an allocation in your portfolio because it's a different exposure than stocks, and a different exposure than gold.
Not a new take from him. He's run a 60/30/10 model for a while now, 60% stocks, 30% gold, 10% Bitcoin, built on the idea that each piece moves for different reasons.
Ran the split on a $100k portfolio and that's $10k in Bitcoin sitting next to $30k in gold, not instead of it. That's the part people miss when they hear "Bitcoin vs gold" debates, his framework isn't choosing one, it's stacking two separate insurance policies against two different risks.
What's interesting is where each piece is actually supposed to do its job. Stocks cover growth. Gold covers currency debasement and crisis fear. Bitcoin's meant to cover something neither of those two fully reaches, monetary regime change, if the thesis holds.
Curious if you're running anything close to that split, or still parked in a traditional 60/40 with Bitcoin left out entirely.
$BTC
#EtherGains70.9%InQ3
#TreasuryLetsStatesFileStablecoinCertificationsEarly
#BitcoinETFsTake$6.34BillionInQ3
#KoreaProposesTokenizingStocksAndBonds
#CFTCSubmitsTwoEventContractRulesToWhiteHouse
🚨WHY BITCOIN NEEDS ITS OWN SEAT
Darius Dale just said Bitcoin deserves an allocation in your portfolio because it's a different exposure than stocks, and a different exposure than gold.
Not a new take from him. He's run a 60/30/10 model for a while now, 60% stocks, 30% gold, 10% Bitcoin, built on the idea that each piece moves for different reasons.
Ran the split on a $100k portfolio and that's $10k in Bitcoin sitting next to $30k in gold, not instead of it. That's the part people miss when they hear "Bitcoin vs gold" debates, his framework isn't choosing one, it's stacking two separate insurance policies against two different risks.
What's interesting is where each piece is actually supposed to do its job. Stocks cover growth. Gold covers currency debasement and crisis fear. Bitcoin's meant to cover something neither of those two fully reaches, monetary regime change, if the thesis holds.
Curious if you're running anything close to that split, or still parked in a traditional 60/40 with Bitcoin left out entirely.
$BTC
#EtherGains70.9%InQ3
#TreasuryLetsStatesFileStablecoinCertificationsEarly
#BitcoinETFsTake$6.34BillionInQ3
#KoreaProposesTokenizingStocksAndBonds
#CFTCSubmitsTwoEventContractRulesToWhiteHouse
Not a new take from him. He's run a 60/30/10 model for a while now, 60% stocks, 30% gold, 10% Bitcoin, built on the idea that each piece moves for different reasons.
Ran the split on a $100k portfolio and that's $10k in Bitcoin sitting next to $30k in gold, not instead of it. That's the part people miss when they hear "Bitcoin vs gold" debates, his framework isn't choosing one, it's stacking two separate insurance policies against two different risks.
What's interesting is where each piece is actually supposed to do its job. Stocks cover growth. Gold covers currency debasement and crisis fear. Bitcoin's meant to cover something neither of those two fully reaches, monetary regime change, if the thesis holds.
Curious if you're running anything close to that split, or still parked in a traditional 60/40 with Bitcoin left out entirely.
$BTC
#EtherGains70.9%InQ3
#TreasuryLetsStatesFileStablecoinCertificationsEarly
#BitcoinETFsTake$6.34BillionInQ3
#KoreaProposesTokenizingStocksAndBonds
#CFTCSubmitsTwoEventContractRulesToWhiteHouse
1
329
·
--
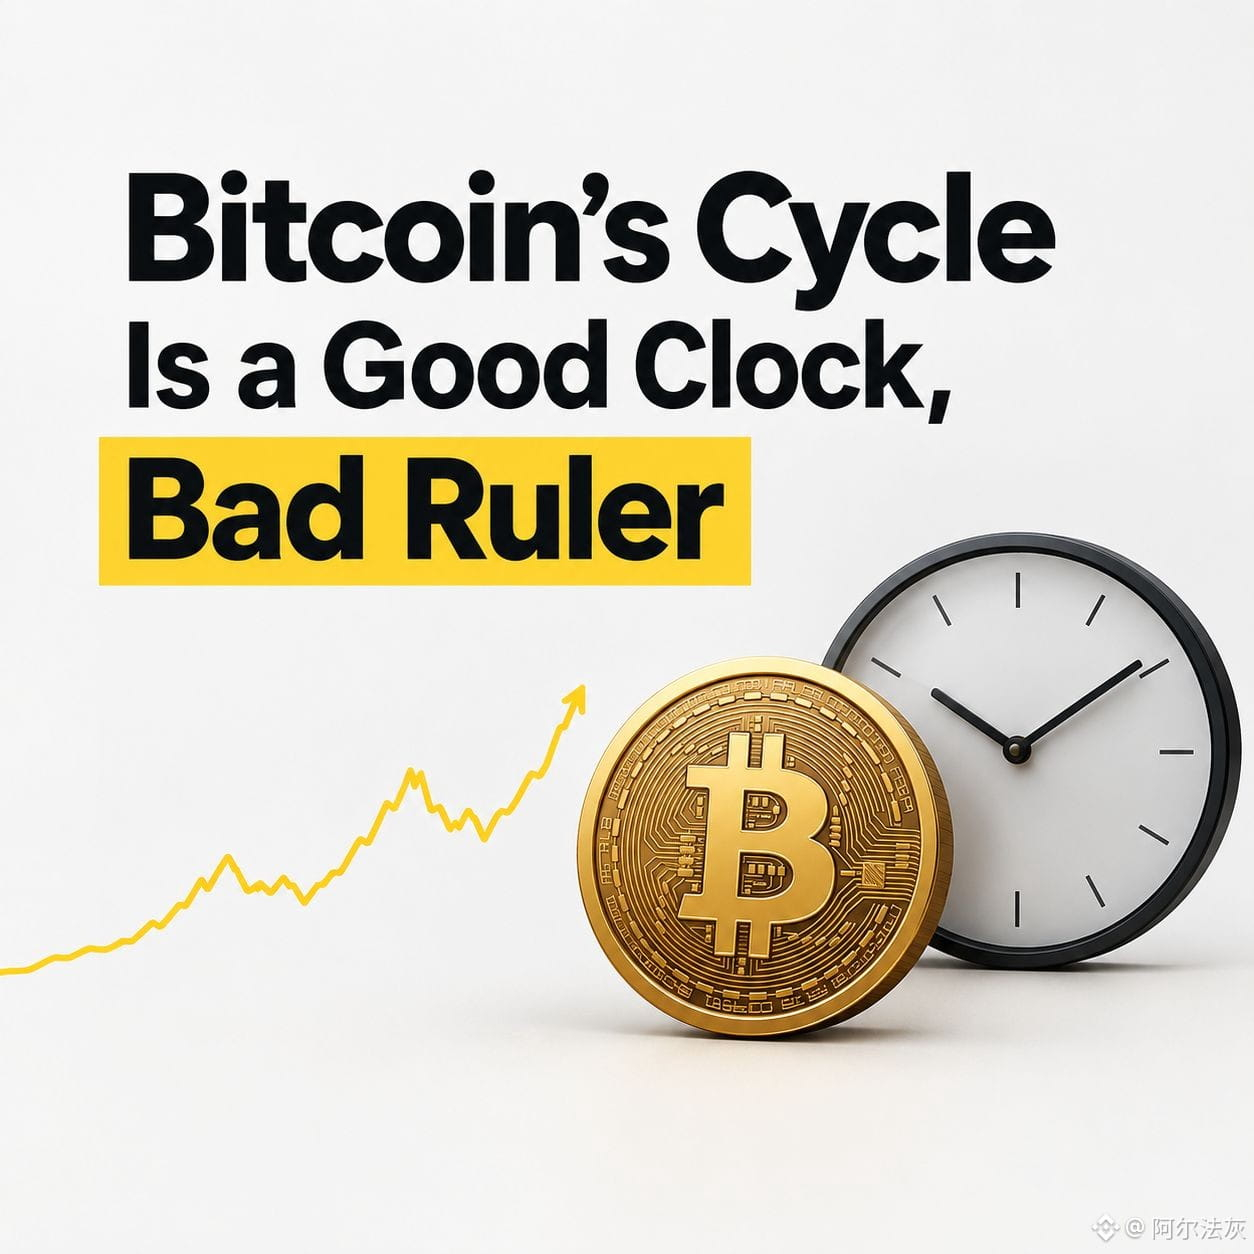
Bitcoin's Cycle Is a Good Clock, Bad Ruler
The $300K Bitcoin call is really two calls stapled together. The cycle repeats on time, and it repeats at size. I buy the first one a lot more than the second. 🧭
Timing's easy. The last peak came in October 2025, about 18 months after the April 2024 halving, right where the old pattern says it should. Keep that lag and the 2028 halving points to a top around late 2029. That's my inference, but it makes "by 2030" a fair date.
Size is where I get stuck.
The 2018 low to the 2021 peak was ~21x. The 2022 low to the October 2025 peak was ~8x. $300K from a ~$60K low is 5x, so the shrinking multiples alone don't kill it. What bugs me is that $300K is also a ~$6T market cap, roughly 2.4x the October 2025 peak. That's a lot of new money.$BTC
And the drop doesn't match. Past cycles fell 77–87% from the top. This one's down ~54% so far. The 8x came with a 77% crash on the other side, so a cycle that falls less probably doesn't rise more. Only three prior cycles though, so that's a lean, not a law.
My guess at why: flows. Issuance is ~450 BTC a day, about $38M at today's $83.5K open. One ETF day last week took in $434M. Gross, one day, so I'm not putting a ratio on it. But the gap is big. When flows set the price instead of issuance, swings probably get smaller both ways. Probably.
What could break my read: if the bottom isn't in, "shallow" just meant early. And enough people trade the cycle that it can keep working on belief alone.
So if the ~$58–60K low goes, forget everything above it. If it holds and big ETF days keep stacking, the clock's working, and the only open question is the ruler.
#EtherGains70.9%InQ3
#US10YearYieldNears5.3%
#DollarIndexHitsHighestSinceMay2025
#USWeeklyJoblessClaimsFallTo197000
#KoreaProposesTokenizingStocksAndBonds
Bitcoin's Cycle Is a Good Clock, Bad Ruler
The $300K Bitcoin call is really two calls stapled together. The cycle repeats on time, and it repeats at size. I buy the first one a lot more than the second. 🧭
Timing's easy. The last peak came in October 2025, about 18 months after the April 2024 halving, right where the old pattern says it should. Keep that lag and the 2028 halving points to a top around late 2029. That's my inference, but it makes "by 2030" a fair date.
Size is where I get stuck.
The 2018 low to the 2021 peak was ~21x. The 2022 low to the October 2025 peak was ~8x. $300K from a ~$60K low is 5x, so the shrinking multiples alone don't kill it. What bugs me is that $300K is also a ~$6T market cap, roughly 2.4x the October 2025 peak. That's a lot of new money.$BTC
And the drop doesn't match. Past cycles fell 77–87% from the top. This one's down ~54% so far. The 8x came with a 77% crash on the other side, so a cycle that falls less probably doesn't rise more. Only three prior cycles though, so that's a lean, not a law.
My guess at why: flows. Issuance is ~450 BTC a day, about $38M at today's $83.5K open. One ETF day last week took in $434M. Gross, one day, so I'm not putting a ratio on it. But the gap is big. When flows set the price instead of issuance, swings probably get smaller both ways. Probably.
What could break my read: if the bottom isn't in, "shallow" just meant early. And enough people trade the cycle that it can keep working on belief alone.
So if the ~$58–60K low goes, forget everything above it. If it holds and big ETF days keep stacking, the clock's working, and the only open question is the ruler.
#EtherGains70.9%InQ3
#US10YearYieldNears5.3%
#DollarIndexHitsHighestSinceMay2025
#USWeeklyJoblessClaimsFallTo197000
#KoreaProposesTokenizingStocksAndBonds
The $300K Bitcoin call is really two calls stapled together. The cycle repeats on time, and it repeats at size. I buy the first one a lot more than the second. 🧭
Timing's easy. The last peak came in October 2025, about 18 months after the April 2024 halving, right where the old pattern says it should. Keep that lag and the 2028 halving points to a top around late 2029. That's my inference, but it makes "by 2030" a fair date.
Size is where I get stuck.
The 2018 low to the 2021 peak was ~21x. The 2022 low to the October 2025 peak was ~8x. $300K from a ~$60K low is 5x, so the shrinking multiples alone don't kill it. What bugs me is that $300K is also a ~$6T market cap, roughly 2.4x the October 2025 peak. That's a lot of new money.$BTC
And the drop doesn't match. Past cycles fell 77–87% from the top. This one's down ~54% so far. The 8x came with a 77% crash on the other side, so a cycle that falls less probably doesn't rise more. Only three prior cycles though, so that's a lean, not a law.
My guess at why: flows. Issuance is ~450 BTC a day, about $38M at today's $83.5K open. One ETF day last week took in $434M. Gross, one day, so I'm not putting a ratio on it. But the gap is big. When flows set the price instead of issuance, swings probably get smaller both ways. Probably.
What could break my read: if the bottom isn't in, "shallow" just meant early. And enough people trade the cycle that it can keep working on belief alone.
So if the ~$58–60K low goes, forget everything above it. If it holds and big ETF days keep stacking, the clock's working, and the only open question is the ruler.
#EtherGains70.9%InQ3
#US10YearYieldNears5.3%
#DollarIndexHitsHighestSinceMay2025
#USWeeklyJoblessClaimsFallTo197000
#KoreaProposesTokenizingStocksAndBonds
1
211
·
--
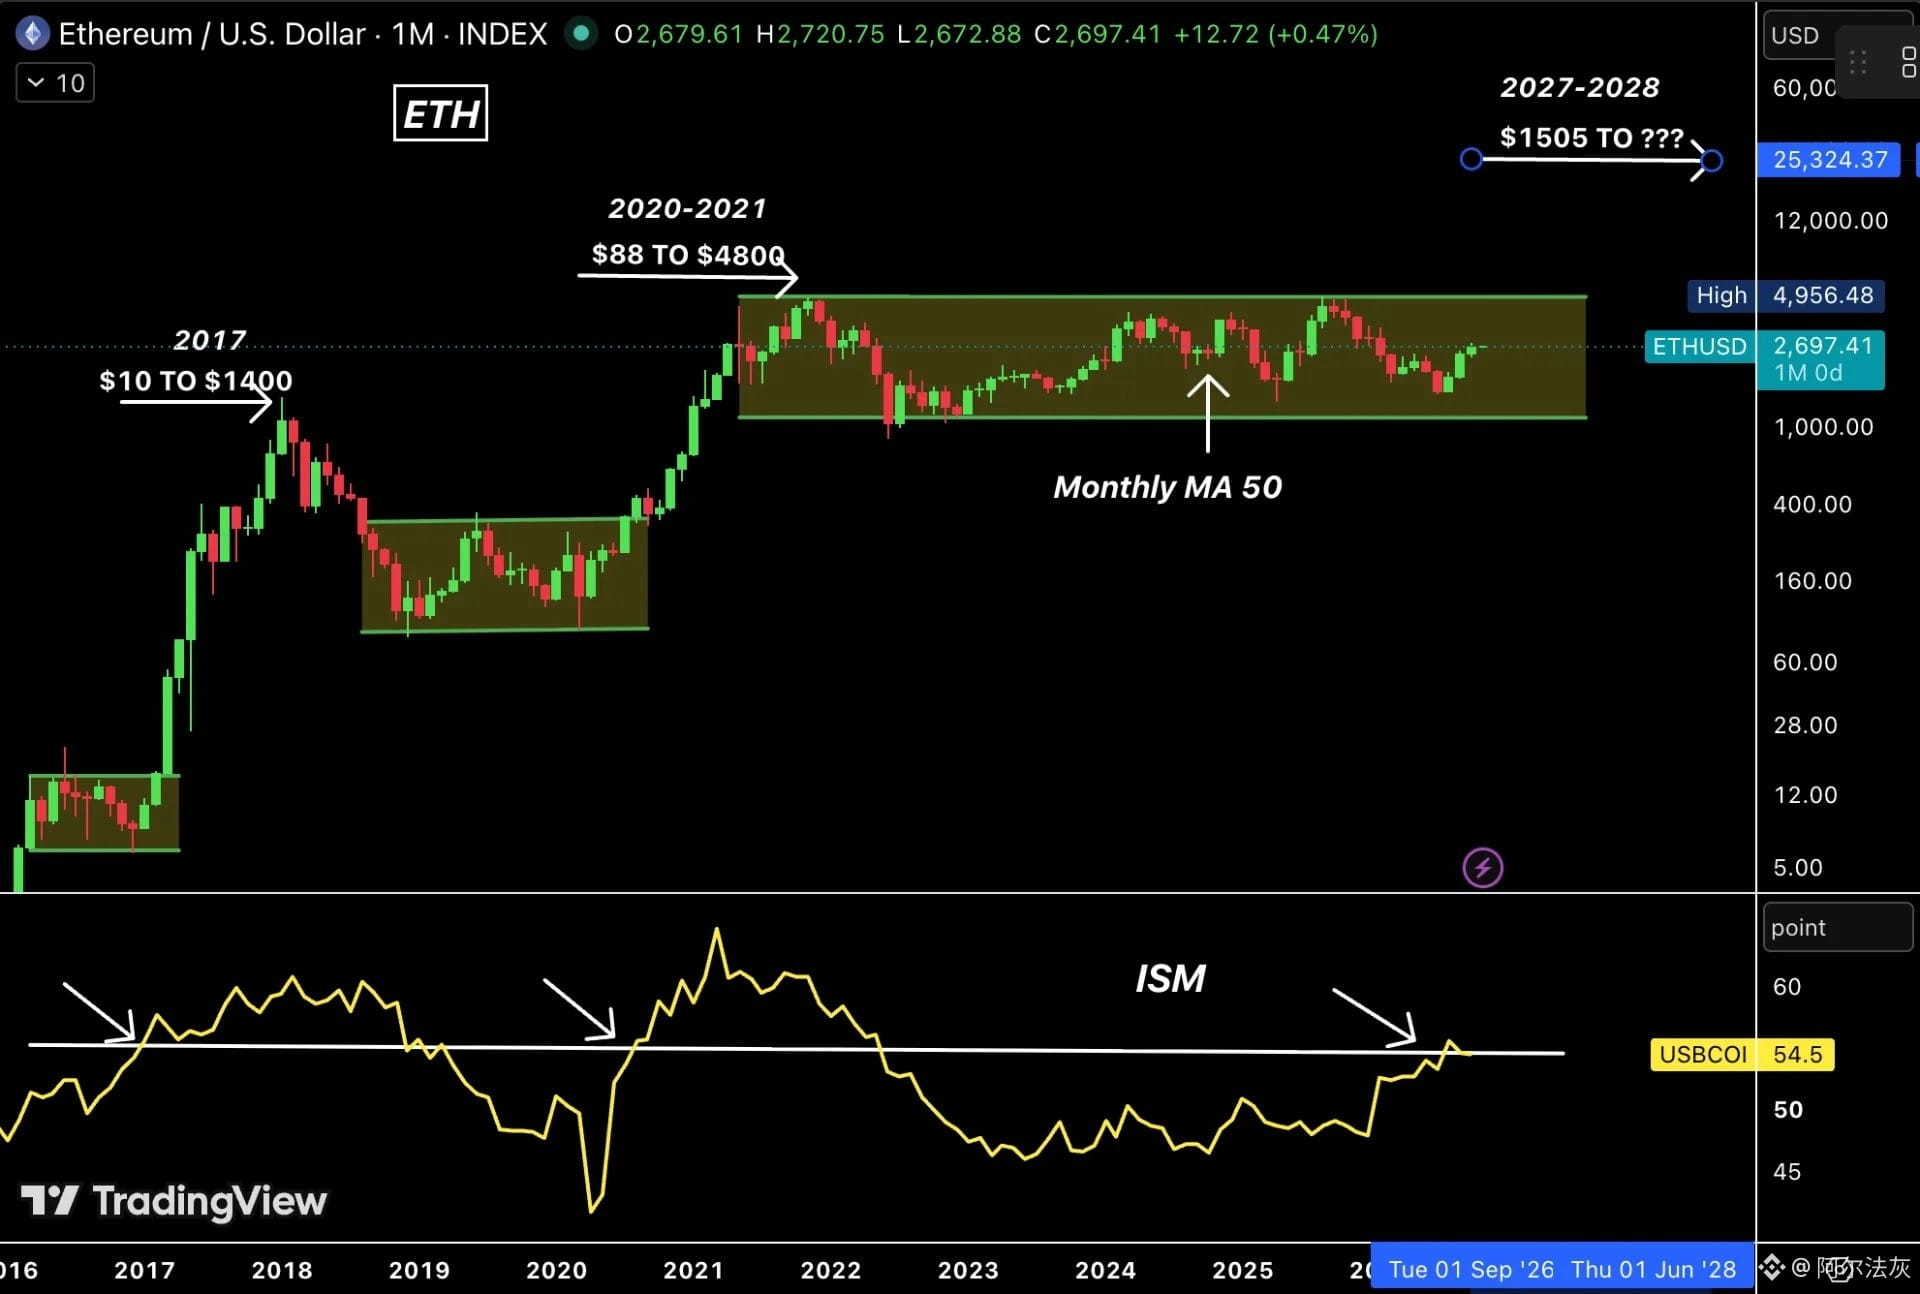
🚨 ETH IS WAITING ON ISM 56
I keep coming back to one macro level: 56.
In the previous two major ETH cycles, ISM moving above that area came before some of ETH’s biggest advances. That doesn’t mean ISM caused those rallies — two cycles aren’t enough to prove that — but the recurring threshold is hard to ignore.
Today, ISM came in at 54.5, slightly below the 54.8 forecast and August’s 54.6. Manufacturing is still expanding, but the acceleration hasn’t reached 56 yet.$ETH
And this is where I think the setup gets more interesting.
A sustained move from the mid-50s toward 60 would signal that the manufacturing cycle is gaining real momentum. If that happens while financial conditions and ETH’s structure remain supportive, the backdrop for higher-beta assets could look very different from today.
ETH closed September around $2,683 and is currently still around the $2.7K area.
So I’m not treating 56 as a magic bull-market trigger.
I’m treating it as a confirmation level.
If ISM breaks through 56 and keeps climbing, that’s when this historical pattern becomes much more interesting to watch.
#EtherGains70.9%InQ3
#US10YearYieldNears5.3%
#DollarIndexHitsHighestSinceMay2025
#USWeeklyJoblessClaimsFallTo197000
🚨 ETH IS WAITING ON ISM 56
I keep coming back to one macro level: 56.
In the previous two major ETH cycles, ISM moving above that area came before some of ETH’s biggest advances. That doesn’t mean ISM caused those rallies — two cycles aren’t enough to prove that — but the recurring threshold is hard to ignore.
Today, ISM came in at 54.5, slightly below the 54.8 forecast and August’s 54.6. Manufacturing is still expanding, but the acceleration hasn’t reached 56 yet.$ETH
And this is where I think the setup gets more interesting.
A sustained move from the mid-50s toward 60 would signal that the manufacturing cycle is gaining real momentum. If that happens while financial conditions and ETH’s structure remain supportive, the backdrop for higher-beta assets could look very different from today.
ETH closed September around $2,683 and is currently still around the $2.7K area.
So I’m not treating 56 as a magic bull-market trigger.
I’m treating it as a confirmation level.
If ISM breaks through 56 and keeps climbing, that’s when this historical pattern becomes much more interesting to watch.
#EtherGains70.9%InQ3
#US10YearYieldNears5.3%
#DollarIndexHitsHighestSinceMay2025
#USWeeklyJoblessClaimsFallTo197000
I keep coming back to one macro level: 56.
In the previous two major ETH cycles, ISM moving above that area came before some of ETH’s biggest advances. That doesn’t mean ISM caused those rallies — two cycles aren’t enough to prove that — but the recurring threshold is hard to ignore.
Today, ISM came in at 54.5, slightly below the 54.8 forecast and August’s 54.6. Manufacturing is still expanding, but the acceleration hasn’t reached 56 yet.$ETH
And this is where I think the setup gets more interesting.
A sustained move from the mid-50s toward 60 would signal that the manufacturing cycle is gaining real momentum. If that happens while financial conditions and ETH’s structure remain supportive, the backdrop for higher-beta assets could look very different from today.
ETH closed September around $2,683 and is currently still around the $2.7K area.
So I’m not treating 56 as a magic bull-market trigger.
I’m treating it as a confirmation level.
If ISM breaks through 56 and keeps climbing, that’s when this historical pattern becomes much more interesting to watch.
#EtherGains70.9%InQ3
#US10YearYieldNears5.3%
#DollarIndexHitsHighestSinceMay2025
#USWeeklyJoblessClaimsFallTo197000
1
210
·
--
Жоғары (өспелі)
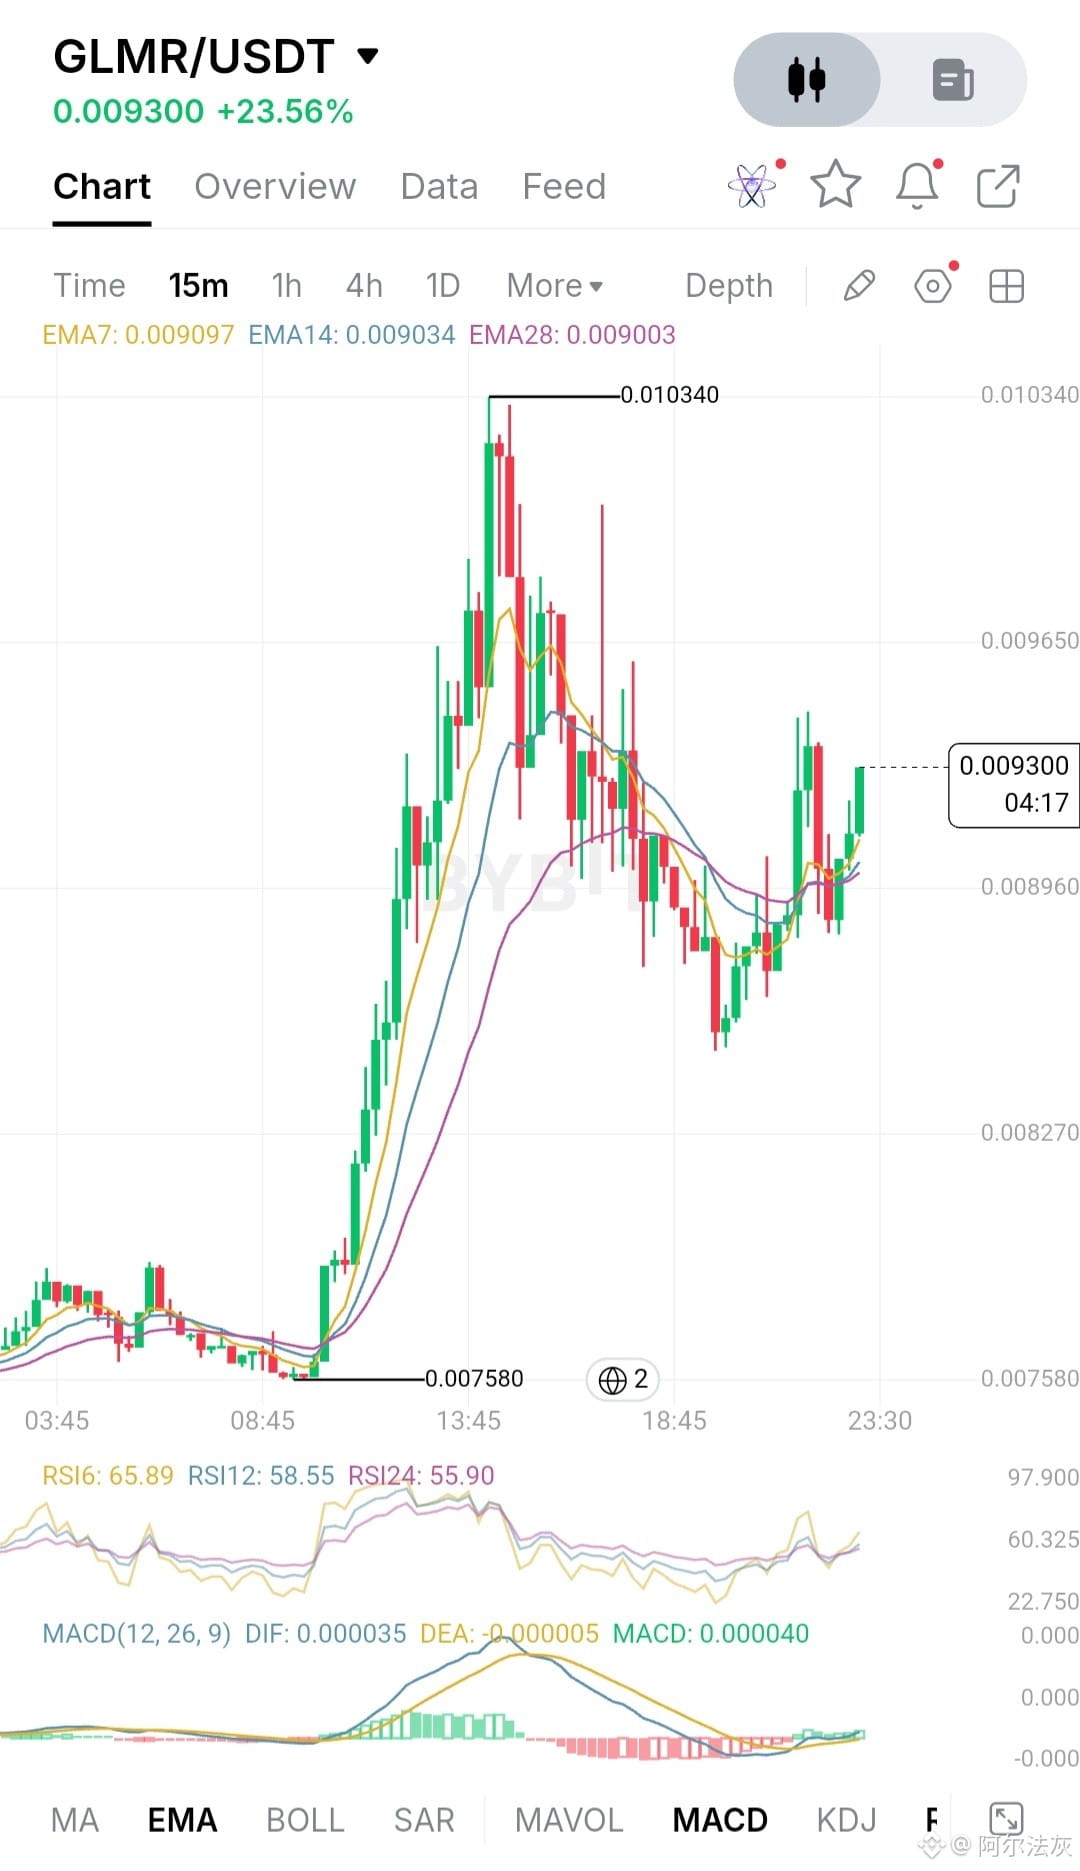
$GLMR LONG 🟢
second push forming, macd just flipped green again 🔁
ENTRY: $0.009150 – $0.009300
TP: $0.009650 | $0.009970 | $0.010340
SL: $0.008900
up almost 24% today, spiked to 0.01034, dumped hard back to 0.0086, chopped around down there for a bit, and's now climbing back with a fresh push.
macd just crossed back positive right as this leg kicked off, rsi's sitting in the mid 60s too, not overbought yet so there's still some room left honestly.
below 0.0089 is where this whole recovery attempt actually fails.
NFA.
#GLMRUSDT #Layer1 #PriceActionAnalysis #JapanMOFStudyGroupOnTokenizedGovtBonds
$GLMR LONG 🟢
second push forming, macd just flipped green again 🔁
ENTRY: $0.009150 – $0.009300
TP: $0.009650 | $0.009970 | $0.010340
SL: $0.008900
up almost 24% today, spiked to 0.01034, dumped hard back to 0.0086, chopped around down there for a bit, and's now climbing back with a fresh push.
macd just crossed back positive right as this leg kicked off, rsi's sitting in the mid 60s too, not overbought yet so there's still some room left honestly.
below 0.0089 is where this whole recovery attempt actually fails.
NFA.
#GLMRUSDT #Layer1 #PriceActionAnalysis #JapanMOFStudyGroupOnTokenizedGovtBonds
second push forming, macd just flipped green again 🔁
ENTRY: $0.009150 – $0.009300
TP: $0.009650 | $0.009970 | $0.010340
SL: $0.008900
up almost 24% today, spiked to 0.01034, dumped hard back to 0.0086, chopped around down there for a bit, and's now climbing back with a fresh push.
macd just crossed back positive right as this leg kicked off, rsi's sitting in the mid 60s too, not overbought yet so there's still some room left honestly.
below 0.0089 is where this whole recovery attempt actually fails.
NFA.
#GLMRUSDT #Layer1 #PriceActionAnalysis #JapanMOFStudyGroupOnTokenizedGovtBonds
1
208
·
--
Жоғары (өспелі)
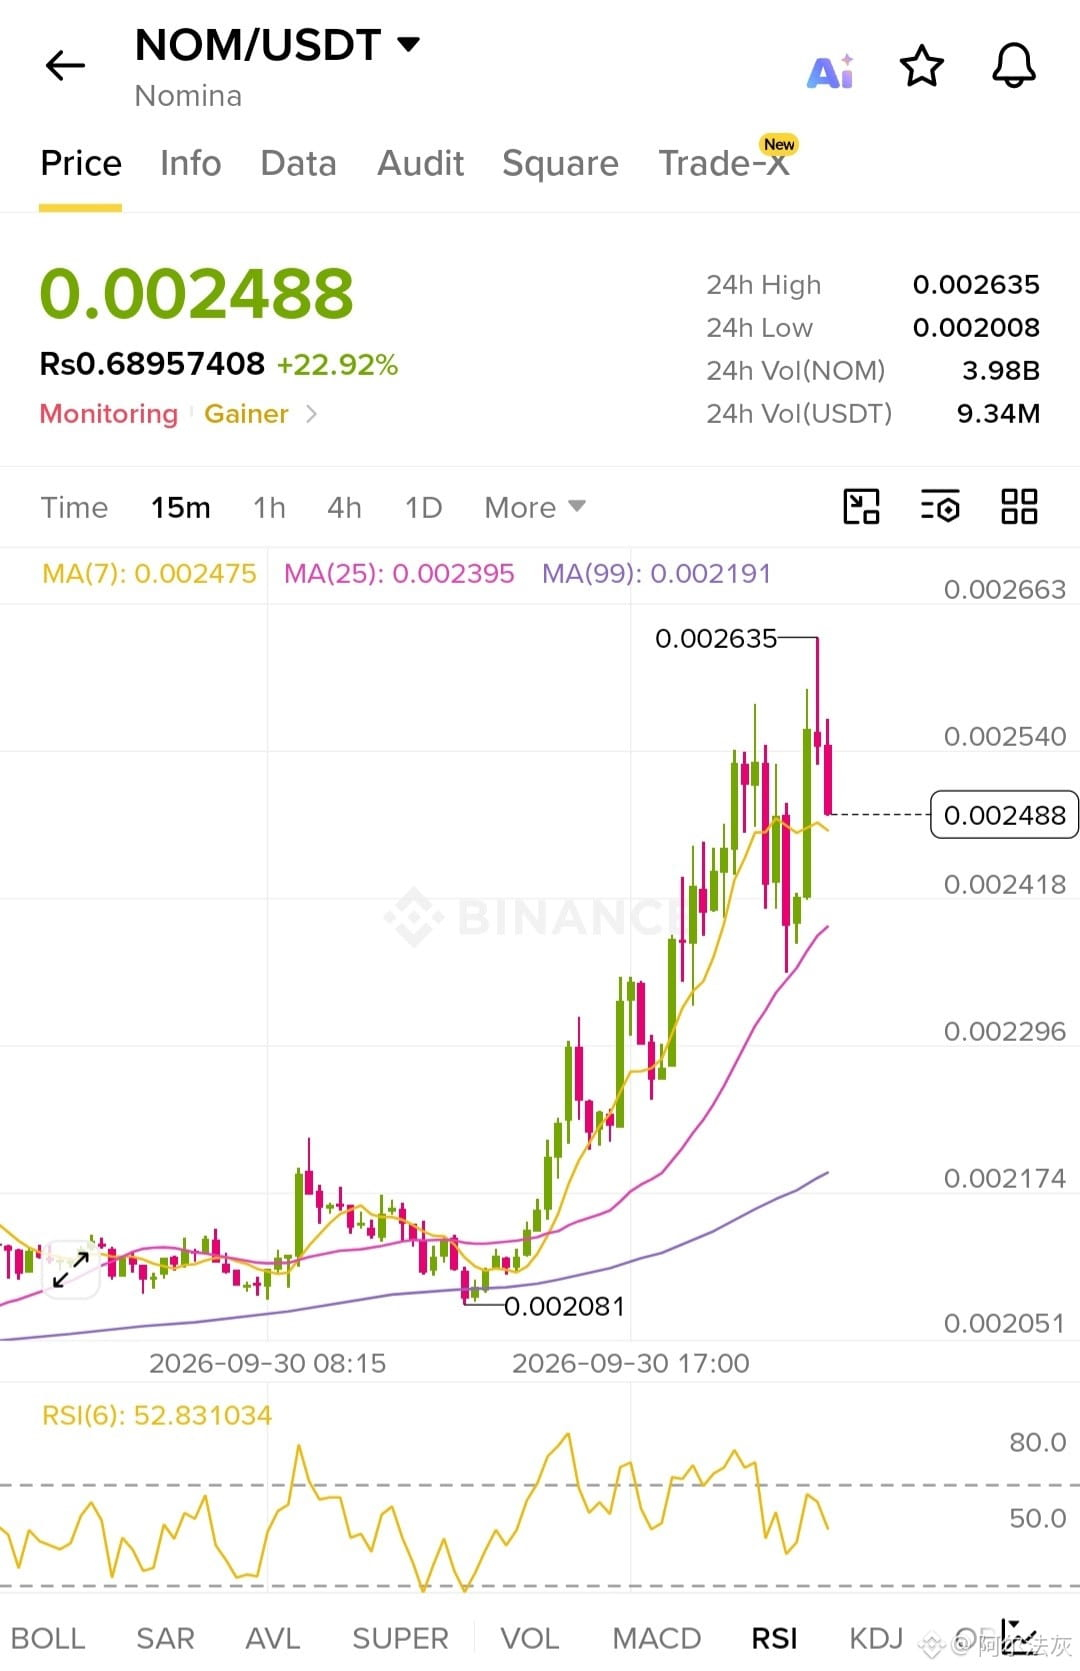
$NOM LONG🚀
{future}(NOMUSDT)
pulled back off the high, rsi's cooled down enough to like this again 🔁
ENTRY: $0.002420 – $0.002488
TP: $0.002540 | $0.002590 | $0.002635
SL: $0.002340
up almost 23% today, climbed from 0.00208 in a pretty clean staircase, tagged 0.002635, and's just come off that a touch now.
rsi's sitting around 53, nowhere close to overbought, so there's still room left if this keeps going honestly. all three moving averages are still stacked bullish underneath too.
below 0.00234 is where this whole staircase actually breaks.
NFA.
#NOM #Altseason #PriceAction #Write2Earn #JapanMOFStudyGroupOnTokenizedGovtBonds
$NOM LONG🚀
pulled back off the high, rsi's cooled down enough to like this again 🔁
ENTRY: $0.002420 – $0.002488
TP: $0.002540 | $0.002590 | $0.002635
SL: $0.002340
up almost 23% today, climbed from 0.00208 in a pretty clean staircase, tagged 0.002635, and's just come off that a touch now.
rsi's sitting around 53, nowhere close to overbought, so there's still room left if this keeps going honestly. all three moving averages are still stacked bullish underneath too.
below 0.00234 is where this whole staircase actually breaks.
NFA.
#NOM #Altseason #PriceAction #Write2Earn #JapanMOFStudyGroupOnTokenizedGovtBonds
pulled back off the high, rsi's cooled down enough to like this again 🔁
ENTRY: $0.002420 – $0.002488
TP: $0.002540 | $0.002590 | $0.002635
SL: $0.002340
up almost 23% today, climbed from 0.00208 in a pretty clean staircase, tagged 0.002635, and's just come off that a touch now.
rsi's sitting around 53, nowhere close to overbought, so there's still room left if this keeps going honestly. all three moving averages are still stacked bullish underneath too.
below 0.00234 is where this whole staircase actually breaks.
NFA.
#NOM #Altseason #PriceAction #Write2Earn #JapanMOFStudyGroupOnTokenizedGovtBonds
2
359
·
--
Жоғары (өспелі)
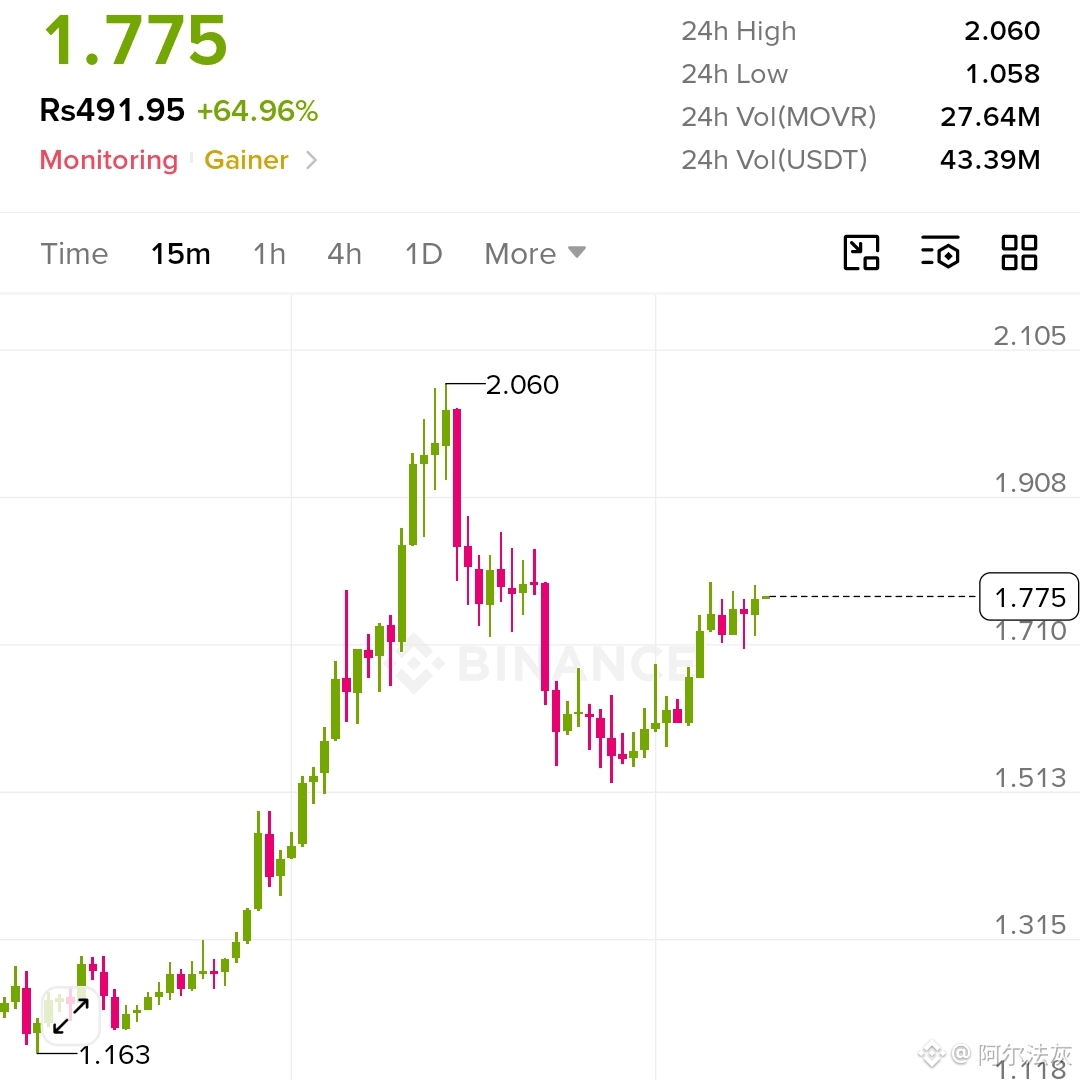
$MOVR LONG 🟢
$MOVR
{spot}(MOVRUSDT)
second push after the retrace, watching for continuation 🔁
ENTRY: $1.720 – $1.775
TP: $1.908 | $1.960 | $2.060
SL: $1.650
up 65% today, spiked to 2.06, dumped hard back to 1.51, and's now climbing back out in a fresh leg that looks steadier than the first one.
book's basically split, 52/48, no real lean either way right now, so i'm not reading too much into it.
below 1.65 is where this recovery leg actually fails.
#MOVR/USDT #Altseason #AltcoinSeasonIndexHoldsAbove60For5Days
#USADPAdds90000JobsInSeptember
#SECToClarifyOnChainFundraisingRules
$MOVR LONG 🟢
$MOVR
second push after the retrace, watching for continuation 🔁
ENTRY: $1.720 – $1.775
TP: $1.908 | $1.960 | $2.060
SL: $1.650
up 65% today, spiked to 2.06, dumped hard back to 1.51, and's now climbing back out in a fresh leg that looks steadier than the first one.
book's basically split, 52/48, no real lean either way right now, so i'm not reading too much into it.
below 1.65 is where this recovery leg actually fails.
#MOVR/USDT #Altseason #AltcoinSeasonIndexHoldsAbove60For5Days
#USADPAdds90000JobsInSeptember
#SECToClarifyOnChainFundraisingRules
$MOVR
second push after the retrace, watching for continuation 🔁
ENTRY: $1.720 – $1.775
TP: $1.908 | $1.960 | $2.060
SL: $1.650
up 65% today, spiked to 2.06, dumped hard back to 1.51, and's now climbing back out in a fresh leg that looks steadier than the first one.
book's basically split, 52/48, no real lean either way right now, so i'm not reading too much into it.
below 1.65 is where this recovery leg actually fails.
#MOVR/USDT #Altseason #AltcoinSeasonIndexHoldsAbove60For5Days
#USADPAdds90000JobsInSeptember
#SECToClarifyOnChainFundraisingRules
2
359
·
--
Жоғары (өспелі)
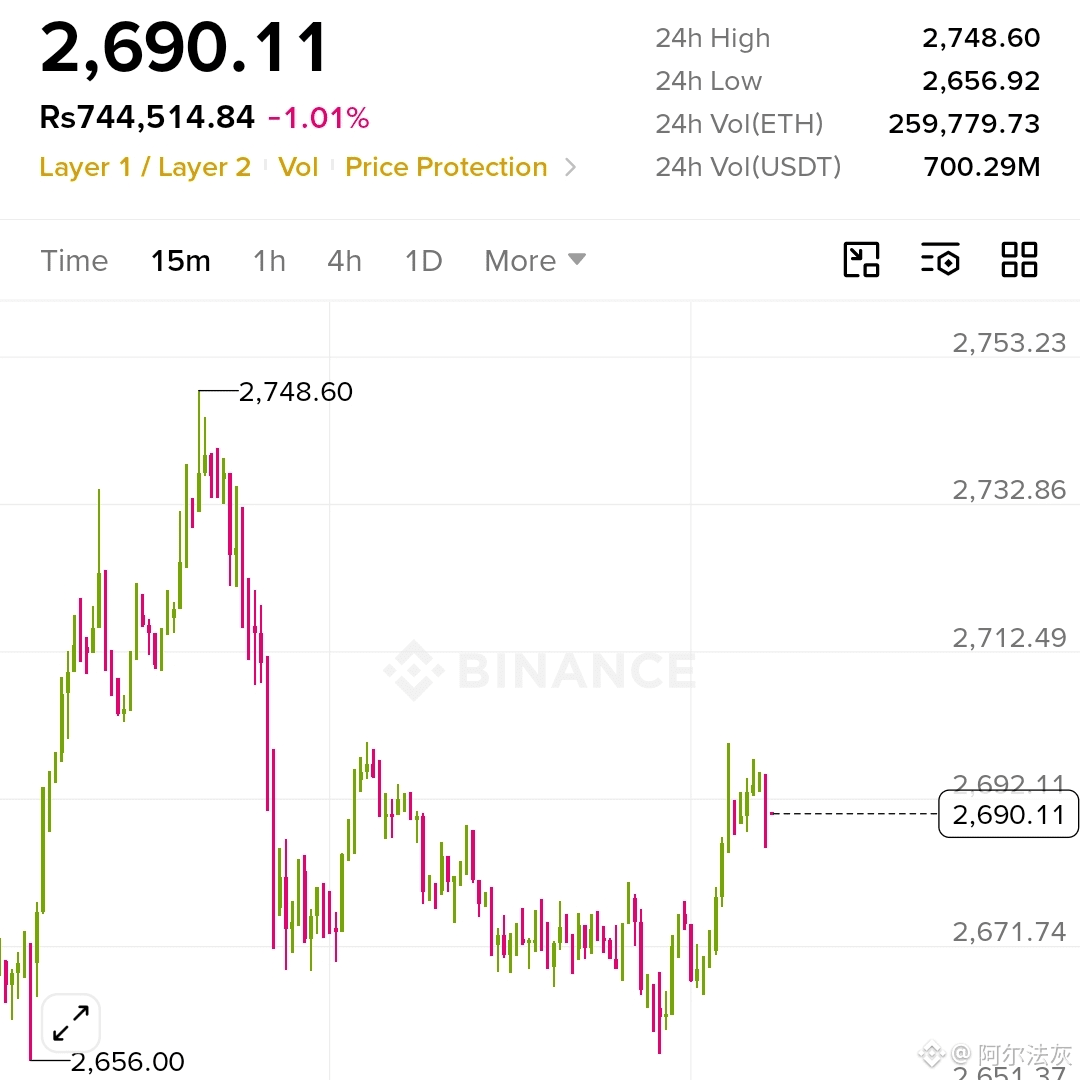
$ETH LONG 🟢 (bounce play)
sharp dip, now clawing its way back up 🔁
ENTRY: $2,675 – $2,690.11
TP: $2,712 | $2,733 | $2,748.60
SL: $2,651
dropped pretty fast from 2748 down to 2656, sat down there chopping around for a bit, and's just now starting to push back up out of that zone.
book's leaning heavy on the buy side, 92/8, that's about as lopsided as it gets honestly, feels like real conviction behind this bounce.
below 2,651 and i'd say the dip actually wins this one.
NFA.
#ETH $ETH
{spot}(ETHUSDT)
#SECToClarifyOnChainFundraisingRules
#UKFCAOpensCryptoFirmAuthorization
#JapanMOFStudyGroupOnTokenizedGovtBonds
#QNTRises287%
$ETH LONG 🟢 (bounce play)
sharp dip, now clawing its way back up 🔁
ENTRY: $2,675 – $2,690.11
TP: $2,712 | $2,733 | $2,748.60
SL: $2,651
dropped pretty fast from 2748 down to 2656, sat down there chopping around for a bit, and's just now starting to push back up out of that zone.
book's leaning heavy on the buy side, 92/8, that's about as lopsided as it gets honestly, feels like real conviction behind this bounce.
below 2,651 and i'd say the dip actually wins this one.
NFA.
#ETH $ETH
#SECToClarifyOnChainFundraisingRules
#UKFCAOpensCryptoFirmAuthorization
#JapanMOFStudyGroupOnTokenizedGovtBonds
#QNTRises287%
sharp dip, now clawing its way back up 🔁
ENTRY: $2,675 – $2,690.11
TP: $2,712 | $2,733 | $2,748.60
SL: $2,651
dropped pretty fast from 2748 down to 2656, sat down there chopping around for a bit, and's just now starting to push back up out of that zone.
book's leaning heavy on the buy side, 92/8, that's about as lopsided as it gets honestly, feels like real conviction behind this bounce.
below 2,651 and i'd say the dip actually wins this one.
NFA.
#ETH $ETH
#SECToClarifyOnChainFundraisingRules
#UKFCAOpensCryptoFirmAuthorization
#JapanMOFStudyGroupOnTokenizedGovtBonds
#QNTRises287%
2
101
·
--
Жоғары (өспелі)
$BNB LONG 🟢
just resting after the run, buyers still stacked underneath 🔁
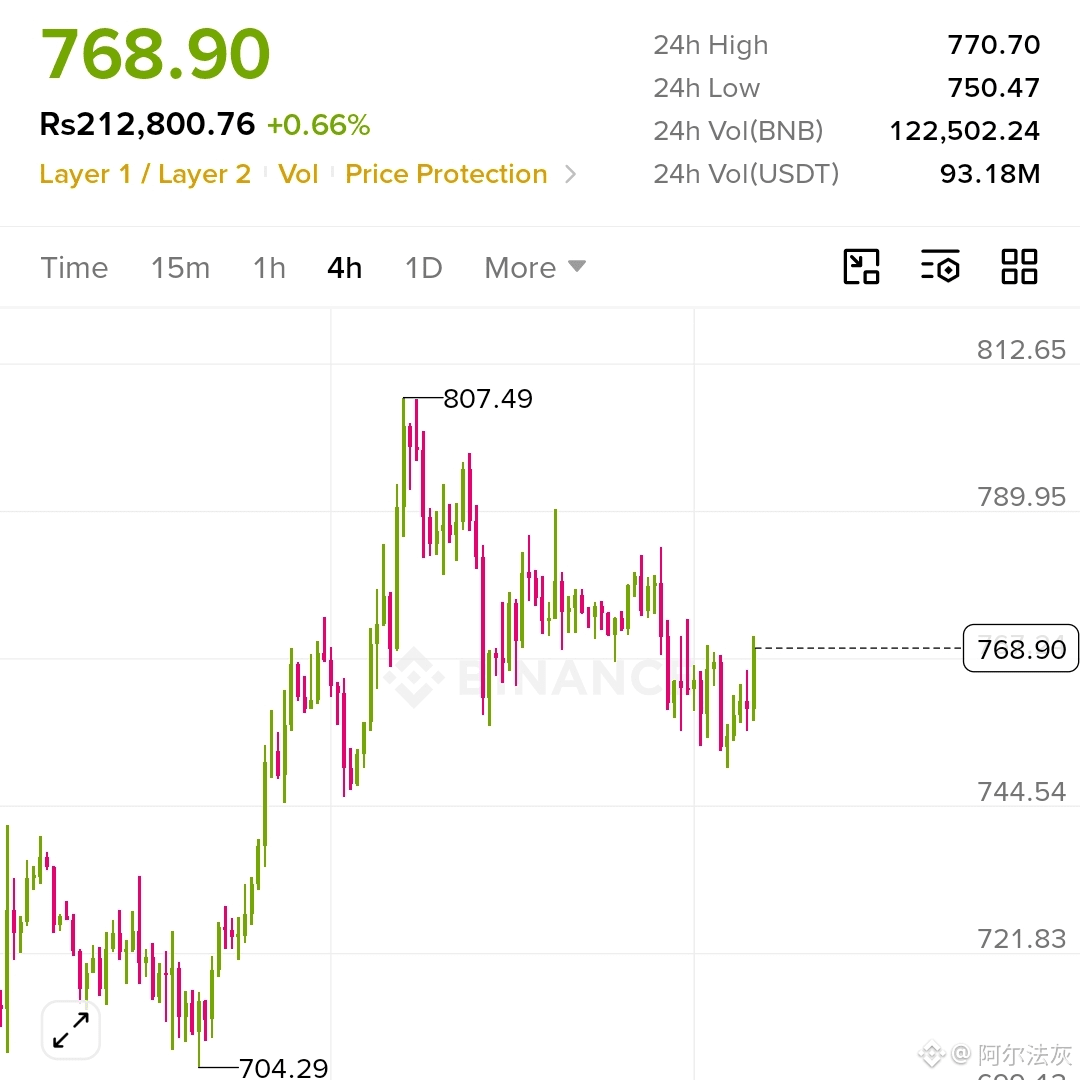
ENTRY: $758.00 – $768.90
TP: $789.95 | $807.49 | $825.00
SL: $744.00
this is the 4h chart so we're talking days here, not hours. it ran from 704 up to 807 and's just been going sideways since, nothing looks broken about it.
book's stacked heavy on the buy side, 84/16, about as one sided as i've seen in a while honestly.
above 744 i'm still good with this, that's the bottom of the whole resting zone.
NFA.
#BNB_Market_Update #Layer1 #BreakoutWatch
$BNB
{spot}(BNBUSDT)
$BNB LONG 🟢
just resting after the run, buyers still stacked underneath 🔁
ENTRY: $758.00 – $768.90
TP: $789.95 | $807.49 | $825.00
SL: $744.00
this is the 4h chart so we're talking days here, not hours. it ran from 704 up to 807 and's just been going sideways since, nothing looks broken about it.
book's stacked heavy on the buy side, 84/16, about as one sided as i've seen in a while honestly.
above 744 i'm still good with this, that's the bottom of the whole resting zone.
NFA.
#BNB_Market_Update #Layer1 #BreakoutWatch
$BNB
just resting after the run, buyers still stacked underneath 🔁
ENTRY: $758.00 – $768.90
TP: $789.95 | $807.49 | $825.00
SL: $744.00
this is the 4h chart so we're talking days here, not hours. it ran from 704 up to 807 and's just been going sideways since, nothing looks broken about it.
book's stacked heavy on the buy side, 84/16, about as one sided as i've seen in a while honestly.
above 744 i'm still good with this, that's the bottom of the whole resting zone.
NFA.
#BNB_Market_Update #Layer1 #BreakoutWatch
$BNB
1
69
·
--
Nvidia's Buyback Returns Have Been Shrinking Every Time
"History says this buyback is bullish" is running everywhere today. Technically, it's true. Nvidia's stock beat the S&P 500 after all three of its previous buyback increases.
Here's the part that headline skips past though, honestly.
Nvidia's board added $25 billion in August 2023. The stock rose about 175% over the next 12 months, versus 27% for the index.
Then $50 billion in August 2024. Stock up 43% versus the index's 16%.
Then $60 billion in August 2025. Stock up just 26% versus the index's 19%.
175%, then 43%, then 26%. I noticed the pattern before I noticed the individual numbers, tbh.
Every single increase has been bigger than the last. Every single return has been smaller.
I think that's the actual story here, not "buybacks are bullish," which is technically correct but flattens a much sharper trend underneath it. The market's still beating the index each time, sure. But the margin of outperformance has been shrinking fast, even as Nvidia throws increasingly larger sums behind it.
Now there's a $150 billion increase. More than double the last one. Total authorization up to $235 billion.
If the trend holds, this round's percentage outperformance should be smaller still, tbh. Not because the buyback's weaker. Because the stock's starting from a vastly bigger base each time, with less room left to double from here the way it did back in 2023.
Worth being fair to the other read too, honestly. Apple's own buyback history shows something similar. Consistent outperformance, but the earliest, smallest increases produced the biggest relative gains. That's arguably just how compounding works on a stock that keeps growing, not a warning sign specifically.
I'm not predicting this one breaks the pattern. Just noting "history says buy" is true, and it's also quietly hiding a fairly consistent deceleration inside it, one that's easy to miss if you only check whether the stock beat the market, not by how much less each time.
{spot}(NVDABUSDT)
$NVDAB
Nvidia's Buyback Returns Have Been Shrinking Every Time
"History says this buyback is bullish" is running everywhere today. Technically, it's true. Nvidia's stock beat the S&P 500 after all three of its previous buyback increases.
Here's the part that headline skips past though, honestly.
Nvidia's board added $25 billion in August 2023. The stock rose about 175% over the next 12 months, versus 27% for the index.
Then $50 billion in August 2024. Stock up 43% versus the index's 16%.
Then $60 billion in August 2025. Stock up just 26% versus the index's 19%.
175%, then 43%, then 26%. I noticed the pattern before I noticed the individual numbers, tbh.
Every single increase has been bigger than the last. Every single return has been smaller.
I think that's the actual story here, not "buybacks are bullish," which is technically correct but flattens a much sharper trend underneath it. The market's still beating the index each time, sure. But the margin of outperformance has been shrinking fast, even as Nvidia throws increasingly larger sums behind it.
Now there's a $150 billion increase. More than double the last one. Total authorization up to $235 billion.
If the trend holds, this round's percentage outperformance should be smaller still, tbh. Not because the buyback's weaker. Because the stock's starting from a vastly bigger base each time, with less room left to double from here the way it did back in 2023.
Worth being fair to the other read too, honestly. Apple's own buyback history shows something similar. Consistent outperformance, but the earliest, smallest increases produced the biggest relative gains. That's arguably just how compounding works on a stock that keeps growing, not a warning sign specifically.
I'm not predicting this one breaks the pattern. Just noting "history says buy" is true, and it's also quietly hiding a fairly consistent deceleration inside it, one that's easy to miss if you only check whether the stock beat the market, not by how much less each time.
$NVDAB
"History says this buyback is bullish" is running everywhere today. Technically, it's true. Nvidia's stock beat the S&P 500 after all three of its previous buyback increases.
Here's the part that headline skips past though, honestly.
Nvidia's board added $25 billion in August 2023. The stock rose about 175% over the next 12 months, versus 27% for the index.
Then $50 billion in August 2024. Stock up 43% versus the index's 16%.
Then $60 billion in August 2025. Stock up just 26% versus the index's 19%.
175%, then 43%, then 26%. I noticed the pattern before I noticed the individual numbers, tbh.
Every single increase has been bigger than the last. Every single return has been smaller.
I think that's the actual story here, not "buybacks are bullish," which is technically correct but flattens a much sharper trend underneath it. The market's still beating the index each time, sure. But the margin of outperformance has been shrinking fast, even as Nvidia throws increasingly larger sums behind it.
Now there's a $150 billion increase. More than double the last one. Total authorization up to $235 billion.
If the trend holds, this round's percentage outperformance should be smaller still, tbh. Not because the buyback's weaker. Because the stock's starting from a vastly bigger base each time, with less room left to double from here the way it did back in 2023.
Worth being fair to the other read too, honestly. Apple's own buyback history shows something similar. Consistent outperformance, but the earliest, smallest increases produced the biggest relative gains. That's arguably just how compounding works on a stock that keeps growing, not a warning sign specifically.
I'm not predicting this one breaks the pattern. Just noting "history says buy" is true, and it's also quietly hiding a fairly consistent deceleration inside it, one that's easy to miss if you only check whether the stock beat the market, not by how much less each time.
$NVDAB

1
226
·
--
Monday's Gold Crash Was Statistically Rare. Here's How Rare.
Gold's daily moves have averaged just +0.05% since 2006. Standard deviation of 1.19%.
Monday's drop worked out to a Z-score of -2.90. Deep in the extreme left tail of that entire distribution.
I think that number matters more than "gold crashed 4%" on its own, tbh.
A Z-score that far out means this wasn't just a bad day. It was one of the more statistically unusual single-day moves gold's produced in nearly two decades of daily pricing. I don't think enough of the coverage sat with that.
Here's where things actually stand today.
Gold gapped down and closed near $4,116 Monday. Right at the $4,100 support zone. It's bounced modestly since, up around 0.3-1% through Tuesday, though still sitting well below both its short-term moving averages.$XAUT
That gap between price and the averages is unusually wide right now. I think it's the more interesting detail than the bounce itself.
A gap this wide typically means one of two things happens next. Either stabilization sets in as the extreme move gets digested. Or the wideness becomes the setup for another leg once momentum picks a direction.
I keep coming back to the same question, honestly.
The actual test isn't today's small bounce. It's whether $4,100 holds if it gets retested. That level, not the recovery candle sitting on top of it, is what actually tells you whether Monday was the extreme end of a selloff or just the first leg of one.
Worth remembering, tbh. Statistically rare moves don't resolve on a fixed schedule. Sometimes they mark exhaustion. Sometimes they're the start of something bigger.
The Z-score tells you how unusual the move was. It doesn't tell you which way it resolves from here.
#QNTRises287%
#TrumpRejectsAIRulesForVoluntaryAudits
#BitgetHotWalletBreachTiedToThirdPartySecurityFlaw
#OpenAIUnveilsAlwaysOnAgentDots
#ChainlinkLaunchesBankSWIFTLedgerFramework
{spot}(XAUTUSDT)
Monday's Gold Crash Was Statistically Rare. Here's How Rare.
Gold's daily moves have averaged just +0.05% since 2006. Standard deviation of 1.19%.
Monday's drop worked out to a Z-score of -2.90. Deep in the extreme left tail of that entire distribution.
I think that number matters more than "gold crashed 4%" on its own, tbh.
A Z-score that far out means this wasn't just a bad day. It was one of the more statistically unusual single-day moves gold's produced in nearly two decades of daily pricing. I don't think enough of the coverage sat with that.
Here's where things actually stand today.
Gold gapped down and closed near $4,116 Monday. Right at the $4,100 support zone. It's bounced modestly since, up around 0.3-1% through Tuesday, though still sitting well below both its short-term moving averages.$XAUT
That gap between price and the averages is unusually wide right now. I think it's the more interesting detail than the bounce itself.
A gap this wide typically means one of two things happens next. Either stabilization sets in as the extreme move gets digested. Or the wideness becomes the setup for another leg once momentum picks a direction.
I keep coming back to the same question, honestly.
The actual test isn't today's small bounce. It's whether $4,100 holds if it gets retested. That level, not the recovery candle sitting on top of it, is what actually tells you whether Monday was the extreme end of a selloff or just the first leg of one.
Worth remembering, tbh. Statistically rare moves don't resolve on a fixed schedule. Sometimes they mark exhaustion. Sometimes they're the start of something bigger.
The Z-score tells you how unusual the move was. It doesn't tell you which way it resolves from here.
#QNTRises287%
#TrumpRejectsAIRulesForVoluntaryAudits
#BitgetHotWalletBreachTiedToThirdPartySecurityFlaw
#OpenAIUnveilsAlwaysOnAgentDots
#ChainlinkLaunchesBankSWIFTLedgerFramework
Gold's daily moves have averaged just +0.05% since 2006. Standard deviation of 1.19%.
Monday's drop worked out to a Z-score of -2.90. Deep in the extreme left tail of that entire distribution.
I think that number matters more than "gold crashed 4%" on its own, tbh.
A Z-score that far out means this wasn't just a bad day. It was one of the more statistically unusual single-day moves gold's produced in nearly two decades of daily pricing. I don't think enough of the coverage sat with that.
Here's where things actually stand today.
Gold gapped down and closed near $4,116 Monday. Right at the $4,100 support zone. It's bounced modestly since, up around 0.3-1% through Tuesday, though still sitting well below both its short-term moving averages.$XAUT
That gap between price and the averages is unusually wide right now. I think it's the more interesting detail than the bounce itself.
A gap this wide typically means one of two things happens next. Either stabilization sets in as the extreme move gets digested. Or the wideness becomes the setup for another leg once momentum picks a direction.
I keep coming back to the same question, honestly.
The actual test isn't today's small bounce. It's whether $4,100 holds if it gets retested. That level, not the recovery candle sitting on top of it, is what actually tells you whether Monday was the extreme end of a selloff or just the first leg of one.
Worth remembering, tbh. Statistically rare moves don't resolve on a fixed schedule. Sometimes they mark exhaustion. Sometimes they're the start of something bigger.
The Z-score tells you how unusual the move was. It doesn't tell you which way it resolves from here.
#QNTRises287%
#TrumpRejectsAIRulesForVoluntaryAudits
#BitgetHotWalletBreachTiedToThirdPartySecurityFlaw
#OpenAIUnveilsAlwaysOnAgentDots
#ChainlinkLaunchesBankSWIFTLedgerFramework

2
549
·
--
🚨 BTC REJECTED $87K. NOW $81K MATTERS
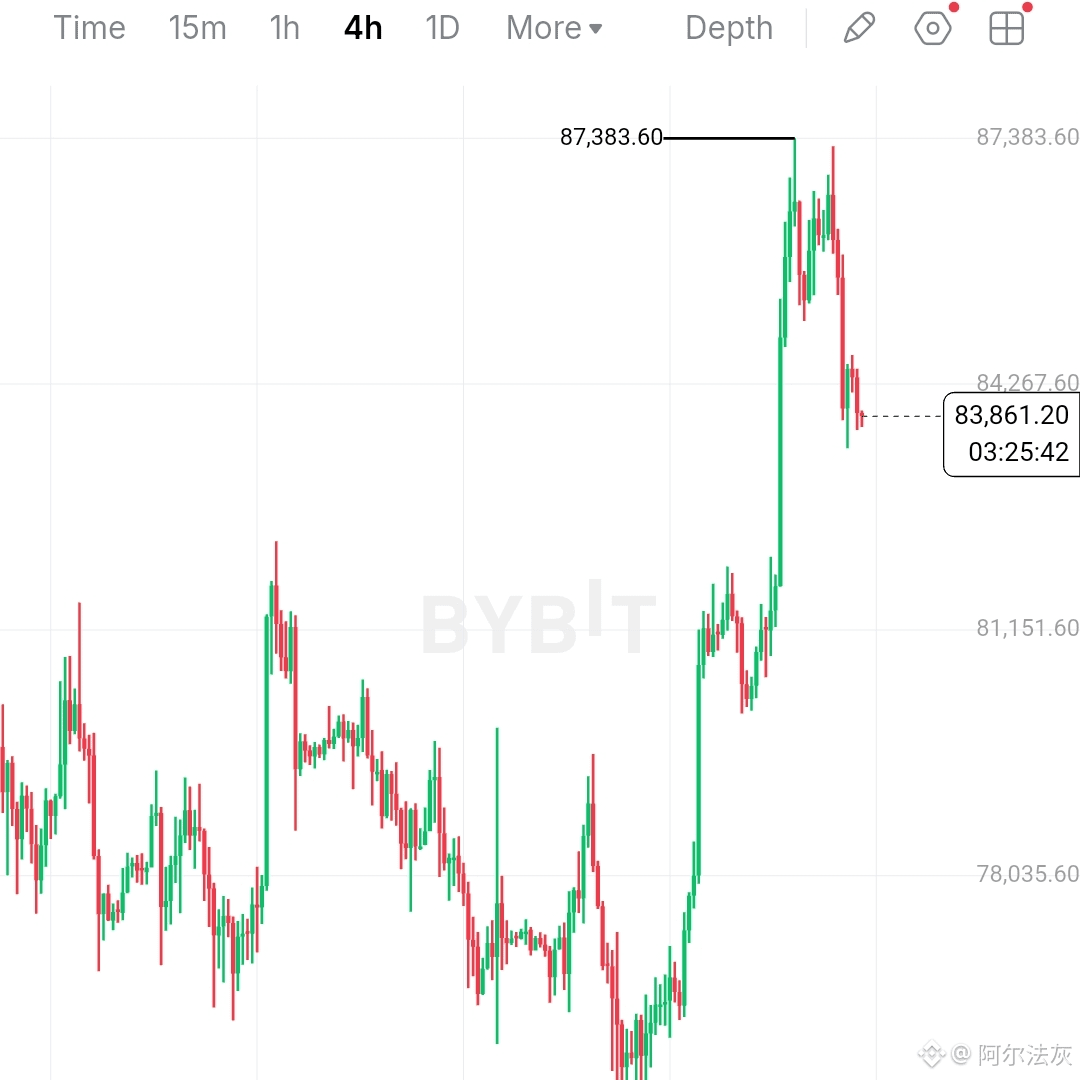
BTC just pulled back after touching $87,383, and this is where things get interesting.
I’ve been watching the breakout from $81,150, where buyers pushed price aggressively toward $87K. But after that rally, sellers finally stepped in near the highs.
Now I’m watching whether this is just a healthy retest or the start of something deeper.
🟢 Bullish scenario
If BTC revisits $81,150–$81,500 and buyers defend that zone, I’ll be looking for a move toward $84,267, followed by another attempt at $87K.
That area matters because it was the previous breakout zone. If buyers defend it, the breakout structure remains intact.
🔴 Bearish scenario
If BTC loses $81K on a strong 4H close and fails to reclaim it, I’d expect the correction to extend toward $79.5K–$80K, with $78K as the next area I’m watching.
That would suggest the breakout is losing strength and late buyers may start exiting.
📍 Trade setup I’m watching
Entry: $81,500–$82,000
SL: $80,500
TP1: $84,267
TP2: $86,000
TP3: $87,300
I’m not chasing BTC after this rejection. I’d rather wait for price to come to a level where the risk actually makes sense.
With institutional interest and improving sentiment supporting the broader recovery, the bigger question is:
Was $87K just a stop-hunt, or can buyers turn this pullback into the next leg up?
I’m watching $81K closely.
What’s your view here healthy retest or deeper correction?
$BTC #USWeighsPromotingDollarStablecoinsAbroad #BCHJumps28%OnCMEFuturesListing
#WallStreetEarningsRevisionsTurnBearish
#21SharesLaunchesEuropesFirstZcashETP
{spot}(BTCUSDT)
🚨 BTC REJECTED $87K. NOW $81K MATTERS
BTC just pulled back after touching $87,383, and this is where things get interesting.
I’ve been watching the breakout from $81,150, where buyers pushed price aggressively toward $87K. But after that rally, sellers finally stepped in near the highs.
Now I’m watching whether this is just a healthy retest or the start of something deeper.
🟢 Bullish scenario
If BTC revisits $81,150–$81,500 and buyers defend that zone, I’ll be looking for a move toward $84,267, followed by another attempt at $87K.
That area matters because it was the previous breakout zone. If buyers defend it, the breakout structure remains intact.
🔴 Bearish scenario
If BTC loses $81K on a strong 4H close and fails to reclaim it, I’d expect the correction to extend toward $79.5K–$80K, with $78K as the next area I’m watching.
That would suggest the breakout is losing strength and late buyers may start exiting.
📍 Trade setup I’m watching
Entry: $81,500–$82,000
SL: $80,500
TP1: $84,267
TP2: $86,000
TP3: $87,300
I’m not chasing BTC after this rejection. I’d rather wait for price to come to a level where the risk actually makes sense.
With institutional interest and improving sentiment supporting the broader recovery, the bigger question is:
Was $87K just a stop-hunt, or can buyers turn this pullback into the next leg up?
I’m watching $81K closely.
What’s your view here healthy retest or deeper correction?
$BTC #USWeighsPromotingDollarStablecoinsAbroad #BCHJumps28%OnCMEFuturesListing
#WallStreetEarningsRevisionsTurnBearish
#21SharesLaunchesEuropesFirstZcashETP
BTC just pulled back after touching $87,383, and this is where things get interesting.
I’ve been watching the breakout from $81,150, where buyers pushed price aggressively toward $87K. But after that rally, sellers finally stepped in near the highs.
Now I’m watching whether this is just a healthy retest or the start of something deeper.
🟢 Bullish scenario
If BTC revisits $81,150–$81,500 and buyers defend that zone, I’ll be looking for a move toward $84,267, followed by another attempt at $87K.
That area matters because it was the previous breakout zone. If buyers defend it, the breakout structure remains intact.
🔴 Bearish scenario
If BTC loses $81K on a strong 4H close and fails to reclaim it, I’d expect the correction to extend toward $79.5K–$80K, with $78K as the next area I’m watching.
That would suggest the breakout is losing strength and late buyers may start exiting.
📍 Trade setup I’m watching
Entry: $81,500–$82,000
SL: $80,500
TP1: $84,267
TP2: $86,000
TP3: $87,300
I’m not chasing BTC after this rejection. I’d rather wait for price to come to a level where the risk actually makes sense.
With institutional interest and improving sentiment supporting the broader recovery, the bigger question is:
Was $87K just a stop-hunt, or can buyers turn this pullback into the next leg up?
I’m watching $81K closely.
What’s your view here healthy retest or deeper correction?
$BTC #USWeighsPromotingDollarStablecoinsAbroad #BCHJumps28%OnCMEFuturesListing
#WallStreetEarningsRevisionsTurnBearish
#21SharesLaunchesEuropesFirstZcashETP

1
164
·
--
Мақала
Bernstein's $400 NVDA Call: What's Actually Behind ItBernstein reaffirmed its Buy on Nvidia today, $400 target, roughly 75-88% upside from Tuesday's $229 close depending on which close you measure against. Analyst Stacy Rasgon has an 88.71% historical hit rate on his targets, so this isn't a name throwing out numbers for headlines.
Here's what actually makes this call interesting, tbh, and it connects to something worth flagging first.
NVDA's been the worst-performing stock among its own AI chip peers this year, up only around 20%, while AMD, Intel, and Micron have all posted triple-digit gains. Same sector, same AI boom, wildly different stock outcomes. Rasgon's note is basically explaining why that gap exists, and he's arguing it's the opportunity, not a warning sign.
The core argument is valuation compression, not new hype, honestly. Nvidia trades around 17 times next-12-month earnings estimates right now, against a five-year average closer to 35 times. That's not the price falling, that's the multiple getting cut roughly in half while the business kept growing underneath it. A stock can get objectively cheaper relative to its own history even while climbing in absolute price, if earnings estimates rise faster than the share price does.
That's the real mechanism behind why NVDA looks like a laggard against AMD and Intel this year, tbh. It's not that Nvidia's growth slowed, cloud provider order backlogs reportedly exceed $2 trillion, and the company's targeting up to $40 billion in revenue per gigawatt with its upcoming Vera Rubin systems. It's that the market re-rated how much it's willing to pay for that growth, even as the growth itself kept accelerating.
Worth being fair to the skeptical side too. This call is landing right as renewed public debate about slowing advanced AI model development is circulating, and that debate directly threatens the entire premise, sustained compute demand. Rasgon's own framing acknowledges this, honestly, the bet only pays off if capacity constraints keep easing and hyperscalers keep converting backlog into actual delivered revenue, not just contracted promises.
Not treating an 88% hit-rate analyst as automatically right here. But this specific call is worth separating from noise, tbh. It's a structured argument about multiple compression meeting continued growth, not just another bullish headline layered onto an already-loved stock.
#AIStocksWhatNext
$NVDA.US $NVDAB
{spot}(NVDABUSDT)
Bernstein's $400 NVDA Call: What's Actually Behind It
Bernstein reaffirmed its Buy on Nvidia today, $400 target, roughly 75-88% upside from Tuesday's $229 close depending on which close you measure against. Analyst Stacy Rasgon has an 88.71% historical hit rate on his targets, so this isn't a name throwing out numbers for headlines.
Here's what actually makes this call interesting, tbh, and it connects to something worth flagging first.
NVDA's been the worst-performing stock among its own AI chip peers this year, up only around 20%, while AMD, Intel, and Micron have all posted triple-digit gains. Same sector, same AI boom, wildly different stock outcomes. Rasgon's note is basically explaining why that gap exists, and he's arguing it's the opportunity, not a warning sign.
The core argument is valuation compression, not new hype, honestly. Nvidia trades around 17 times next-12-month earnings estimates right now, against a five-year average closer to 35 times. That's not the price falling, that's the multiple getting cut roughly in half while the business kept growing underneath it. A stock can get objectively cheaper relative to its own history even while climbing in absolute price, if earnings estimates rise faster than the share price does.
That's the real mechanism behind why NVDA looks like a laggard against AMD and Intel this year, tbh. It's not that Nvidia's growth slowed, cloud provider order backlogs reportedly exceed $2 trillion, and the company's targeting up to $40 billion in revenue per gigawatt with its upcoming Vera Rubin systems. It's that the market re-rated how much it's willing to pay for that growth, even as the growth itself kept accelerating.
Worth being fair to the skeptical side too. This call is landing right as renewed public debate about slowing advanced AI model development is circulating, and that debate directly threatens the entire premise, sustained compute demand. Rasgon's own framing acknowledges this, honestly, the bet only pays off if capacity constraints keep easing and hyperscalers keep converting backlog into actual delivered revenue, not just contracted promises.
Not treating an 88% hit-rate analyst as automatically right here. But this specific call is worth separating from noise, tbh. It's a structured argument about multiple compression meeting continued growth, not just another bullish headline layered onto an already-loved stock.
#AIStocksWhatNext
$NVDA.US $NVDAB
Here's what actually makes this call interesting, tbh, and it connects to something worth flagging first.
NVDA's been the worst-performing stock among its own AI chip peers this year, up only around 20%, while AMD, Intel, and Micron have all posted triple-digit gains. Same sector, same AI boom, wildly different stock outcomes. Rasgon's note is basically explaining why that gap exists, and he's arguing it's the opportunity, not a warning sign.
The core argument is valuation compression, not new hype, honestly. Nvidia trades around 17 times next-12-month earnings estimates right now, against a five-year average closer to 35 times. That's not the price falling, that's the multiple getting cut roughly in half while the business kept growing underneath it. A stock can get objectively cheaper relative to its own history even while climbing in absolute price, if earnings estimates rise faster than the share price does.
That's the real mechanism behind why NVDA looks like a laggard against AMD and Intel this year, tbh. It's not that Nvidia's growth slowed, cloud provider order backlogs reportedly exceed $2 trillion, and the company's targeting up to $40 billion in revenue per gigawatt with its upcoming Vera Rubin systems. It's that the market re-rated how much it's willing to pay for that growth, even as the growth itself kept accelerating.
Worth being fair to the skeptical side too. This call is landing right as renewed public debate about slowing advanced AI model development is circulating, and that debate directly threatens the entire premise, sustained compute demand. Rasgon's own framing acknowledges this, honestly, the bet only pays off if capacity constraints keep easing and hyperscalers keep converting backlog into actual delivered revenue, not just contracted promises.
Not treating an 88% hit-rate analyst as automatically right here. But this specific call is worth separating from noise, tbh. It's a structured argument about multiple compression meeting continued growth, not just another bullish headline layered onto an already-loved stock.
#AIStocksWhatNext
$NVDA.US $NVDAB
NVDAB+0,67%
NVDAUS+0,46%
1
364
·
--
ETH Just Erased The Whole CLARITY CrashSitting at $2,631.84. Up 7.47% today.
Look at the move.
ETH crashed hard from 2,669.81 down toward 2,357.59, right when CLARITY Act failed and the Fed hiked in the same stretch. I remember thinking that low looked like it could stick around for a while.
It didn't. Straight back up since, no base-building. Just a sharp V-recovery to where it's sitting now.
Here's the real catalyst behind it, tbh, and it's not just a bounce.
Two days after CLARITY failed, the SEC actually issued its "Innovation Exemption," letting approved venues trade tokenized US stocks onchain through regulated liquidity pools. It's a real, live rule now, not a proposal. Ethereum, Solana, and BNB Chain are all named as likely settlement networks for it.
So the same week crypto got bad regulatory news, it also got the clearest onchain-finance green light the SEC's given yet. That's the part explaining this recovery better than "market just bounced."
Here's the level that matters. $2,669.81. The old high, sitting right above price. Only about $38 away.
Break above it and hold, this is a full round trip. Crash erased, new local highs.
Reject there, I'd watch $2,436.71 first. Below that, the real test is whether $2,357.59 holds again.
ETH's knocking on the exact door that broke it days ago.
$2,669.81 is the number I'm watching.
$ETH
#BTCBreaks80K
#BuffettBecomesBerkshireChairmanEmeritus
#ZcashDevelopersTargetNU7MainnetActivationNov5
ETH Just Erased The Whole CLARITY Crash
Sitting at $2,631.84. Up 7.47% today.
Look at the move.
ETH crashed hard from 2,669.81 down toward 2,357.59, right when CLARITY Act failed and the Fed hiked in the same stretch. I remember thinking that low looked like it could stick around for a while.
It didn't. Straight back up since, no base-building. Just a sharp V-recovery to where it's sitting now.
Here's the real catalyst behind it, tbh, and it's not just a bounce.
Two days after CLARITY failed, the SEC actually issued its "Innovation Exemption," letting approved venues trade tokenized US stocks onchain through regulated liquidity pools. It's a real, live rule now, not a proposal. Ethereum, Solana, and BNB Chain are all named as likely settlement networks for it.
So the same week crypto got bad regulatory news, it also got the clearest onchain-finance green light the SEC's given yet. That's the part explaining this recovery better than "market just bounced."
Here's the level that matters. $2,669.81. The old high, sitting right above price. Only about $38 away.
Break above it and hold, this is a full round trip. Crash erased, new local highs.
Reject there, I'd watch $2,436.71 first. Below that, the real test is whether $2,357.59 holds again.
ETH's knocking on the exact door that broke it days ago.
$2,669.81 is the number I'm watching.
$ETH
#BTCBreaks80K
#BuffettBecomesBerkshireChairmanEmeritus
#ZcashDevelopersTargetNU7MainnetActivationNov5
Look at the move.
ETH crashed hard from 2,669.81 down toward 2,357.59, right when CLARITY Act failed and the Fed hiked in the same stretch. I remember thinking that low looked like it could stick around for a while.
It didn't. Straight back up since, no base-building. Just a sharp V-recovery to where it's sitting now.
Here's the real catalyst behind it, tbh, and it's not just a bounce.
Two days after CLARITY failed, the SEC actually issued its "Innovation Exemption," letting approved venues trade tokenized US stocks onchain through regulated liquidity pools. It's a real, live rule now, not a proposal. Ethereum, Solana, and BNB Chain are all named as likely settlement networks for it.
So the same week crypto got bad regulatory news, it also got the clearest onchain-finance green light the SEC's given yet. That's the part explaining this recovery better than "market just bounced."
Here's the level that matters. $2,669.81. The old high, sitting right above price. Only about $38 away.
Break above it and hold, this is a full round trip. Crash erased, new local highs.
Reject there, I'd watch $2,436.71 first. Below that, the real test is whether $2,357.59 holds again.
ETH's knocking on the exact door that broke it days ago.
$2,669.81 is the number I'm watching.
$ETH
#BTCBreaks80K
#BuffettBecomesBerkshireChairmanEmeritus
#ZcashDevelopersTargetNU7MainnetActivationNov5
326
·
--
Fed Decision Is Coming. Markets Are Already Nervous.
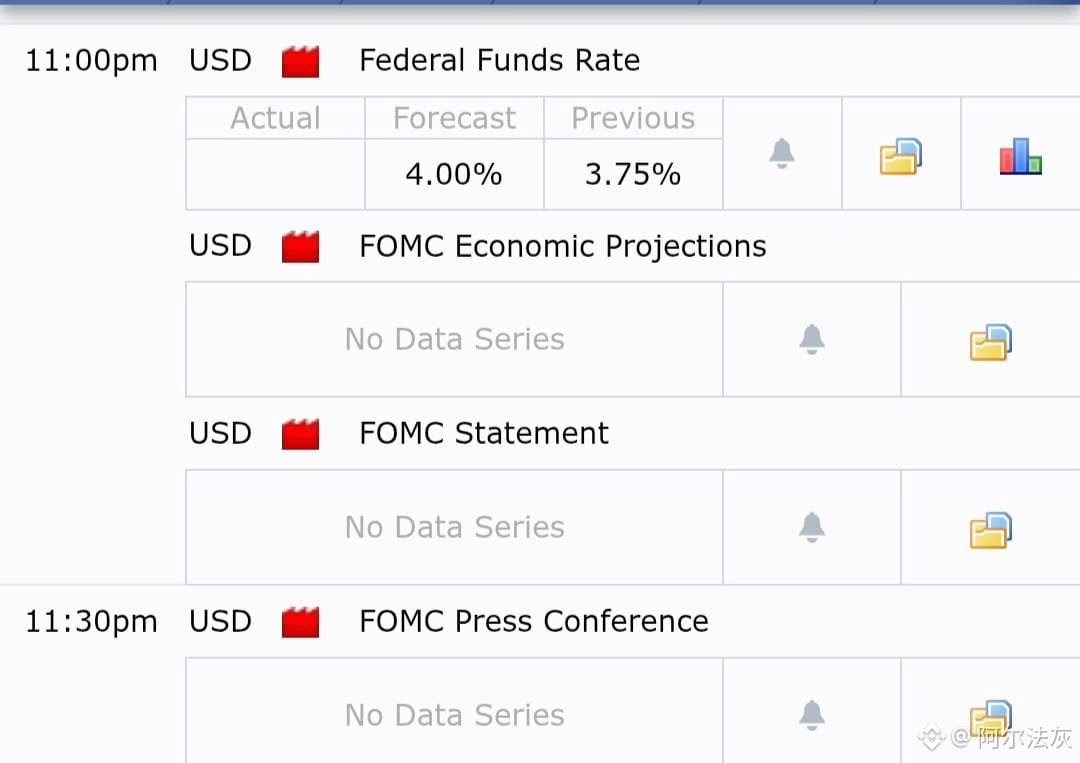
the Fed decision is finally here.
markets are already expecting a 25 bps hike, taking rates to around 4%.
so the hike itself? not really a surprise.
but the market doesn't look relaxed.
BTC is already around the $75K area, while the U.S. 10-year yield briefly pushed above 5% — its highest level since 2007.
and honestly, that's the part making me pay attention.
higher yields mean tighter financial conditions, and risk assets don't usually love that.
Goldman Sachs, JPMorgan and other major banks are also expecting the hike, so everyone seems to know what's coming.
but markets can still move hard when the Fed says what comes next.
another hike?
fewer cuts?
a more hawkish tone?
that's where things could get messy.
the 25 bps hike is already expected.
the reaction isn't.
#FedRateWatch #FOMCForecast #Write2Earrn #USSenateBlocksClarityAct
$BTC
{future}(BTCUSDT)
Fed Decision Is Coming. Markets Are Already Nervous.
the Fed decision is finally here.
markets are already expecting a 25 bps hike, taking rates to around 4%.
so the hike itself? not really a surprise.
but the market doesn't look relaxed.
BTC is already around the $75K area, while the U.S. 10-year yield briefly pushed above 5% — its highest level since 2007.
and honestly, that's the part making me pay attention.
higher yields mean tighter financial conditions, and risk assets don't usually love that.
Goldman Sachs, JPMorgan and other major banks are also expecting the hike, so everyone seems to know what's coming.
but markets can still move hard when the Fed says what comes next.
another hike?
fewer cuts?
a more hawkish tone?
that's where things could get messy.
the 25 bps hike is already expected.
the reaction isn't.
#FedRateWatch #FOMCForecast #Write2Earrn #USSenateBlocksClarityAct
$BTC
the Fed decision is finally here.
markets are already expecting a 25 bps hike, taking rates to around 4%.
so the hike itself? not really a surprise.
but the market doesn't look relaxed.
BTC is already around the $75K area, while the U.S. 10-year yield briefly pushed above 5% — its highest level since 2007.
and honestly, that's the part making me pay attention.
higher yields mean tighter financial conditions, and risk assets don't usually love that.
Goldman Sachs, JPMorgan and other major banks are also expecting the hike, so everyone seems to know what's coming.
but markets can still move hard when the Fed says what comes next.
another hike?
fewer cuts?
a more hawkish tone?
that's where things could get messy.
the 25 bps hike is already expected.
the reaction isn't.
#FedRateWatch #FOMCForecast #Write2Earrn #USSenateBlocksClarityAct
$BTC
1
260
Көбірек контент көру үшін кіріңіз
Binance Square платформасында әлемдік криптоқоғамдастыққа қосылыңыз
⚡️ Криптовалюта туралы ең соңғы және пайдалы ақпаратты алыңыз.
💬 Әлемдегі ең ірі криптобиржаның сеніміне ие.
👍 Расталған авторлардың нақты пікірлерін табыңыз.
Электрондық пошта/телефон нөмірі
Трендтегі тақырыптар
NFPWatch
10.4M рет көрілді
16,659 адам талқылап жатыр
Crypto News | Bitcoin Rises Toward $85K as Treasury Yields Fall Ahead of U.S. NFP Report
Binance News
·3 лайк
·2.1k рет көрілді
BitcoinRisesToward$85K
92 рет көрілді
21 адам талқылап жатыр
AmazonPlansToSell$8BNvidiaChips
564 рет көрілді
28 адам талқылап жатыр