

Avi51
266 Posting

Avi51
Laporkan
Blokir Pengguna
📊 Crypto Market Analysis |Trading setups🚀BTC,XAU,Altcoin,Memecoins.Trends,Breakout & Market Insights 🔕 Not Financial Advice.Follow me I am Following
Perdagangan Terbuka
Pedagang dengan Frekuensi Tinggi
5.4 Tahun
15 Mengikuti
18 Pengikut
83 Disukai
Posting
Portofolio
Semua
Video
·
--
Bullish
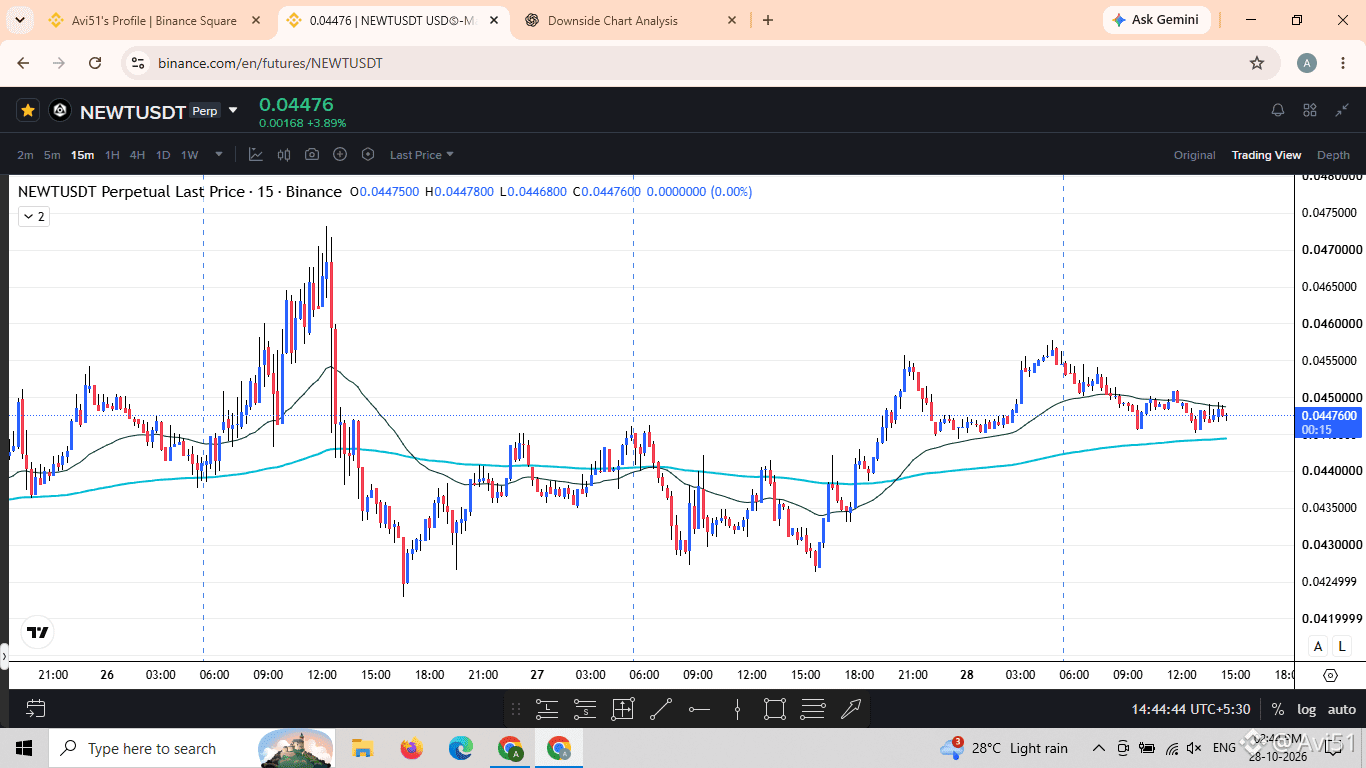
📉 $NEWT USDT UPDATE — LEVEL PENTING YANG PERLU DIPANTAU!
$NEWT USDT kehilangan sebagian momentumnya setelah tertolak di sekitar $0.0456. Harga kini berkonsolidasi di sekitar $0.04476, dan pergerakan berikutnya mungkin bergantung pada kemampuan pembeli mempertahankan zona support saat ini.
{future}(NEWTUSDT)
🔴 Skenario bearish:
Penurunan di bawah $0.0445 dapat membuka peluang menuju $0.0440 dan $0.0435.
🟢 Skenario bullish:
Jika pembeli berhasil kembali menembus $0.0450–$0.0452 dengan volume yang kuat, harga mungkin bergerak lagi menuju $0.0455.
📊 Strategi saya: Pantau level support dan resistance dengan cermat. Konfirmasi lebih penting daripada menebak arah pergerakan.
⚠️ Skenario ini tidak dijamin akan terjadi. Kelola risiko dan hindari mengejar pergerakan harga yang mendadak.
#NEWT #NEWTUSDT #CryptoTrading #TechnicalAnalysis
📉 $NEWT USDT UPDATE — LEVEL PENTING YANG PERLU DIPANTAU!
$NEWT USDT kehilangan sebagian momentumnya setelah tertolak di sekitar $0.0456. Harga kini berkonsolidasi di sekitar $0.04476, dan pergerakan berikutnya mungkin bergantung pada kemampuan pembeli mempertahankan zona support saat ini.
🔴 Skenario bearish:
Penurunan di bawah $0.0445 dapat membuka peluang menuju $0.0440 dan $0.0435.
🟢 Skenario bullish:
Jika pembeli berhasil kembali menembus $0.0450–$0.0452 dengan volume yang kuat, harga mungkin bergerak lagi menuju $0.0455.
📊 Strategi saya: Pantau level support dan resistance dengan cermat. Konfirmasi lebih penting daripada menebak arah pergerakan.
⚠️ Skenario ini tidak dijamin akan terjadi. Kelola risiko dan hindari mengejar pergerakan harga yang mendadak.
#NEWT #NEWTUSDT #CryptoTrading #TechnicalAnalysis
43
·
--
Bullish
Lihat terjemahan
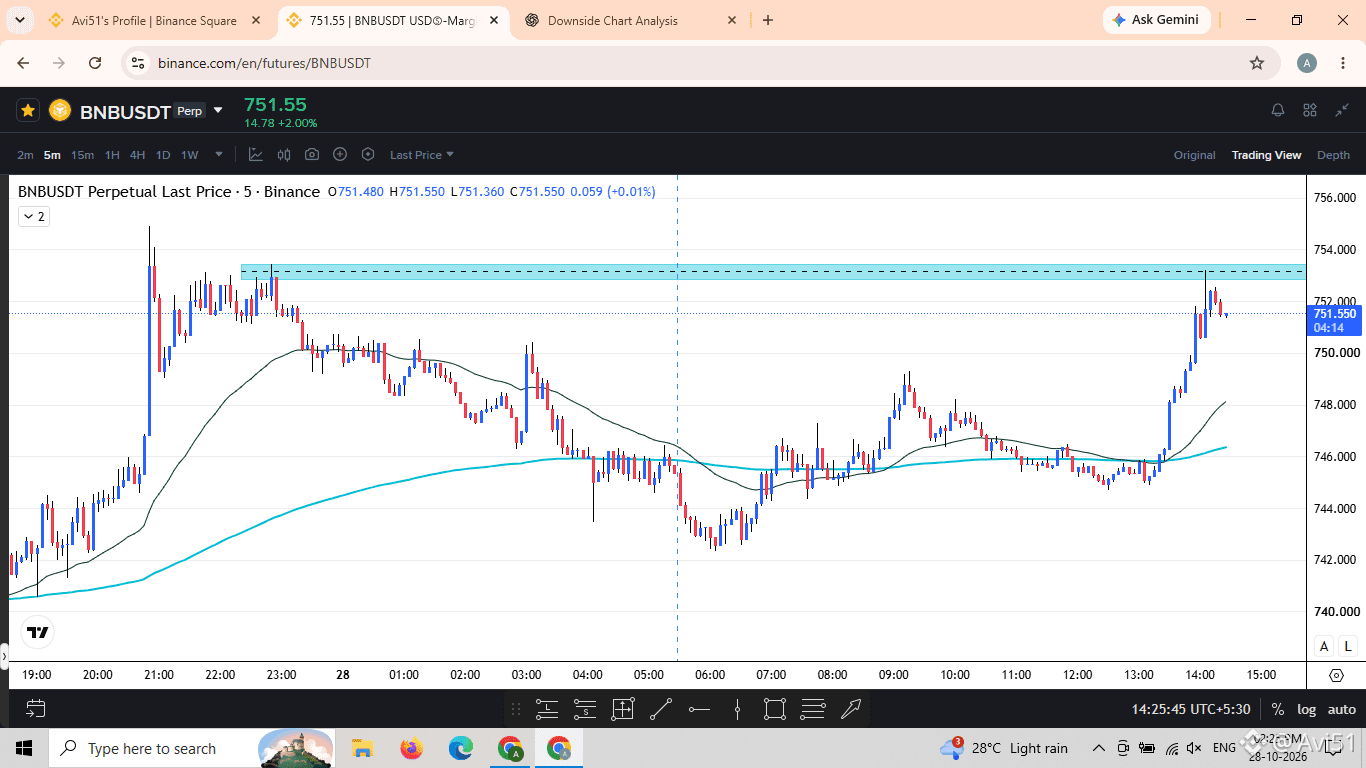
📊 $BNB USDT Chart Analysis — 5-Minute Timeframe
Current Price: $751.55
Market Direction: Short-term bullish, approaching strong resistance ⚠️
Setup: Potential rejection or bullish breakout
{future}(BNBUSDT)
the $753–$754 resistance zone is the key level to watch.
🟢 Bullish signal: Price is holding above the moving averages after a strong rally.🔴 Bearish signal: Rejection near $753–$754 could trigger a short-term pullback.📈 Resistance: $752.50–$754.00.📉 Support: $750.00, $748.00, and $746.00.
SELL Setup
Entry zone: $752.50–$753.50 after bearish confirmationStop-loss: $754.30Target 1: $751.00Target 2: $750.00Target 3: $748.00
BUY Setup
Entry: After a confirmed breakout and successful retest above $754Stop-loss: Below the retest lowPotential targets: $755 and $756
If buyers break above $754 with strong volume, we could see further upside toward $755–$756.
However, if the price gets rejected at resistance, a pullback toward $750 or even $748 could follow.
My focus is on confirmation rather than chasing the pump. Let the price action decide the next move.
⚠️ Manage risk carefully, especially on the 5-minute timeframe.
#BNB #BNBUSDT #CryptoTrading #TechnicalAnalysis
📊 $BNB USDT Chart Analysis — 5-Minute Timeframe
Current Price: $751.55
Market Direction: Short-term bullish, approaching strong resistance ⚠️
Setup: Potential rejection or bullish breakout
the $753–$754 resistance zone is the key level to watch.
🟢 Bullish signal: Price is holding above the moving averages after a strong rally.🔴 Bearish signal: Rejection near $753–$754 could trigger a short-term pullback.📈 Resistance: $752.50–$754.00.📉 Support: $750.00, $748.00, and $746.00.
SELL Setup
Entry zone: $752.50–$753.50 after bearish confirmationStop-loss: $754.30Target 1: $751.00Target 2: $750.00Target 3: $748.00
BUY Setup
Entry: After a confirmed breakout and successful retest above $754Stop-loss: Below the retest lowPotential targets: $755 and $756
If buyers break above $754 with strong volume, we could see further upside toward $755–$756.
However, if the price gets rejected at resistance, a pullback toward $750 or even $748 could follow.
My focus is on confirmation rather than chasing the pump. Let the price action decide the next move.
⚠️ Manage risk carefully, especially on the 5-minute timeframe.
#BNB #BNBUSDT #CryptoTrading #TechnicalAnalysis
62
·
--
Bearish
Lihat terjemahan
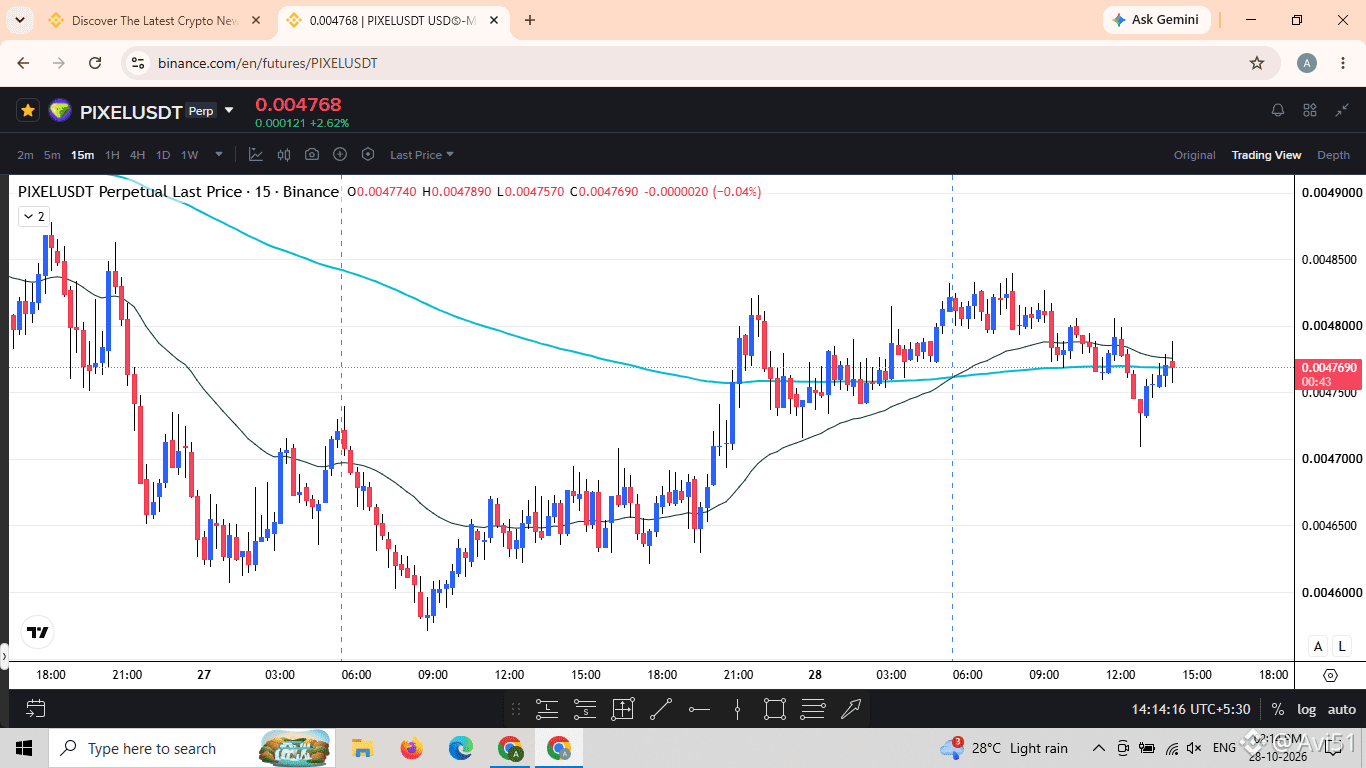
📉 $PIXEL USDT
$PIXEL USDT recently rallied from around 0.00458 to 0.00483, but the price has started pulling back from the recent high.
Trend: Short-term momentum is weakening after the recent rally.
Resistance: Sellers may appear near 0.00480–0.00483.Support: The price is testing the 0.00475–0.00476 area.Moving averages: Price is near the moving-average lines, suggesting indecision and a possible change in short-term momentum.
Downside risk: A confirmed break below 0.00475 could trigger another move lower.
📉 Possible SELL Setup
Entry zone: 0.00476–0.00479, only if bearish rejection is confirmed
Stop-loss: 0.00484
Target 1: 0.00472
Target 2: 0.00470
Target 3: 0.00465
Confirmation: A 15-minute candle closing below 0.00475, preferably with increasing selling volume, would strengthen the bearish scenario.
Invalidation: A sustained move above 0.00483 could weaken the downside setup.
⚠️ However, if buyers defend support and push the price above 0.00483, the bearish setup could fail.
🎯 My focus is on confirmation rather than chasing the move.
Trade carefully, manage your risk, and always wait for the chart to confirm the direction.
#PIXEL #CryptoTrading #TechnicalAnalysis #Altcoins
{future}(PIXELUSDT)
📉 $PIXEL USDT
$PIXEL USDT recently rallied from around 0.00458 to 0.00483, but the price has started pulling back from the recent high.
Trend: Short-term momentum is weakening after the recent rally.
Resistance: Sellers may appear near 0.00480–0.00483.Support: The price is testing the 0.00475–0.00476 area.Moving averages: Price is near the moving-average lines, suggesting indecision and a possible change in short-term momentum.
Downside risk: A confirmed break below 0.00475 could trigger another move lower.
📉 Possible SELL Setup
Entry zone: 0.00476–0.00479, only if bearish rejection is confirmed
Stop-loss: 0.00484
Target 1: 0.00472
Target 2: 0.00470
Target 3: 0.00465
Confirmation: A 15-minute candle closing below 0.00475, preferably with increasing selling volume, would strengthen the bearish scenario.
Invalidation: A sustained move above 0.00483 could weaken the downside setup.
⚠️ However, if buyers defend support and push the price above 0.00483, the bearish setup could fail.
🎯 My focus is on confirmation rather than chasing the move.
Trade carefully, manage your risk, and always wait for the chart to confirm the direction.
#PIXEL #CryptoTrading #TechnicalAnalysis #Altcoins
80
·
--
Bearish
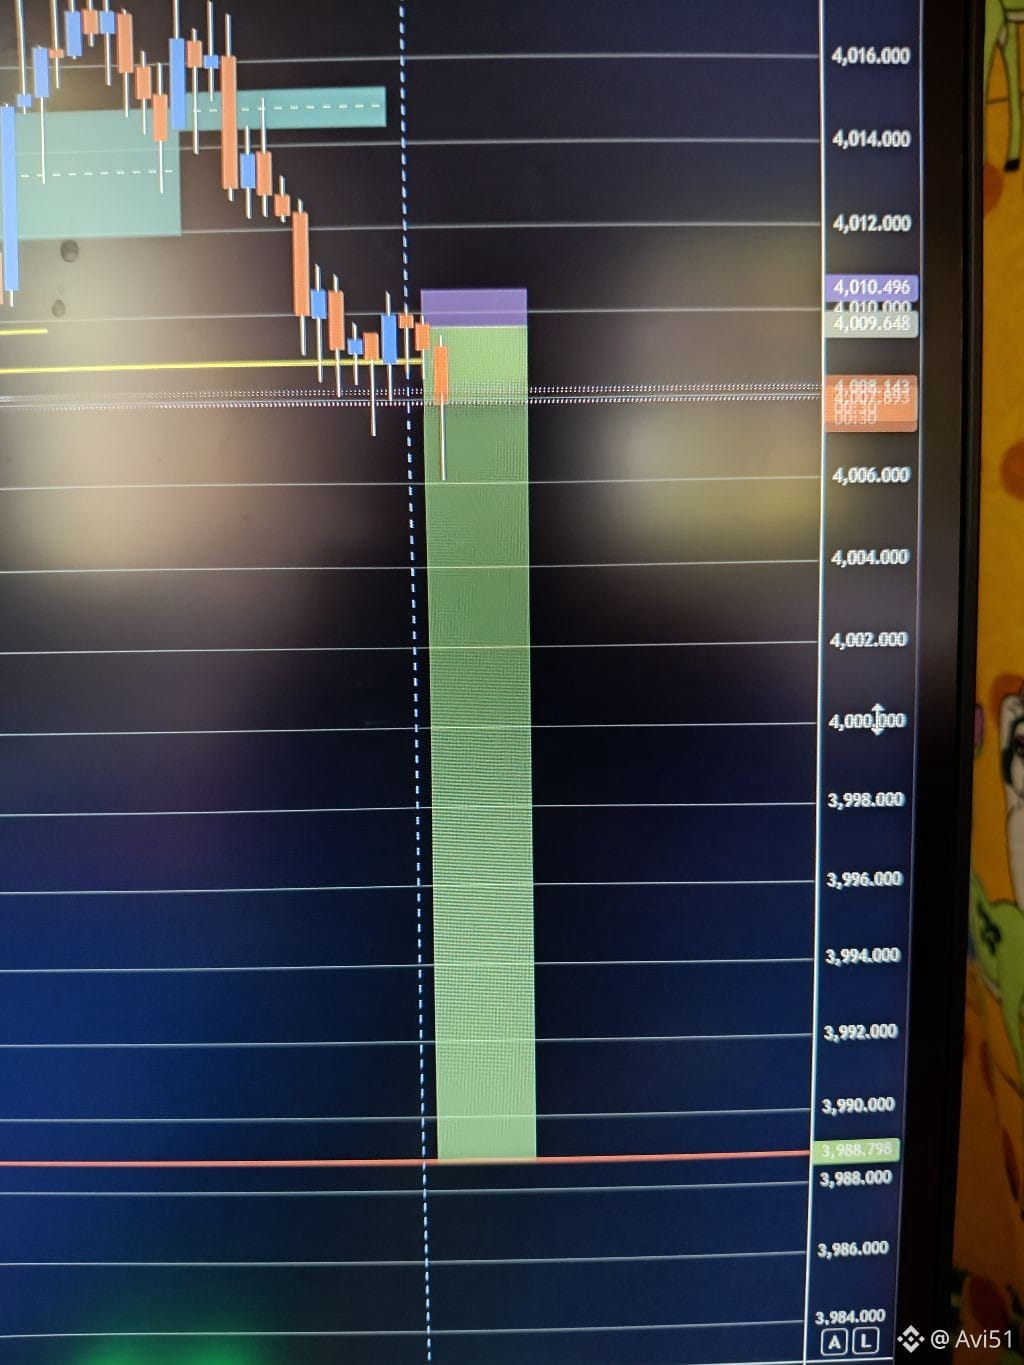
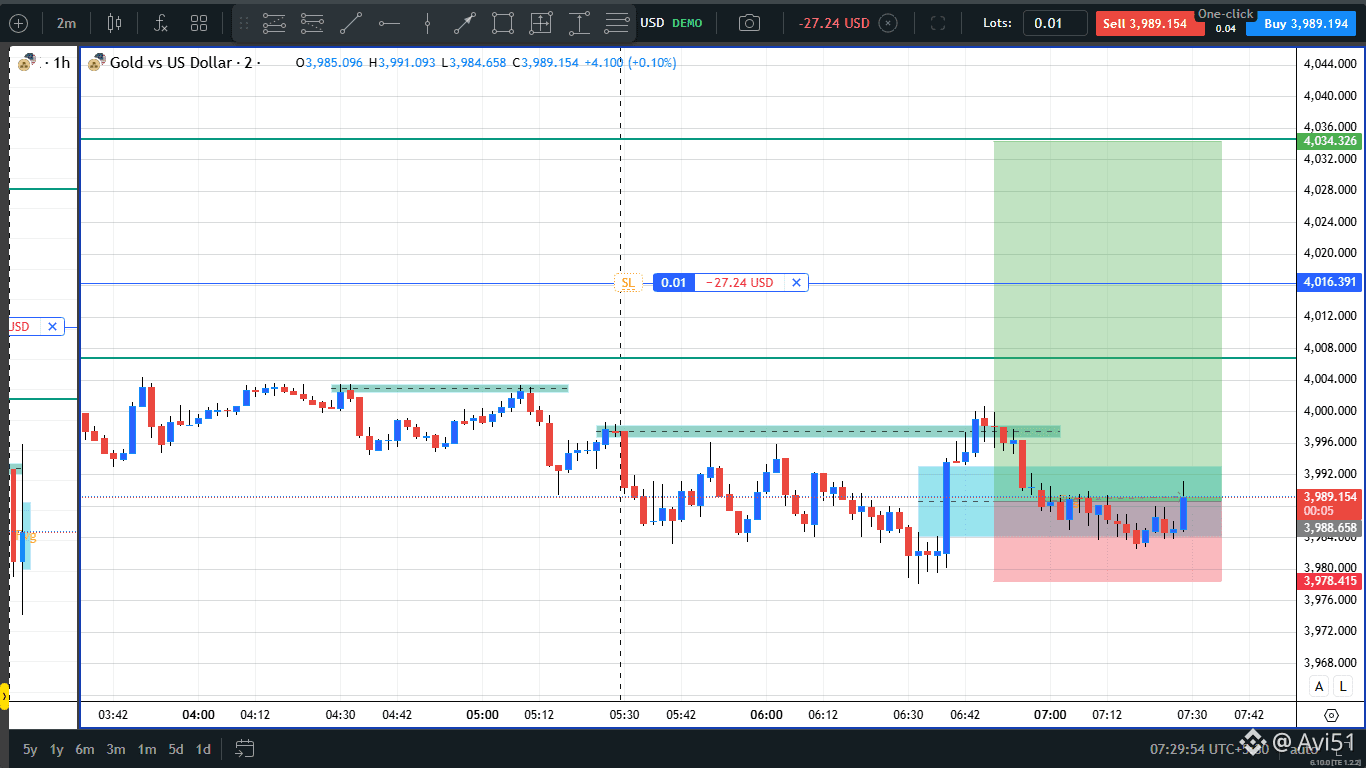
$XAU short 🚀🚀🚀
Entri 4009.6
Stop Loss 4010.5
Target 4003, 3988.8
$XAU short 🚀🚀🚀
Entri 4009.6
Stop Loss 4010.5
Target 4003, 3988.8
Entri 4009.6
Stop Loss 4010.5
Target 4003, 3988.8
71
·
--
Bullish
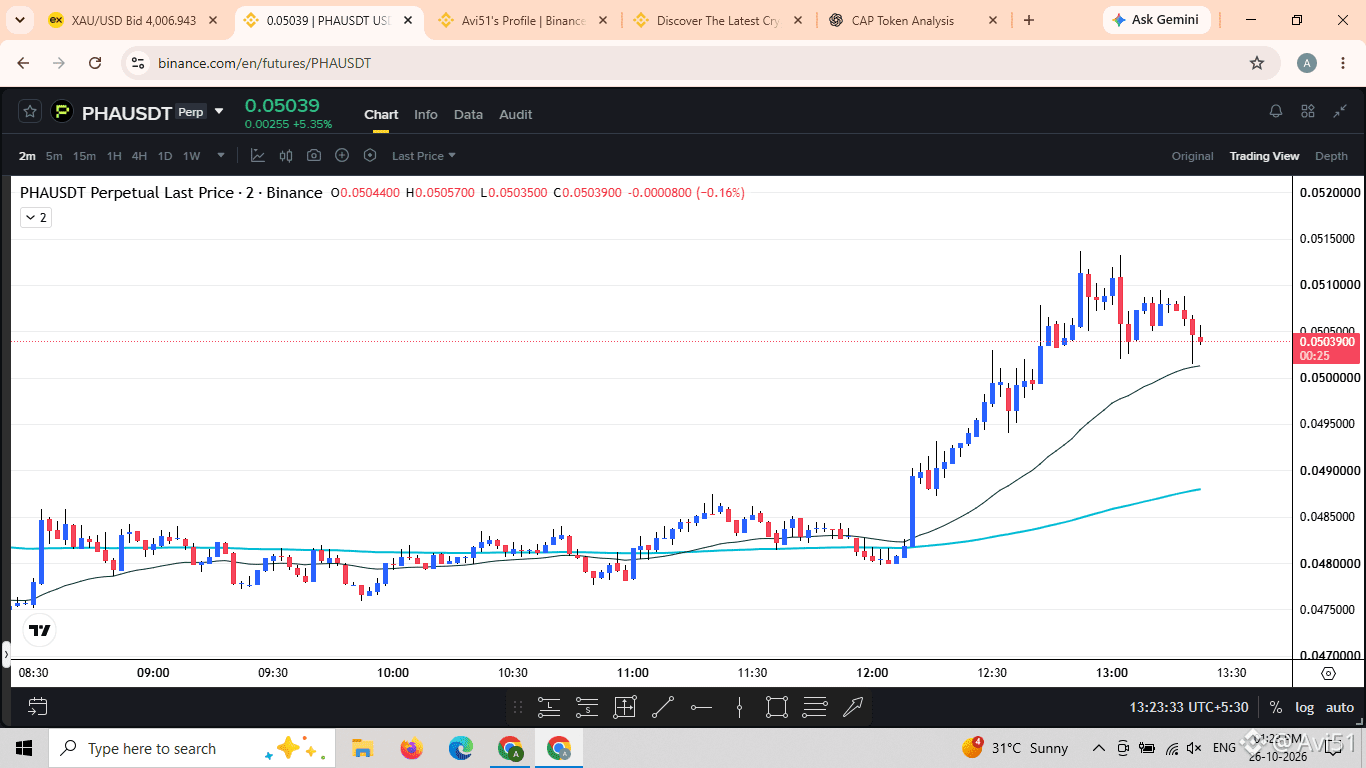
$PHA USDT — PEMBARUAN: Bisakah Pembeli Bangkit Kembali?
{future}(PHAUSDT)
$PHA menunjukkan tanda-tanda kemungkinan pemulihan jangka pendek setelah tekanan jual baru-baru ini, tetapi tren keseluruhan masih perlu dikonfirmasi.
🔹 Resistansi: $0.0500–$0.0505
🔹 Resistansi berikutnya: $0.0530–$0.0540
🔹 Support: $0.0465–$0.0470
🟢 Pergerakan berkelanjutan di atas resistansi dapat menandakan momentum yang membaik.
🔴 Penurunan di bawah support dapat memicu tekanan jual kembali.
Untuk saat ini, kuncinya adalah mengamati reaksi harga di sekitar level-level ini. Pemulihan mungkin terjadi, tetapi konfirmasi lebih penting daripada spekulasi.
#PHA #PHAUSDT #CryptoAnalysis #TechnicalAnalysis
$PHA USDT — PEMBARUAN: Bisakah Pembeli Bangkit Kembali?
$PHA menunjukkan tanda-tanda kemungkinan pemulihan jangka pendek setelah tekanan jual baru-baru ini, tetapi tren keseluruhan masih perlu dikonfirmasi.
🔹 Resistansi: $0.0500–$0.0505
🔹 Resistansi berikutnya: $0.0530–$0.0540
🔹 Support: $0.0465–$0.0470
🟢 Pergerakan berkelanjutan di atas resistansi dapat menandakan momentum yang membaik.
🔴 Penurunan di bawah support dapat memicu tekanan jual kembali.
Untuk saat ini, kuncinya adalah mengamati reaksi harga di sekitar level-level ini. Pemulihan mungkin terjadi, tetapi konfirmasi lebih penting daripada spekulasi.
#PHA #PHAUSDT #CryptoAnalysis #TechnicalAnalysis
1
4
·
--
Bullish
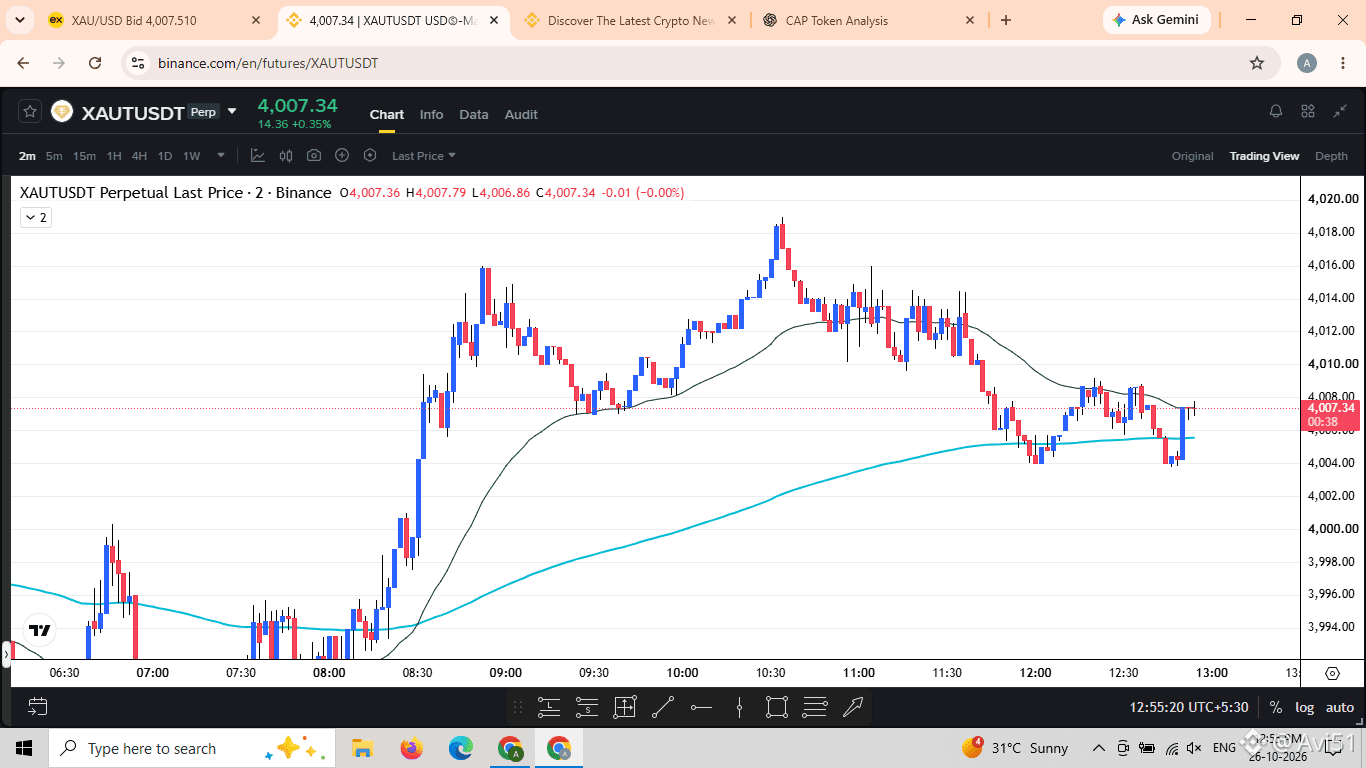
🥇 $XAUT USDT PEMBARUAN
{future}(XAUTUSDT)
Tether Gold sedang berupaya stabil setelah tekanan jual baru-baru ini. Pergerakan selanjutnya bergantung pada apakah pembeli dapat mempertahankan momentum atau penjual kembali mengambil kendali.
📊 Resistansi: $4,015–$4,020
🟢 Support: Sekitar $3,998
🔻 Zona acuan bawah: Sekitar $3,980
Pergerakan berkelanjutan di atas resistansi dapat menandakan pemulihan, sementara penurunan di bawah support dapat mengindikasikan pelemahan kembali.
Pergerakan harga jangka pendek bisa berfluktuasi, jadi hindari menarik kesimpulan dari satu candle saja.
#XAUTUSDT #TetherGold #GoldMarke t #MarketAnalysis
🥇 $XAUT USDT PEMBARUAN
Tether Gold sedang berupaya stabil setelah tekanan jual baru-baru ini. Pergerakan selanjutnya bergantung pada apakah pembeli dapat mempertahankan momentum atau penjual kembali mengambil kendali.
📊 Resistansi: $4,015–$4,020
🟢 Support: Sekitar $3,998
🔻 Zona acuan bawah: Sekitar $3,980
Pergerakan berkelanjutan di atas resistansi dapat menandakan pemulihan, sementara penurunan di bawah support dapat mengindikasikan pelemahan kembali.
Pergerakan harga jangka pendek bisa berfluktuasi, jadi hindari menarik kesimpulan dari satu candle saja.
#XAUTUSDT #TetherGold #GoldMarke t #MarketAnalysis
1
4
·
--
Bullish
Lihat terjemahan
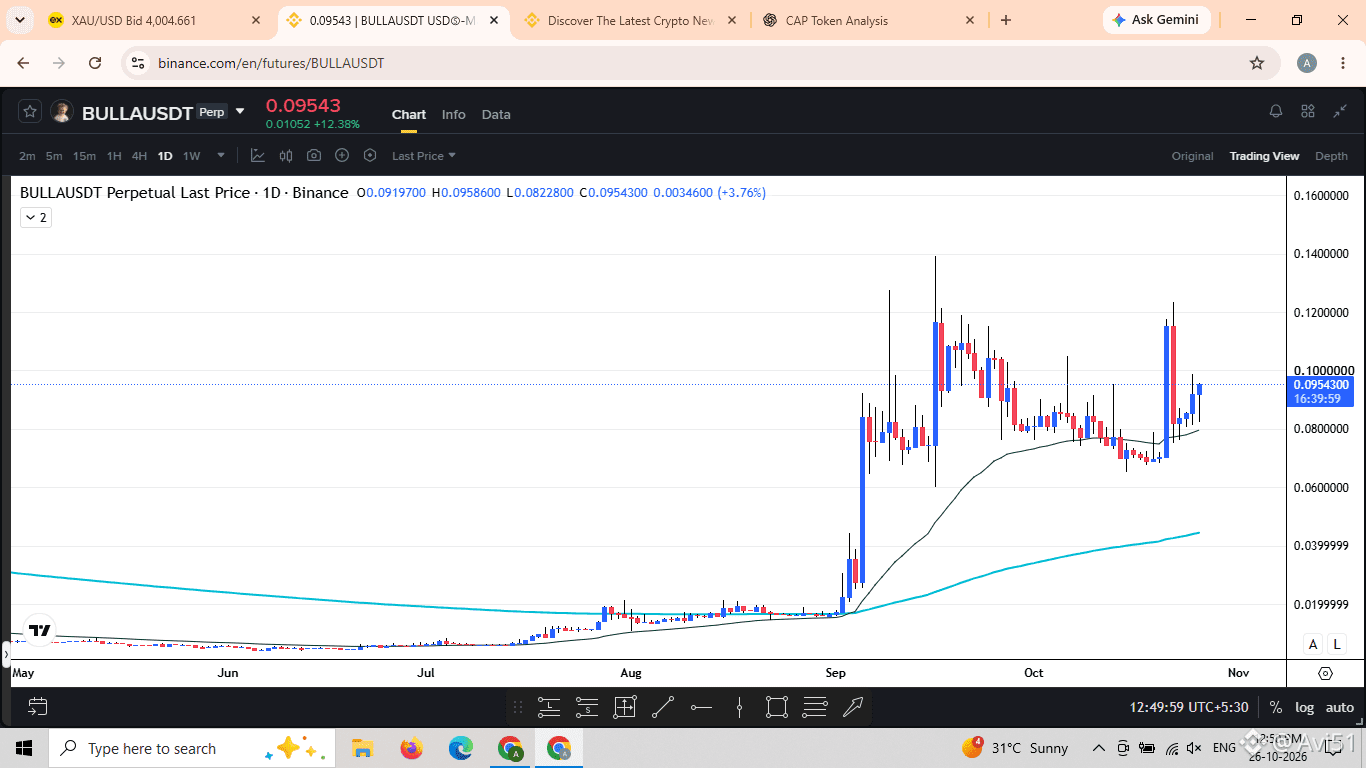
Recent market data for $BULLA shows positive momentum. One market snapshot reported a price near $0.0903, with the price up approximately 6.56% over 24 hours
Bullish Scenario
A sustained move above the latest hourly resistance could indicate further upside.Strong trading volume would help confirm the move.A failed breakout could lead to a pullback.
🔴 Bearish Scenario
Losing the latest hourly support could weaken momentum.A lower high followed by a lower low would suggest increasing selling pressure.
$BULLA is showing positive short-term momentum, but the next move depends on whether buyers can maintain their strength.
🟢 Bullish signal: A confirmed breakout above hourly resistance with strong volume.
🔴 Bearish signal: A breakdown below hourly support could weaken the current structure.
👀 Keep an eye on volume and hourly candle closes before drawing conclusions. In a volatile market, protecting capital is just as important as spotting opportunities.
#BULLA #BULLAUSDT #CryptoAnalysis #TechnicalAnalysis
{future}(BULLAUSDT)
Recent market data for $BULLA shows positive momentum. One market snapshot reported a price near $0.0903, with the price up approximately 6.56% over 24 hours
Bullish Scenario
A sustained move above the latest hourly resistance could indicate further upside.Strong trading volume would help confirm the move.A failed breakout could lead to a pullback.
🔴 Bearish Scenario
Losing the latest hourly support could weaken momentum.A lower high followed by a lower low would suggest increasing selling pressure.
$BULLA is showing positive short-term momentum, but the next move depends on whether buyers can maintain their strength.
🟢 Bullish signal: A confirmed breakout above hourly resistance with strong volume.
🔴 Bearish signal: A breakdown below hourly support could weaken the current structure.
👀 Keep an eye on volume and hourly candle closes before drawing conclusions. In a volatile market, protecting capital is just as important as spotting opportunities.
#BULLA #BULLAUSDT #CryptoAnalysis #TechnicalAnalysis
1
1
·
--
Bullish
Lihat terjemahan
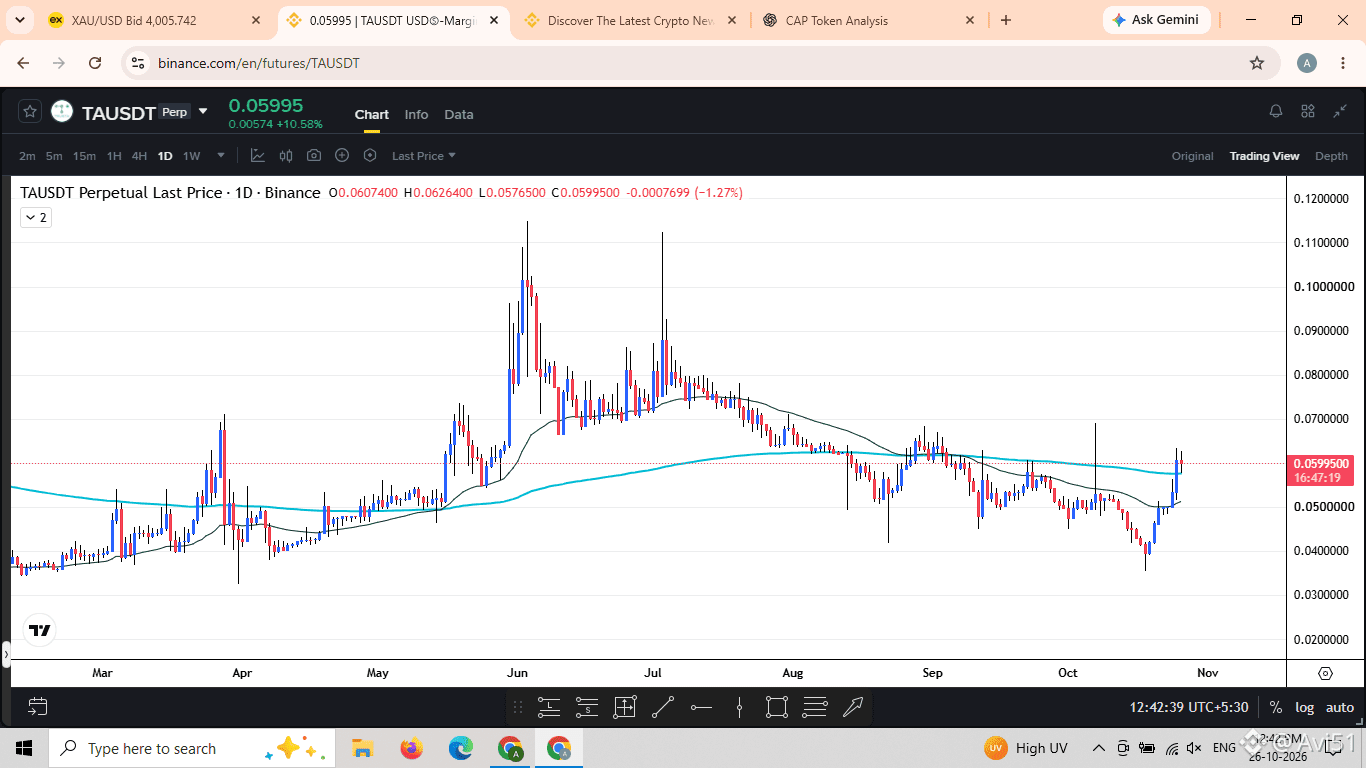
$TA USDT — DAILY CHART WATCH
The daily timeframe is important for understanding the broader market trend. Traders should watch key support and resistance levels and wait for confirmation before drawing conclusions.
🟢 A confirmed breakout above resistance may indicate improving momentum.
🔴 A breakdown below support may signal further weakness.
⚠️ Always consider trading volume and market volatility. No breakout or price target is guaranteed.
#TAUSDT #CryptoAnalysis #TechnicalAnalysis
1
2
·
--
Bullish
Lihat terjemahan
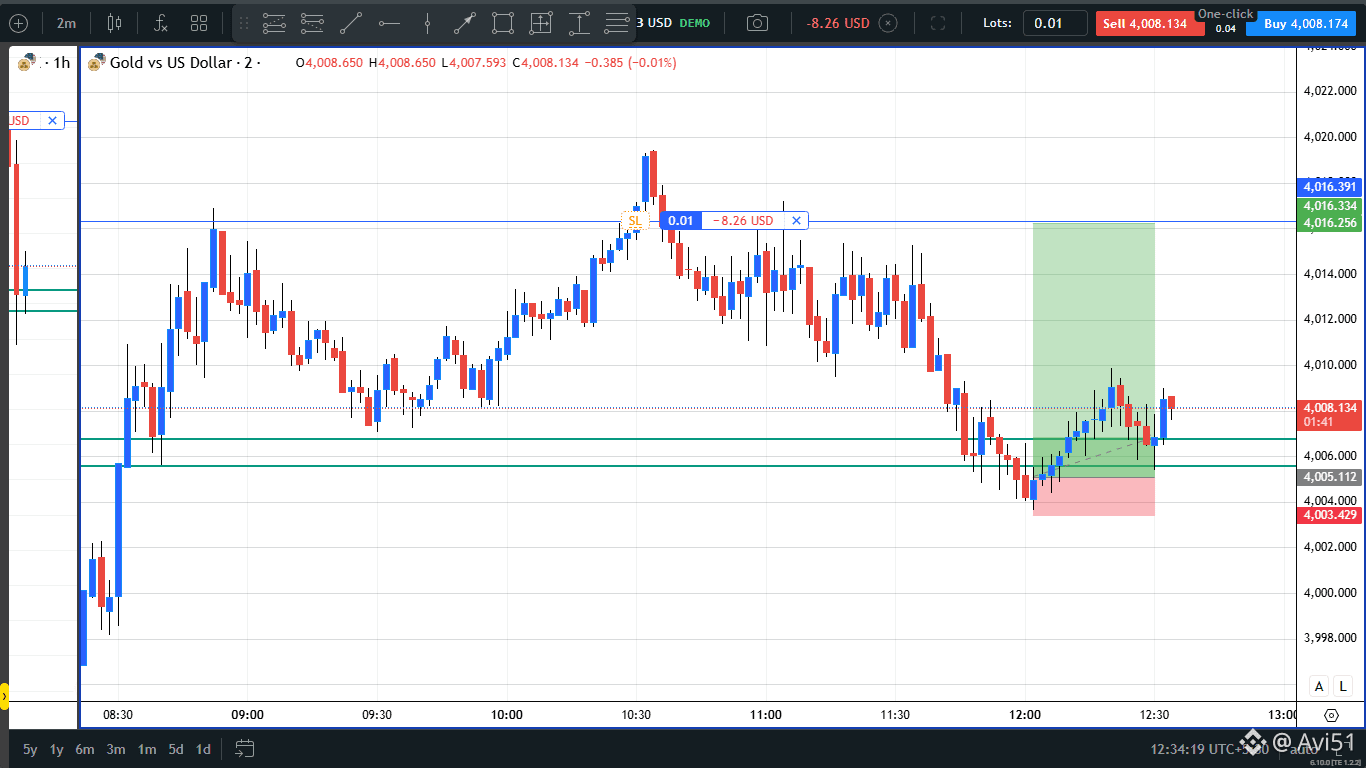
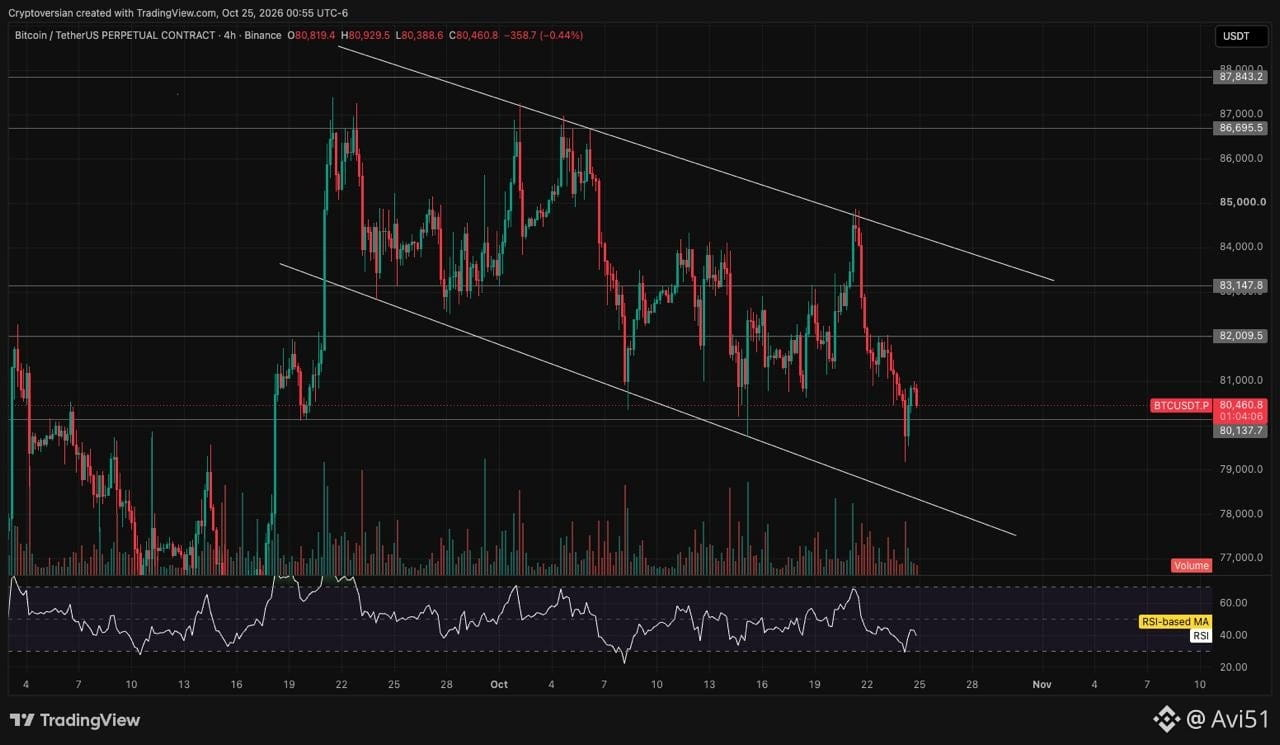
$PLAY is showing signs of weakness, and buyers still need to prove they can regain control.
{future}(PLAYUSDT)
📈 Bullish Scenario
A sustained move above $0.000598 could indicate improving momentum.Stronger buying activity would help confirm a potential recovery.A breakout without meaningful volume may fail.
📉 Bearish Scenario
A break below $0.000572 could indicate continued weakness.The $0.000530 area is another level to watch.Low liquidity can increase price volatility.
🔹 Resistance: $0.000598
🔹 Support: $0.000572
🔹 Next support zone: $0.000530
A breakout above resistance with stronger volume could signal a potential recovery. However, losing support may put additional pressure on the price.
For now, confirmation matters more than excitement. Keep an eye on trading volume and remember that low-liquidity tokens can move sharply in either direction.
#PLAY #Solana #CryptoAnalysis #GamingTokens
$PLAY is showing signs of weakness, and buyers still need to prove they can regain control.
📈 Bullish Scenario
A sustained move above $0.000598 could indicate improving momentum.Stronger buying activity would help confirm a potential recovery.A breakout without meaningful volume may fail.
📉 Bearish Scenario
A break below $0.000572 could indicate continued weakness.The $0.000530 area is another level to watch.Low liquidity can increase price volatility.
🔹 Resistance: $0.000598
🔹 Support: $0.000572
🔹 Next support zone: $0.000530
A breakout above resistance with stronger volume could signal a potential recovery. However, losing support may put additional pressure on the price.
For now, confirmation matters more than excitement. Keep an eye on trading volume and remember that low-liquidity tokens can move sharply in either direction.
#PLAY #Solana #CryptoAnalysis #GamingTokens
1
1
·
--
Bullish
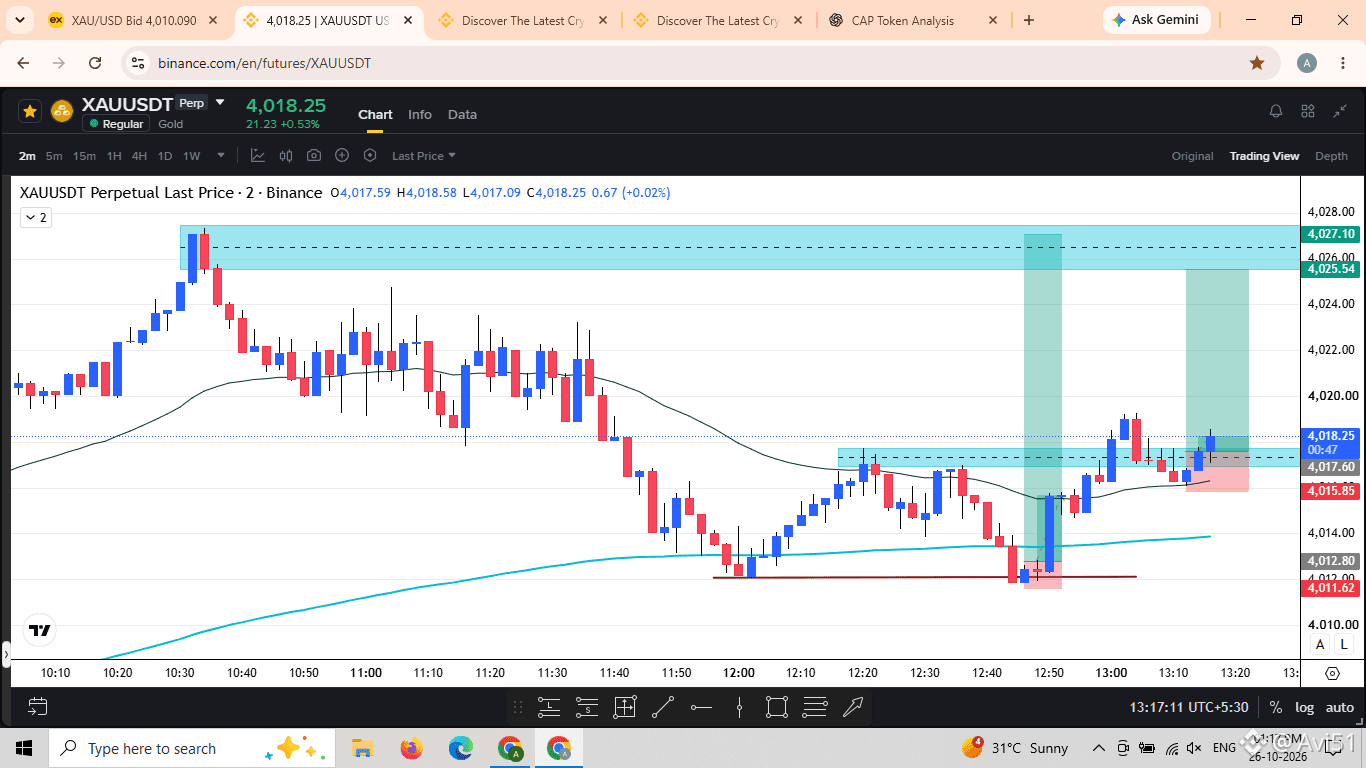
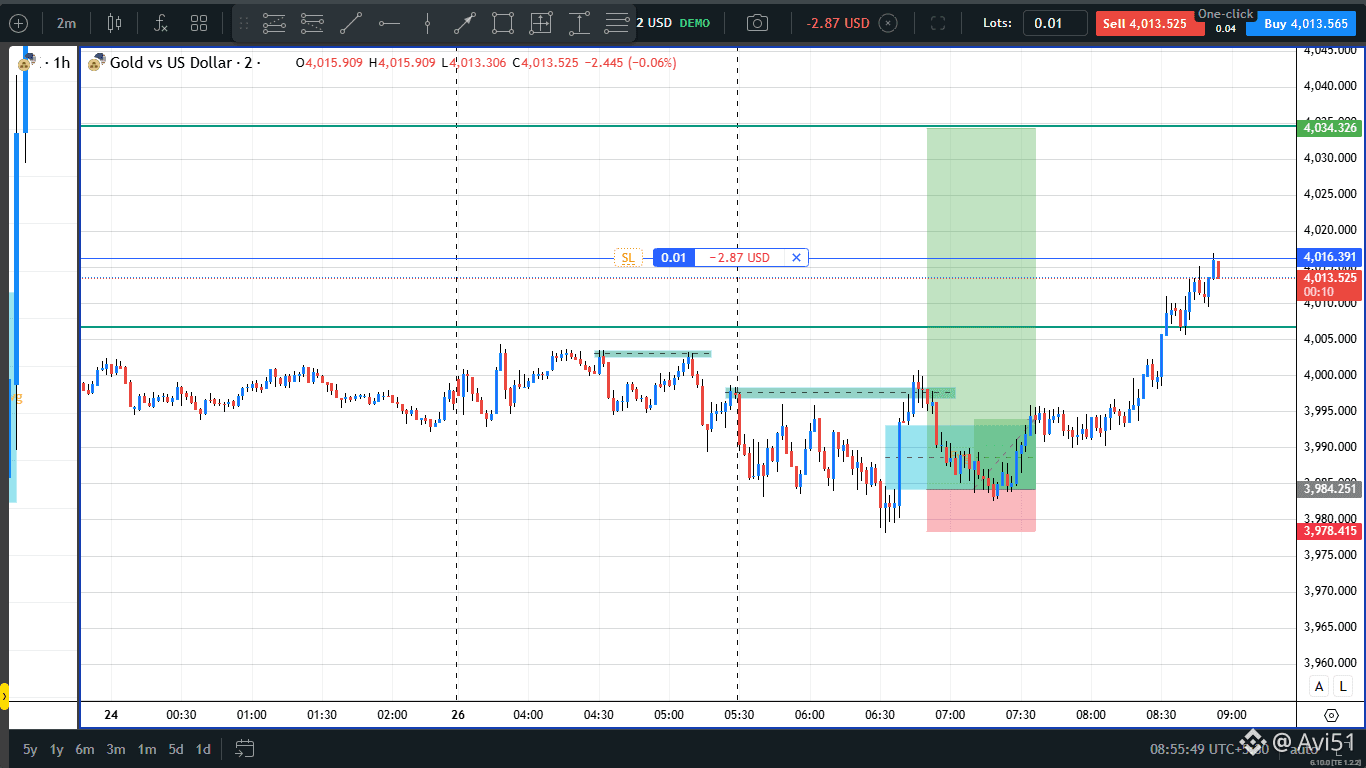
$XAU TARGET PERTAMA TERCAPAI🚀👀
👆👆👆👆👆🚀💵
{future}(XAUUSDT)
$XAU TARGET PERTAMA TERCAPAI🚀👀
👆👆👆👆👆🚀💵
👆👆👆👆👆🚀💵
1
2
·
--
Bullish
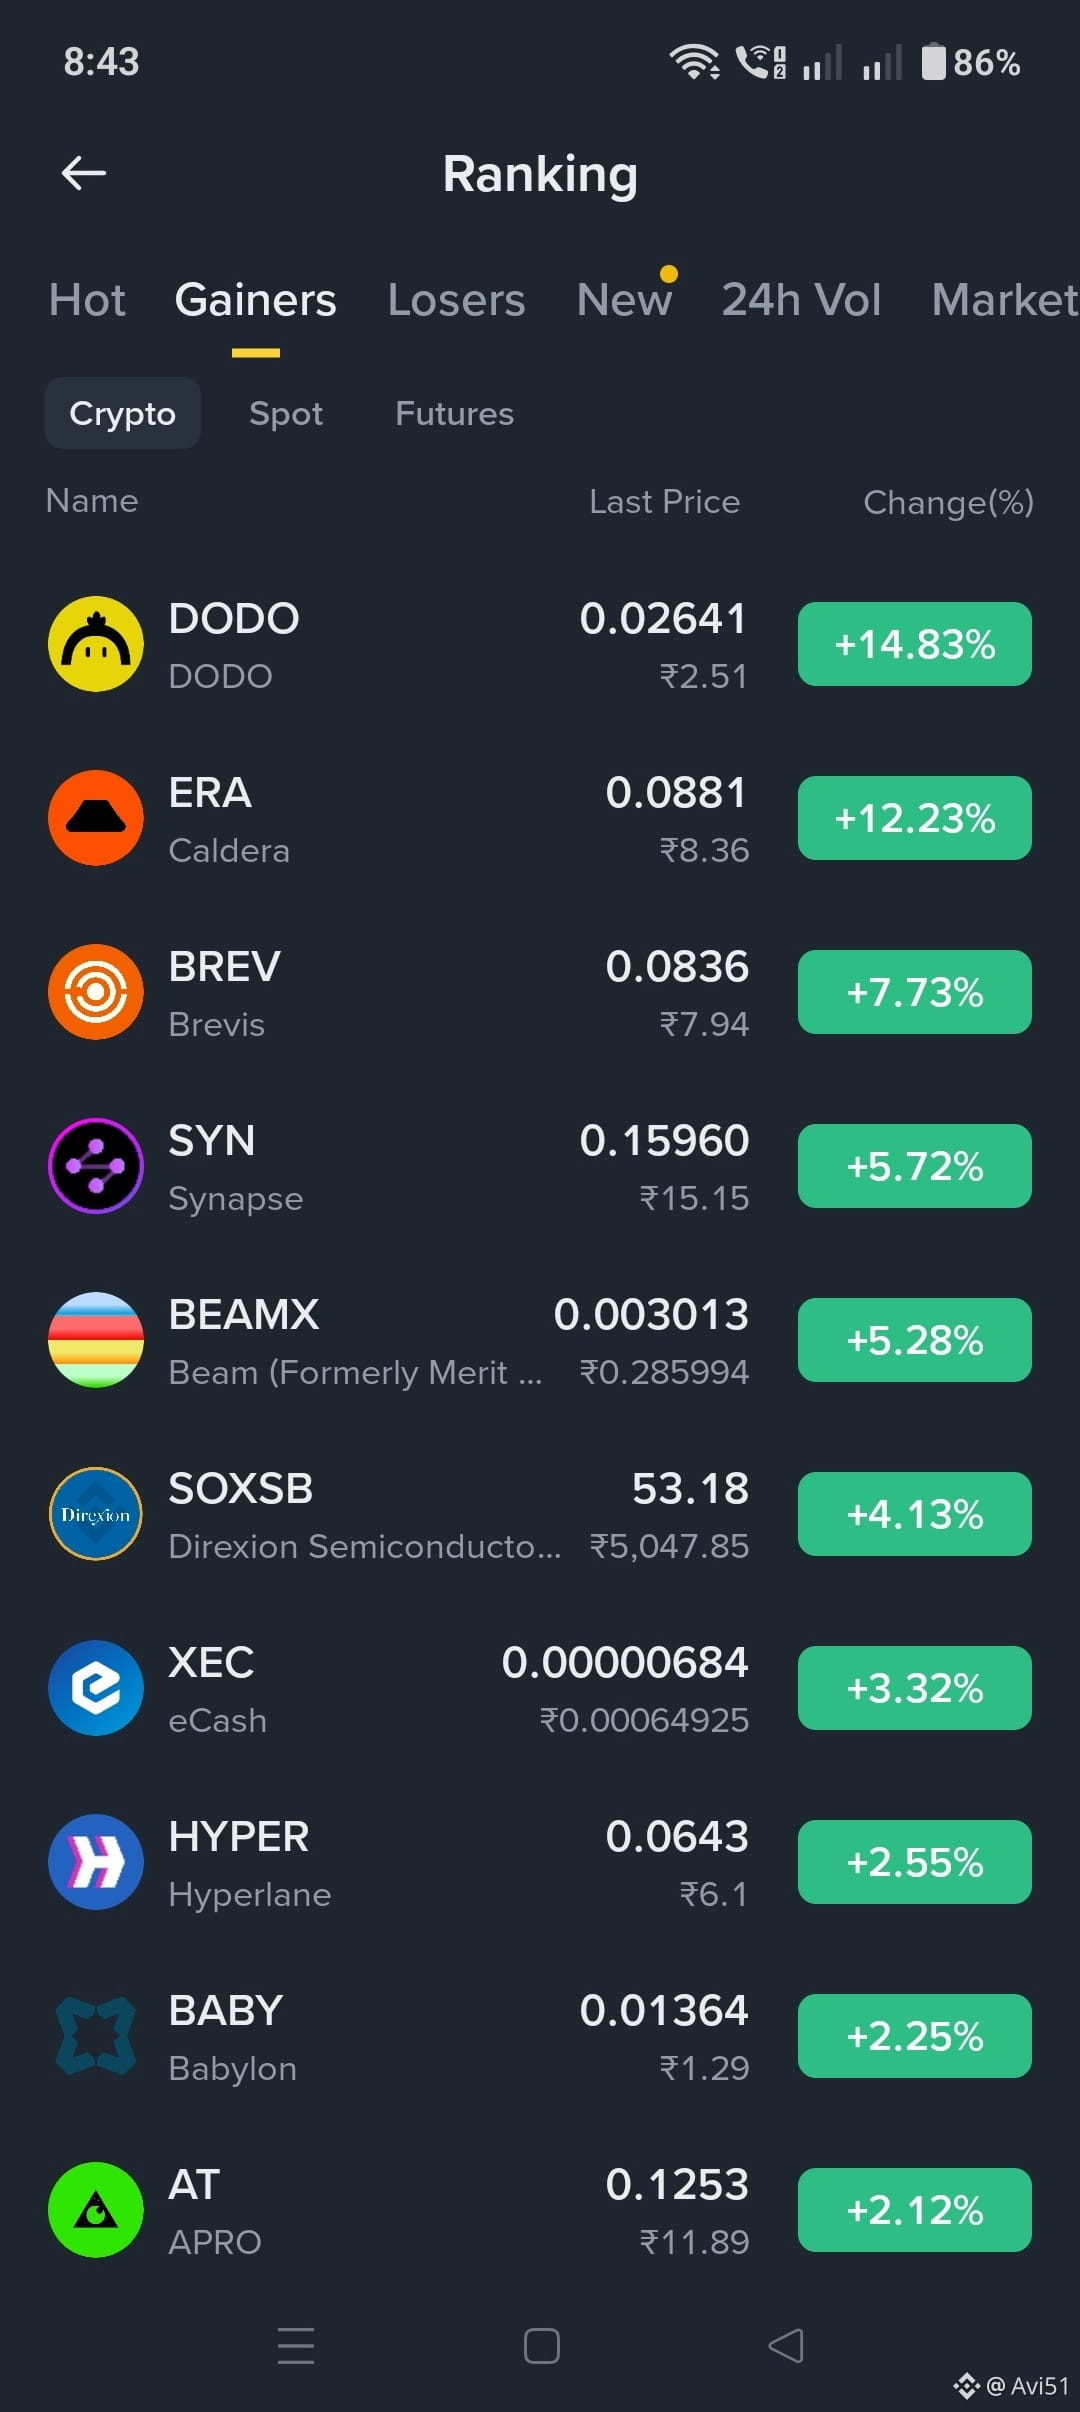
Ganer Teratas Hari Ini 🚀
$DODO
{spot}(DODOUSDT)
$ERA
{future}(ERAUSDT)
$BREV
{future}(BREVUSDT)
Ganer Teratas Hari Ini 🚀
$DODO
$ERA
$BREV
$DODO
$ERA
$BREV
1
16
·
--
Bullish
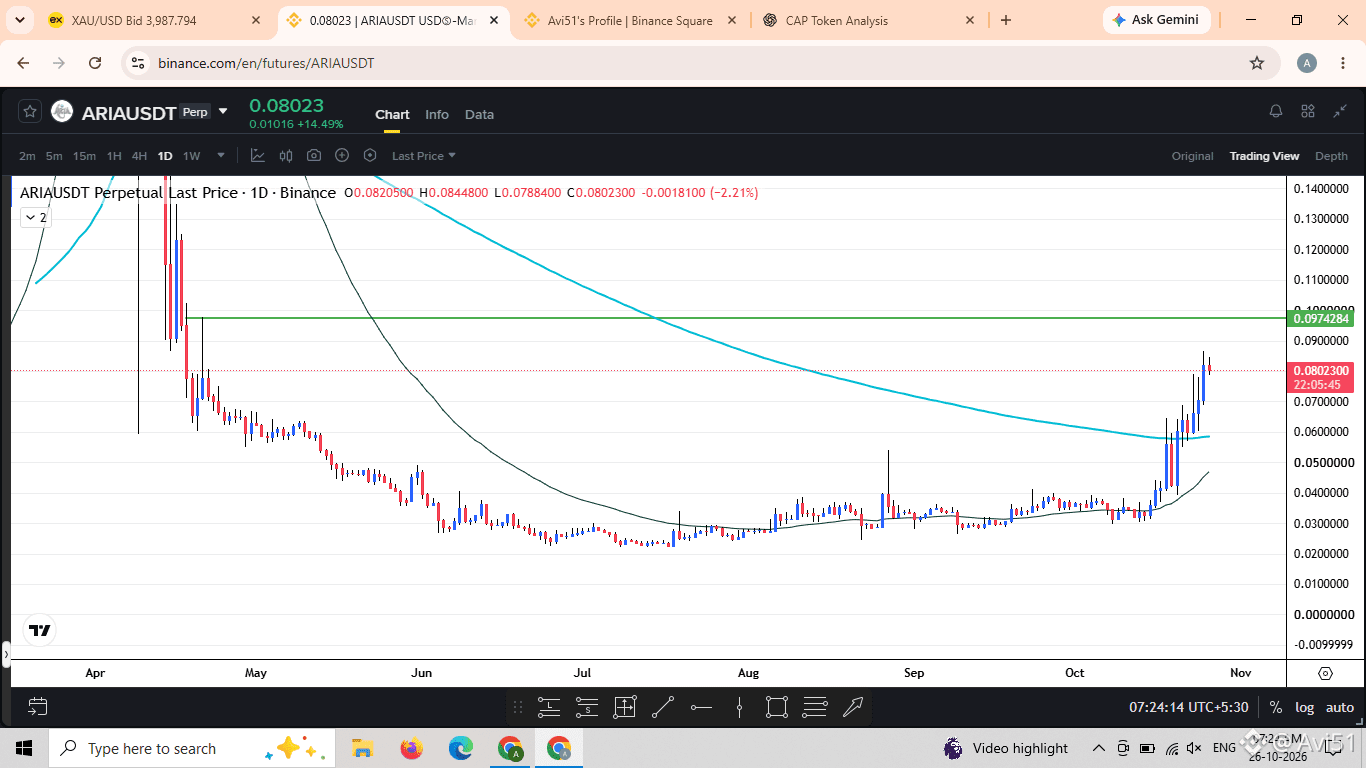
$ARIA baru-baru ini menunjukkan momentum kenaikan yang kuat. Data pasar melaporkan harga sekitar $0.084
{future}(ARIAUSDT)
Skenario Bullish
Pergerakan berkelanjutan di atas $0.087 dapat mengindikasikan tekanan beli yang berlanjut. Penembusan terkonfirmasi di atas $0.090 dapat membuka jalan menuju zona resistensi berikutnya. Volume perdagangan dapat membantu menilai kekuatan pergerakan ini.
📉 Skenario Bearish
Kegagalan menembus resistensi dapat memicu aksi ambil untung. Penurunan di bawah $0.078 dapat melemahkan struktur jangka pendek. Area $0.068–$0.072 juga perlu dipantau.
Prospek keseluruhan: Momentum bullish jangka pendek, tetapi tetap waspada setelah reli baru-baru ini.
$ARIA menunjukkan momentum kenaikan yang mengesankan, sehingga token ini kembali menarik perhatian. Pertanyaan besarnya sekarang adalah apakah para pembeli dapat mempertahankan kekuatan ini atau pasar akan mengalami koreksi jangka pendek.
📊 Resistensi: $0.085–$0.087
🟢 Support: $0.078–$0.080
🎯 Zona resistensi berikutnya: $0.090–$0.095
Penembusan kuat yang disertai volume berkelanjutan dapat mendorong kenaikan lebih lanjut, sementara hilangnya level support penting dapat memicu koreksi.
Ingat, reli yang kuat tidak selalu berlanjut dalam garis lurus. Tetap sabar dan jangan menganggap target harga apa pun sebagai sesuatu yang pasti.
#ARİA #AriaAI #CryptoAnalysis #Altcoins
$ARIA baru-baru ini menunjukkan momentum kenaikan yang kuat. Data pasar melaporkan harga sekitar $0.084
Skenario Bullish
Pergerakan berkelanjutan di atas $0.087 dapat mengindikasikan tekanan beli yang berlanjut. Penembusan terkonfirmasi di atas $0.090 dapat membuka jalan menuju zona resistensi berikutnya. Volume perdagangan dapat membantu menilai kekuatan pergerakan ini.
📉 Skenario Bearish
Kegagalan menembus resistensi dapat memicu aksi ambil untung. Penurunan di bawah $0.078 dapat melemahkan struktur jangka pendek. Area $0.068–$0.072 juga perlu dipantau.
Prospek keseluruhan: Momentum bullish jangka pendek, tetapi tetap waspada setelah reli baru-baru ini.
$ARIA menunjukkan momentum kenaikan yang mengesankan, sehingga token ini kembali menarik perhatian. Pertanyaan besarnya sekarang adalah apakah para pembeli dapat mempertahankan kekuatan ini atau pasar akan mengalami koreksi jangka pendek.
📊 Resistensi: $0.085–$0.087
🟢 Support: $0.078–$0.080
🎯 Zona resistensi berikutnya: $0.090–$0.095
Penembusan kuat yang disertai volume berkelanjutan dapat mendorong kenaikan lebih lanjut, sementara hilangnya level support penting dapat memicu koreksi.
Ingat, reli yang kuat tidak selalu berlanjut dalam garis lurus. Tetap sabar dan jangan menganggap target harga apa pun sebagai sesuatu yang pasti.
#ARİA #AriaAI #CryptoAnalysis #Altcoins
1
65
·
--
Bullish
Lihat terjemahan
$ERA has been showing significant volatility, with buyers attempting to recover after a sharp price drop.
{future}(ERAUSDT)
Market Overview
Recent price: Approximately $0.085624-hour
range: $0.0715–$0.0978
Short-term trend: Volatile;
recovery attemptResistance: $0.0900–$0.0980
Support: $0.0800,
followed by $0.0715
📊 Key resistance: $0.0900–$0.0980
🟢 Support zone: $0.0800
🔻 Critical support: $0.0715
If buyers reclaim the $0.0900 level with strong volume, a retest of the recent highs could be possible. However, losing the $0.0800 support area may invite further selling pressure.
The next move depends on volume and whether buyers can sustain the recovery. Avoid making decisions based on price movement alone.
#ERA #Caldera #CryptoAnalysis #Altcoins
$ERA has been showing significant volatility, with buyers attempting to recover after a sharp price drop.
Market Overview
Recent price: Approximately $0.085624-hour
range: $0.0715–$0.0978
Short-term trend: Volatile;
recovery attemptResistance: $0.0900–$0.0980
Support: $0.0800,
followed by $0.0715
📊 Key resistance: $0.0900–$0.0980
🟢 Support zone: $0.0800
🔻 Critical support: $0.0715
If buyers reclaim the $0.0900 level with strong volume, a retest of the recent highs could be possible. However, losing the $0.0800 support area may invite further selling pressure.
The next move depends on volume and whether buyers can sustain the recovery. Avoid making decisions based on price movement alone.
#ERA #Caldera #CryptoAnalysis #Altcoins
1
3
·
--
Bearish
Lihat terjemahan
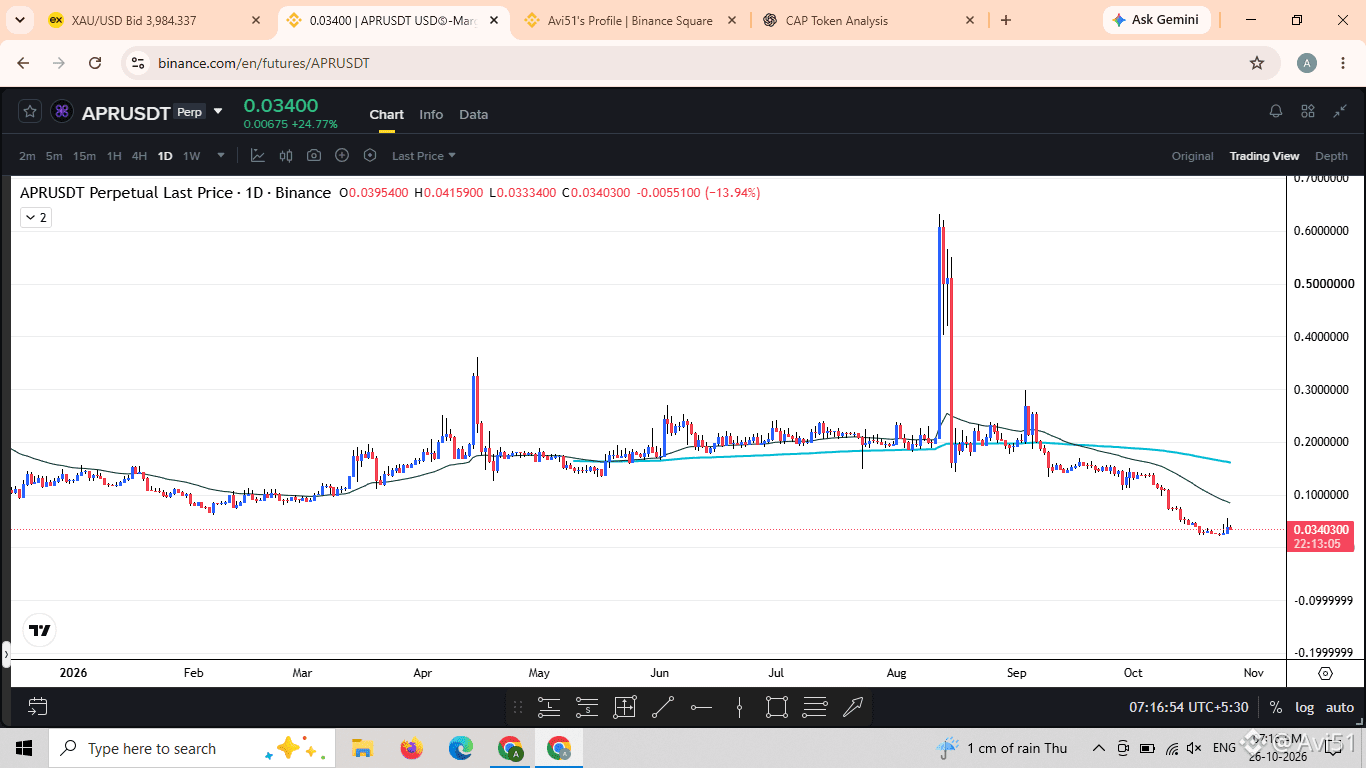
$APR 👀
what a pump and Dump coin ?🚀
{future}(APRUSDT)
$APR 👀
what a pump and Dump coin ?🚀
what a pump and Dump coin ?🚀
1
6
·
--
Bullish
Lihat terjemahan
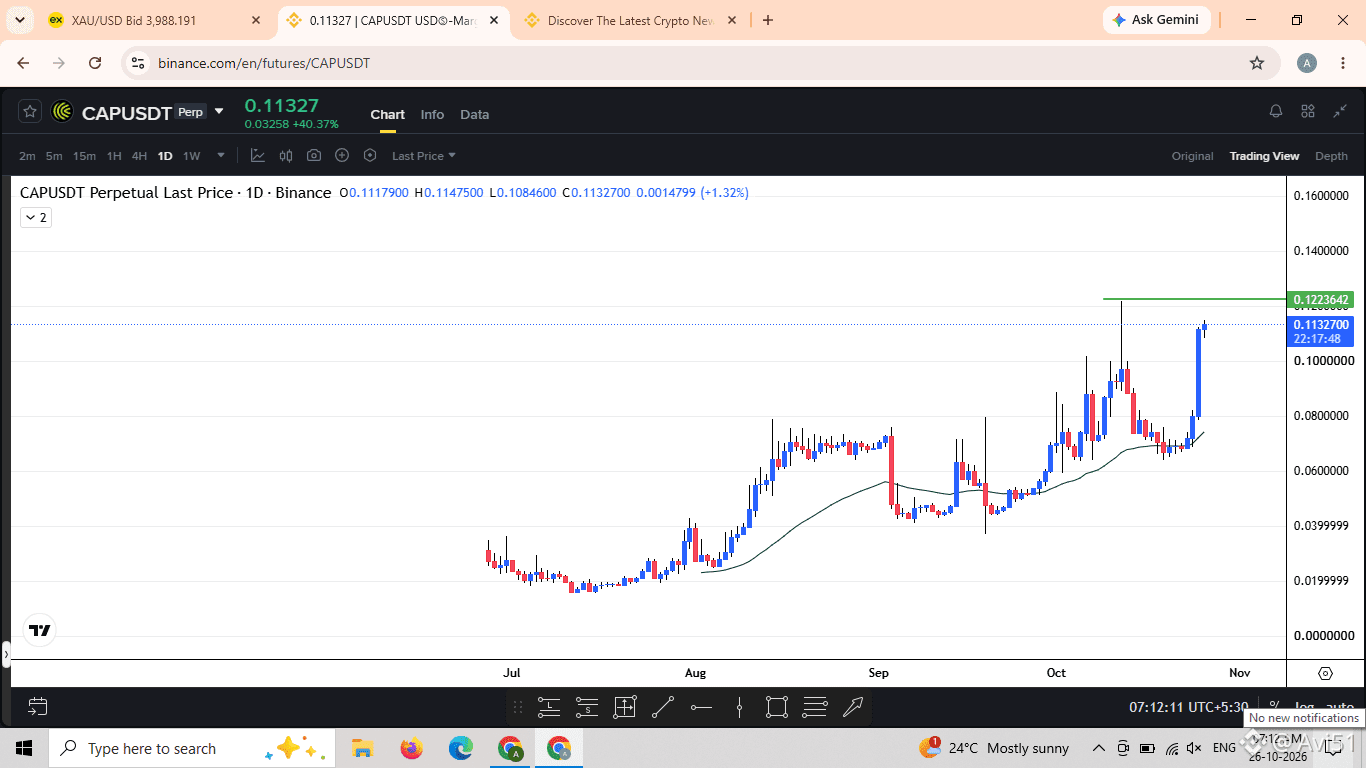
🚀 CAP TOKEN UPDATE | Bulls Are Back in Action!
What a big move?🚀👀
$CAP has made a strong move upward, attracting attention with a sharp price recovery. The next key test is whether buyers can maintain momentum and push through the $0.1120–$0.1150 resistance zone.
{future}(CAPUSDT)
📈 Bullish outlook: A confirmed breakout with strong volume could support further upside.
📉 Key support: The $0.1000 area is worth watching. A breakdown below this level could bring renewed selling pressure.
⚠️ After a strong rally, chasing the price can be risky. Watch volume, wait for confirmation, and always manage risk carefully.
#CAP #CryptoAnalysis #Altcoins #CryptoMarket
🚀 CAP TOKEN UPDATE | Bulls Are Back in Action!
What a big move?🚀👀
$CAP has made a strong move upward, attracting attention with a sharp price recovery. The next key test is whether buyers can maintain momentum and push through the $0.1120–$0.1150 resistance zone.
📈 Bullish outlook: A confirmed breakout with strong volume could support further upside.
📉 Key support: The $0.1000 area is worth watching. A breakdown below this level could bring renewed selling pressure.
⚠️ After a strong rally, chasing the price can be risky. Watch volume, wait for confirmation, and always manage risk carefully.
#CAP #CryptoAnalysis #Altcoins #CryptoMarket
1
28
Masuk untuk menjelajahi konten lainnya
Bergabunglah dengan pengguna kripto global di Binance Square
⚡️ Dapatkan informasi terbaru dan berguna tentang kripto.
💬 Dipercayai oleh bursa kripto terbesar di dunia.
👍 Temukan wawasan nyata dari kreator terverifikasi.
Email/Nomor Ponsel
Topik Sedang Tren
CanMicrosoftDeliverOnAI
429,523 penayangan
3,261 Berdiskusi
Sesi 3 Musim Laporan Keuangan: Akankah Google & Microsoft Melampaui Ekspektasi Laba?
Binance Square Official
·Disukai 146 Kali
·78.9k penayangan
CanGoogleDefindItsCore
267,088 penayangan
2,276 Berdiskusi
EarningsSeason
5.9M penayangan
29,345 Berdiskusi