

ScalpingX
14.3k Publications

ScalpingX
Signaler
Bloquer l’utilisateur
A short-term trader who embraces high-risk, high-reward strategies with an unconventional mindset.
44 Suivis
1.7K+ Abonnés
10.3K+ J’aime
Publications
Tous
Citations
·
--
Haussier
Voir la traduction
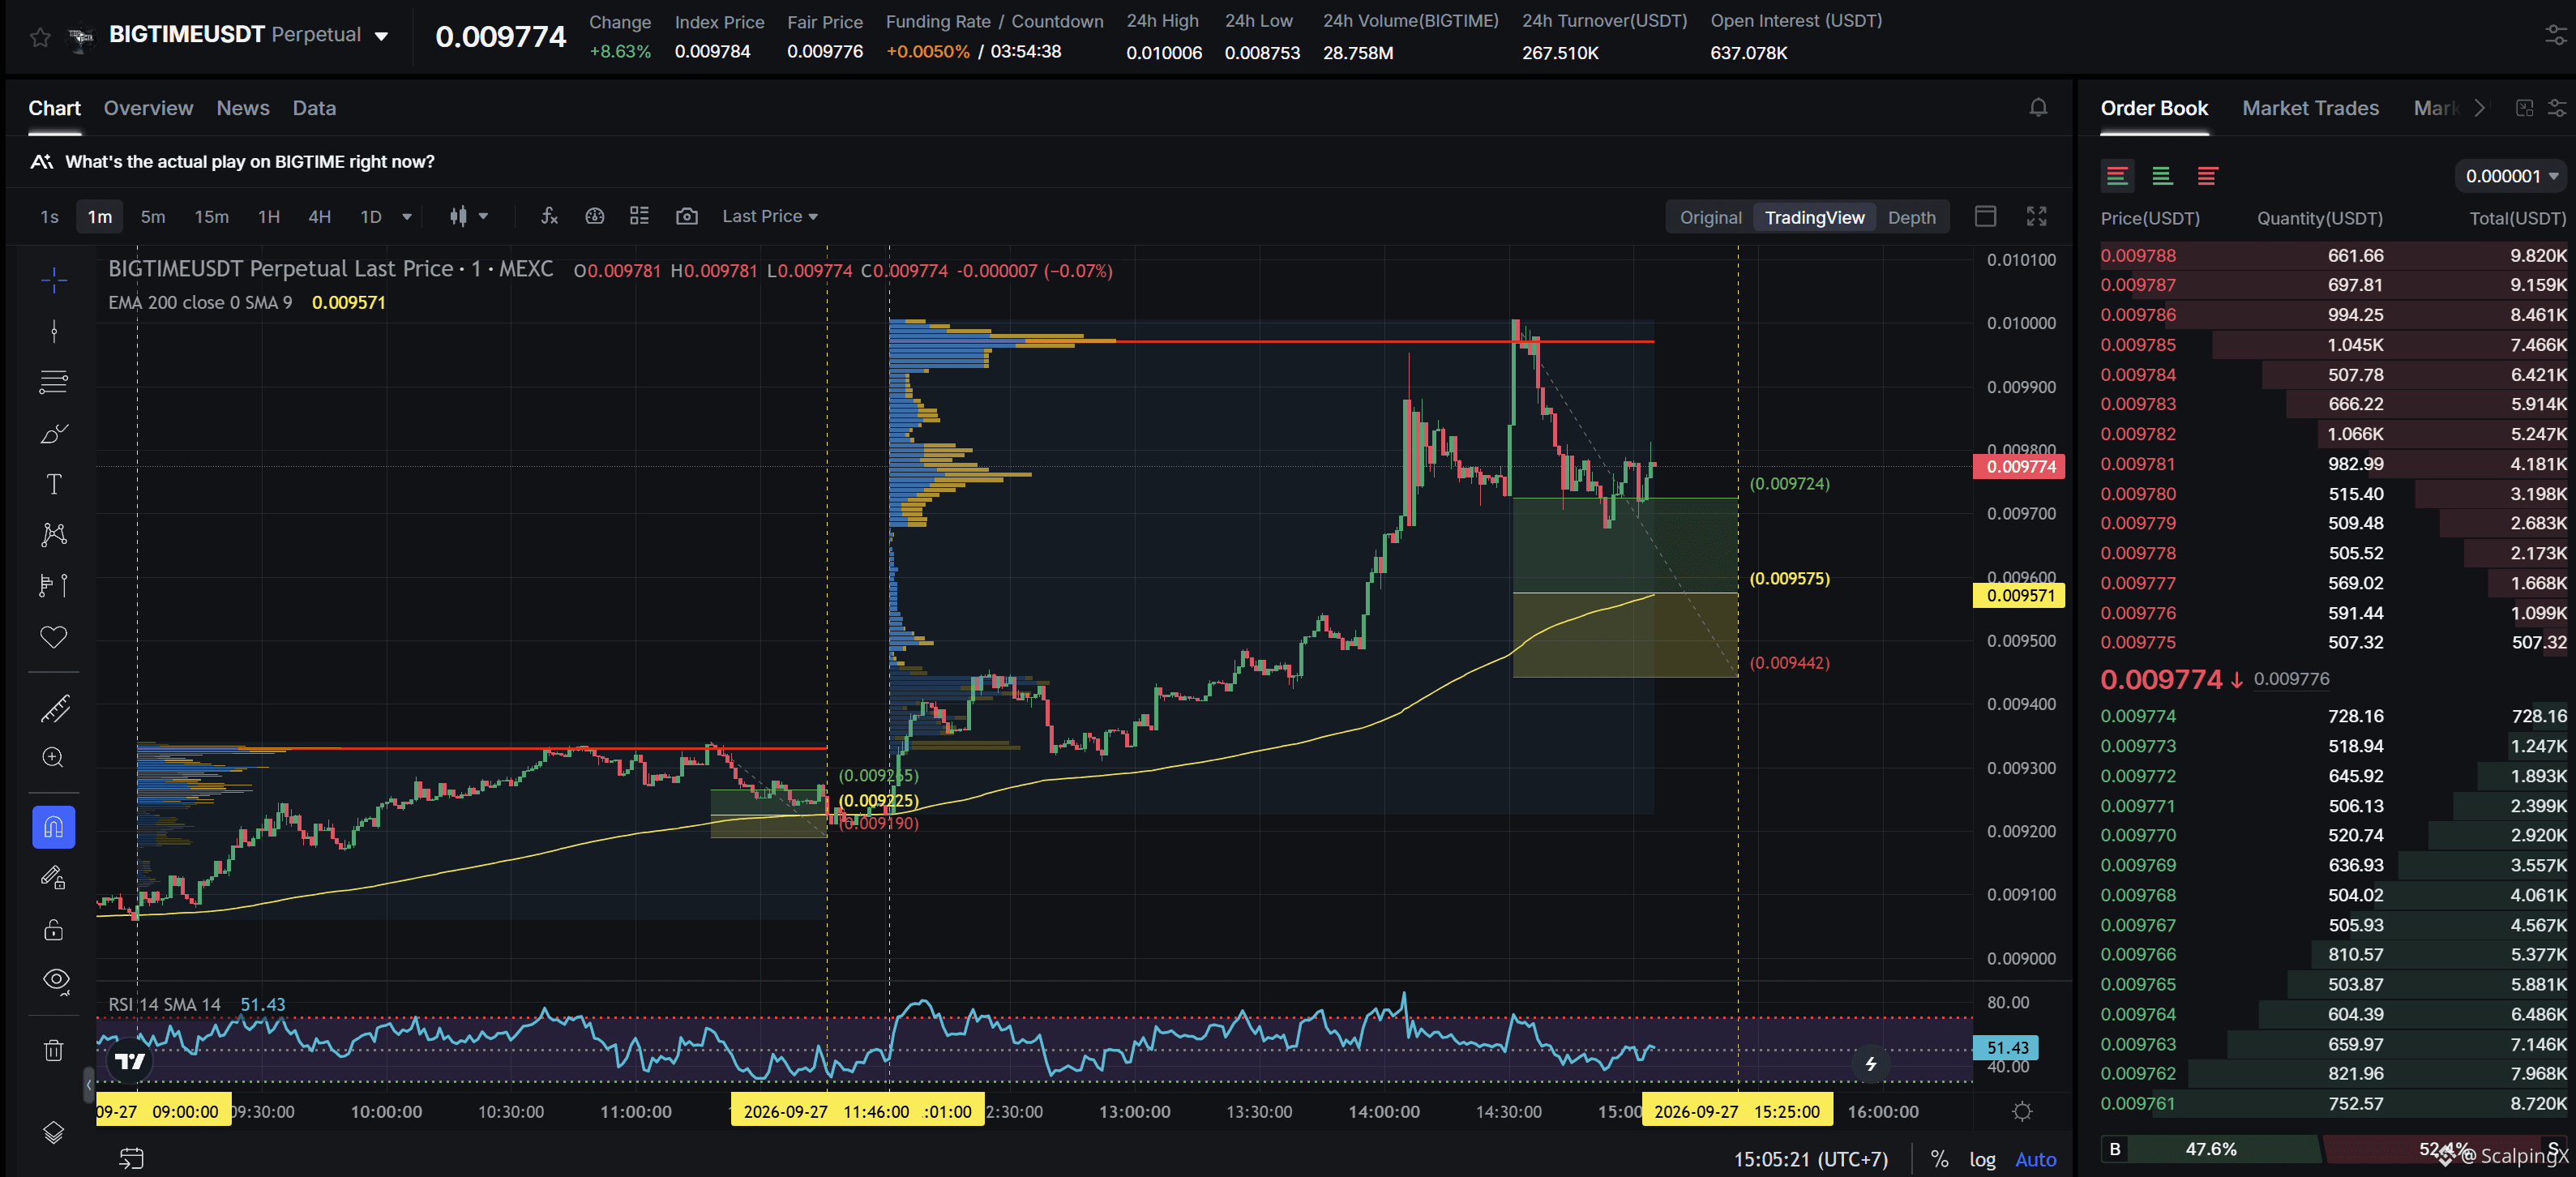
$BIGTIME - Mcap 28.12M$ - 24h Sentiment Neutral
SC02 M1 - pending Long order. Entry lies within HVN + meets positive simplification with a previously highly profitable Long order, the current support zone is approximately 1.35% wide. The uptrend has lasted 3 hours 8 minutes, with a maximum recorded price increase of 8.42%. If price loses this support zone, the trend is highly likely to reverse downward.
$BIGTIME - Mcap 28.12M$ - 24h Sentiment Neutral
SC02 M1 - pending Long order. Entry lies within HVN + meets positive simplification with a previously highly profitable Long order, the current support zone is approximately 1.35% wide. The uptrend has lasted 3 hours 8 minutes, with a maximum recorded price increase of 8.42%. If price loses this support zone, the trend is highly likely to reverse downward.
SC02 M1 - pending Long order. Entry lies within HVN + meets positive simplification with a previously highly profitable Long order, the current support zone is approximately 1.35% wide. The uptrend has lasted 3 hours 8 minutes, with a maximum recorded price increase of 8.42%. If price loses this support zone, the trend is highly likely to reverse downward.
2
·
--
Haussier
Voir la traduction
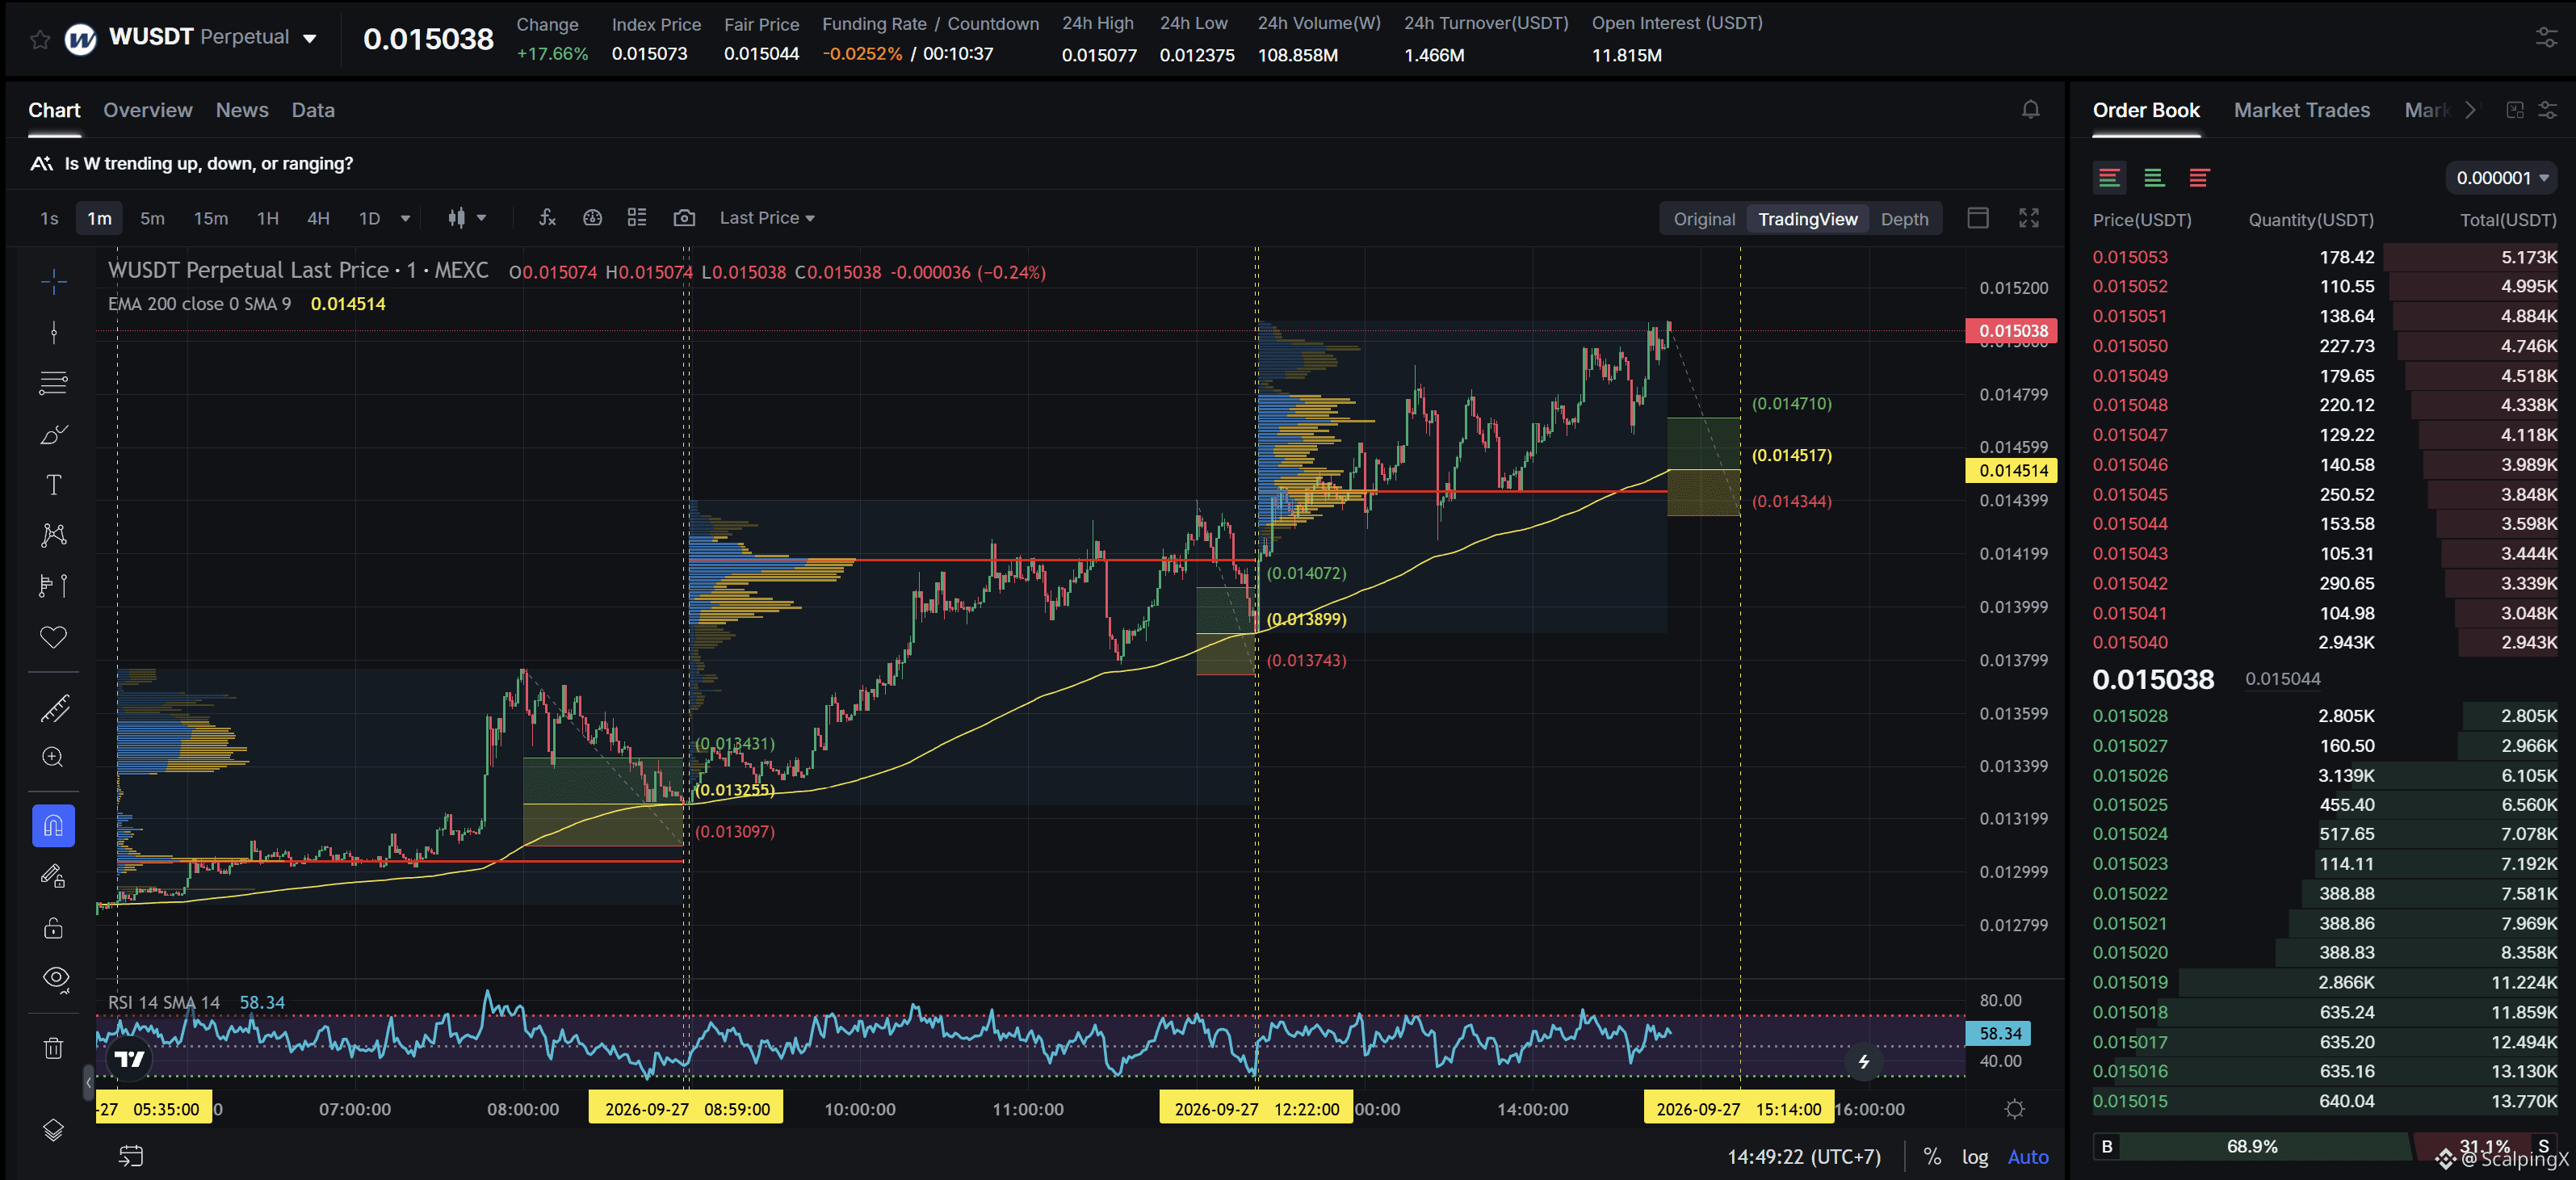
$W - Mcap 98.17M$ - 24h Sentiment +5.77 Bullish
SC02 M1 - pending Long order. Entry contains POC + meets positive simplification with two consecutive previously highly profitable Long orders, the current support zone is approximately 1.20% wide. The uptrend has lasted 2 hours 31 minutes, with a maximum recorded price increase of 8.50%. If price loses this support zone, the trend is highly likely to reverse downward.
$W - Mcap 98.17M$ - 24h Sentiment +5.77 Bullish
SC02 M1 - pending Long order. Entry contains POC + meets positive simplification with two consecutive previously highly profitable Long orders, the current support zone is approximately 1.20% wide. The uptrend has lasted 2 hours 31 minutes, with a maximum recorded price increase of 8.50%. If price loses this support zone, the trend is highly likely to reverse downward.
SC02 M1 - pending Long order. Entry contains POC + meets positive simplification with two consecutive previously highly profitable Long orders, the current support zone is approximately 1.20% wide. The uptrend has lasted 2 hours 31 minutes, with a maximum recorded price increase of 8.50%. If price loses this support zone, the trend is highly likely to reverse downward.
14
·
--
Haussier
Voir la traduction
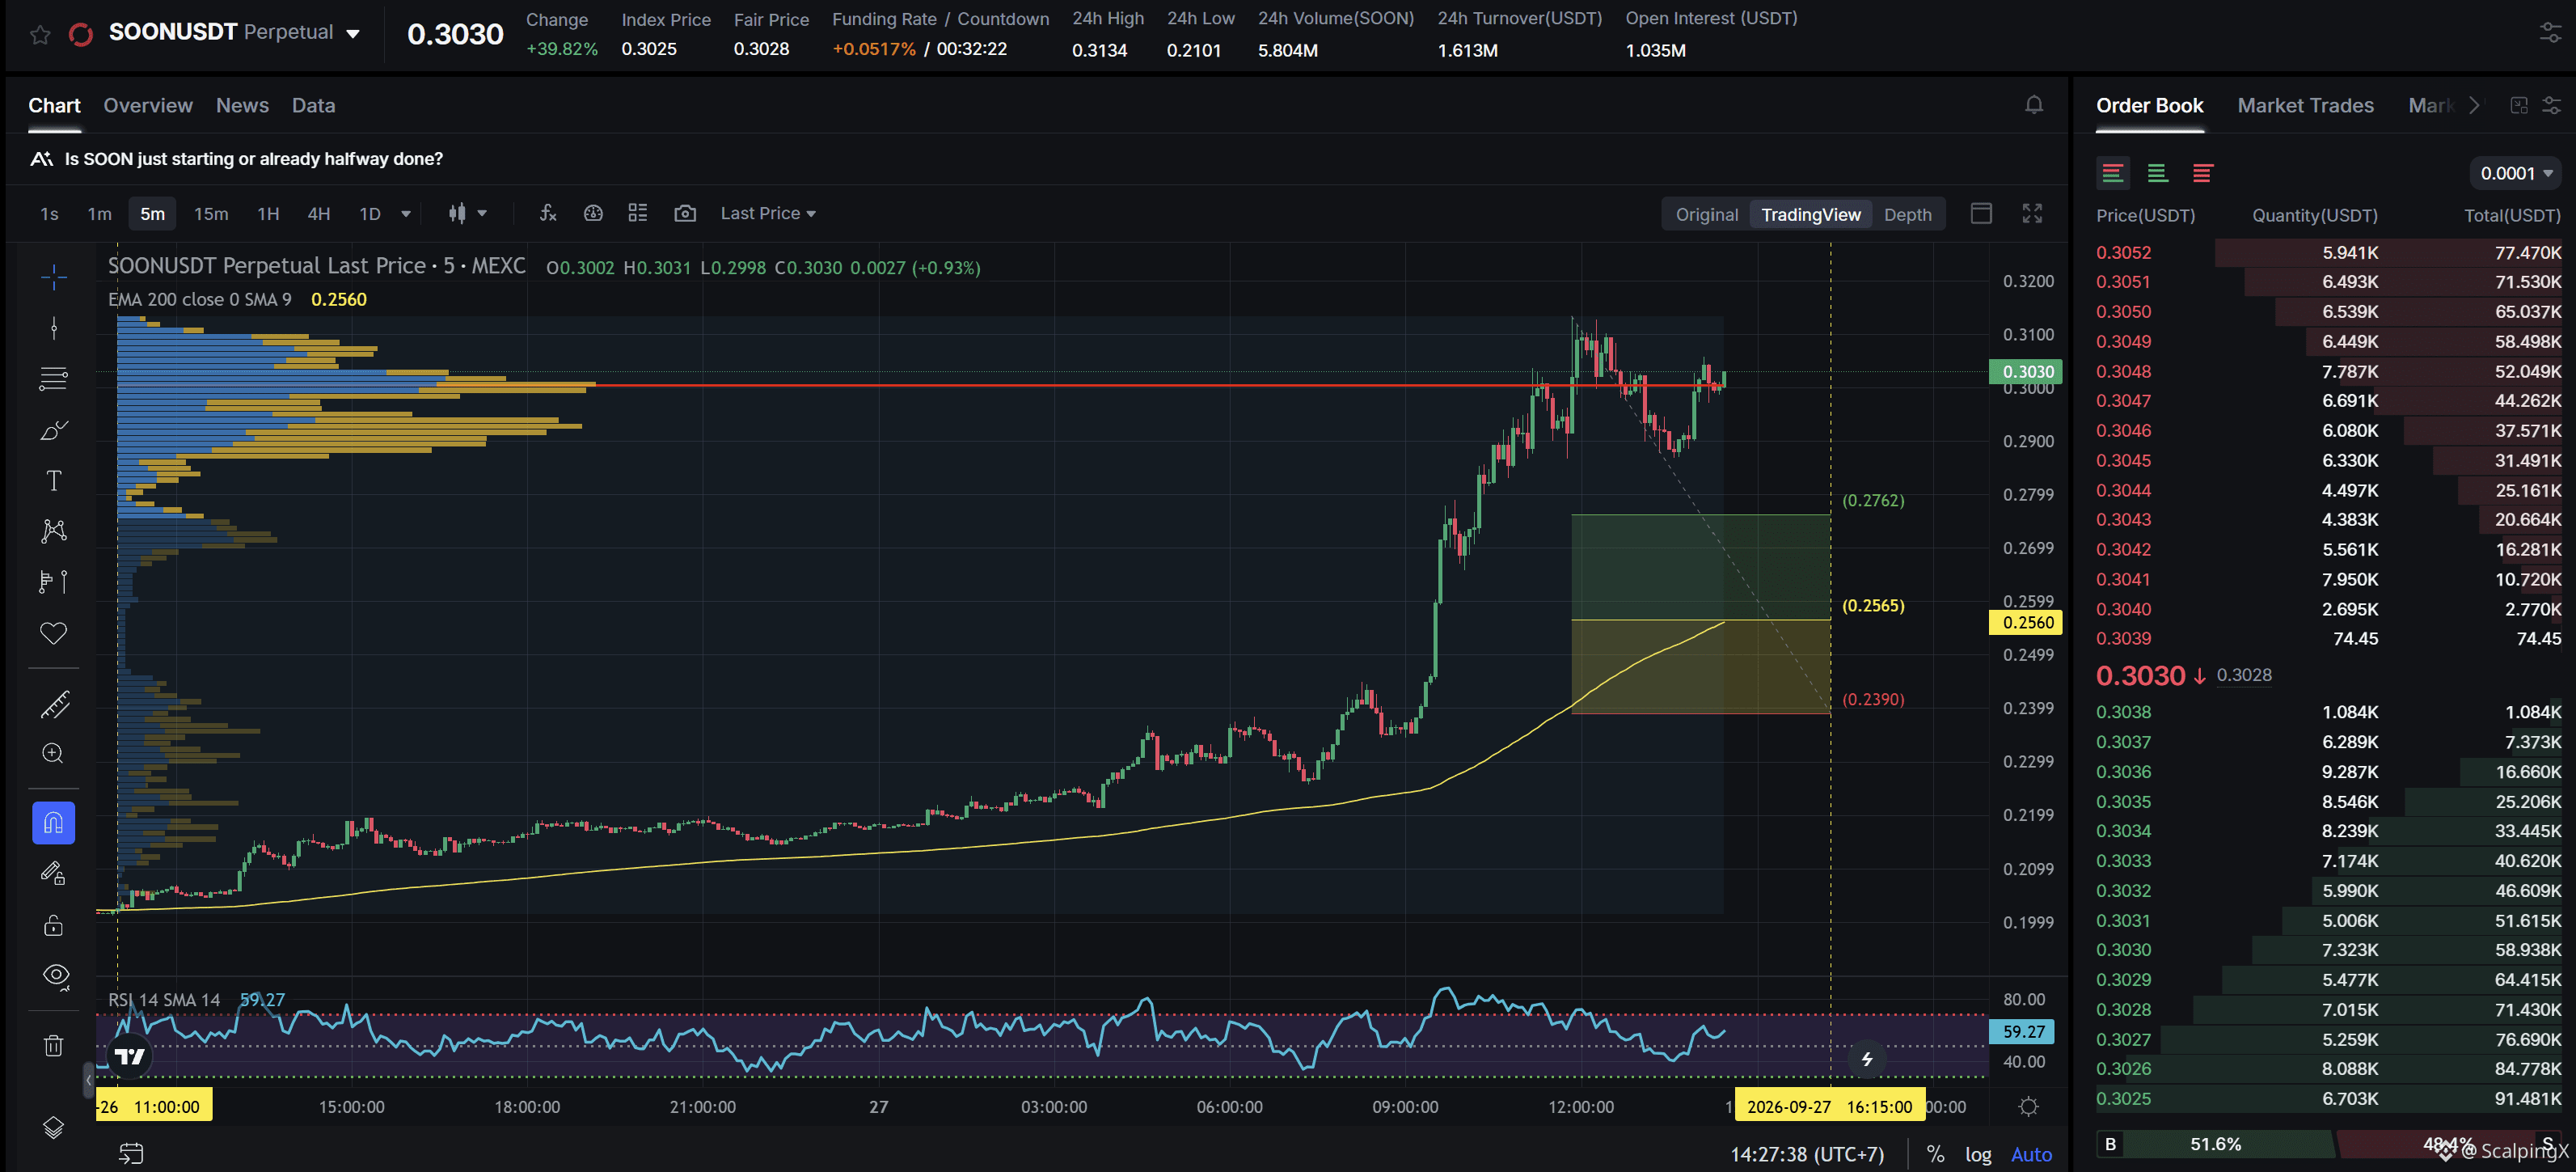
$SOON - Mcap 181.02M$ - 24h Sentiment +5.49 Bullish
SC02 M5 - pending Long order. Entry lies within LVN + not affected by any weak zone, the current support zone is approximately 6.72% wide. The uptrend has lasted 1 day 3 hours 25 minutes, with a maximum recorded price increase of 54.59%. If price loses this support zone, the trend is highly likely to reverse downward.
$SOON - Mcap 181.02M$ - 24h Sentiment +5.49 Bullish
SC02 M5 - pending Long order. Entry lies within LVN + not affected by any weak zone, the current support zone is approximately 6.72% wide. The uptrend has lasted 1 day 3 hours 25 minutes, with a maximum recorded price increase of 54.59%. If price loses this support zone, the trend is highly likely to reverse downward.
SC02 M5 - pending Long order. Entry lies within LVN + not affected by any weak zone, the current support zone is approximately 6.72% wide. The uptrend has lasted 1 day 3 hours 25 minutes, with a maximum recorded price increase of 54.59%. If price loses this support zone, the trend is highly likely to reverse downward.
1
·
--
Haussier
Voir la traduction
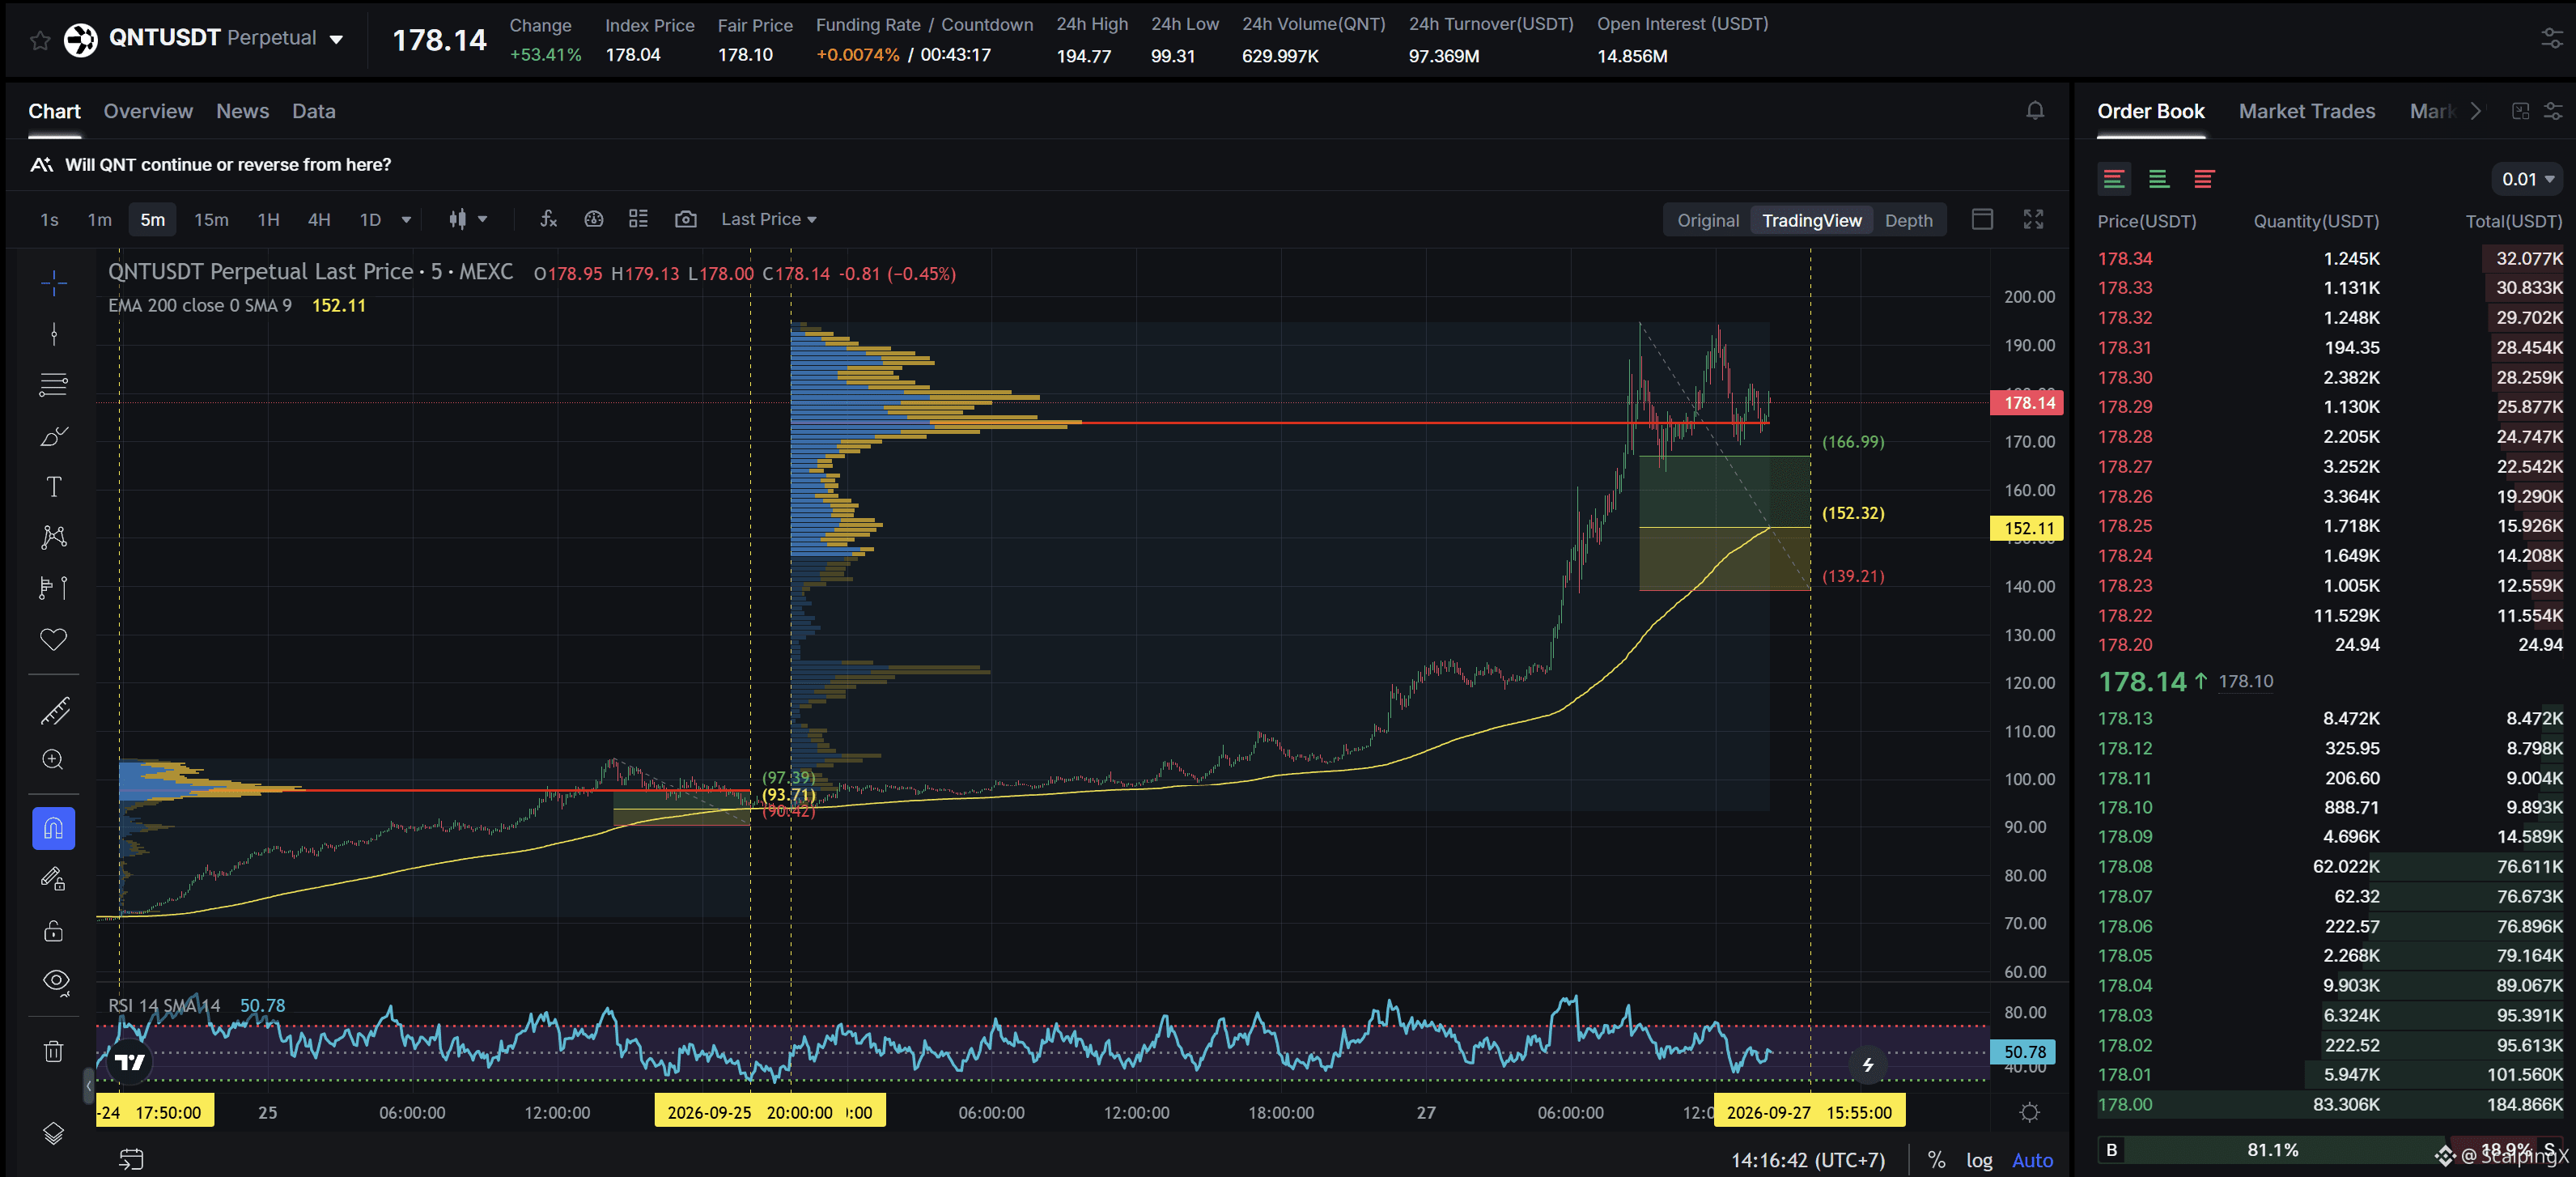
$QNT - Mcap 2.1B$ - 24h Sentiment +5.57 Bullish
SC02 M5 - pending Long order. Entry lies within HVN + meets positive simplification with a previously highly profitable Long order, the current support zone is approximately 8.46% wide. The uptrend has lasted 1 day 16 hours 40 minutes, with a maximum recorded price increase of 107.14%. If price loses this support zone, the trend is highly likely to reverse downward.
$QNT - Mcap 2.1B$ - 24h Sentiment +5.57 Bullish
SC02 M5 - pending Long order. Entry lies within HVN + meets positive simplification with a previously highly profitable Long order, the current support zone is approximately 8.46% wide. The uptrend has lasted 1 day 16 hours 40 minutes, with a maximum recorded price increase of 107.14%. If price loses this support zone, the trend is highly likely to reverse downward.
SC02 M5 - pending Long order. Entry lies within HVN + meets positive simplification with a previously highly profitable Long order, the current support zone is approximately 8.46% wide. The uptrend has lasted 1 day 16 hours 40 minutes, with a maximum recorded price increase of 107.14%. If price loses this support zone, the trend is highly likely to reverse downward.
17
·
--
Haussier
Voir la traduction
📊 TRADING PERFORMANCE & MARKET SENTIMENT INDEX (FGI) REPORT – UPDATED 26/09/2026
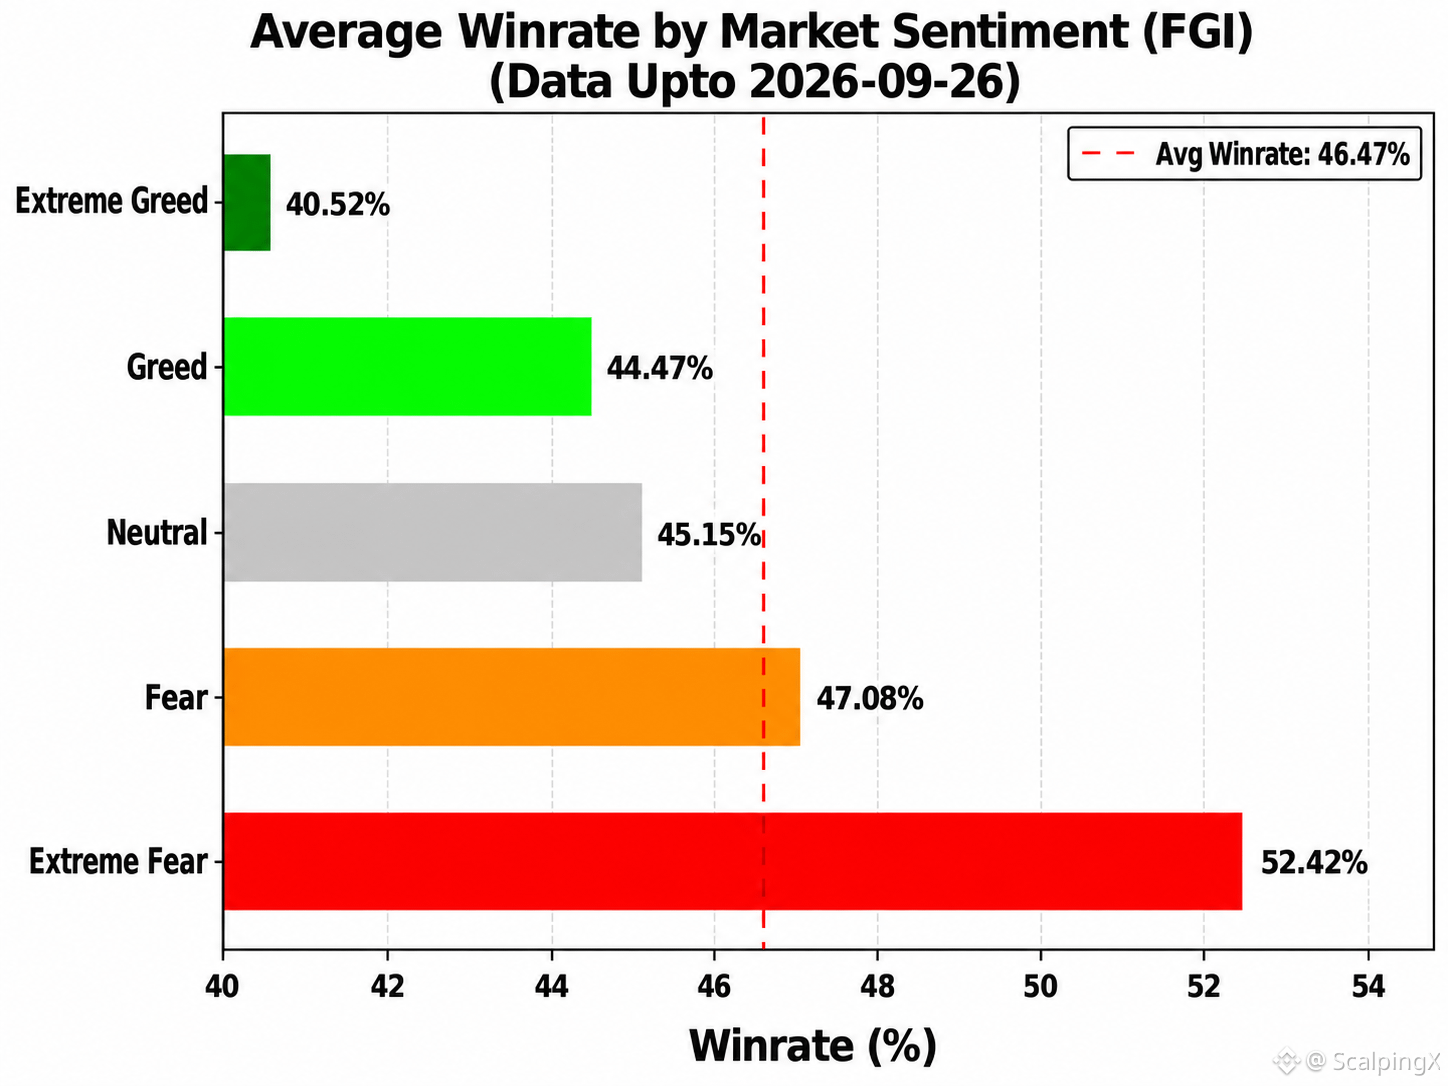
The latest statistics show that the correlation between FGI and Win Rate remains weak and negative, with r ≈ -0.304. This suggests that FGI is not suitable as a standalone tool for determining trade entries, but it can still be useful for quantifying risk. Trading performance generally tends to weaken as market sentiment moves toward extreme optimism, making FGI more useful as an early risk-warning indicator than as a signal to expand profit expectations.
Below is a summary of Win Rate (WR), minimum break-even R:R, and the number of recorded days (n) across each sentiment zone:
🤑 Extreme Greed (≥80): WR 40.5% • R:R=1:1.47 • n=25
😌 Greed (60–80): WR 44.5% • R:R=1:1.25 • n=248
😐 Neutral (40–60): WR 45.2% • R:R=1:1.21 • n=157
😰 Fear (20–40): WR 47.1% • R:R=1:1.12 • n=271
😱 Extreme Fear (<20): WR 52.4% • R:R=1:0.91 • n=115
Percentage of days outperforming the overall average Win Rate of 46.47% in each zone:
🤑 Extreme Greed: 8.0%
😌 Greed: 34.7%
😐 Neutral: 38.2%
😰 Fear: 55.7%
😱 Extreme Fear: 67.8%
➤ Short-term traders can use FGI as a reference for adjusting expected profit targets when entering trades:
📈 When FGI is high, higher profit targets may be needed to maintain a sufficiently favorable R:R and compensate for the lower observed Win Rate.
📉 When FGI is low, profit targets may be reduced to accelerate capital turnover and make profit realization easier.
#TradingInsights $BTC $ETH $SOL
📊 TRADING PERFORMANCE & MARKET SENTIMENT INDEX (FGI) REPORT – UPDATED 26/09/2026
The latest statistics show that the correlation between FGI and Win Rate remains weak and negative, with r ≈ -0.304. This suggests that FGI is not suitable as a standalone tool for determining trade entries, but it can still be useful for quantifying risk. Trading performance generally tends to weaken as market sentiment moves toward extreme optimism, making FGI more useful as an early risk-warning indicator than as a signal to expand profit expectations.
Below is a summary of Win Rate (WR), minimum break-even R:R, and the number of recorded days (n) across each sentiment zone:
🤑 Extreme Greed (≥80): WR 40.5% • R:R=1:1.47 • n=25
😌 Greed (60–80): WR 44.5% • R:R=1:1.25 • n=248
😐 Neutral (40–60): WR 45.2% • R:R=1:1.21 • n=157
😰 Fear (20–40): WR 47.1% • R:R=1:1.12 • n=271
😱 Extreme Fear (<20): WR 52.4% • R:R=1:0.91 • n=115
Percentage of days outperforming the overall average Win Rate of 46.47% in each zone:
🤑 Extreme Greed: 8.0%
😌 Greed: 34.7%
😐 Neutral: 38.2%
😰 Fear: 55.7%
😱 Extreme Fear: 67.8%
➤ Short-term traders can use FGI as a reference for adjusting expected profit targets when entering trades:
📈 When FGI is high, higher profit targets may be needed to maintain a sufficiently favorable R:R and compensate for the lower observed Win Rate.
📉 When FGI is low, profit targets may be reduced to accelerate capital turnover and make profit realization easier.
#TradingInsights $BTC $ETH $SOL
The latest statistics show that the correlation between FGI and Win Rate remains weak and negative, with r ≈ -0.304. This suggests that FGI is not suitable as a standalone tool for determining trade entries, but it can still be useful for quantifying risk. Trading performance generally tends to weaken as market sentiment moves toward extreme optimism, making FGI more useful as an early risk-warning indicator than as a signal to expand profit expectations.
Below is a summary of Win Rate (WR), minimum break-even R:R, and the number of recorded days (n) across each sentiment zone:
🤑 Extreme Greed (≥80): WR 40.5% • R:R=1:1.47 • n=25
😌 Greed (60–80): WR 44.5% • R:R=1:1.25 • n=248
😐 Neutral (40–60): WR 45.2% • R:R=1:1.21 • n=157
😰 Fear (20–40): WR 47.1% • R:R=1:1.12 • n=271
😱 Extreme Fear (<20): WR 52.4% • R:R=1:0.91 • n=115
Percentage of days outperforming the overall average Win Rate of 46.47% in each zone:
🤑 Extreme Greed: 8.0%
😌 Greed: 34.7%
😐 Neutral: 38.2%
😰 Fear: 55.7%
😱 Extreme Fear: 67.8%
➤ Short-term traders can use FGI as a reference for adjusting expected profit targets when entering trades:
📈 When FGI is high, higher profit targets may be needed to maintain a sufficiently favorable R:R and compensate for the lower observed Win Rate.
📉 When FGI is low, profit targets may be reduced to accelerate capital turnover and make profit realization easier.
#TradingInsights $BTC $ETH $SOL
92
·
--
Voir la traduction
Updated 2026-09-26, community-wide trading
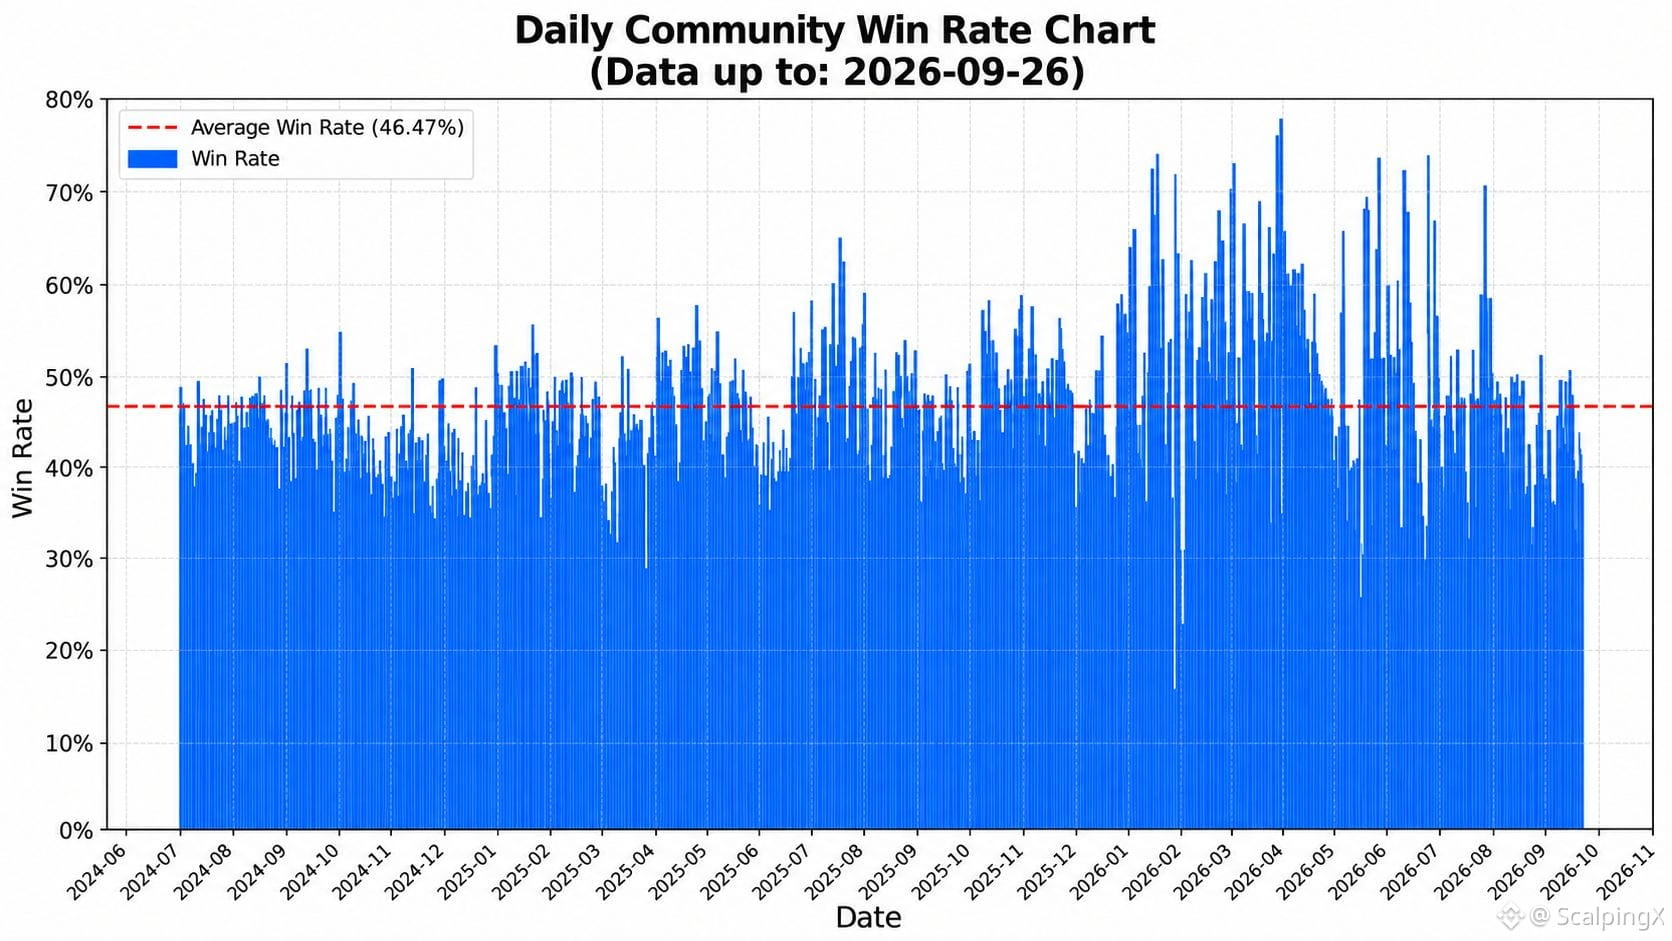
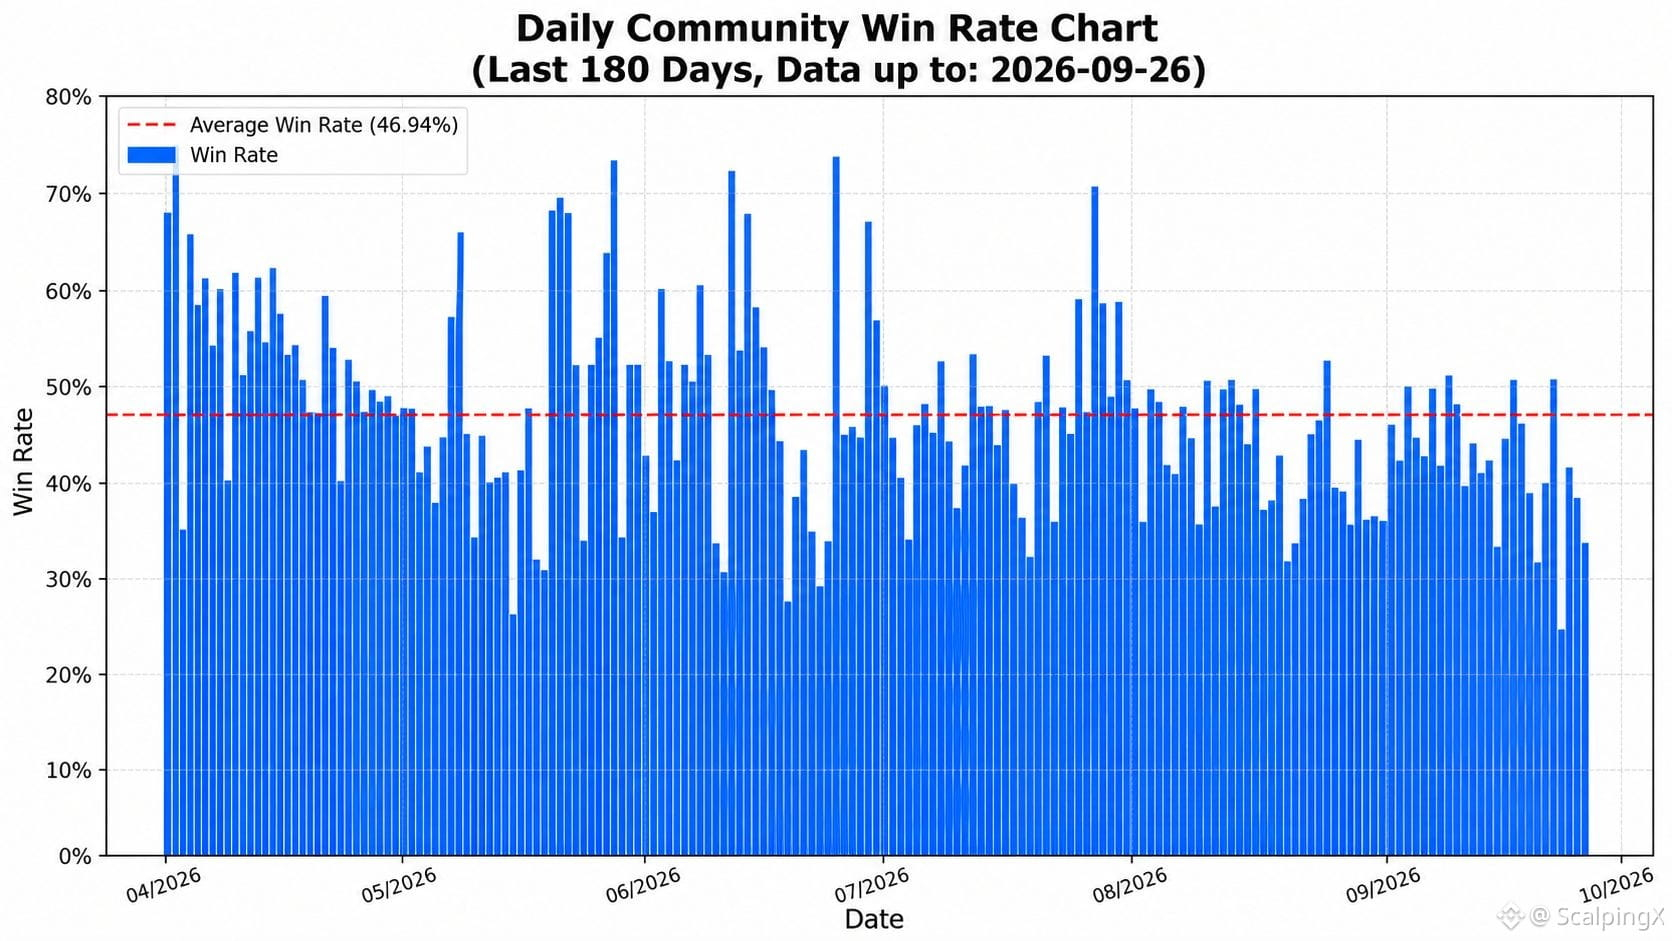
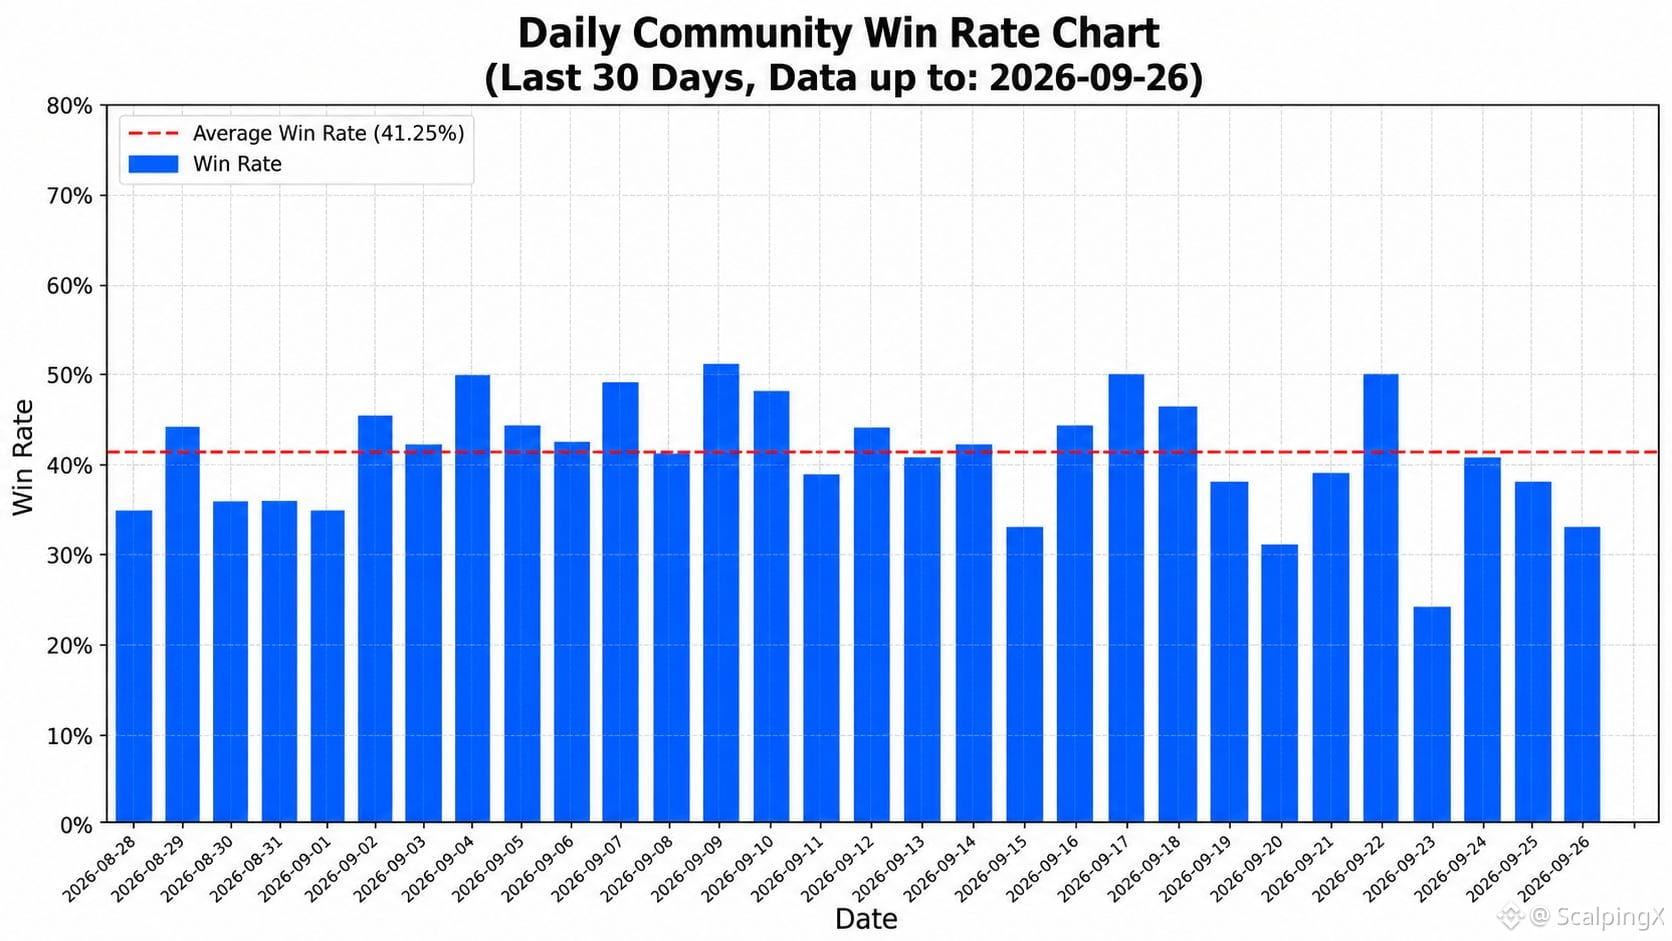
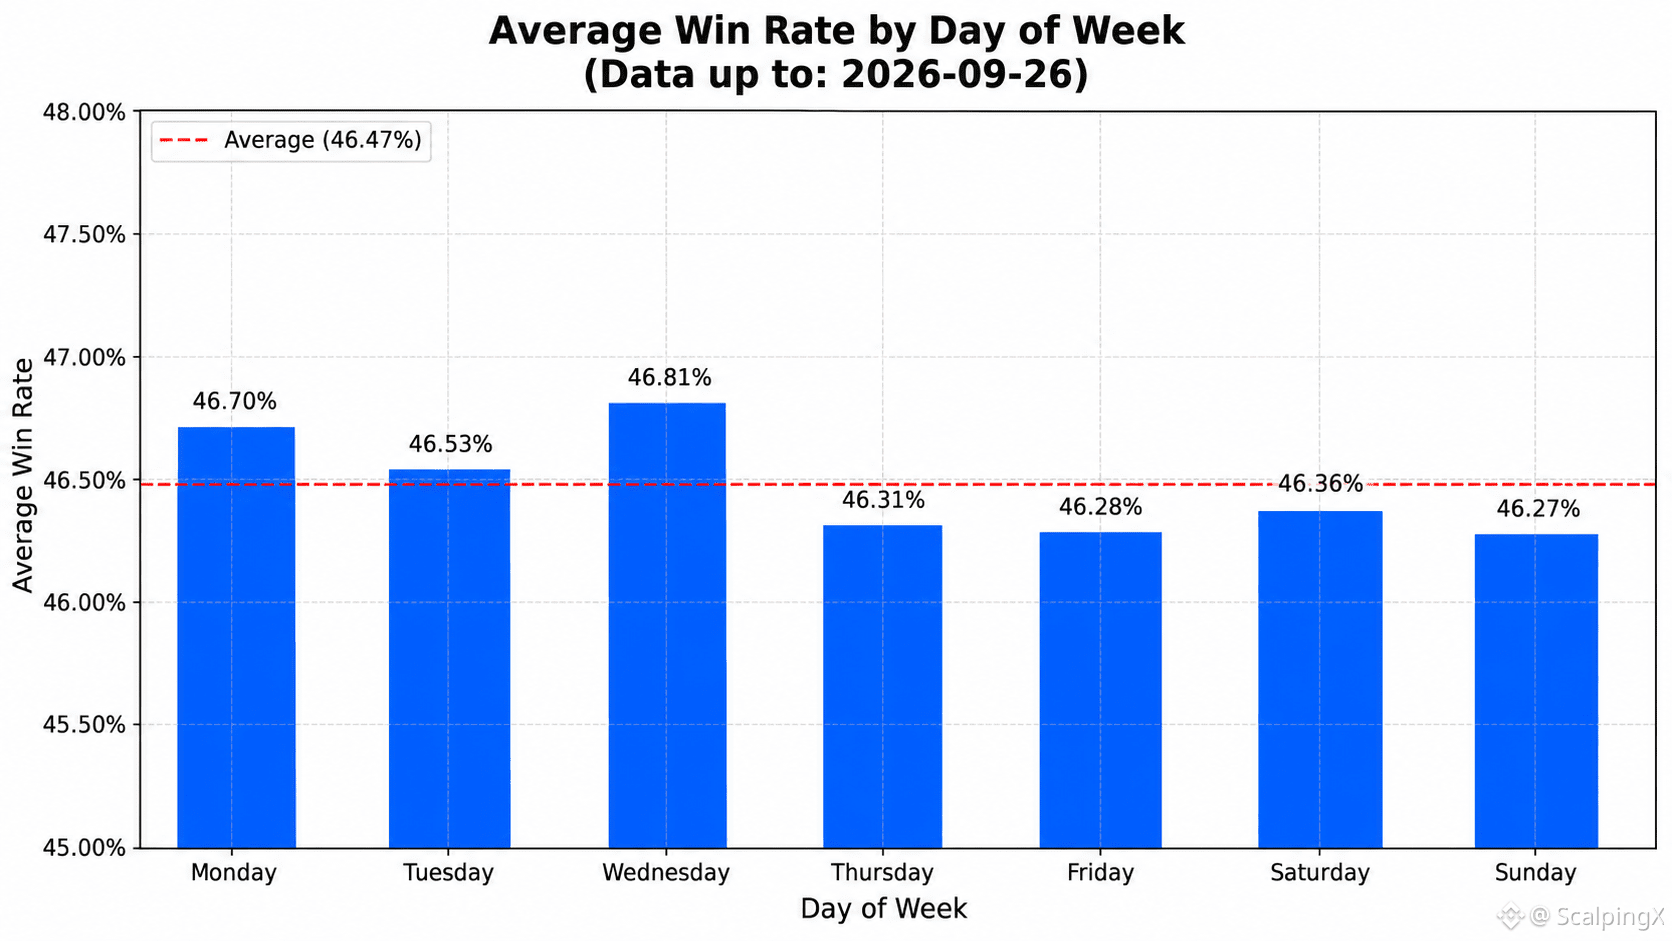
📊 The average win rate is 46.47%
🏆 The highest daily win rate was 78.08% on 2026-04-01. The lowest was 15.69% on 2026-01-25
📅 Wednesday has the highest average win rate at 46.81%. Sunday has the lowest average win rate at 46.27%
⏱️ The highest 7-day average win rate was 63.27% for the period ending 2026-04-05. The lowest was 35.60% for the period ending 2026-06-24
⚖️ There were 377 days with a win rate above the overall average and 439 days with a win rate at or below the average
📈 There were 224 days with a win rate above 50%, 436 days between 40% and 50%, and 156 days below 40%
#TradingStats $GRAM
Updated 2026-09-26, community-wide trading
📊 The average win rate is 46.47%
🏆 The highest daily win rate was 78.08% on 2026-04-01. The lowest was 15.69% on 2026-01-25
📅 Wednesday has the highest average win rate at 46.81%. Sunday has the lowest average win rate at 46.27%
⏱️ The highest 7-day average win rate was 63.27% for the period ending 2026-04-05. The lowest was 35.60% for the period ending 2026-06-24
⚖️ There were 377 days with a win rate above the overall average and 439 days with a win rate at or below the average
📈 There were 224 days with a win rate above 50%, 436 days between 40% and 50%, and 156 days below 40%
#TradingStats $GRAM
📊 The average win rate is 46.47%
🏆 The highest daily win rate was 78.08% on 2026-04-01. The lowest was 15.69% on 2026-01-25
📅 Wednesday has the highest average win rate at 46.81%. Sunday has the lowest average win rate at 46.27%
⏱️ The highest 7-day average win rate was 63.27% for the period ending 2026-04-05. The lowest was 35.60% for the period ending 2026-06-24
⚖️ There were 377 days with a win rate above the overall average and 439 days with a win rate at or below the average
📈 There were 224 days with a win rate above 50%, 436 days between 40% and 50%, and 156 days below 40%
#TradingStats $GRAM
120
·
--
Haussier
Voir la traduction
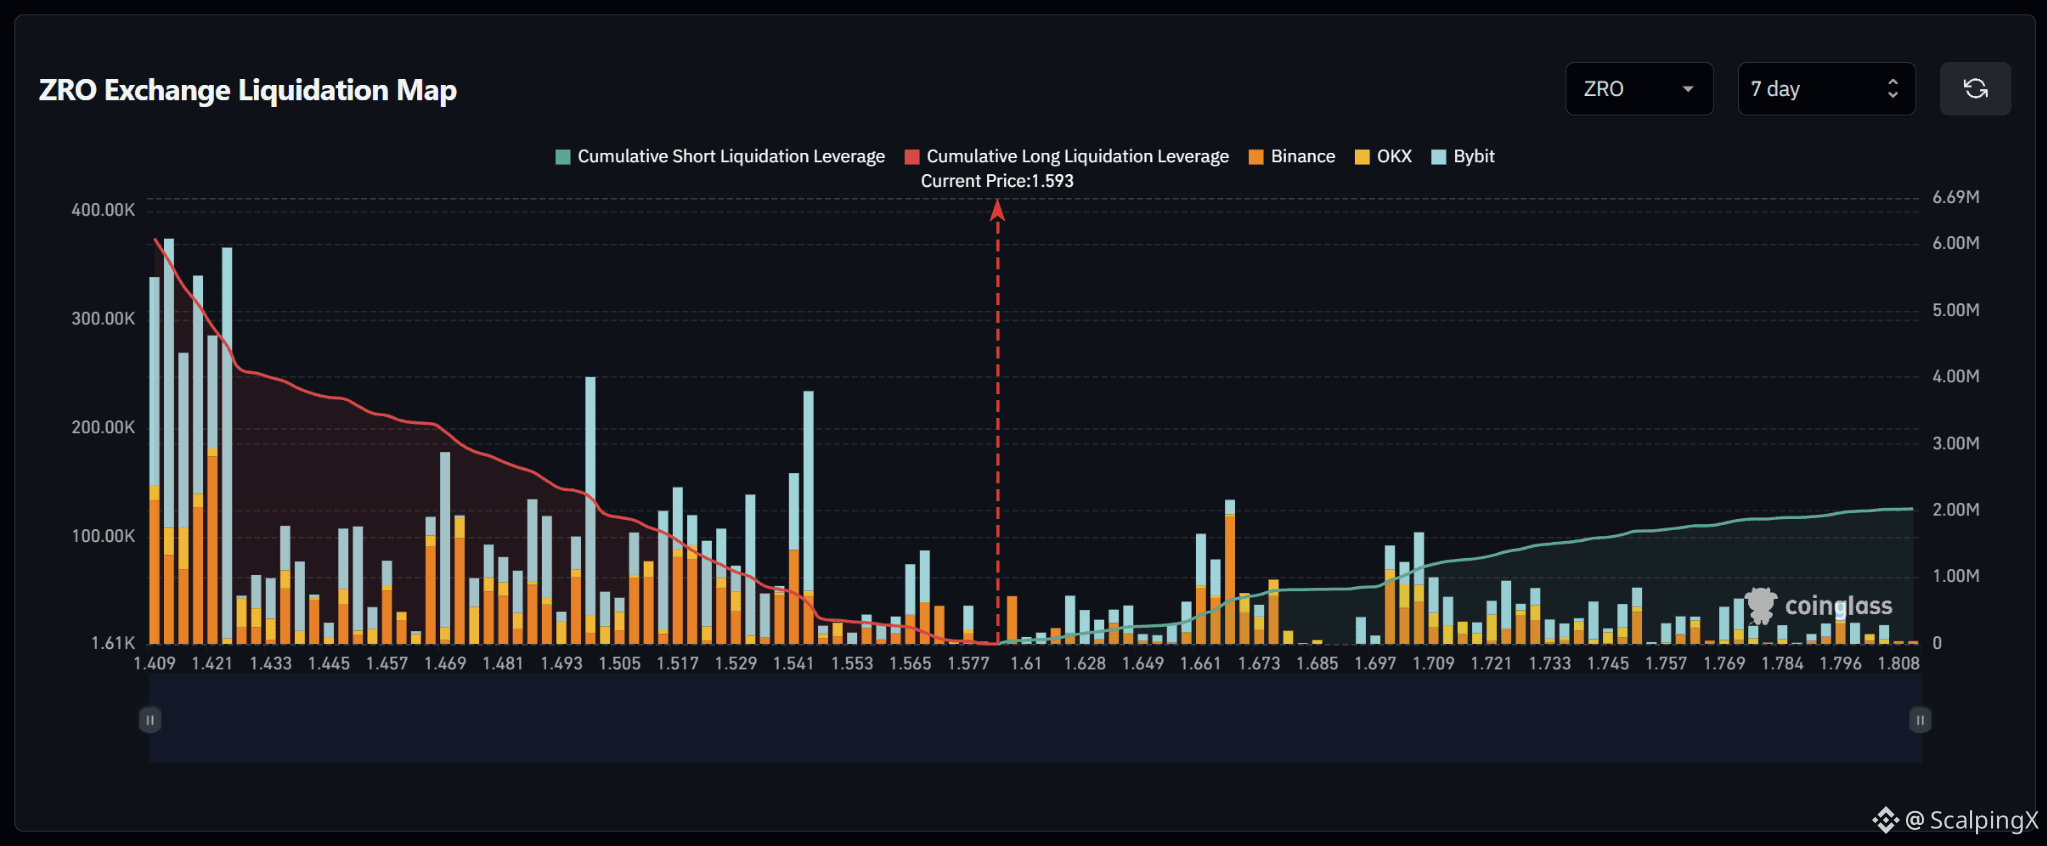
$ZRO – Liquidation Map (7 Days) – Current Price 1.593
🔎 The 7-day liquidation map shows roughly 6 million USD in long liquidations below the current price, significantly exceeding approximately 2 million USD in short liquidations above. The liquidity structure therefore clearly tilts to the downside, with around three times more cumulative liquidity below the market.
📉 Below the market, long-liquidation liquidity is broadly distributed across 1.41–1.55. The strongest cluster sits around 1.409–1.423 with several bars near 0.27–0.38 million USD, while 1.493–1.505 and 1.535–1.543 also contain notable bars around 0.23–0.25 million USD. Losing 1.577 would shift attention toward 1.565–1.541 and then 1.517–1.493.
📈 Above the market, short-liquidation liquidity is generally thinner. The nearest notable cluster sits around 1.658–1.667 with a bar near 0.13 million USD, while 1.697–1.709 contains several bars around 0.09–0.10 million USD. Beyond 1.72, liquidity becomes increasingly dispersed.
🧭 The broader setup favors the downside because long-liquidation exposure below clearly dominates. Losing 1.577 would increase the probability of a sweep toward 1.565–1.541, followed by 1.517–1.493. Breaking above 1.61 would instead expose 1.658–1.667 and then 1.697–1.709.
$ZRO – Liquidation Map (7 Days) – Current Price 1.593
🔎 The 7-day liquidation map shows roughly 6 million USD in long liquidations below the current price, significantly exceeding approximately 2 million USD in short liquidations above. The liquidity structure therefore clearly tilts to the downside, with around three times more cumulative liquidity below the market.
📉 Below the market, long-liquidation liquidity is broadly distributed across 1.41–1.55. The strongest cluster sits around 1.409–1.423 with several bars near 0.27–0.38 million USD, while 1.493–1.505 and 1.535–1.543 also contain notable bars around 0.23–0.25 million USD. Losing 1.577 would shift attention toward 1.565–1.541 and then 1.517–1.493.
📈 Above the market, short-liquidation liquidity is generally thinner. The nearest notable cluster sits around 1.658–1.667 with a bar near 0.13 million USD, while 1.697–1.709 contains several bars around 0.09–0.10 million USD. Beyond 1.72, liquidity becomes increasingly dispersed.
🧭 The broader setup favors the downside because long-liquidation exposure below clearly dominates. Losing 1.577 would increase the probability of a sweep toward 1.565–1.541, followed by 1.517–1.493. Breaking above 1.61 would instead expose 1.658–1.667 and then 1.697–1.709.
🔎 The 7-day liquidation map shows roughly 6 million USD in long liquidations below the current price, significantly exceeding approximately 2 million USD in short liquidations above. The liquidity structure therefore clearly tilts to the downside, with around three times more cumulative liquidity below the market.
📉 Below the market, long-liquidation liquidity is broadly distributed across 1.41–1.55. The strongest cluster sits around 1.409–1.423 with several bars near 0.27–0.38 million USD, while 1.493–1.505 and 1.535–1.543 also contain notable bars around 0.23–0.25 million USD. Losing 1.577 would shift attention toward 1.565–1.541 and then 1.517–1.493.
📈 Above the market, short-liquidation liquidity is generally thinner. The nearest notable cluster sits around 1.658–1.667 with a bar near 0.13 million USD, while 1.697–1.709 contains several bars around 0.09–0.10 million USD. Beyond 1.72, liquidity becomes increasingly dispersed.
🧭 The broader setup favors the downside because long-liquidation exposure below clearly dominates. Losing 1.577 would increase the probability of a sweep toward 1.565–1.541, followed by 1.517–1.493. Breaking above 1.61 would instead expose 1.658–1.667 and then 1.697–1.709.
61
·
--
Haussier
Voir la traduction
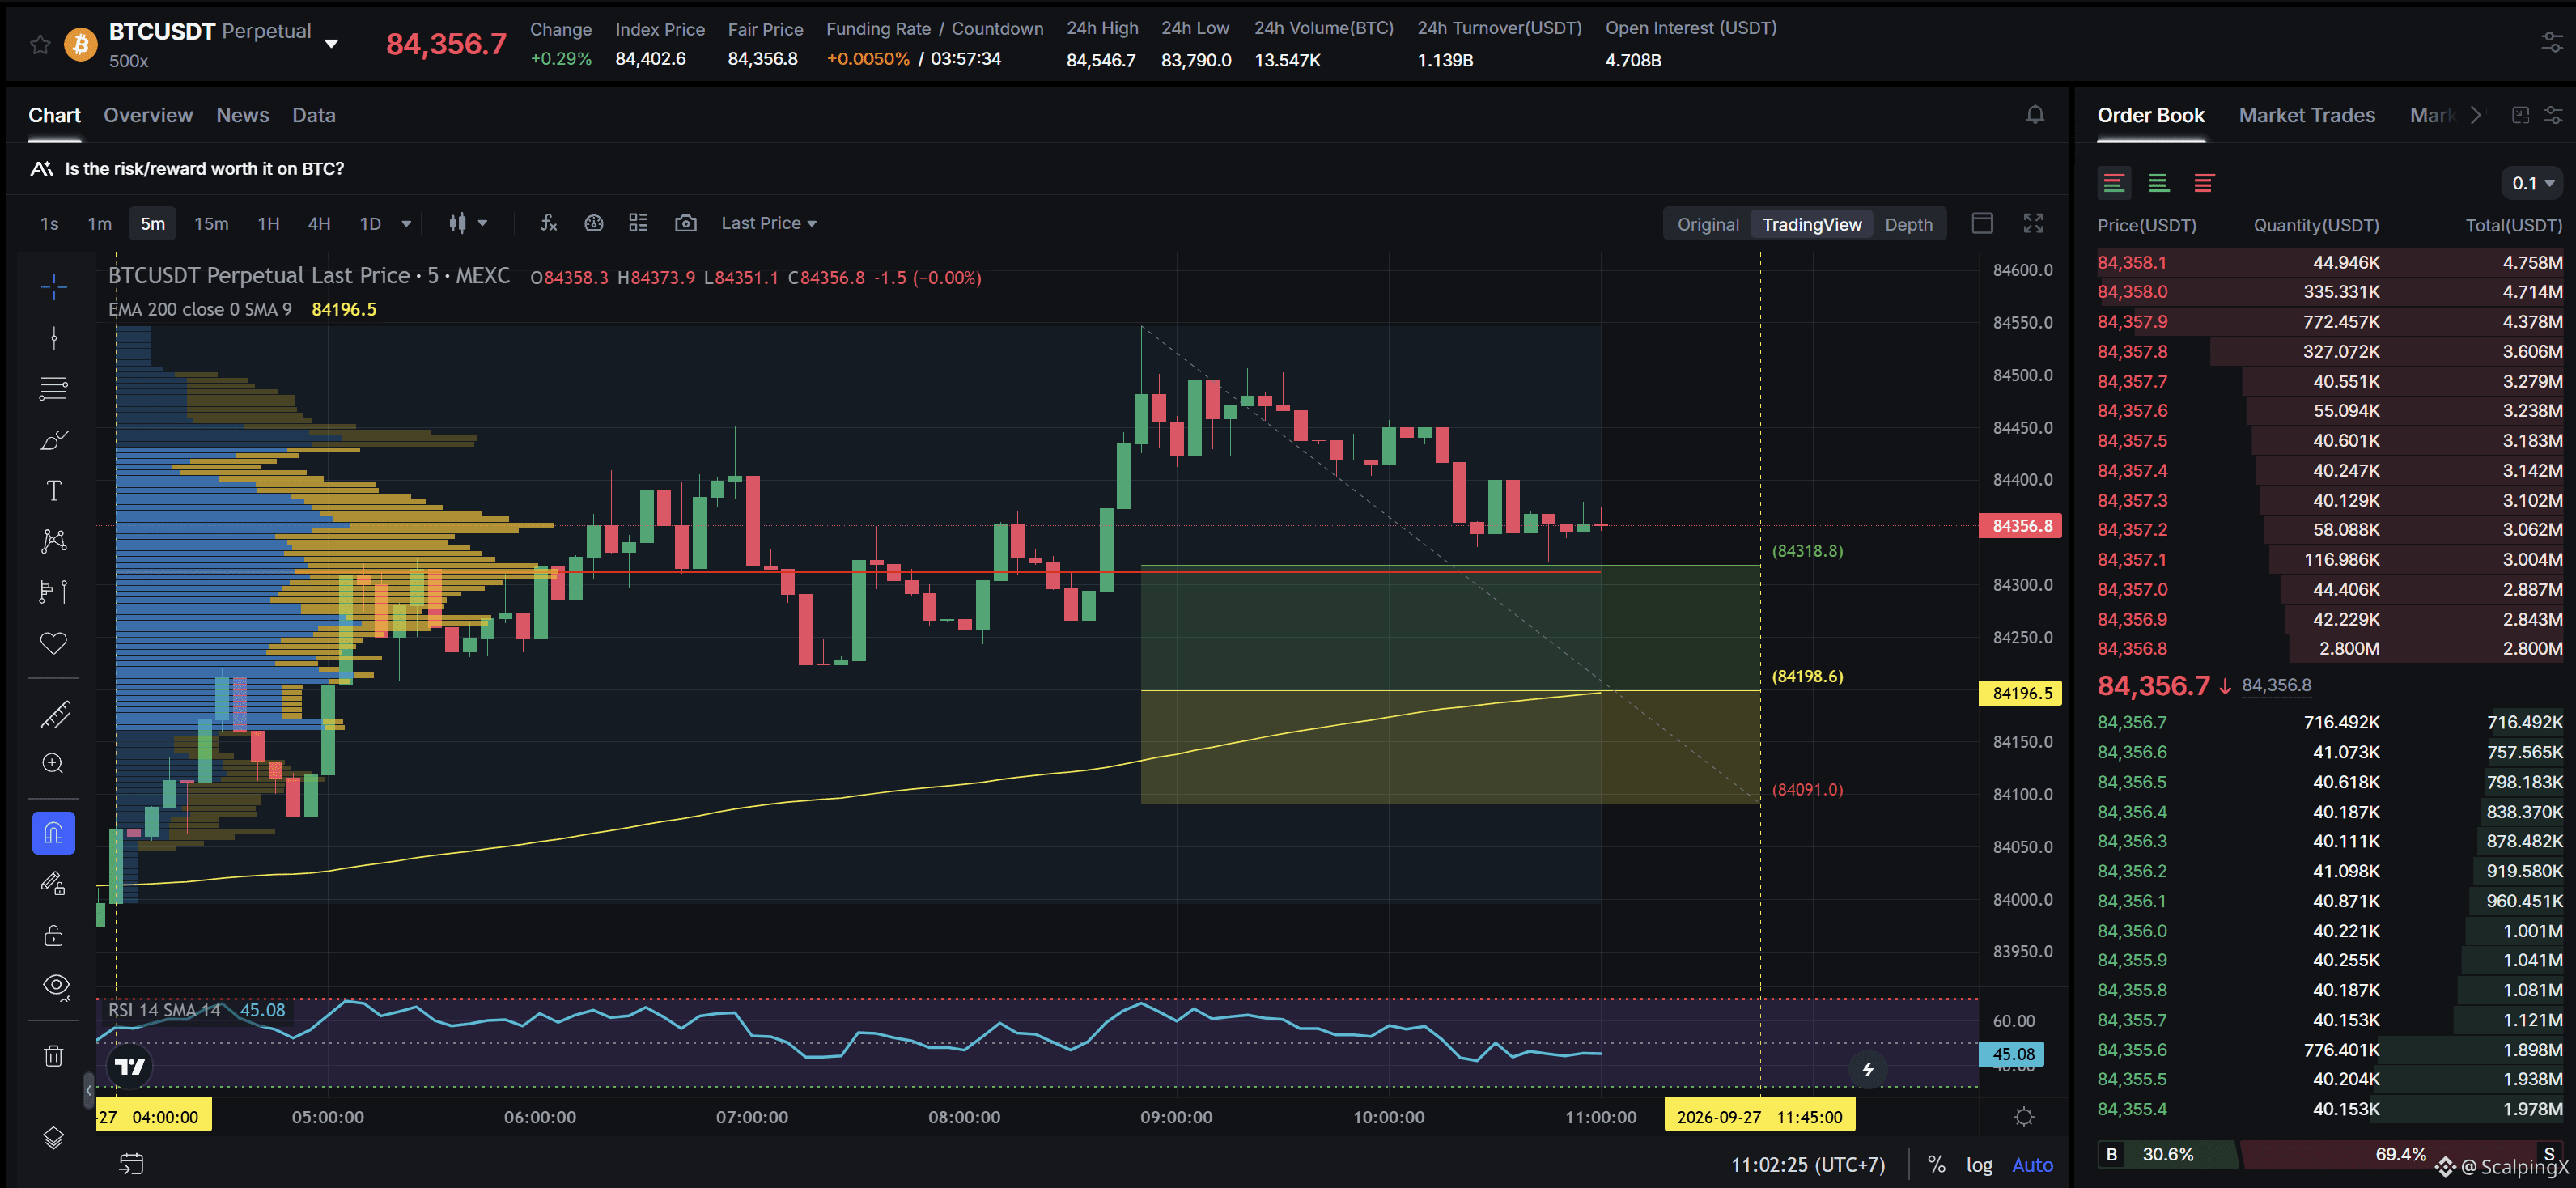
$BTC - Mcap 1.69T$ - 24h Sentiment +2.97 Bullish
SC02 M5 - pending Long order. Entry lies within LVN + not affected by any weak zone, the current support zone is approximately 0.13% wide. The uptrend has lasted 7 hours, with a maximum recorded price increase of 0.64%. If price loses this support zone, the trend is highly likely to reverse downward.
$BTC - Mcap 1.69T$ - 24h Sentiment +2.97 Bullish
SC02 M5 - pending Long order. Entry lies within LVN + not affected by any weak zone, the current support zone is approximately 0.13% wide. The uptrend has lasted 7 hours, with a maximum recorded price increase of 0.64%. If price loses this support zone, the trend is highly likely to reverse downward.
SC02 M5 - pending Long order. Entry lies within LVN + not affected by any weak zone, the current support zone is approximately 0.13% wide. The uptrend has lasted 7 hours, with a maximum recorded price increase of 0.64%. If price loses this support zone, the trend is highly likely to reverse downward.
56
·
--
Haussier
Voir la traduction
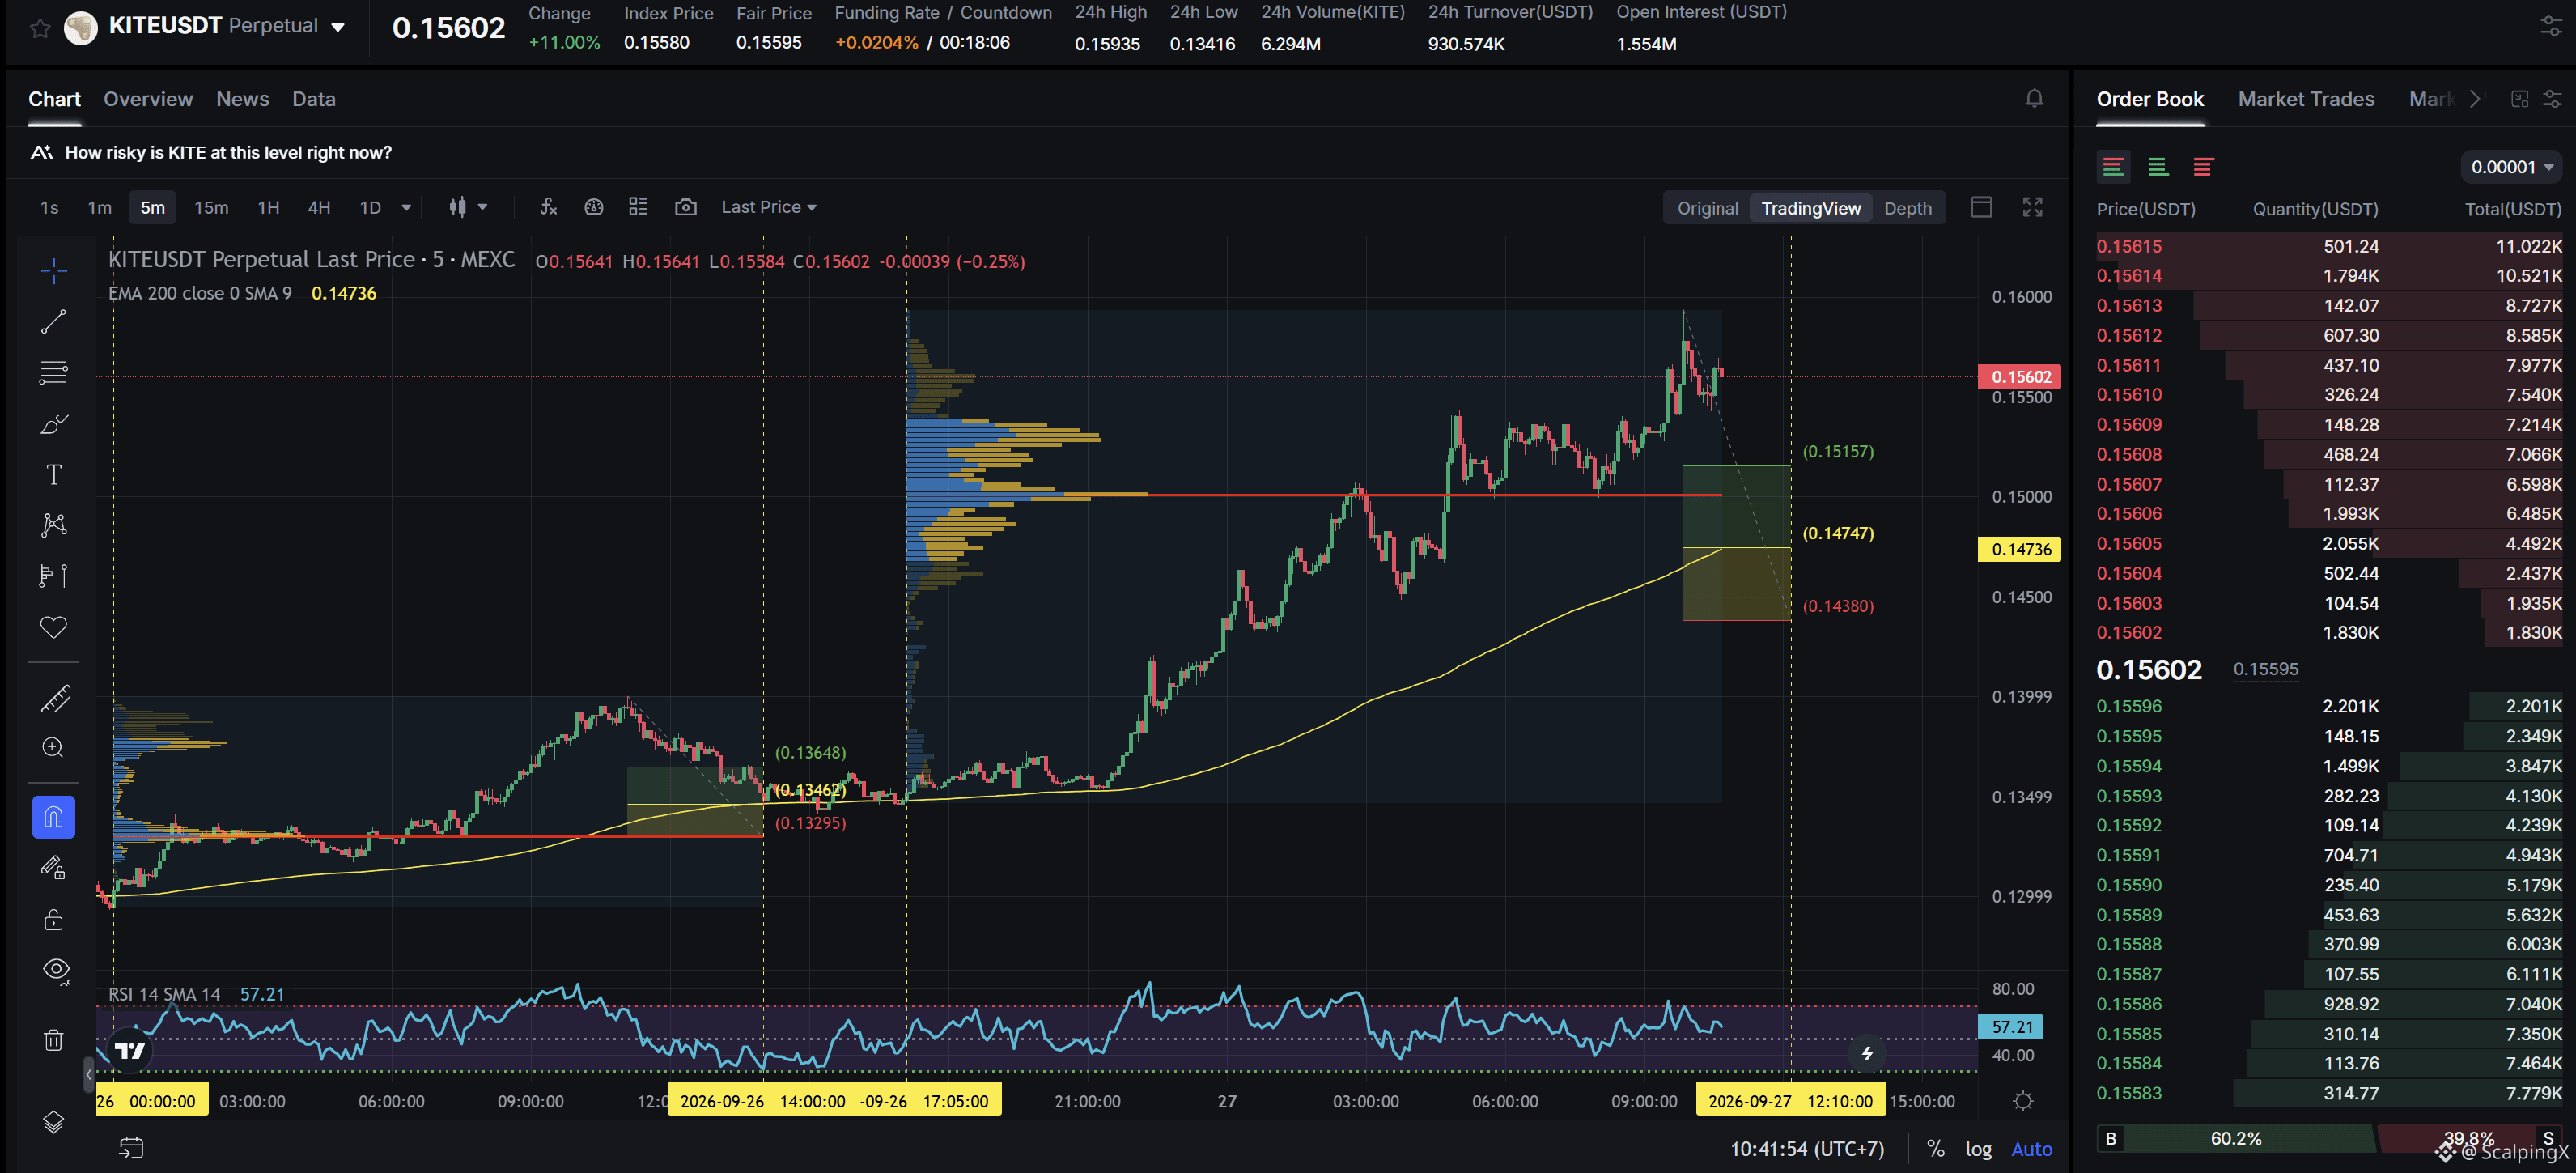
$KITE - Mcap 391.58M$ - 24h Sentiment +5.55 Bullish
SC02 M5 - pending Long order. Entry lies within LVN + meets positive simplification with a previously highly profitable Long order, the current support zone is approximately 2.50% wide. The uptrend has lasted 17 hours 35 minutes, with a maximum recorded price increase of 18.09%. If price loses this support zone, the trend is highly likely to reverse downward.
$KITE - Mcap 391.58M$ - 24h Sentiment +5.55 Bullish
SC02 M5 - pending Long order. Entry lies within LVN + meets positive simplification with a previously highly profitable Long order, the current support zone is approximately 2.50% wide. The uptrend has lasted 17 hours 35 minutes, with a maximum recorded price increase of 18.09%. If price loses this support zone, the trend is highly likely to reverse downward.
SC02 M5 - pending Long order. Entry lies within LVN + meets positive simplification with a previously highly profitable Long order, the current support zone is approximately 2.50% wide. The uptrend has lasted 17 hours 35 minutes, with a maximum recorded price increase of 18.09%. If price loses this support zone, the trend is highly likely to reverse downward.
78
·
--
Baissier
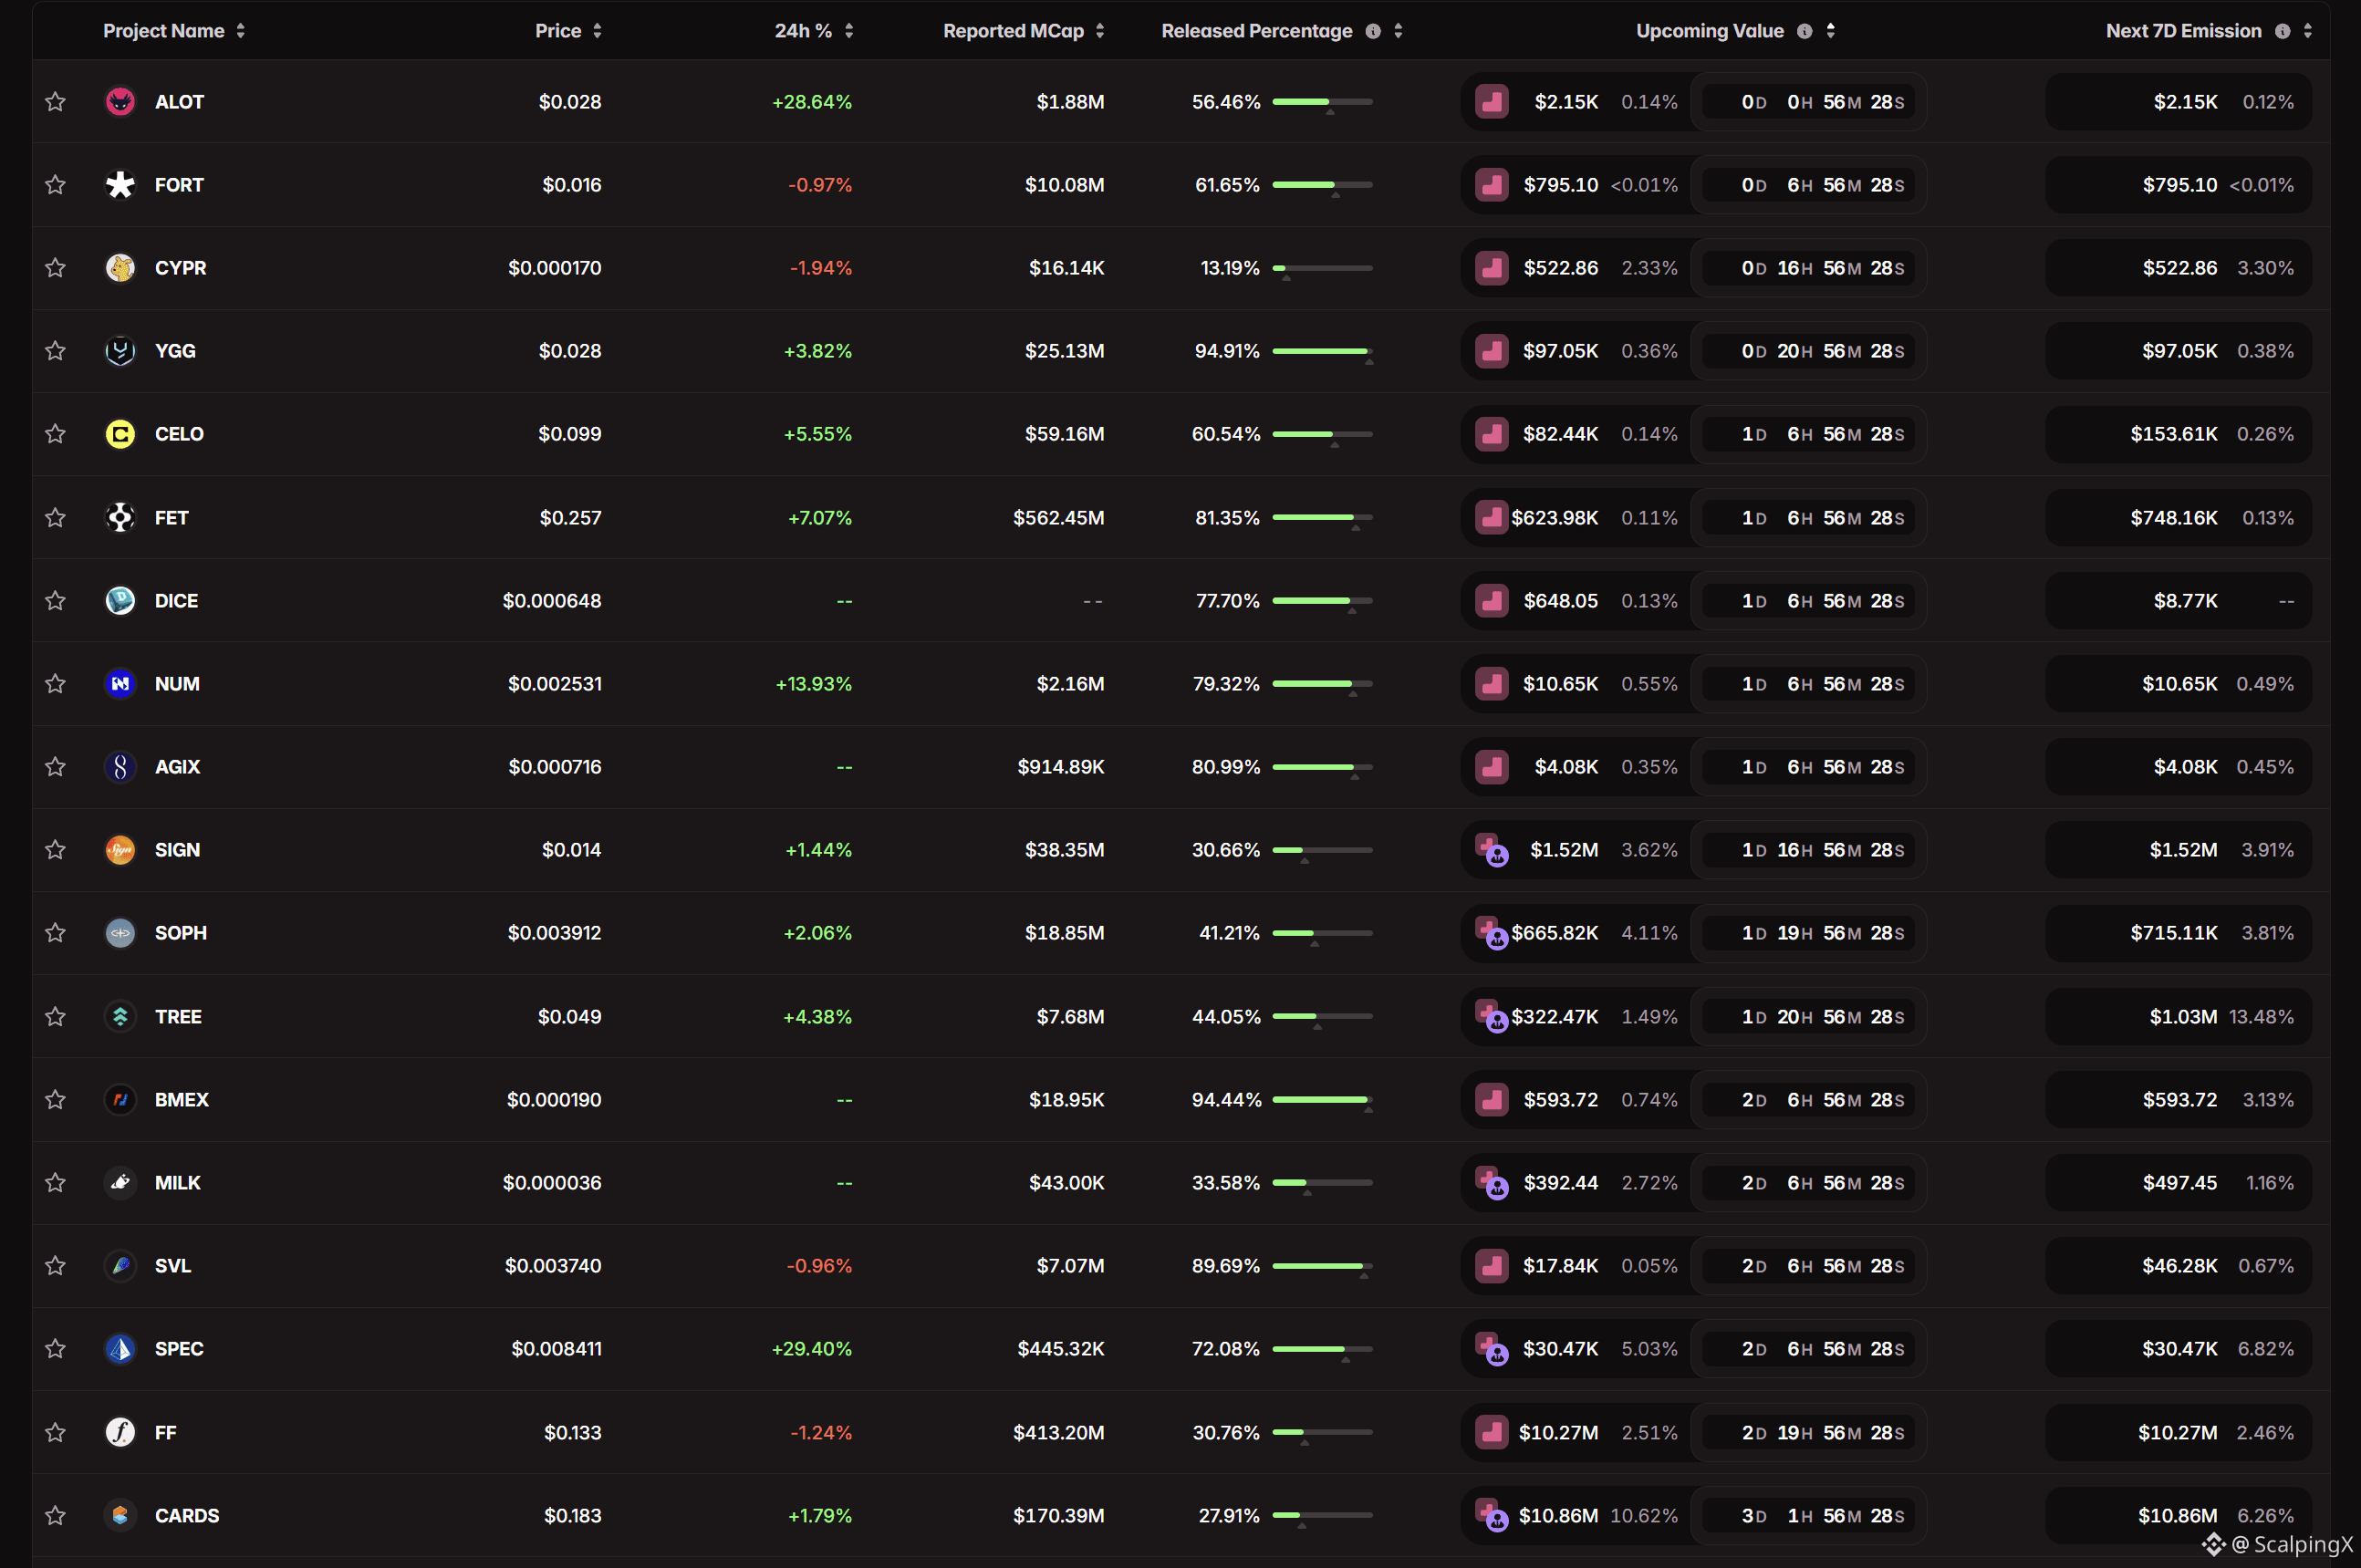
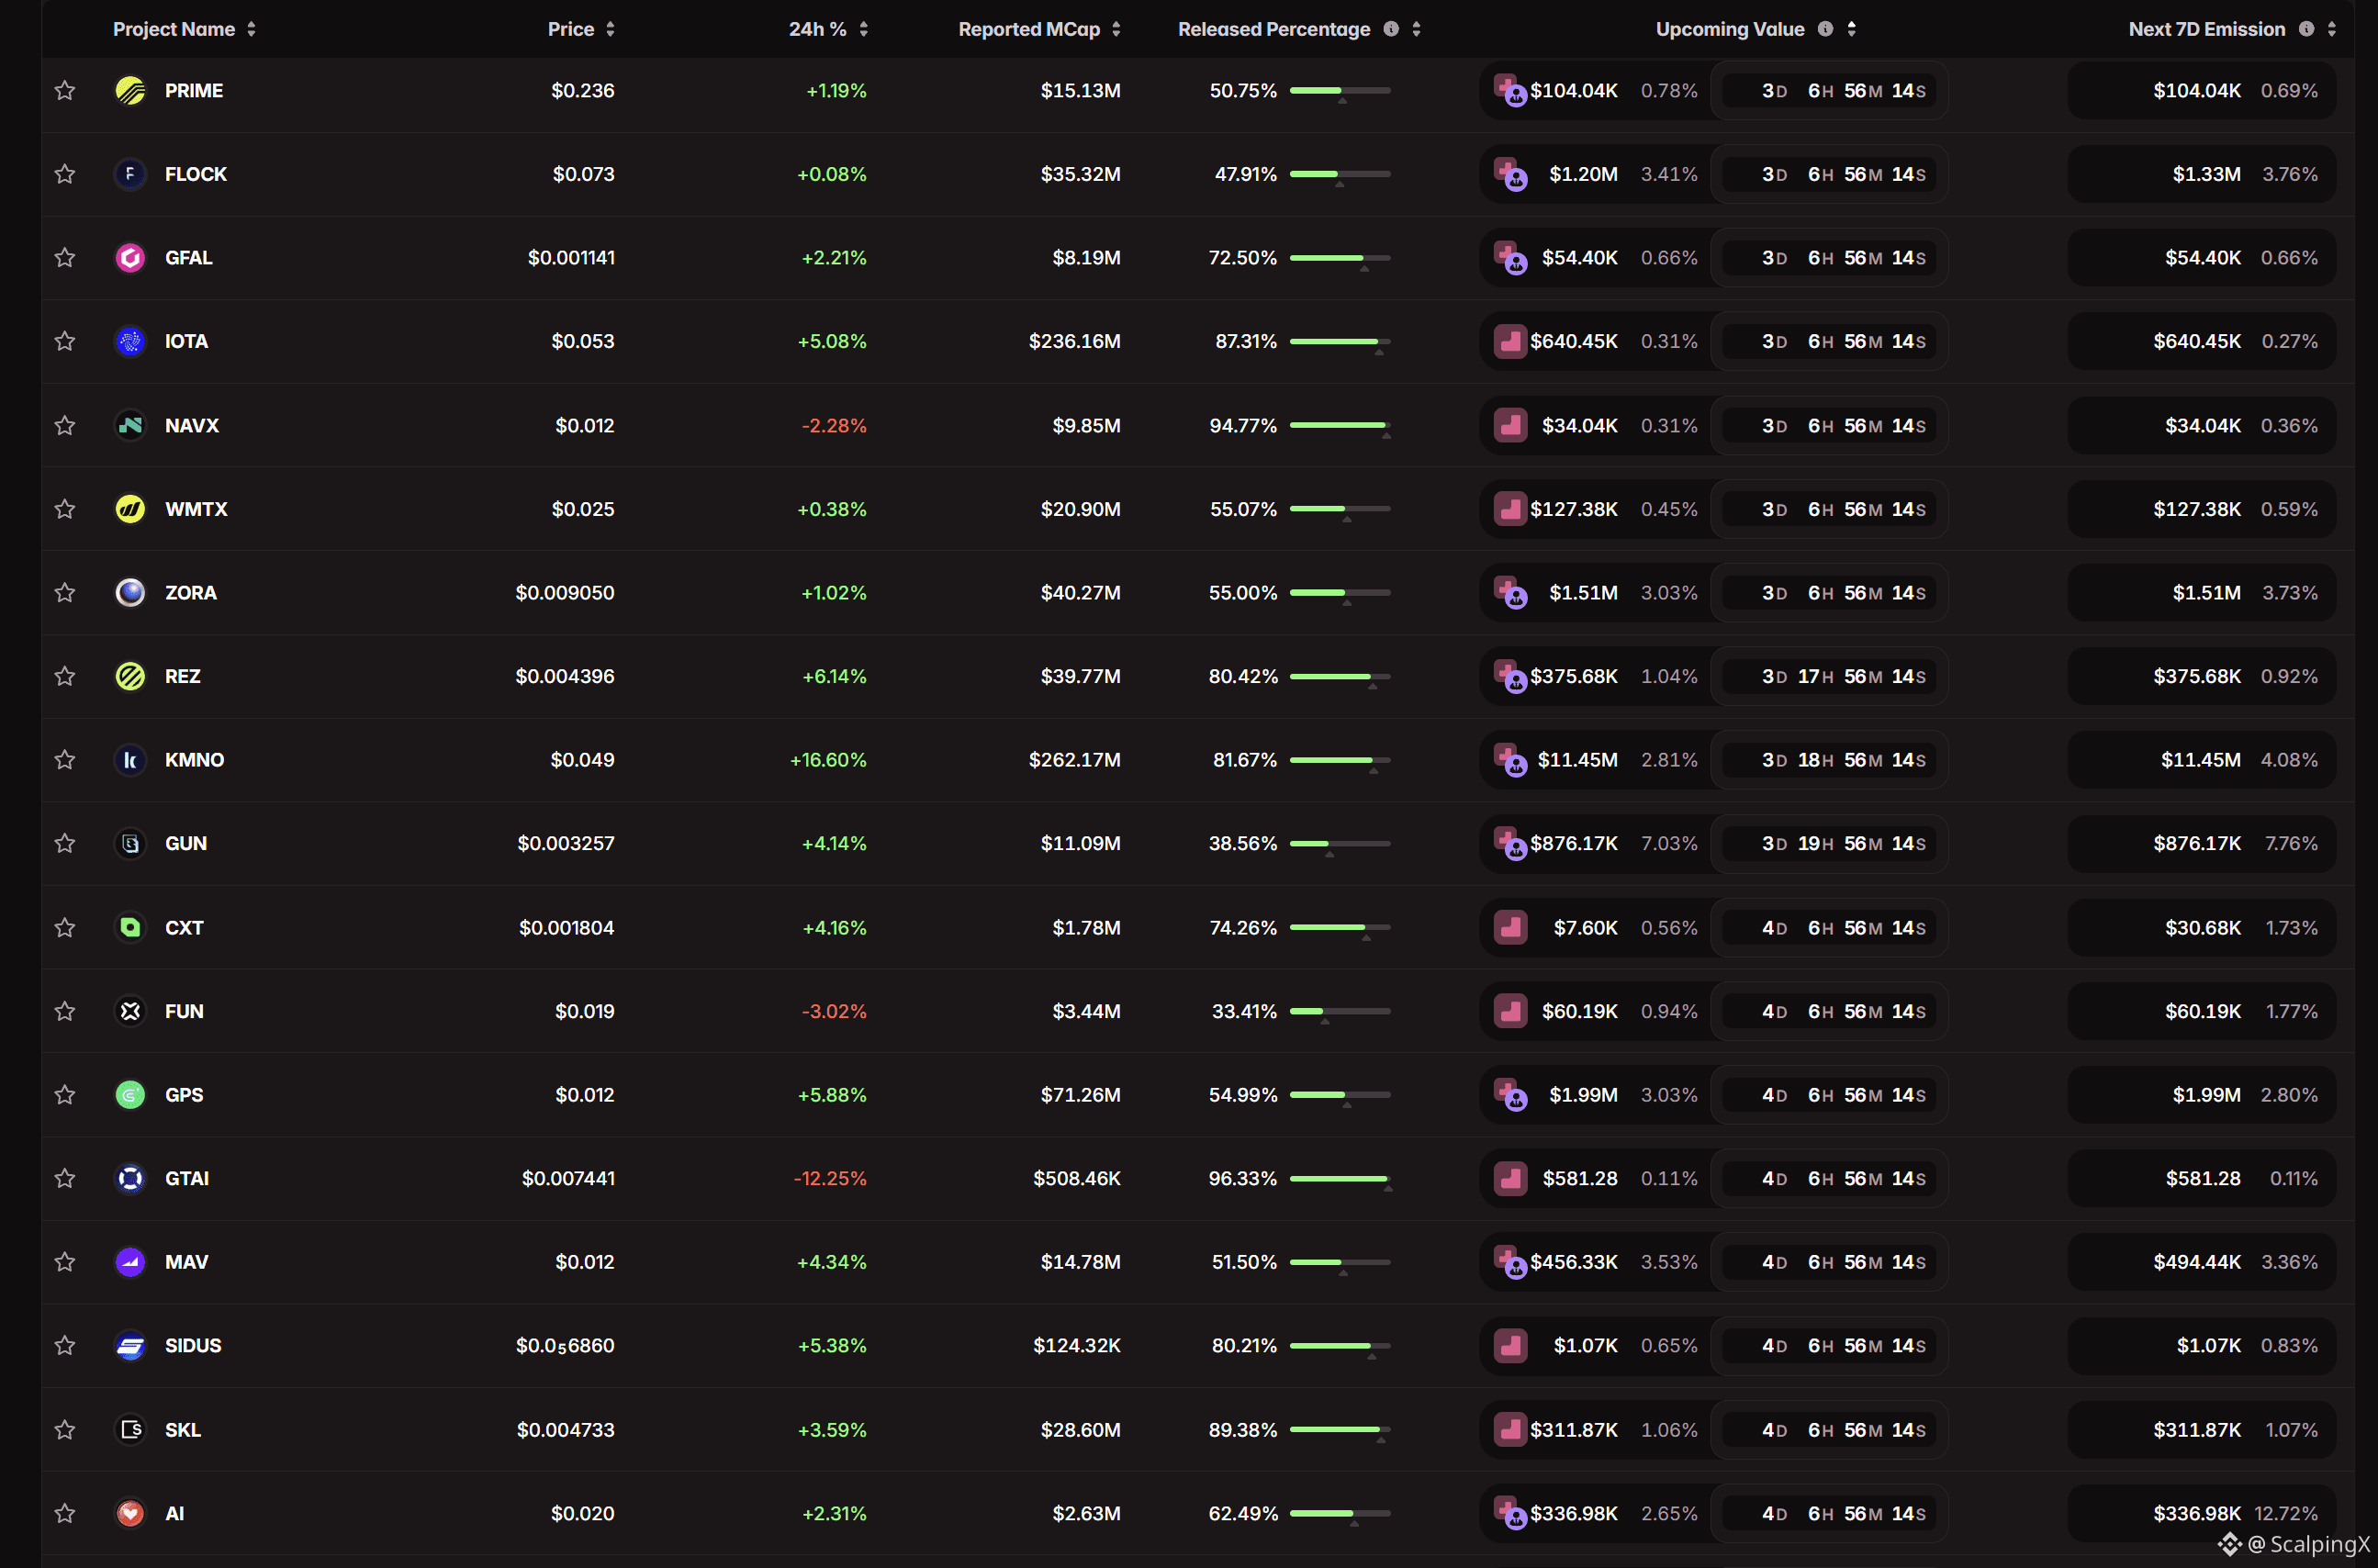
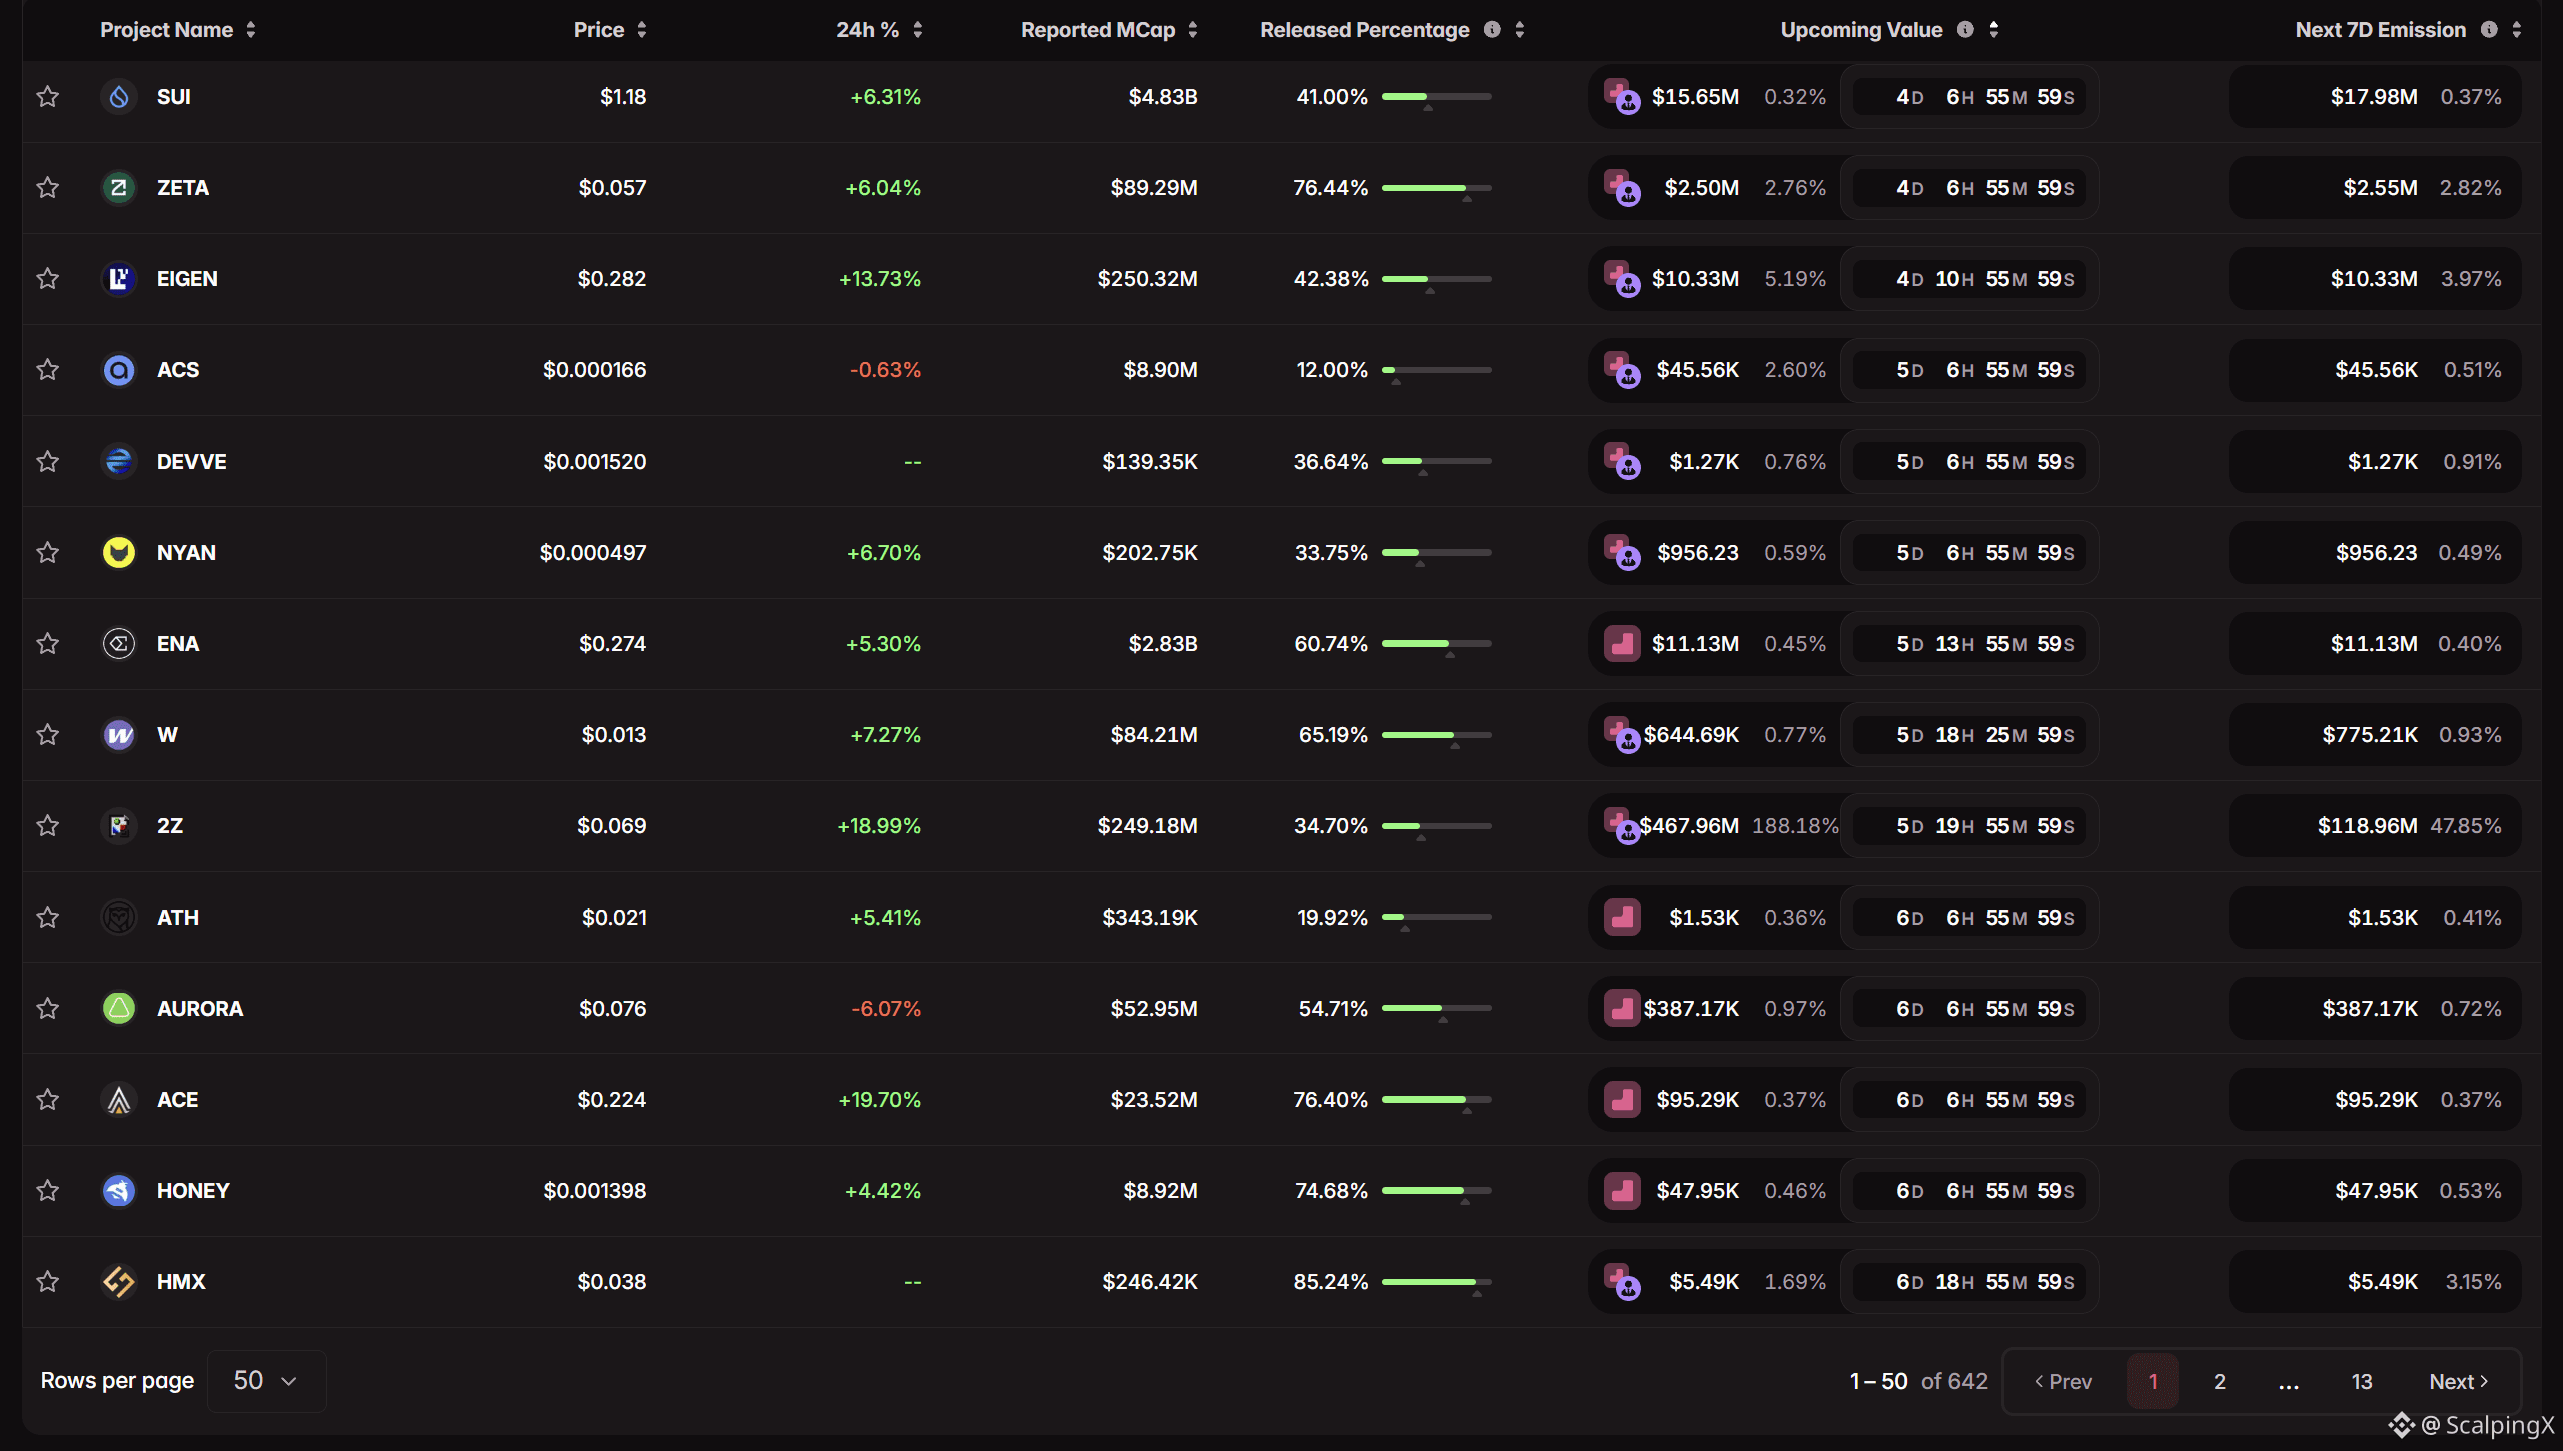
Calendrier de déblocage à venir pour 50 tokens. Personnellement, je ne considère les opportunités de trading Futures que lorsque l’événement correspond à un Cliff Unlock et que le volume débloqué dépasse 50 % du volume quotidien de trading. Si vous êtes davantage orienté investissement à long terme, toutefois, ces événements valent la peine d’être surveillés afin d’optimiser vos points d’entrée après chaque déblocage.
À l’heure actuelle, il y a 2 événements de déblocage à surveiller en raison de leur volume de déblocage élevé par rapport au volume quotidien de trading :
$FF - 158,00%
$2Z - 476,54%
#TokenUnlock
Calendrier de déblocage à venir pour 50 tokens. Personnellement, je ne considère les opportunités de trading Futures que lorsque l’événement correspond à un Cliff Unlock et que le volume débloqué dépasse 50 % du volume quotidien de trading. Si vous êtes davantage orienté investissement à long terme, toutefois, ces événements valent la peine d’être surveillés afin d’optimiser vos points d’entrée après chaque déblocage.
À l’heure actuelle, il y a 2 événements de déblocage à surveiller en raison de leur volume de déblocage élevé par rapport au volume quotidien de trading :
$FF - 158,00%
$2Z - 476,54%
#TokenUnlock
À l’heure actuelle, il y a 2 événements de déblocage à surveiller en raison de leur volume de déblocage élevé par rapport au volume quotidien de trading :
$FF - 158,00%
$2Z - 476,54%
#TokenUnlock
41
·
--
Haussier
Voir la traduction
Crypto week of Sep 21–25: ETFs pushed prices higher, short squeeze amplified the move, but BTC failed to hold the $87,400 area
📈 Bitcoin opened the week around $80,000–81,000, surged to roughly $87,300–87,400, then eased back toward $84,000 by the end of the week. The rally coincided with strong ETF inflows and heavy short liquidations, while several altcoins outperformed BTC.
💰 U.S. spot Bitcoin ETFs attracted about $2.4 billion across five sessions, including nearly 1 billion on Sep 21 alone. Importantly, flows remained positive in the final two sessions even as BTC moved away from its peak, suggesting the pullback was not accompanied by a clear reversal in ETF demand.
⚡ Around $635 million in short positions were liquidated within 24 hours on Sep 21, amplifying the upside move. Afterward, BTC open interest on Binance fell nearly 13% while price declined only modestly, indicating much of the squeeze-driven positioning had been cleared rather than immediately replaced by a new layer of leveraged longs.
🏦 On-chain data also showed roughly 29,800 BTC leaving exchanges over seven days. BTC falling from $87,400 toward $84,000 while exchange flows remained net negative suggests readily available sell-side supply on CEXs did not rise in proportion to the price decline.
🔄 Ethereum ETFs also recorded around $690 million in inflows over five sessions. ETH price performance lagged some altcoins, but improving ETF demand showed that institutional buying was not limited to Bitcoin.
📊 After the squeeze, funding on several exchanges moved back toward low or negative levels, while total stablecoin supply remained around $305–312 billion. The structure suggests underlying liquidity remains in the market, but a sustained break above $87,400 may require renewed spot demand rather than another short squeeze alone.
#CryptoInsights $BTC
Crypto week of Sep 21–25: ETFs pushed prices higher, short squeeze amplified the move, but BTC failed to hold the $87,400 area
📈 Bitcoin opened the week around $80,000–81,000, surged to roughly $87,300–87,400, then eased back toward $84,000 by the end of the week. The rally coincided with strong ETF inflows and heavy short liquidations, while several altcoins outperformed BTC.
💰 U.S. spot Bitcoin ETFs attracted about $2.4 billion across five sessions, including nearly 1 billion on Sep 21 alone. Importantly, flows remained positive in the final two sessions even as BTC moved away from its peak, suggesting the pullback was not accompanied by a clear reversal in ETF demand.
⚡ Around $635 million in short positions were liquidated within 24 hours on Sep 21, amplifying the upside move. Afterward, BTC open interest on Binance fell nearly 13% while price declined only modestly, indicating much of the squeeze-driven positioning had been cleared rather than immediately replaced by a new layer of leveraged longs.
🏦 On-chain data also showed roughly 29,800 BTC leaving exchanges over seven days. BTC falling from $87,400 toward $84,000 while exchange flows remained net negative suggests readily available sell-side supply on CEXs did not rise in proportion to the price decline.
🔄 Ethereum ETFs also recorded around $690 million in inflows over five sessions. ETH price performance lagged some altcoins, but improving ETF demand showed that institutional buying was not limited to Bitcoin.
📊 After the squeeze, funding on several exchanges moved back toward low or negative levels, while total stablecoin supply remained around $305–312 billion. The structure suggests underlying liquidity remains in the market, but a sustained break above $87,400 may require renewed spot demand rather than another short squeeze alone.
#CryptoInsights $BTC
📈 Bitcoin opened the week around $80,000–81,000, surged to roughly $87,300–87,400, then eased back toward $84,000 by the end of the week. The rally coincided with strong ETF inflows and heavy short liquidations, while several altcoins outperformed BTC.
💰 U.S. spot Bitcoin ETFs attracted about $2.4 billion across five sessions, including nearly 1 billion on Sep 21 alone. Importantly, flows remained positive in the final two sessions even as BTC moved away from its peak, suggesting the pullback was not accompanied by a clear reversal in ETF demand.
⚡ Around $635 million in short positions were liquidated within 24 hours on Sep 21, amplifying the upside move. Afterward, BTC open interest on Binance fell nearly 13% while price declined only modestly, indicating much of the squeeze-driven positioning had been cleared rather than immediately replaced by a new layer of leveraged longs.
🏦 On-chain data also showed roughly 29,800 BTC leaving exchanges over seven days. BTC falling from $87,400 toward $84,000 while exchange flows remained net negative suggests readily available sell-side supply on CEXs did not rise in proportion to the price decline.
🔄 Ethereum ETFs also recorded around $690 million in inflows over five sessions. ETH price performance lagged some altcoins, but improving ETF demand showed that institutional buying was not limited to Bitcoin.
📊 After the squeeze, funding on several exchanges moved back toward low or negative levels, while total stablecoin supply remained around $305–312 billion. The structure suggests underlying liquidity remains in the market, but a sustained break above $87,400 may require renewed spot demand rather than another short squeeze alone.
#CryptoInsights $BTC

1
35
·
--
Produits chimiques 21–25 sept. : les coûts des matières premières augmentent plus vite que les prix des produits finis
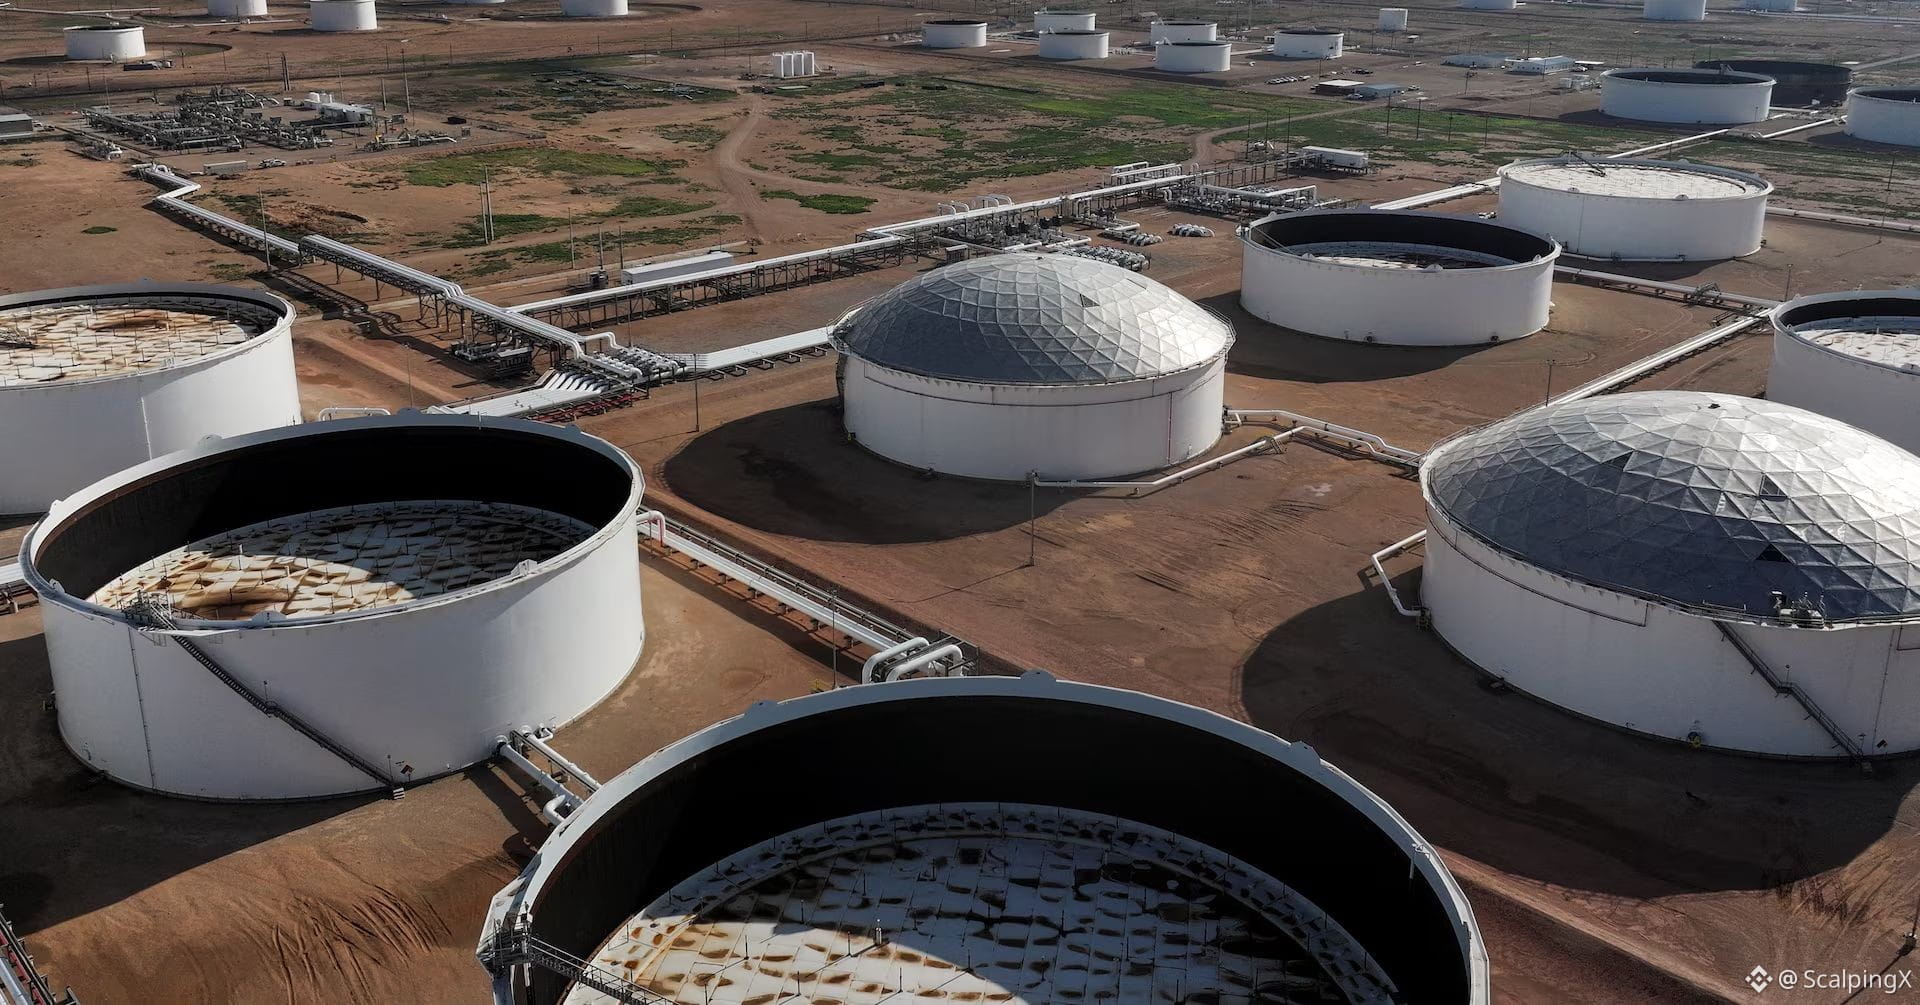
🛢 Le pétrole se maintient au-dessus de 100 USD/bbl et les coûts élevés de fret liés à l’Ormuz ont continué de faire monter les prix du naphta, du méthanol, du benzène et de l’éthylène. En Chine, à mi-mois, le méthanol a progressé de 9,4 %, le benzène de 6,5 % et l’acide acétique de 17,4 %, dépassant nettement de nombreux produits polymères.
📉 À l’inverse, les contrats à terme de PP et de LLDPE à Dalian ont baissé le 21 sept., la demande en aval restant trop faible pour absorber les coûts d’intrants plus élevés. Les marges du PE à base de pétrole ont été estimées à environ −335 yuans/t, tandis que le PE à base de charbon générait encore environ +1 501 yuans/t, soulignant l’élargissement de l’écart entre les filières de matières premières.
🏭 L’offre asiatique d’éthylène est restée relativement tendue en raison des arrêts de maintenance et de la réduction des cargaisons en provenance du Moyen-Orient, mais le propylène et le PP se sont affaiblis car la demande a accusé du retard. Les économies de MTO/MTP se sont également dégradées : le méthanol a augmenté plus vite que les prix de production d’oléfines, poussant certains producteurs à réduire leurs taux d’exploitation ou à fermer des unités.
🌾 L’urée chinoise a suivi un schéma similaire. Les coûts de production à base de charbon ont augmenté d’environ 10 %, tandis que les prix de l’urée n’ont progressé que d’environ 1 %, ce qui a fait baisser les marges théoriques à environ 24 yuans/t. Cela indique que les hausses des coûts d’intrants ne sont pas encore pleinement répercutées.
🇪🇺 En Europe, l’arrêt temporaire par Ineos de trois usines de Hull, combiné à des taux d’exploitation chimiques de l’UE proches de 75 %, continue de refléter une pression structurelle liée à l’essence coûteuse (gaz), à l’électricité et aux intrants. Des niveaux bas de l’eau du Rhin et l’enquête antidumping de l’UE sur le PVC augmentent encore les risques logistiques et commerciaux.
🔎 À l’avenir, la Golden Week chinoise, les prix du pétrole et le fret lié à l’Ormuz seront des variables clés. Si les coûts énergétiques restent élevés, les marges du PP/PE et de l’urée pourraient rester comprimées, même si les matières premières chimiques de base demeurent fermes.
#Chemicals $NVDAB
Produits chimiques 21–25 sept. : les coûts des matières premières augmentent plus vite que les prix des produits finis
🛢 Le pétrole se maintient au-dessus de 100 USD/bbl et les coûts élevés de fret liés à l’Ormuz ont continué de faire monter les prix du naphta, du méthanol, du benzène et de l’éthylène. En Chine, à mi-mois, le méthanol a progressé de 9,4 %, le benzène de 6,5 % et l’acide acétique de 17,4 %, dépassant nettement de nombreux produits polymères.
📉 À l’inverse, les contrats à terme de PP et de LLDPE à Dalian ont baissé le 21 sept., la demande en aval restant trop faible pour absorber les coûts d’intrants plus élevés. Les marges du PE à base de pétrole ont été estimées à environ −335 yuans/t, tandis que le PE à base de charbon générait encore environ +1 501 yuans/t, soulignant l’élargissement de l’écart entre les filières de matières premières.
🏭 L’offre asiatique d’éthylène est restée relativement tendue en raison des arrêts de maintenance et de la réduction des cargaisons en provenance du Moyen-Orient, mais le propylène et le PP se sont affaiblis car la demande a accusé du retard. Les économies de MTO/MTP se sont également dégradées : le méthanol a augmenté plus vite que les prix de production d’oléfines, poussant certains producteurs à réduire leurs taux d’exploitation ou à fermer des unités.
🌾 L’urée chinoise a suivi un schéma similaire. Les coûts de production à base de charbon ont augmenté d’environ 10 %, tandis que les prix de l’urée n’ont progressé que d’environ 1 %, ce qui a fait baisser les marges théoriques à environ 24 yuans/t. Cela indique que les hausses des coûts d’intrants ne sont pas encore pleinement répercutées.
🇪🇺 En Europe, l’arrêt temporaire par Ineos de trois usines de Hull, combiné à des taux d’exploitation chimiques de l’UE proches de 75 %, continue de refléter une pression structurelle liée à l’essence coûteuse (gaz), à l’électricité et aux intrants. Des niveaux bas de l’eau du Rhin et l’enquête antidumping de l’UE sur le PVC augmentent encore les risques logistiques et commerciaux.
🔎 À l’avenir, la Golden Week chinoise, les prix du pétrole et le fret lié à l’Ormuz seront des variables clés. Si les coûts énergétiques restent élevés, les marges du PP/PE et de l’urée pourraient rester comprimées, même si les matières premières chimiques de base demeurent fermes.
#Chemicals $NVDAB
🛢 Le pétrole se maintient au-dessus de 100 USD/bbl et les coûts élevés de fret liés à l’Ormuz ont continué de faire monter les prix du naphta, du méthanol, du benzène et de l’éthylène. En Chine, à mi-mois, le méthanol a progressé de 9,4 %, le benzène de 6,5 % et l’acide acétique de 17,4 %, dépassant nettement de nombreux produits polymères.
📉 À l’inverse, les contrats à terme de PP et de LLDPE à Dalian ont baissé le 21 sept., la demande en aval restant trop faible pour absorber les coûts d’intrants plus élevés. Les marges du PE à base de pétrole ont été estimées à environ −335 yuans/t, tandis que le PE à base de charbon générait encore environ +1 501 yuans/t, soulignant l’élargissement de l’écart entre les filières de matières premières.
🏭 L’offre asiatique d’éthylène est restée relativement tendue en raison des arrêts de maintenance et de la réduction des cargaisons en provenance du Moyen-Orient, mais le propylène et le PP se sont affaiblis car la demande a accusé du retard. Les économies de MTO/MTP se sont également dégradées : le méthanol a augmenté plus vite que les prix de production d’oléfines, poussant certains producteurs à réduire leurs taux d’exploitation ou à fermer des unités.
🌾 L’urée chinoise a suivi un schéma similaire. Les coûts de production à base de charbon ont augmenté d’environ 10 %, tandis que les prix de l’urée n’ont progressé que d’environ 1 %, ce qui a fait baisser les marges théoriques à environ 24 yuans/t. Cela indique que les hausses des coûts d’intrants ne sont pas encore pleinement répercutées.
🇪🇺 En Europe, l’arrêt temporaire par Ineos de trois usines de Hull, combiné à des taux d’exploitation chimiques de l’UE proches de 75 %, continue de refléter une pression structurelle liée à l’essence coûteuse (gaz), à l’électricité et aux intrants. Des niveaux bas de l’eau du Rhin et l’enquête antidumping de l’UE sur le PVC augmentent encore les risques logistiques et commerciaux.
🔎 À l’avenir, la Golden Week chinoise, les prix du pétrole et le fret lié à l’Ormuz seront des variables clés. Si les coûts énergétiques restent élevés, les marges du PP/PE et de l’urée pourraient rester comprimées, même si les matières premières chimiques de base demeurent fermes.
#Chemicals $NVDAB
25
·
--
Voir la traduction
Paper oil cools, but diesel and logistics keep the physical market tight
🛢 Brent ended the week near $104.32/bbl while WTI fell to $92.41, widening the Brent–WTI spread to almost $12/bbl, its widest since May. The divergence shows US crude is facing its own pressure from inventories and diesel export risks, while international barrels still command a higher physical premium.
🤝 US–Iran talks in New York helped remove part of the Hormuz risk premium, but physical flows have not materially improved. Kpler estimated oil movements through the strait at around 33.7 million barrels for the week beginning Sep. 20, broadly unchanged from the previous week.
📉 At the same time, the IEA estimates observed global oil inventories have fallen by roughly 507 million barrels since the conflict began. In the US, distillate stocks stand at just 107.4 million barrels, around 12% below the five-year average, even as commercial crude inventories rose by 3 million barrels.
⛽ The strongest pressure remains in refined products. Southern European diesel cracks moved above $100/bbl, while reports that Washington is considering a 90-day diesel export ban sharply weakened US diesel cracks. If implemented, the policy could ease domestic US supply while tightening Europe further.
🚢 Logistics also remain constrained. Gulf-to-Asia VLCC rates briefly reached around $1.27 million per day, while ship-to-ship transfer capacity off Oman has been heavily utilized. That suggests even a smoother Hormuz transit would not immediately remove the physical bottleneck.
📌 The week therefore cannot be read simply as oil falling on diplomacy. WTI is reflecting US crude availability and domestic diesel risks, while Brent remains supported by falling global inventories, tight refined-product supply and elevated logistics costs.
#EnergyMarkets $CL $NATGAS
Paper oil cools, but diesel and logistics keep the physical market tight
🛢 Brent ended the week near $104.32/bbl while WTI fell to $92.41, widening the Brent–WTI spread to almost $12/bbl, its widest since May. The divergence shows US crude is facing its own pressure from inventories and diesel export risks, while international barrels still command a higher physical premium.
🤝 US–Iran talks in New York helped remove part of the Hormuz risk premium, but physical flows have not materially improved. Kpler estimated oil movements through the strait at around 33.7 million barrels for the week beginning Sep. 20, broadly unchanged from the previous week.
📉 At the same time, the IEA estimates observed global oil inventories have fallen by roughly 507 million barrels since the conflict began. In the US, distillate stocks stand at just 107.4 million barrels, around 12% below the five-year average, even as commercial crude inventories rose by 3 million barrels.
⛽ The strongest pressure remains in refined products. Southern European diesel cracks moved above $100/bbl, while reports that Washington is considering a 90-day diesel export ban sharply weakened US diesel cracks. If implemented, the policy could ease domestic US supply while tightening Europe further.
🚢 Logistics also remain constrained. Gulf-to-Asia VLCC rates briefly reached around $1.27 million per day, while ship-to-ship transfer capacity off Oman has been heavily utilized. That suggests even a smoother Hormuz transit would not immediately remove the physical bottleneck.
📌 The week therefore cannot be read simply as oil falling on diplomacy. WTI is reflecting US crude availability and domestic diesel risks, while Brent remains supported by falling global inventories, tight refined-product supply and elevated logistics costs.
#EnergyMarkets $CL $NATGAS
🛢 Brent ended the week near $104.32/bbl while WTI fell to $92.41, widening the Brent–WTI spread to almost $12/bbl, its widest since May. The divergence shows US crude is facing its own pressure from inventories and diesel export risks, while international barrels still command a higher physical premium.
🤝 US–Iran talks in New York helped remove part of the Hormuz risk premium, but physical flows have not materially improved. Kpler estimated oil movements through the strait at around 33.7 million barrels for the week beginning Sep. 20, broadly unchanged from the previous week.
📉 At the same time, the IEA estimates observed global oil inventories have fallen by roughly 507 million barrels since the conflict began. In the US, distillate stocks stand at just 107.4 million barrels, around 12% below the five-year average, even as commercial crude inventories rose by 3 million barrels.
⛽ The strongest pressure remains in refined products. Southern European diesel cracks moved above $100/bbl, while reports that Washington is considering a 90-day diesel export ban sharply weakened US diesel cracks. If implemented, the policy could ease domestic US supply while tightening Europe further.
🚢 Logistics also remain constrained. Gulf-to-Asia VLCC rates briefly reached around $1.27 million per day, while ship-to-ship transfer capacity off Oman has been heavily utilized. That suggests even a smoother Hormuz transit would not immediately remove the physical bottleneck.
📌 The week therefore cannot be read simply as oil falling on diplomacy. WTI is reflecting US crude availability and domestic diesel risks, while Brent remains supported by falling global inventories, tight refined-product supply and elevated logistics costs.
#EnergyMarkets $CL $NATGAS

129
·
--
Voir la traduction
Agricultural commodities diverge as soybeans gain on China expectations while wheat faces supply pressure
🌱 U.S. soybeans were a key outperformer during September 21–25, with November futures closing near 13.19 USD/bu, up 15.5 cents for the week. Support came mainly from expectations of stronger Chinese purchases following fresh trade signals, although the roughly 17 billion USD agricultural commitment still lacks a detailed product breakdown or shipment schedule.
📊 Positioning shows that speculators have already leaned heavily into this theme. Managed money holds a net long of around 281,000 soybean contracts, the highest level in 52 weeks, increasing the potential for a sharp reaction if upcoming purchase details differ from expectations.
🌾 Wheat moved in the opposite direction. SRW fell about 11 cents for the week, HRW lost more than 21 cents, and spring wheat declined nearly 28 cents. Russian and Ukrainian exports remain well below year-ago levels, but Russian grain is still reaching the market through Baltic routes, limiting the premium for a severe supply disruption.
🌽 Corn finished nearly flat as supportive and bearish factors offset each other. USDA has reduced its U.S. production outlook on weaker yields, while harvest progress remains ahead of average and Argentine supply continues moving into export channels.
☕ In soft commodities, Arabica remained under pressure as Brazil’s weather outlook improved and ICE inventories recovered from multi-year lows. Cocoa gained around 5.5% for the week, although the 2025/26 supply outlook still points toward a surplus, making the move look more like a recovery than a renewed shortage cycle.
🔎 Next week, attention turns to details on Chinese agricultural purchases and the USDA Grain Stocks report, which could determine whether the current soybean premium has enough fundamental support to persist.
#Commodities $SUSHI
Agricultural commodities diverge as soybeans gain on China expectations while wheat faces supply pressure
🌱 U.S. soybeans were a key outperformer during September 21–25, with November futures closing near 13.19 USD/bu, up 15.5 cents for the week. Support came mainly from expectations of stronger Chinese purchases following fresh trade signals, although the roughly 17 billion USD agricultural commitment still lacks a detailed product breakdown or shipment schedule.
📊 Positioning shows that speculators have already leaned heavily into this theme. Managed money holds a net long of around 281,000 soybean contracts, the highest level in 52 weeks, increasing the potential for a sharp reaction if upcoming purchase details differ from expectations.
🌾 Wheat moved in the opposite direction. SRW fell about 11 cents for the week, HRW lost more than 21 cents, and spring wheat declined nearly 28 cents. Russian and Ukrainian exports remain well below year-ago levels, but Russian grain is still reaching the market through Baltic routes, limiting the premium for a severe supply disruption.
🌽 Corn finished nearly flat as supportive and bearish factors offset each other. USDA has reduced its U.S. production outlook on weaker yields, while harvest progress remains ahead of average and Argentine supply continues moving into export channels.
☕ In soft commodities, Arabica remained under pressure as Brazil’s weather outlook improved and ICE inventories recovered from multi-year lows. Cocoa gained around 5.5% for the week, although the 2025/26 supply outlook still points toward a surplus, making the move look more like a recovery than a renewed shortage cycle.
🔎 Next week, attention turns to details on Chinese agricultural purchases and the USDA Grain Stocks report, which could determine whether the current soybean premium has enough fundamental support to persist.
#Commodities $SUSHI
🌱 U.S. soybeans were a key outperformer during September 21–25, with November futures closing near 13.19 USD/bu, up 15.5 cents for the week. Support came mainly from expectations of stronger Chinese purchases following fresh trade signals, although the roughly 17 billion USD agricultural commitment still lacks a detailed product breakdown or shipment schedule.
📊 Positioning shows that speculators have already leaned heavily into this theme. Managed money holds a net long of around 281,000 soybean contracts, the highest level in 52 weeks, increasing the potential for a sharp reaction if upcoming purchase details differ from expectations.
🌾 Wheat moved in the opposite direction. SRW fell about 11 cents for the week, HRW lost more than 21 cents, and spring wheat declined nearly 28 cents. Russian and Ukrainian exports remain well below year-ago levels, but Russian grain is still reaching the market through Baltic routes, limiting the premium for a severe supply disruption.
🌽 Corn finished nearly flat as supportive and bearish factors offset each other. USDA has reduced its U.S. production outlook on weaker yields, while harvest progress remains ahead of average and Argentine supply continues moving into export channels.
☕ In soft commodities, Arabica remained under pressure as Brazil’s weather outlook improved and ICE inventories recovered from multi-year lows. Cocoa gained around 5.5% for the week, although the 2025/26 supply outlook still points toward a surplus, making the move look more like a recovery than a renewed shortage cycle.
🔎 Next week, attention turns to details on Chinese agricultural purchases and the USDA Grain Stocks report, which could determine whether the current soybean premium has enough fundamental support to persist.
#Commodities $SUSHI

179
·
--
Haussier
Les actions mondiales progressent, mais la dynamique du marché reste limitée
📈 Les actions américaines ont terminé la semaine du 21 au 25 septembre sur une note positive : le S&P 500 a gagné environ 1,2 %, le Nasdaq a progressé de plus de 2 %, et le Dow n’a grimpé que d’environ 0,3 %. La technologie et les valeurs liées à l’IA sont restées les principaux moteurs, permettant aux indices des grandes capitalisations d’avancer malgré une pression persistante due à des rendements élevés.
📊 Le rendement des bons du Trésor américain à 10 ans a brièvement dépassé 5,2 %, tandis que le pétrole est resté proche de ses plus hauts niveaux avant de s’assouplir vers la fin de la semaine. Le repli, vendredi, des rendements et des prix de l’énergie a réduit la pression sur les actions, mais n’a pas suffi à déclencher une prise de risque généralisée.
🔍 La dynamique du marché reste un point clé à surveiller. Le Nasdaq et le S&P 500 ont avancé, tandis que les petites capitalisations, la value, les utilities et plusieurs secteurs hors technologie ont accusé du retard. Le capital continue donc de se concentrer sur les valeurs de méga-capitalisation et l’infrastructure liée à l’IA plutôt que de se répartir uniformément à travers l’ensemble du marché.
🌍 L’Europe a rebondi modestement après trois semaines de baisses, tandis que le Japon a été soutenu par les valeurs technologiques et par un yen plus faible. Hong Kong et plusieurs marchés émergents ont été moins bien orientés, soulignant la persistance de divergences régionales.
📌 Les données américaines sur le PCE du 30 septembre seront l’un des principaux catalyseurs la semaine prochaine. Une inflation plus faible pourrait alléger la pression liée aux rendements, tandis que des taux durablement élevés continueraient de mettre à l’épreuve les valorisations des valeurs de croissance.
#MarketInsights $NVDAB $AAPLB $GOOGL.US
Les actions mondiales progressent, mais la dynamique du marché reste limitée
📈 Les actions américaines ont terminé la semaine du 21 au 25 septembre sur une note positive : le S&P 500 a gagné environ 1,2 %, le Nasdaq a progressé de plus de 2 %, et le Dow n’a grimpé que d’environ 0,3 %. La technologie et les valeurs liées à l’IA sont restées les principaux moteurs, permettant aux indices des grandes capitalisations d’avancer malgré une pression persistante due à des rendements élevés.
📊 Le rendement des bons du Trésor américain à 10 ans a brièvement dépassé 5,2 %, tandis que le pétrole est resté proche de ses plus hauts niveaux avant de s’assouplir vers la fin de la semaine. Le repli, vendredi, des rendements et des prix de l’énergie a réduit la pression sur les actions, mais n’a pas suffi à déclencher une prise de risque généralisée.
🔍 La dynamique du marché reste un point clé à surveiller. Le Nasdaq et le S&P 500 ont avancé, tandis que les petites capitalisations, la value, les utilities et plusieurs secteurs hors technologie ont accusé du retard. Le capital continue donc de se concentrer sur les valeurs de méga-capitalisation et l’infrastructure liée à l’IA plutôt que de se répartir uniformément à travers l’ensemble du marché.
🌍 L’Europe a rebondi modestement après trois semaines de baisses, tandis que le Japon a été soutenu par les valeurs technologiques et par un yen plus faible. Hong Kong et plusieurs marchés émergents ont été moins bien orientés, soulignant la persistance de divergences régionales.
📌 Les données américaines sur le PCE du 30 septembre seront l’un des principaux catalyseurs la semaine prochaine. Une inflation plus faible pourrait alléger la pression liée aux rendements, tandis que des taux durablement élevés continueraient de mettre à l’épreuve les valorisations des valeurs de croissance.
#MarketInsights $NVDAB $AAPLB $GOOGL.US
📈 Les actions américaines ont terminé la semaine du 21 au 25 septembre sur une note positive : le S&P 500 a gagné environ 1,2 %, le Nasdaq a progressé de plus de 2 %, et le Dow n’a grimpé que d’environ 0,3 %. La technologie et les valeurs liées à l’IA sont restées les principaux moteurs, permettant aux indices des grandes capitalisations d’avancer malgré une pression persistante due à des rendements élevés.
📊 Le rendement des bons du Trésor américain à 10 ans a brièvement dépassé 5,2 %, tandis que le pétrole est resté proche de ses plus hauts niveaux avant de s’assouplir vers la fin de la semaine. Le repli, vendredi, des rendements et des prix de l’énergie a réduit la pression sur les actions, mais n’a pas suffi à déclencher une prise de risque généralisée.
🔍 La dynamique du marché reste un point clé à surveiller. Le Nasdaq et le S&P 500 ont avancé, tandis que les petites capitalisations, la value, les utilities et plusieurs secteurs hors technologie ont accusé du retard. Le capital continue donc de se concentrer sur les valeurs de méga-capitalisation et l’infrastructure liée à l’IA plutôt que de se répartir uniformément à travers l’ensemble du marché.
🌍 L’Europe a rebondi modestement après trois semaines de baisses, tandis que le Japon a été soutenu par les valeurs technologiques et par un yen plus faible. Hong Kong et plusieurs marchés émergents ont été moins bien orientés, soulignant la persistance de divergences régionales.
📌 Les données américaines sur le PCE du 30 septembre seront l’un des principaux catalyseurs la semaine prochaine. Une inflation plus faible pourrait alléger la pression liée aux rendements, tandis que des taux durablement élevés continueraient de mettre à l’épreuve les valorisations des valeurs de croissance.
#MarketInsights $NVDAB $AAPLB $GOOGL.US
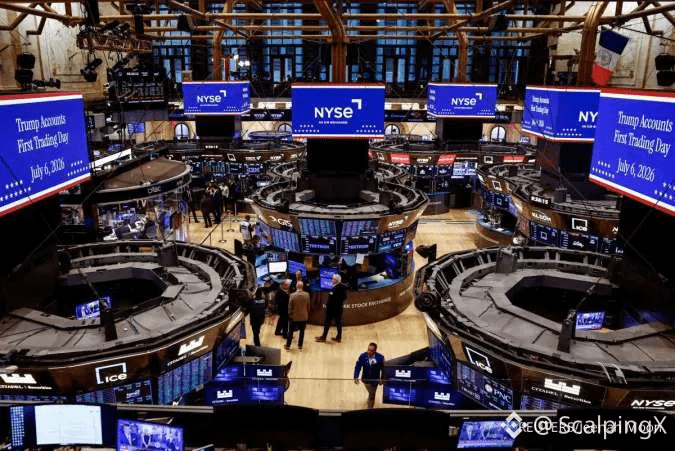
32
·
--
Haussier
Voir la traduction
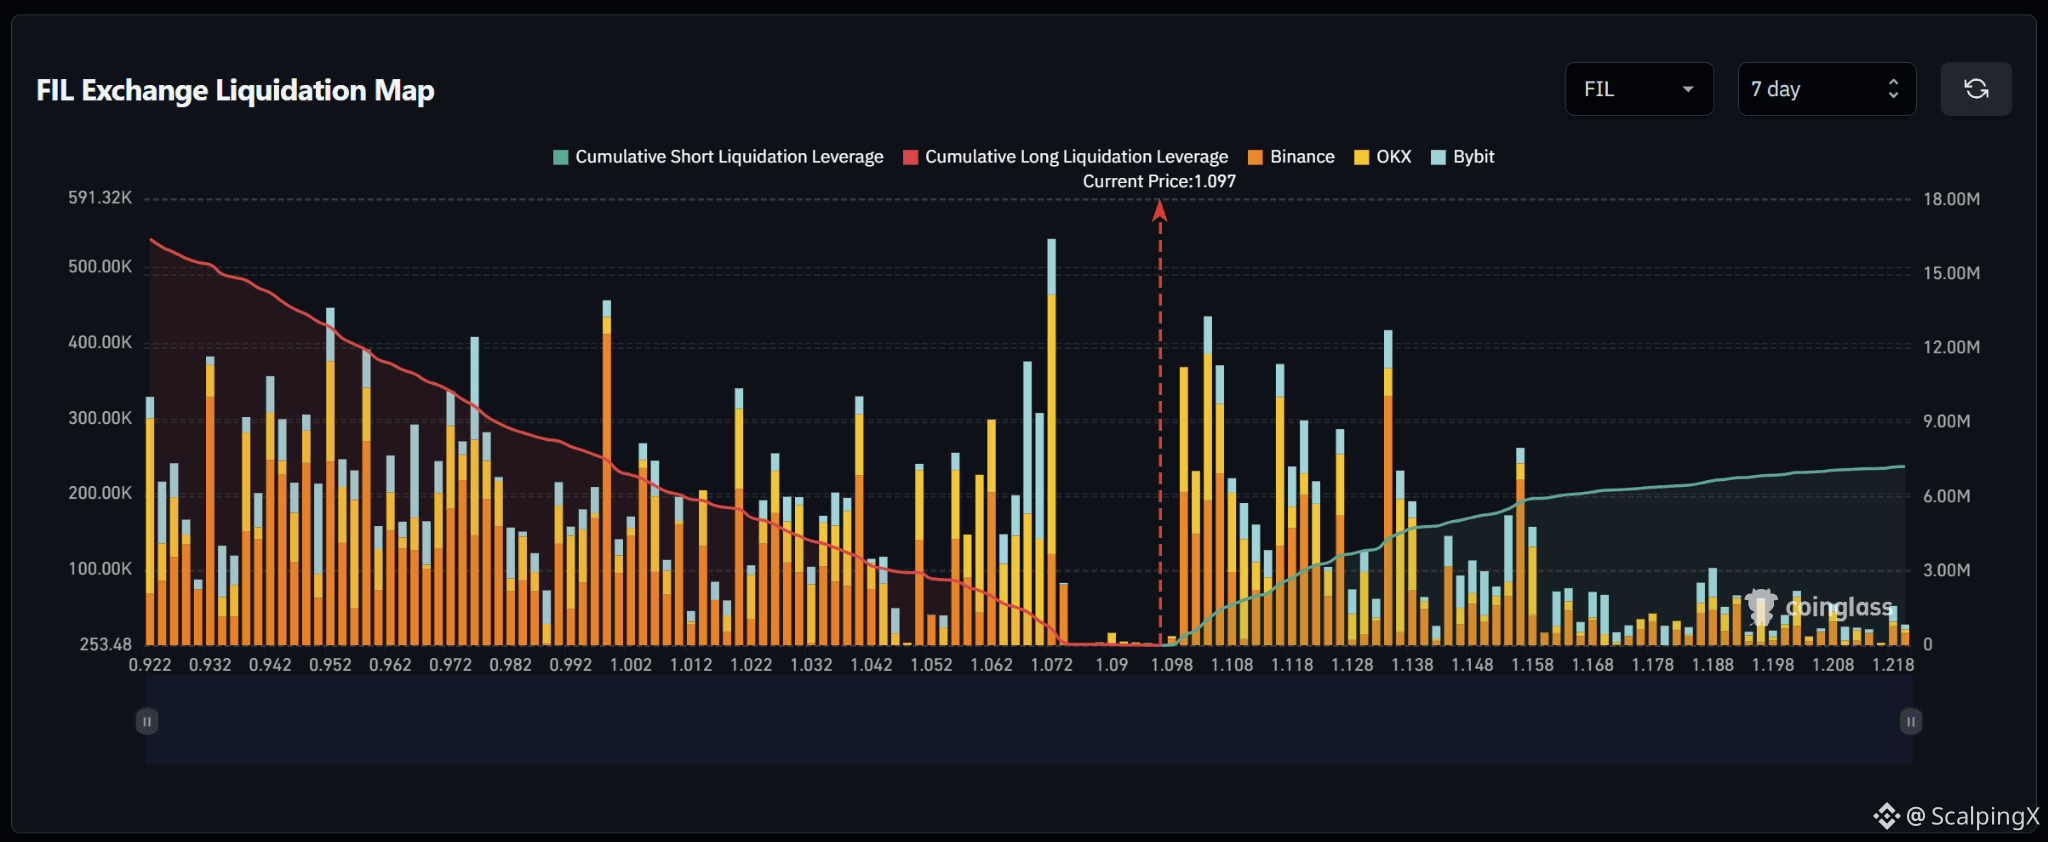
$FIL – Liquidation Map (7 Days) – Current Price 1.097
🔎 The 7-day liquidation map shows roughly 16–17 million USD in long liquidations below the current price, significantly exceeding approximately 7 million USD in short liquidations above. The liquidity structure therefore clearly favors the downside, with around 2.3 times more cumulative liquidity below the market.
📉 Below the market, long-liquidation liquidity is broadly distributed but concentrated most heavily across 0.95–1.07. The strongest cluster sits around 1.071–1.073 with a bar above 0.5 million USD, while 0.995–0.998 and 0.950–0.953 also contain bars around 0.44–0.45 million USD. Losing 1.09 would shift attention toward 1.072–1.062 and then 1.042–1.022.
📈 Above the market, short-liquidation liquidity is concentrated mainly across 1.10–1.14. Notable clusters appear around 1.103–1.106 with a bar near 0.43 million USD, 1.116–1.119 near 0.37 million USD, and 1.132–1.135 around 0.42 million USD. Further out, 1.155–1.158 still holds another notable pocket.
🧭 The broader setup favors the downside because long-liquidation exposure below clearly dominates. Losing 1.09 would increase the probability of a sweep toward 1.072–1.062, followed by 1.042–1.022. Breaking above 1.105 would instead expose 1.118 and then 1.132–1.135.
$FIL – Liquidation Map (7 Days) – Current Price 1.097
🔎 The 7-day liquidation map shows roughly 16–17 million USD in long liquidations below the current price, significantly exceeding approximately 7 million USD in short liquidations above. The liquidity structure therefore clearly favors the downside, with around 2.3 times more cumulative liquidity below the market.
📉 Below the market, long-liquidation liquidity is broadly distributed but concentrated most heavily across 0.95–1.07. The strongest cluster sits around 1.071–1.073 with a bar above 0.5 million USD, while 0.995–0.998 and 0.950–0.953 also contain bars around 0.44–0.45 million USD. Losing 1.09 would shift attention toward 1.072–1.062 and then 1.042–1.022.
📈 Above the market, short-liquidation liquidity is concentrated mainly across 1.10–1.14. Notable clusters appear around 1.103–1.106 with a bar near 0.43 million USD, 1.116–1.119 near 0.37 million USD, and 1.132–1.135 around 0.42 million USD. Further out, 1.155–1.158 still holds another notable pocket.
🧭 The broader setup favors the downside because long-liquidation exposure below clearly dominates. Losing 1.09 would increase the probability of a sweep toward 1.072–1.062, followed by 1.042–1.022. Breaking above 1.105 would instead expose 1.118 and then 1.132–1.135.
🔎 The 7-day liquidation map shows roughly 16–17 million USD in long liquidations below the current price, significantly exceeding approximately 7 million USD in short liquidations above. The liquidity structure therefore clearly favors the downside, with around 2.3 times more cumulative liquidity below the market.
📉 Below the market, long-liquidation liquidity is broadly distributed but concentrated most heavily across 0.95–1.07. The strongest cluster sits around 1.071–1.073 with a bar above 0.5 million USD, while 0.995–0.998 and 0.950–0.953 also contain bars around 0.44–0.45 million USD. Losing 1.09 would shift attention toward 1.072–1.062 and then 1.042–1.022.
📈 Above the market, short-liquidation liquidity is concentrated mainly across 1.10–1.14. Notable clusters appear around 1.103–1.106 with a bar near 0.43 million USD, 1.116–1.119 near 0.37 million USD, and 1.132–1.135 around 0.42 million USD. Further out, 1.155–1.158 still holds another notable pocket.
🧭 The broader setup favors the downside because long-liquidation exposure below clearly dominates. Losing 1.09 would increase the probability of a sweep toward 1.072–1.062, followed by 1.042–1.022. Breaking above 1.105 would instead expose 1.118 and then 1.132–1.135.
1
16
·
--
Haussier
Voir la traduction
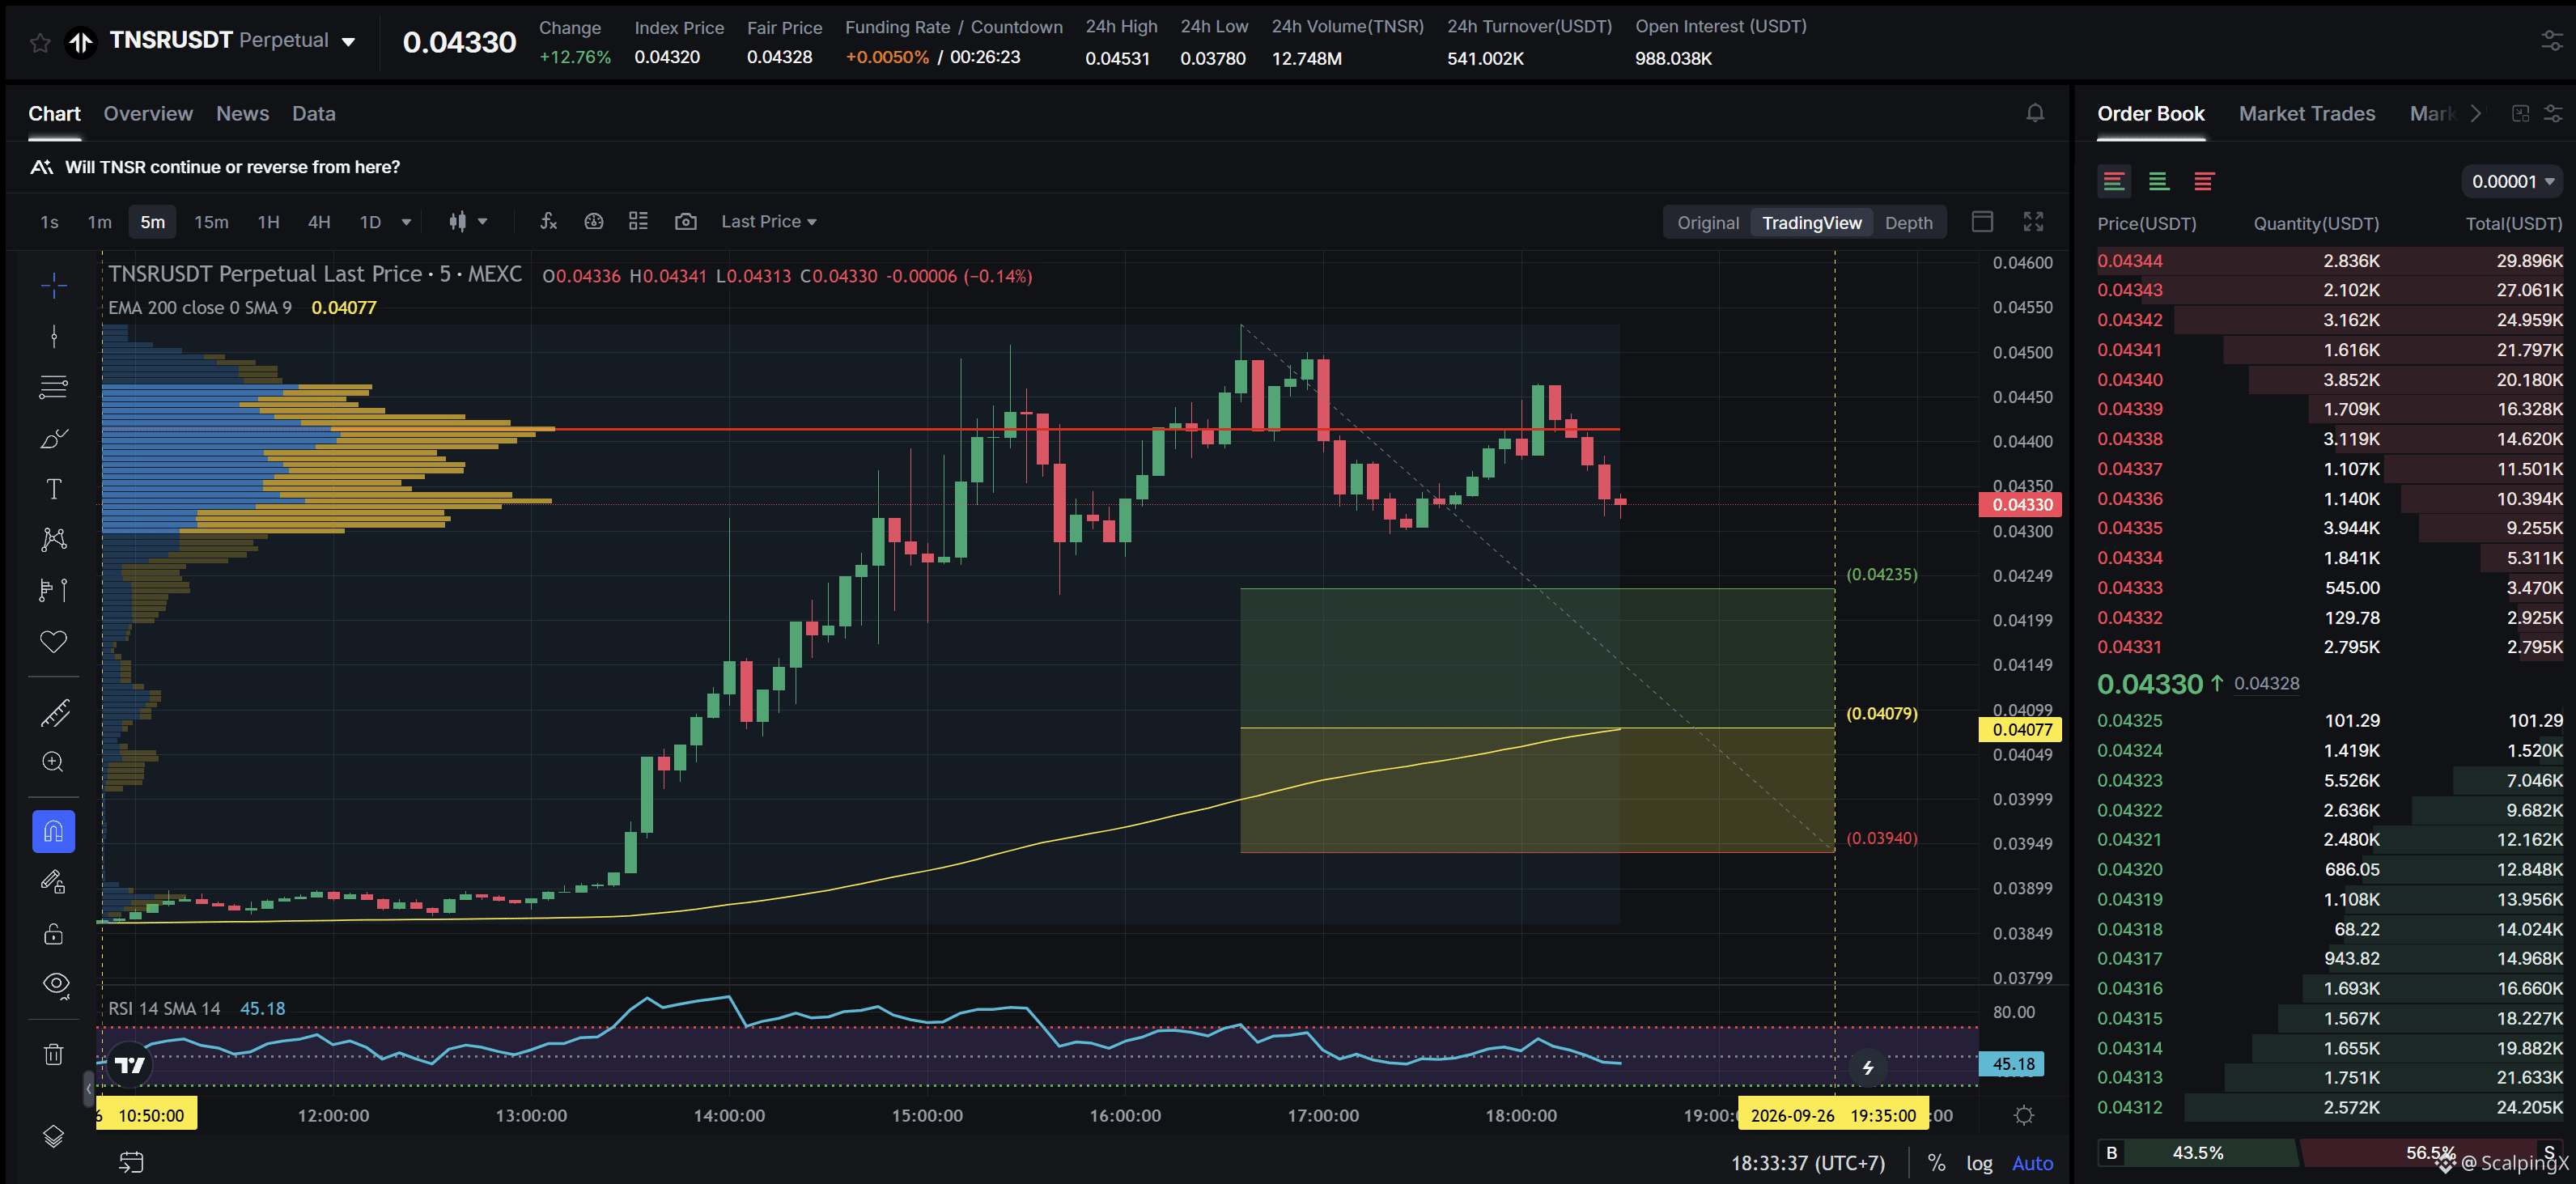
$TNSR - Mcap 22.32M$ - 24h Sentiment +5.81 Bullish
SC02 M5 - pending Long order. Entry lies within LVN + not affected by any weak zone, the current support zone is approximately 3.38% wide. The uptrend has lasted 7 hours 40 minutes, with a maximum recorded price increase of 17.32%. If price loses this support zone, the trend is highly likely to reverse downward.
$TNSR - Mcap 22.32M$ - 24h Sentiment +5.81 Bullish
SC02 M5 - pending Long order. Entry lies within LVN + not affected by any weak zone, the current support zone is approximately 3.38% wide. The uptrend has lasted 7 hours 40 minutes, with a maximum recorded price increase of 17.32%. If price loses this support zone, the trend is highly likely to reverse downward.
SC02 M5 - pending Long order. Entry lies within LVN + not affected by any weak zone, the current support zone is approximately 3.38% wide. The uptrend has lasted 7 hours 40 minutes, with a maximum recorded price increase of 17.32%. If price loses this support zone, the trend is highly likely to reverse downward.
1
22
·
--
Haussier
Voir la traduction
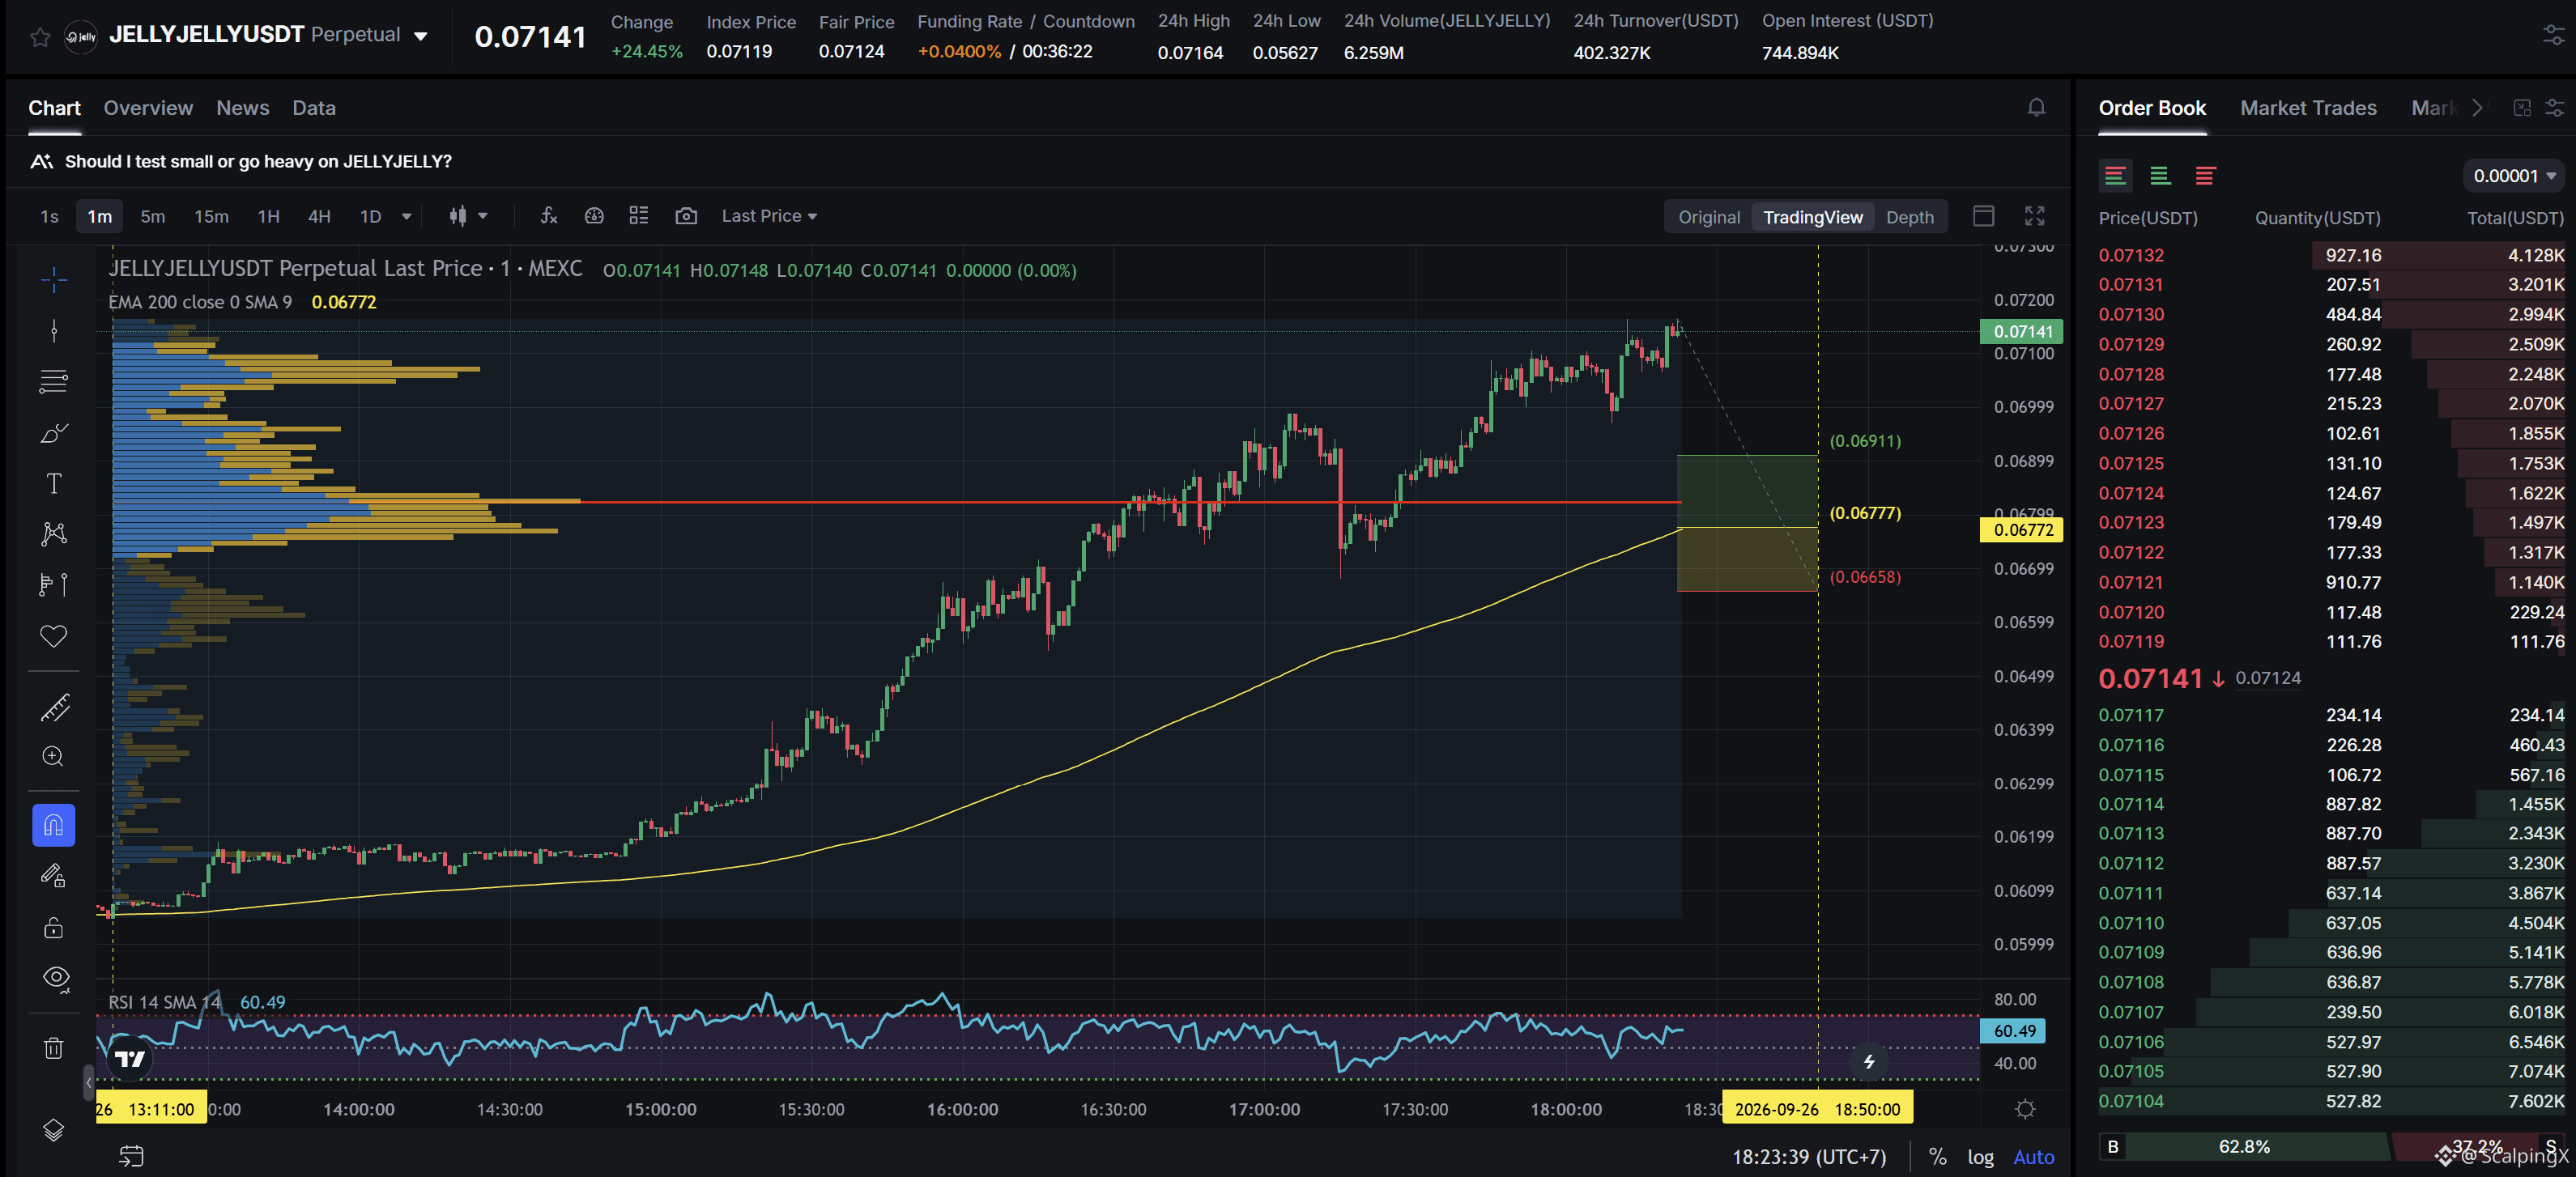
$JELLYJELLY - Mcap 70.41M$ - 24h Sentiment +6.00 Bullish
SC02 M1 - pending Long order. Entry lies within HVN + not affected by any weak zone, the current support zone is approximately 1.71% wide. The uptrend has lasted 5 hours 14 minutes, with a maximum recorded price increase of 18.30%. If price loses this support zone, the trend is highly likely to reverse downward.
$JELLYJELLY - Mcap 70.41M$ - 24h Sentiment +6.00 Bullish
SC02 M1 - pending Long order. Entry lies within HVN + not affected by any weak zone, the current support zone is approximately 1.71% wide. The uptrend has lasted 5 hours 14 minutes, with a maximum recorded price increase of 18.30%. If price loses this support zone, the trend is highly likely to reverse downward.
SC02 M1 - pending Long order. Entry lies within HVN + not affected by any weak zone, the current support zone is approximately 1.71% wide. The uptrend has lasted 5 hours 14 minutes, with a maximum recorded price increase of 18.30%. If price loses this support zone, the trend is highly likely to reverse downward.
1
15
·
--
Haussier
Voir la traduction
Metals diverge as gold faces yield pressure while copper and zinc remain supported by physical tightness
🟡 Gold fell about 2–2.3% during Sep 21–25 to around $4,280–4,288/oz, while silver lost roughly 4%. The main pressure came from the US 10-year Treasury yield rising above 5% and the DXY holding near 101, increasing the opportunity cost of non-yielding assets despite ongoing Middle East risks.
📉 The move appears more like a repricing of rate expectations than a broad exit from precious metals. Gold speculative positioning remains heavily net long, while GLD holdings only declined modestly on Sep 24.
🔶 Copper moved in the opposite direction. LME 3-month copper held near $14,620–14,630/t, while COMEX briefly reached around $15,060/t. Cash-to-3-month backwardation widened to roughly $125/t, showing that immediately available metal still commands a strong premium despite a firmer dollar.
⚙️ Zinc also remained relatively tight, with backwardation near $106/t. Deeply negative treatment charges in China and Nyrstar’s review of the Budel smelter added further supply concerns. Nickel was weaker as inventories continued to build.
🏗️ Iron ore did not follow copper higher. Prices stayed near CNY 713–715/t on Dalian and $95–96/t on SGX, while Chinese port inventories rose to about 145.45 million tonnes. Pre-Golden Week restocking helped, but weak steel margins and blast-furnace maintenance limited demand.
📌 This was not a uniform risk-off week for metals. Precious metals remain driven mainly by yields and the dollar, while copper and zinc are still supported by physical tightness. US PCE will be key for gold and silver, while China’s post-holiday demand will matter more for copper and iron ore.
#Metals $XAU $XAG $COPPER
Metals diverge as gold faces yield pressure while copper and zinc remain supported by physical tightness
🟡 Gold fell about 2–2.3% during Sep 21–25 to around $4,280–4,288/oz, while silver lost roughly 4%. The main pressure came from the US 10-year Treasury yield rising above 5% and the DXY holding near 101, increasing the opportunity cost of non-yielding assets despite ongoing Middle East risks.
📉 The move appears more like a repricing of rate expectations than a broad exit from precious metals. Gold speculative positioning remains heavily net long, while GLD holdings only declined modestly on Sep 24.
🔶 Copper moved in the opposite direction. LME 3-month copper held near $14,620–14,630/t, while COMEX briefly reached around $15,060/t. Cash-to-3-month backwardation widened to roughly $125/t, showing that immediately available metal still commands a strong premium despite a firmer dollar.
⚙️ Zinc also remained relatively tight, with backwardation near $106/t. Deeply negative treatment charges in China and Nyrstar’s review of the Budel smelter added further supply concerns. Nickel was weaker as inventories continued to build.
🏗️ Iron ore did not follow copper higher. Prices stayed near CNY 713–715/t on Dalian and $95–96/t on SGX, while Chinese port inventories rose to about 145.45 million tonnes. Pre-Golden Week restocking helped, but weak steel margins and blast-furnace maintenance limited demand.
📌 This was not a uniform risk-off week for metals. Precious metals remain driven mainly by yields and the dollar, while copper and zinc are still supported by physical tightness. US PCE will be key for gold and silver, while China’s post-holiday demand will matter more for copper and iron ore.
#Metals $XAU $XAG $COPPER
🟡 Gold fell about 2–2.3% during Sep 21–25 to around $4,280–4,288/oz, while silver lost roughly 4%. The main pressure came from the US 10-year Treasury yield rising above 5% and the DXY holding near 101, increasing the opportunity cost of non-yielding assets despite ongoing Middle East risks.
📉 The move appears more like a repricing of rate expectations than a broad exit from precious metals. Gold speculative positioning remains heavily net long, while GLD holdings only declined modestly on Sep 24.
🔶 Copper moved in the opposite direction. LME 3-month copper held near $14,620–14,630/t, while COMEX briefly reached around $15,060/t. Cash-to-3-month backwardation widened to roughly $125/t, showing that immediately available metal still commands a strong premium despite a firmer dollar.
⚙️ Zinc also remained relatively tight, with backwardation near $106/t. Deeply negative treatment charges in China and Nyrstar’s review of the Budel smelter added further supply concerns. Nickel was weaker as inventories continued to build.
🏗️ Iron ore did not follow copper higher. Prices stayed near CNY 713–715/t on Dalian and $95–96/t on SGX, while Chinese port inventories rose to about 145.45 million tonnes. Pre-Golden Week restocking helped, but weak steel margins and blast-furnace maintenance limited demand.
📌 This was not a uniform risk-off week for metals. Precious metals remain driven mainly by yields and the dollar, while copper and zinc are still supported by physical tightness. US PCE will be key for gold and silver, while China’s post-holiday demand will matter more for copper and iron ore.
#Metals $XAU $XAG $COPPER

243
·
--
Haussier
Voir la traduction
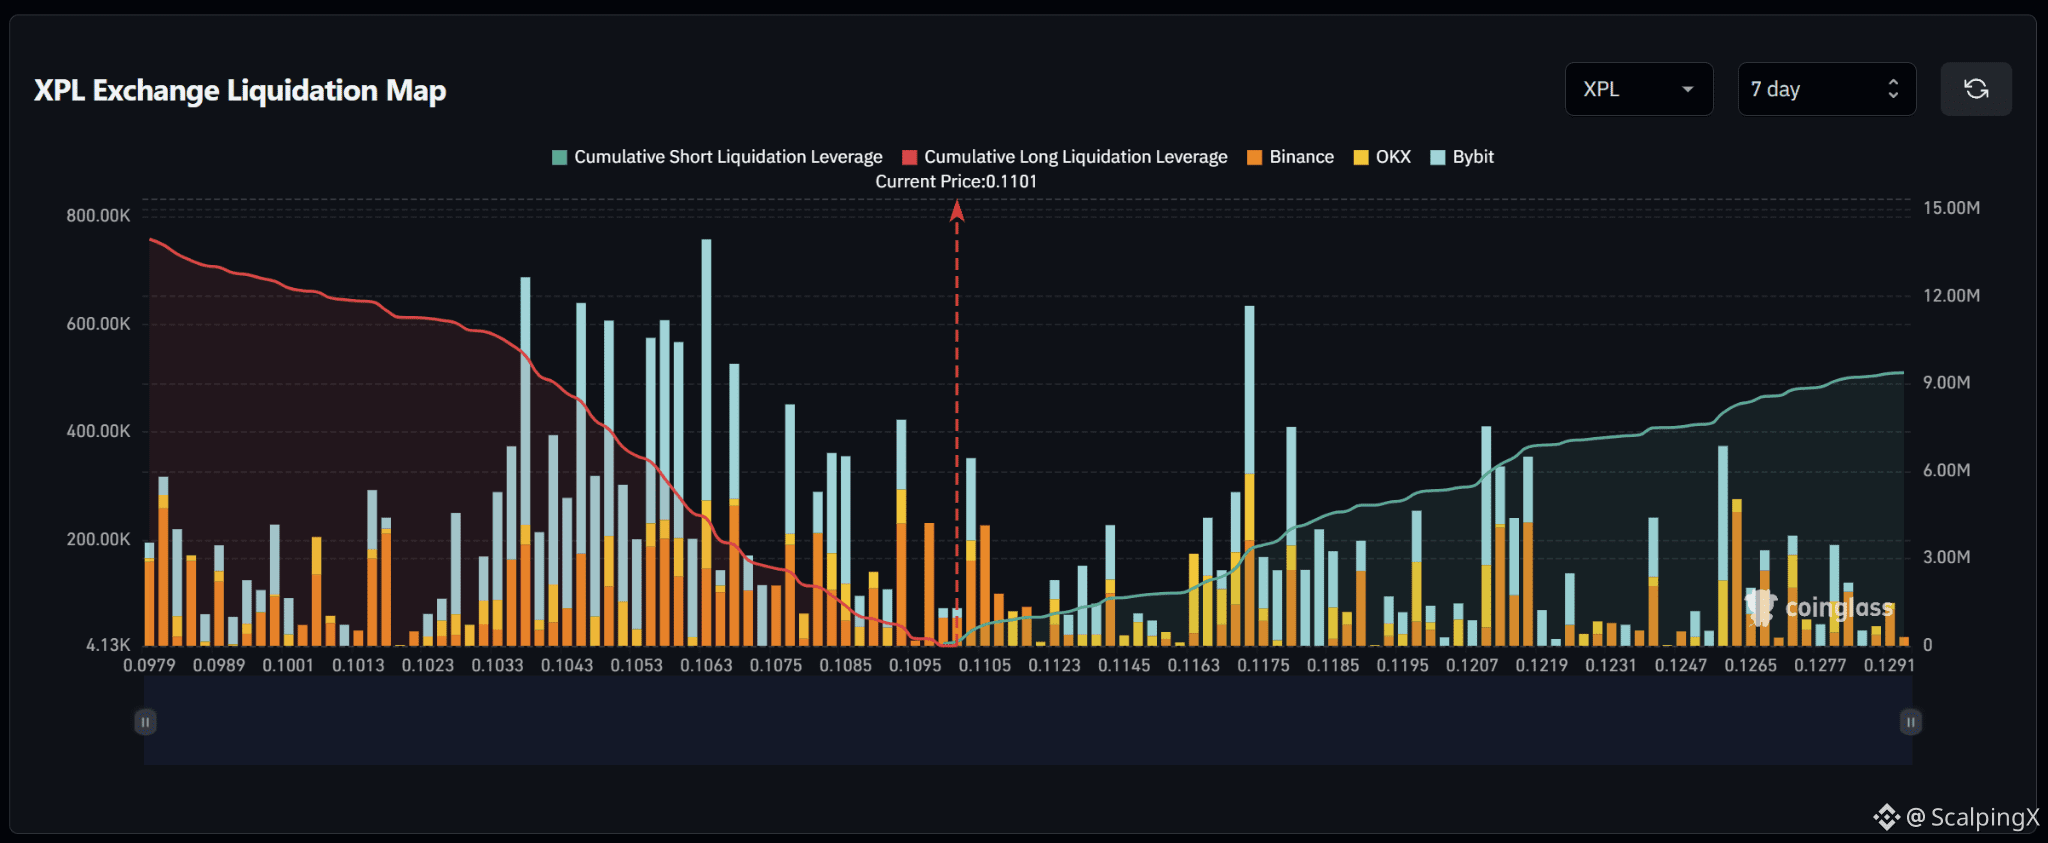
$XPL – Liquidation Map (7 Days) – Current Price 0.1101
🔎 The 7-day liquidation map shows roughly 13–14 million USD in long liquidations below the current price, exceeding approximately 9 million USD in short liquidations above. The liquidity structure therefore favors the downside, with around 1.5 times more cumulative liquidity below the market.
📉 Below the market, long-liquidation liquidity is concentrated heavily across 0.103–0.108. The strongest cluster sits around 0.1062–0.1065 with a bar near 0.75 million USD, while 0.1035–0.1055 contains several bars around 0.55–0.68 million USD. Losing 0.1095 would shift attention toward 0.1085–0.1075 and then 0.1065–0.1045.
📈 Above the market, short-liquidation liquidity is concentrated mainly across 0.116–0.122. The strongest cluster sits around 0.1172–0.1175 with a bar near 0.63 million USD, while 0.1208–0.1218 contains several bars around 0.35–0.40 million USD. Further out, 0.1260–0.1266 holds another notable liquidity pocket.
🧭 The broader setup favors the downside because long-liquidation exposure below is larger. Losing 0.1095 would increase the probability of a sweep toward 0.1085–0.1075, followed by 0.1065–0.1045. Breaking above 0.1145 would instead expose 0.1172–0.1175 and then 0.1208–0.1218.
$XPL – Liquidation Map (7 Days) – Current Price 0.1101
🔎 The 7-day liquidation map shows roughly 13–14 million USD in long liquidations below the current price, exceeding approximately 9 million USD in short liquidations above. The liquidity structure therefore favors the downside, with around 1.5 times more cumulative liquidity below the market.
📉 Below the market, long-liquidation liquidity is concentrated heavily across 0.103–0.108. The strongest cluster sits around 0.1062–0.1065 with a bar near 0.75 million USD, while 0.1035–0.1055 contains several bars around 0.55–0.68 million USD. Losing 0.1095 would shift attention toward 0.1085–0.1075 and then 0.1065–0.1045.
📈 Above the market, short-liquidation liquidity is concentrated mainly across 0.116–0.122. The strongest cluster sits around 0.1172–0.1175 with a bar near 0.63 million USD, while 0.1208–0.1218 contains several bars around 0.35–0.40 million USD. Further out, 0.1260–0.1266 holds another notable liquidity pocket.
🧭 The broader setup favors the downside because long-liquidation exposure below is larger. Losing 0.1095 would increase the probability of a sweep toward 0.1085–0.1075, followed by 0.1065–0.1045. Breaking above 0.1145 would instead expose 0.1172–0.1175 and then 0.1208–0.1218.
🔎 The 7-day liquidation map shows roughly 13–14 million USD in long liquidations below the current price, exceeding approximately 9 million USD in short liquidations above. The liquidity structure therefore favors the downside, with around 1.5 times more cumulative liquidity below the market.
📉 Below the market, long-liquidation liquidity is concentrated heavily across 0.103–0.108. The strongest cluster sits around 0.1062–0.1065 with a bar near 0.75 million USD, while 0.1035–0.1055 contains several bars around 0.55–0.68 million USD. Losing 0.1095 would shift attention toward 0.1085–0.1075 and then 0.1065–0.1045.
📈 Above the market, short-liquidation liquidity is concentrated mainly across 0.116–0.122. The strongest cluster sits around 0.1172–0.1175 with a bar near 0.63 million USD, while 0.1208–0.1218 contains several bars around 0.35–0.40 million USD. Further out, 0.1260–0.1266 holds another notable liquidity pocket.
🧭 The broader setup favors the downside because long-liquidation exposure below is larger. Losing 0.1095 would increase the probability of a sweep toward 0.1085–0.1075, followed by 0.1065–0.1045. Breaking above 0.1145 would instead expose 0.1172–0.1175 and then 0.1208–0.1218.
19
Connectez-vous pour découvrir plus de contenu
Rejoignez la communauté mondiale des adeptes de cryptomonnaies sur Binance Square
⚡️ Suviez les dernières informations importantes sur les cryptomonnaies.
💬 Jugé digne de confiance par la plus grande plateforme d’échange de cryptomonnaies au monde.
👍 Découvrez les connaissances que partagent les créateurs vérifiés.
Adresse e-mail/Nº de téléphone
Sujets d’actualité
StrategyStriveAdd2305BitcoinThisWeek
14,221 vues
512 mentions
#strategystriveadd2305bitcointhisweek 🚨 2,305 BTC viennent d’être transférés dans des trésoreries
Alors que la plupart des traders se concentraient sur le rebond du prix du Bitcoin, deux sociétés cotées ont discrètement effectué de gros mouvements. 👀
Strategy et Strive ont ensemble acheté 2 305 BTC pour 182,7 millions de dollars.
🔹 Strategy a acheté 950 BTC pour 75,7 millions de dollars
🔹 Strive a acheté 1 355 BTC pour environ 107,7 millions de dollars
Cela porte leurs avoirs totaux à :
📊 Strategy. 846 000 BTC
📊 Strive. 26 355 BTC
Mais l’histoire ne se résume pas au montant de Bitcoin qu’elles ont acheté.
C’est la manière dont elles l’ont payé.
Strategy a utilisé du cash qu’elle avait déjà.
Strive a utilisé son modèle de financement par actions pour financer l’acquisition. Autrement dit, elle développe sa trésorerie Bitcoin sans dépendre uniquement des flux de trésorerie.
Cette différence compte.
Pour les traders et les investisseurs, elle ajoute une couche d’analyse : combien de Bitcoin est ajouté, comment cela est financé, et ce que cela signifie pour la valeur à long terme, par action.
Le coût du capital, l’accumulation en BTC et la valeur de l’action. Ces facteurs commencent à façonner le marché de certaines façons.
La demande des trésoreries d’entreprise n’est plus un simple détail.
Elle devient une partie de l’écosystème Bitcoin.
💬 Qu’en pensez-vous ?
De plus en plus d’entreprises vont-elles commencer à acheter du Bitcoin comme ça ?
Cette tendance va-t-elle prendre de l’ampleur ?
#bitcoin #Khan62 #BTC #trading
$MSTR
$MARA $BMNR
Khan 62
·4 mentions J’aime
·2.8k vues
TrumpRejectsIranHormuzReopening
17,867 vues
489 mentions
TokenizedStockDEXVolumeHits$20.9B
98 vues
5 mentions