

cryptotradehead
9.3k Publications
cryptotradehead
Signaler
Bloquer l’utilisateur
backtesting, analyse, how to use AI for trading - can you be a good trader?
Ouvert au trading
Trade régulièrement
4.9 an(s)
7 Suivis
2.6K+ Abonnés
5.0K+ J’aime
Publications
Portefeuille
Tous
Citations
Voir la traduction
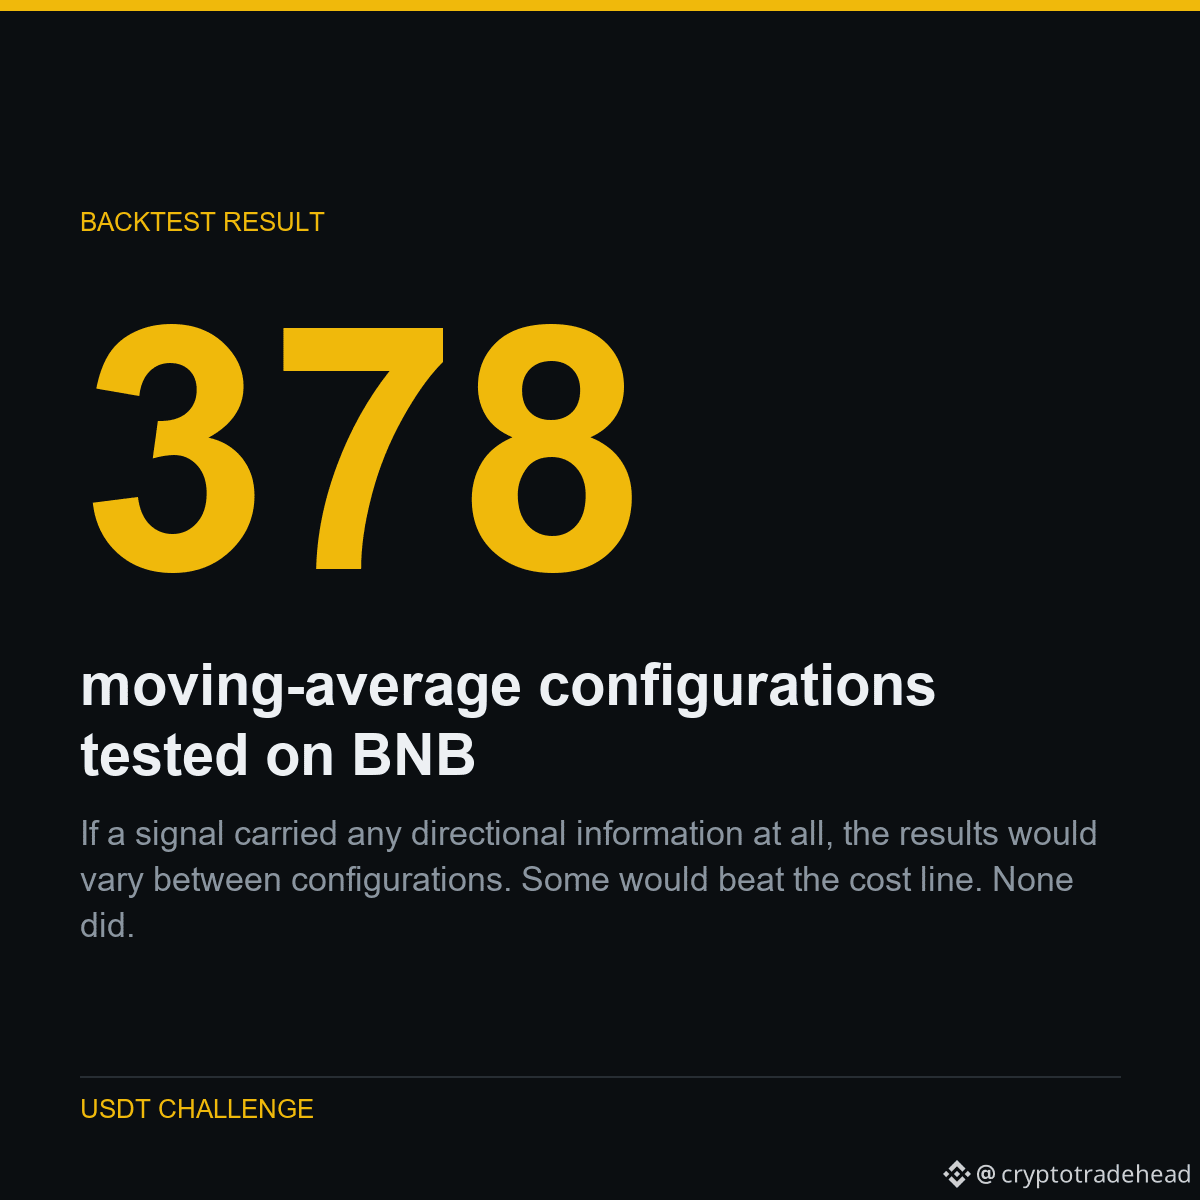
If a signal carried any directional information at all, the results would vary between configurations. Some would beat the cost line. None did. That is not weak edge that needs tuning - it is zero edge being charged an entry fee.
Here is what that came from.
I tested 378 moving-average strategies. Every one lost exactly what it cost to trade.
Two signal families, four timeframes, EMA and SMA, with and without a trend filter, long-only and short-only. 378 combinations in total, all with real fees and real measured slippage applied.
The round-trip cost of a trade is 0.240% of position size. The average result per trade, across every single configuration, landed between -0.361% and -0.401%.
That is the cost, and nothing else.
Part of a public experiment: 5,063 USDT to 1,000,000 USDT, every result published - including the ones that make me look bad.
Run on $BNB
#Binance #Futures #Backtesting #TradingBot #CryptoData
If a signal carried any directional information at all, the results would vary between configurations. Some would beat the cost line. None did. That is not weak edge that needs tuning - it is zero edge being charged an entry fee.
Here is what that came from.
I tested 378 moving-average strategies. Every one lost exactly what it cost to trade.
Two signal families, four timeframes, EMA and SMA, with and without a trend filter, long-only and short-only. 378 combinations in total, all with real fees and real measured slippage applied.
The round-trip cost of a trade is 0.240% of position size. The average result per trade, across every single configuration, landed between -0.361% and -0.401%.
That is the cost, and nothing else.
Part of a public experiment: 5,063 USDT to 1,000,000 USDT, every result published - including the ones that make me look bad.
Run on $BNB
#Binance #Futures #Backtesting #TradingBot #CryptoData
Here is what that came from.
I tested 378 moving-average strategies. Every one lost exactly what it cost to trade.
Two signal families, four timeframes, EMA and SMA, with and without a trend filter, long-only and short-only. 378 combinations in total, all with real fees and real measured slippage applied.
The round-trip cost of a trade is 0.240% of position size. The average result per trade, across every single configuration, landed between -0.361% and -0.401%.
That is the cost, and nothing else.
Part of a public experiment: 5,063 USDT to 1,000,000 USDT, every result published - including the ones that make me look bad.
Run on $BNB
#Binance #Futures #Backtesting #TradingBot #CryptoData
3
Article
Voir la traduction
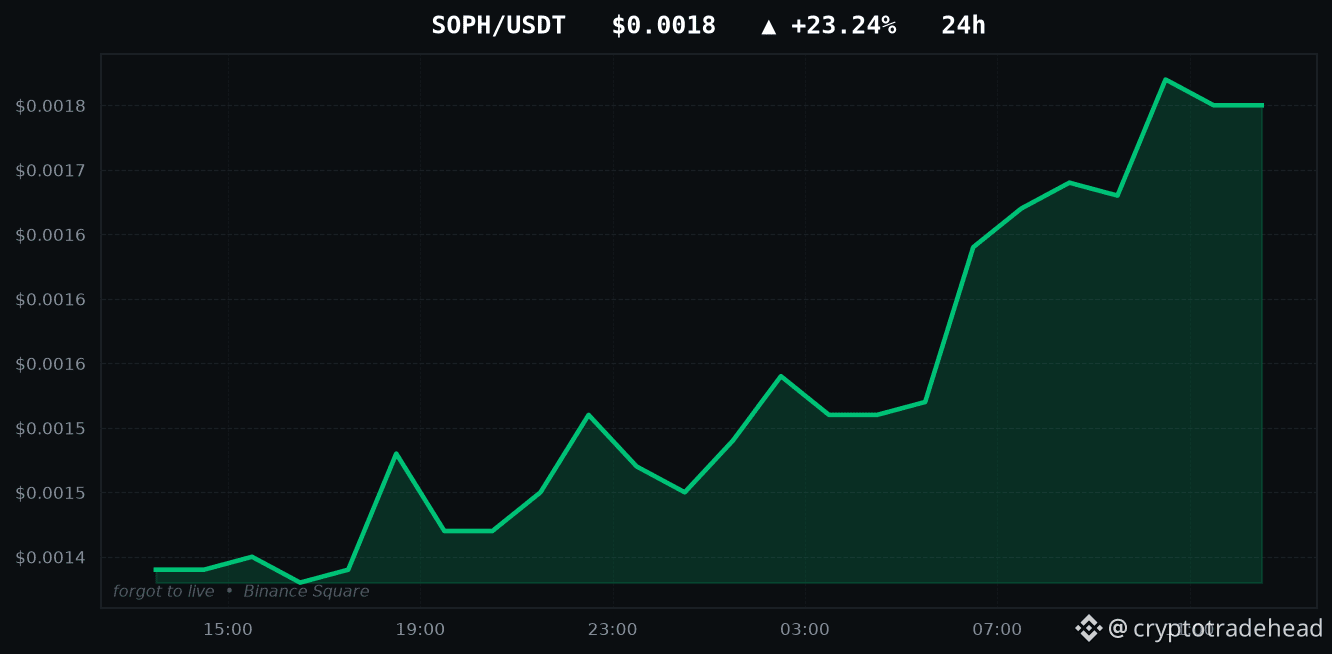
SOPH is up +23.24% - I tested both ways to trade itTODAY'S TOP GAINERS
SOPH: +23.24%
MITO: +12.35%
KORUB: +9.67%
OGN: +9.38%
HAEDAL: +8.96%
Every account on this app will show you this list. Here is the part they skip.
I backtested both ways of trading a move like SOPH's +23.24%: buying the breakout, and fading it on the assumption it reverts. Both lost money. Not narrowly - they lost roughly the transaction cost, 0.240% per round trip, which is what a signal carrying no information looks like once you charge it fees.
A large 24-hour move tells you something already happened. It does not tell you what happens next, and the data says so in both directions.
Part of a public experiment: every strategy I test gets published, working or not.
Movers above: $SOPH $MITO $KORUB
#Binance #Altcoins #Futures #SOPH #CryptoData
SOPH is up +23.24% - I tested both ways to trade it
TODAY'S TOP GAINERS
SOPH: +23.24%
MITO: +12.35%
KORUB: +9.67%
OGN: +9.38%
HAEDAL: +8.96%
Every account on this app will show you this list. Here is the part they skip.
I backtested both ways of trading a move like SOPH's +23.24%: buying the breakout, and fading it on the assumption it reverts. Both lost money. Not narrowly - they lost roughly the transaction cost, 0.240% per round trip, which is what a signal carrying no information looks like once you charge it fees.
A large 24-hour move tells you something already happened. It does not tell you what happens next, and the data says so in both directions.
Part of a public experiment: every strategy I test gets published, working or not.
Movers above: $SOPH $MITO $KORUB
#Binance #Altcoins #Futures #SOPH #CryptoData
SOPH: +23.24%
MITO: +12.35%
KORUB: +9.67%
OGN: +9.38%
HAEDAL: +8.96%
Every account on this app will show you this list. Here is the part they skip.
I backtested both ways of trading a move like SOPH's +23.24%: buying the breakout, and fading it on the assumption it reverts. Both lost money. Not narrowly - they lost roughly the transaction cost, 0.240% per round trip, which is what a signal carrying no information looks like once you charge it fees.
A large 24-hour move tells you something already happened. It does not tell you what happens next, and the data says so in both directions.
Part of a public experiment: every strategy I test gets published, working or not.
Movers above: $SOPH $MITO $KORUB
#Binance #Altcoins #Futures #SOPH #CryptoData
9
Voir la traduction
HOW I TESTED IT
Rank 45 perpetuals by 5-day return. Long the top 5, short the bottom 5, hold 15 days, rebalance. Equal weight, dollar-neutral.
The out-of-sample control is the one that had destroyed everything before it: fix the settings on old data, then run them on data the search never touched. In-sample +1.711% per rebalance, out-of-sample +1.801%. The mean held.
It also survives costs far worse than real: still +0.48% per rebalance even at a 1.50% round trip, six times what Binance actually charges.
THE NUMBERS
Mean per rebalance: +1.737%
In-sample: +1.711%
Out-of-sample: +1.801%
Win rate: 55.6%
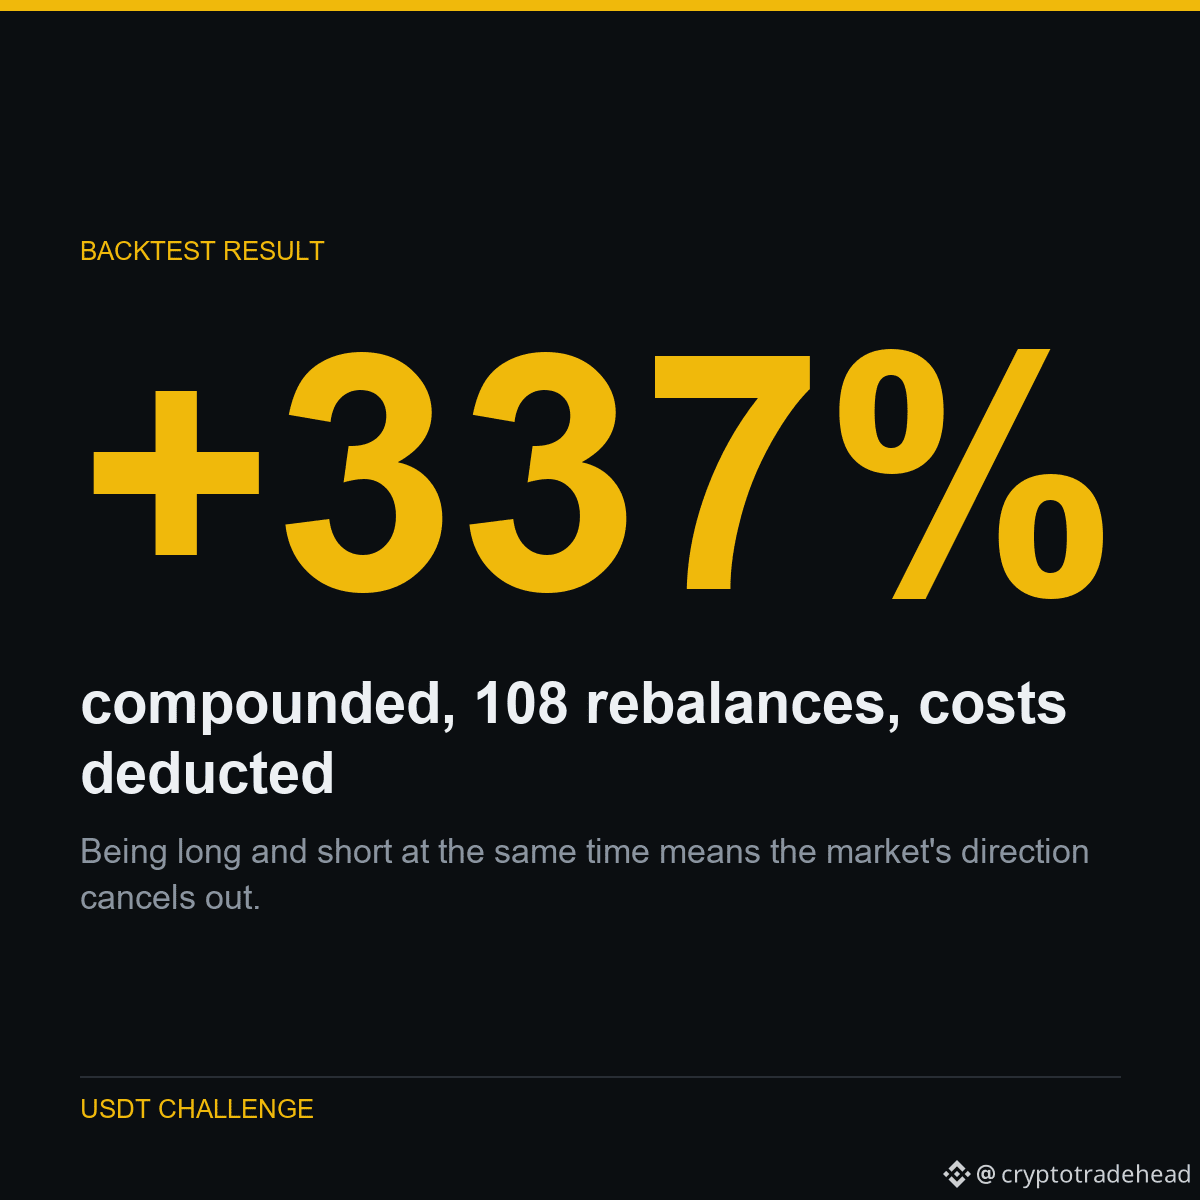
Being long and short at the same time means the market's direction cancels out. What is left is whether the winners keep beating the losers - which is a real question, not a bet on the market going up.
Part of a public experiment: 5,063 USDT to 1,000,000 USDT, every result published - including the ones that make me look bad.
Run on $SOL $BNB $BTC
#Binance #Futures #Backtesting #TradingBot #CryptoData
HOW I TESTED IT
Rank 45 perpetuals by 5-day return. Long the top 5, short the bottom 5, hold 15 days, rebalance. Equal weight, dollar-neutral.
The out-of-sample control is the one that had destroyed everything before it: fix the settings on old data, then run them on data the search never touched. In-sample +1.711% per rebalance, out-of-sample +1.801%. The mean held.
It also survives costs far worse than real: still +0.48% per rebalance even at a 1.50% round trip, six times what Binance actually charges.
THE NUMBERS
Mean per rebalance: +1.737%
In-sample: +1.711%
Out-of-sample: +1.801%
Win rate: 55.6%
Being long and short at the same time means the market's direction cancels out. What is left is whether the winners keep beating the losers - which is a real question, not a bet on the market going up.
Part of a public experiment: 5,063 USDT to 1,000,000 USDT, every result published - including the ones that make me look bad.
Run on $SOL $BNB $BTC
#Binance #Futures #Backtesting #TradingBot #CryptoData
Rank 45 perpetuals by 5-day return. Long the top 5, short the bottom 5, hold 15 days, rebalance. Equal weight, dollar-neutral.
The out-of-sample control is the one that had destroyed everything before it: fix the settings on old data, then run them on data the search never touched. In-sample +1.711% per rebalance, out-of-sample +1.801%. The mean held.
It also survives costs far worse than real: still +0.48% per rebalance even at a 1.50% round trip, six times what Binance actually charges.
THE NUMBERS
Mean per rebalance: +1.737%
In-sample: +1.711%
Out-of-sample: +1.801%
Win rate: 55.6%
Being long and short at the same time means the market's direction cancels out. What is left is whether the winners keep beating the losers - which is a real question, not a bet on the market going up.
Part of a public experiment: 5,063 USDT to 1,000,000 USDT, every result published - including the ones that make me look bad.
Run on $SOL $BNB $BTC
#Binance #Futures #Backtesting #TradingBot #CryptoData
1
Voir la traduction
HOW I TESTED IT
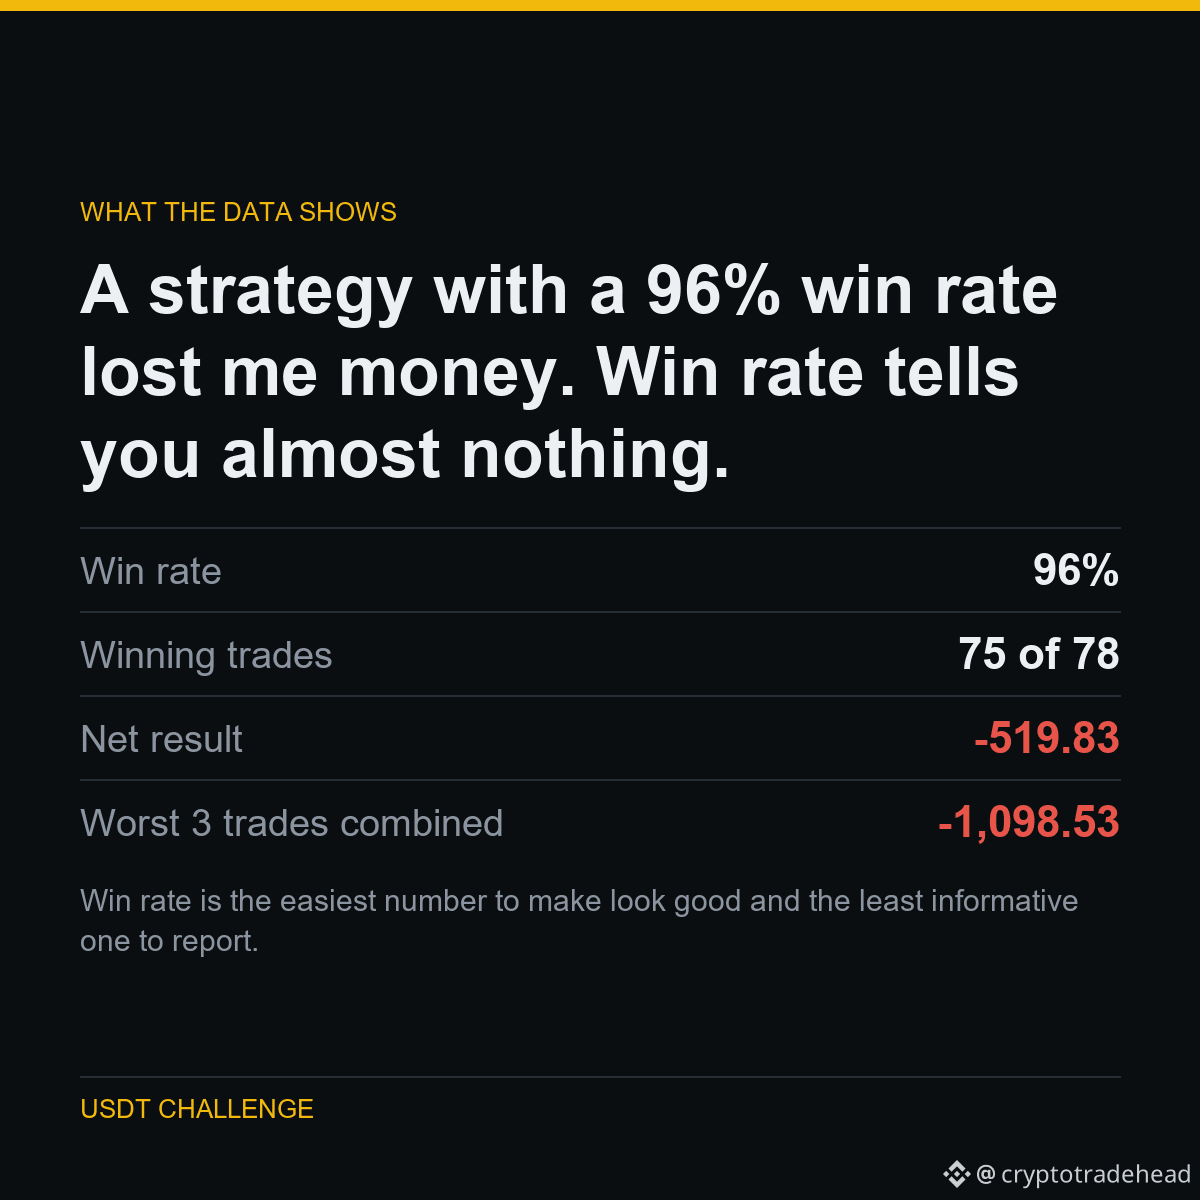
I backtested a martingale system - add to losers, close when it recovers. 75 of 78 trades were winners.
It still lost 519.83 USDT, because the three losing trades gave back more than all 75 winners made combined.
Peak margin on those trades reached 4x the entire account.
THE NUMBERS
Win rate: 96%
Winning trades: 75 of 78
Net result: -519.83
Worst 3 trades combined: -1,098.53
Win rate is the easiest number to make look good and the least informative one to report. Anyone showing you a win rate without the size of the losses is showing you the half of the picture that flatters them.
Part of a public experiment: 5,063 USDT to 1,000,000 USDT, every result published - including the ones that make me look bad.
Run on $BNB
#Binance #Futures #Backtesting #TradingBot #CryptoData
HOW I TESTED IT
I backtested a martingale system - add to losers, close when it recovers. 75 of 78 trades were winners.
It still lost 519.83 USDT, because the three losing trades gave back more than all 75 winners made combined.
Peak margin on those trades reached 4x the entire account.
THE NUMBERS
Win rate: 96%
Winning trades: 75 of 78
Net result: -519.83
Worst 3 trades combined: -1,098.53
Win rate is the easiest number to make look good and the least informative one to report. Anyone showing you a win rate without the size of the losses is showing you the half of the picture that flatters them.
Part of a public experiment: 5,063 USDT to 1,000,000 USDT, every result published - including the ones that make me look bad.
Run on $BNB
#Binance #Futures #Backtesting #TradingBot #CryptoData
I backtested a martingale system - add to losers, close when it recovers. 75 of 78 trades were winners.
It still lost 519.83 USDT, because the three losing trades gave back more than all 75 winners made combined.
Peak margin on those trades reached 4x the entire account.
THE NUMBERS
Win rate: 96%
Winning trades: 75 of 78
Net result: -519.83
Worst 3 trades combined: -1,098.53
Win rate is the easiest number to make look good and the least informative one to report. Anyone showing you a win rate without the size of the losses is showing you the half of the picture that flatters them.
Part of a public experiment: 5,063 USDT to 1,000,000 USDT, every result published - including the ones that make me look bad.
Run on $BNB
#Binance #Futures #Backtesting #TradingBot #CryptoData
4
Article
Voir la traduction
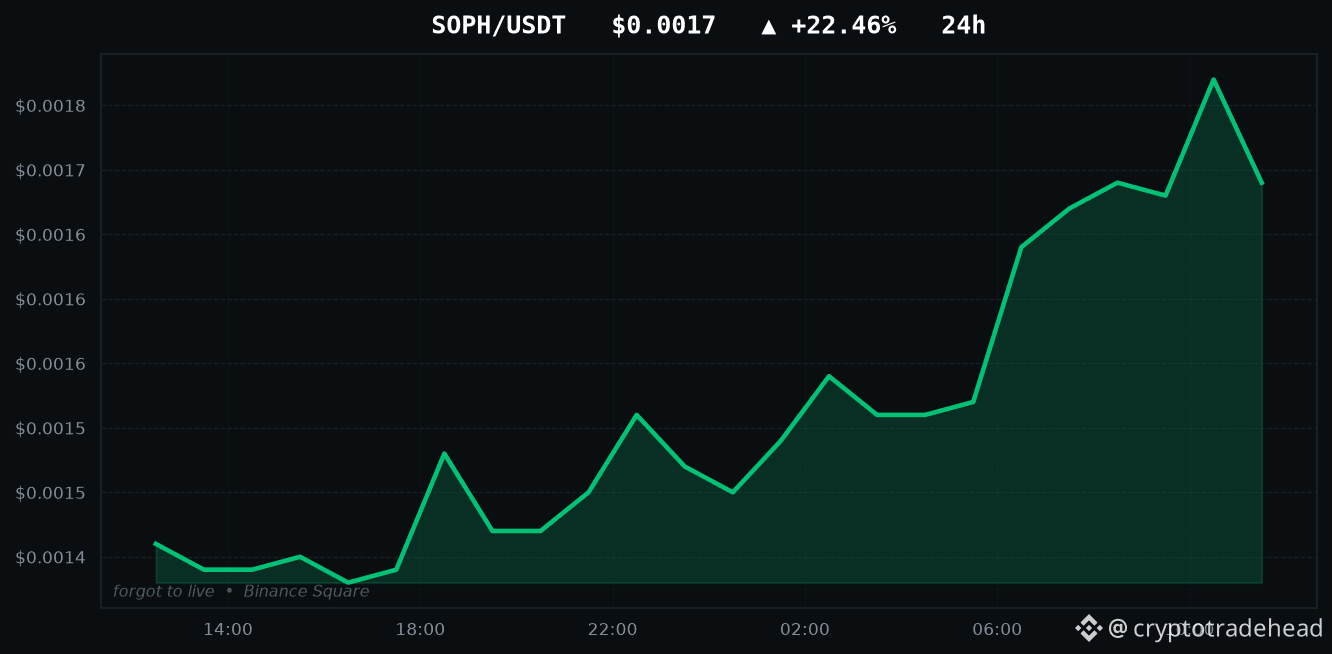
SOPH is up +22.46% - I tested both ways to trade itTODAY'S TOP GAINERS
SOPH: +22.46%
OGN: +14.74%
HAEDAL: +10.86%
KORUB: +10.62%
MITO: +9.69%
Every account on this app will show you this list. Here is the part they skip.
I backtested both ways of trading a move like SOPH's +22.46%: buying the breakout, and fading it on the assumption it reverts. Both lost money. Not narrowly - they lost roughly the transaction cost, 0.240% per round trip, which is what a signal carrying no information looks like once you charge it fees.
A large 24-hour move tells you something already happened. It does not tell you what happens next, and the data says so in both directions.
Part of a public experiment: every strategy I test gets published, working or not.
Movers above: $SOPH $OGN $HAEDAL
#Binance #Altcoins #Futures #SOPH #CryptoData
SOPH is up +22.46% - I tested both ways to trade it
TODAY'S TOP GAINERS
SOPH: +22.46%
OGN: +14.74%
HAEDAL: +10.86%
KORUB: +10.62%
MITO: +9.69%
Every account on this app will show you this list. Here is the part they skip.
I backtested both ways of trading a move like SOPH's +22.46%: buying the breakout, and fading it on the assumption it reverts. Both lost money. Not narrowly - they lost roughly the transaction cost, 0.240% per round trip, which is what a signal carrying no information looks like once you charge it fees.
A large 24-hour move tells you something already happened. It does not tell you what happens next, and the data says so in both directions.
Part of a public experiment: every strategy I test gets published, working or not.
Movers above: $SOPH $OGN $HAEDAL
#Binance #Altcoins #Futures #SOPH #CryptoData
SOPH: +22.46%
OGN: +14.74%
HAEDAL: +10.86%
KORUB: +10.62%
MITO: +9.69%
Every account on this app will show you this list. Here is the part they skip.
I backtested both ways of trading a move like SOPH's +22.46%: buying the breakout, and fading it on the assumption it reverts. Both lost money. Not narrowly - they lost roughly the transaction cost, 0.240% per round trip, which is what a signal carrying no information looks like once you charge it fees.
A large 24-hour move tells you something already happened. It does not tell you what happens next, and the data says so in both directions.
Part of a public experiment: every strategy I test gets published, working or not.
Movers above: $SOPH $OGN $HAEDAL
#Binance #Altcoins #Futures #SOPH #CryptoData
3
Voir la traduction
HOW I TESTED IT
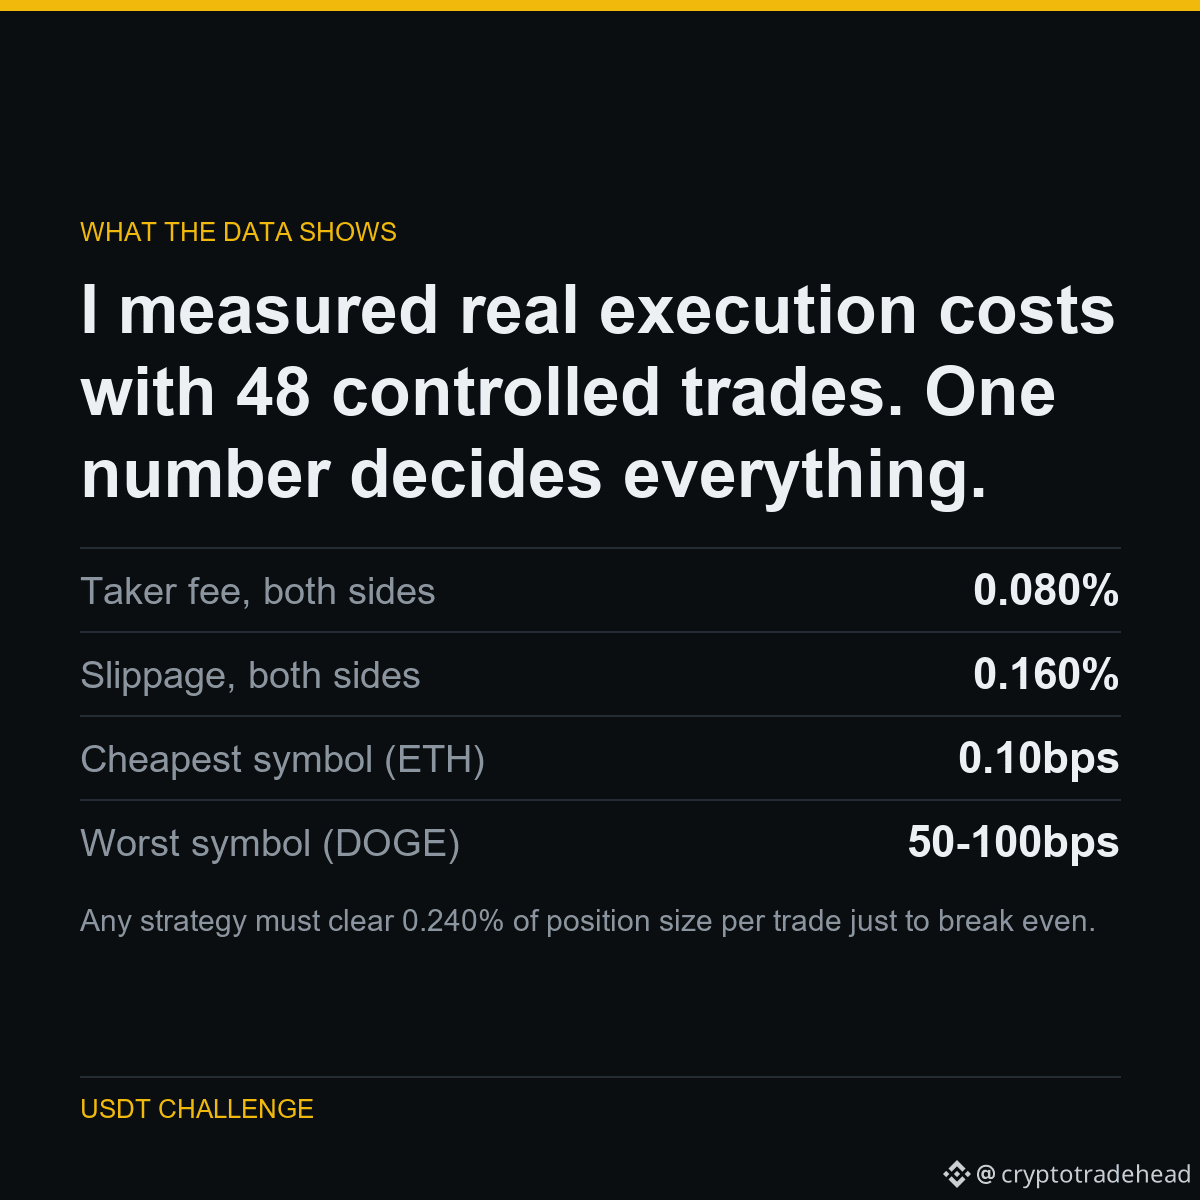
I stopped assuming what trading costs and measured it: 48 controlled round trips, entering and exiting immediately, recording the actual fill against the reference price.
Fee was constant at 0.04% per side. Slippage was not - ETH filled at essentially zero, while DOGE cost 50 to 100 basis points per round trip.
On a 150 USDT position, a round trip costs 0.36 USDT before the market moves at all.
THE NUMBERS
Taker fee, both sides: 0.080%
Slippage, both sides: 0.160%
Cheapest symbol (ETH): 0.10bps
Worst symbol (DOGE): 50-100bps
Any strategy must clear 0.240% of position size per trade just to break even. Most published setups never mention this number, which is why most published setups lose money.
Part of a public experiment: 5,063 USDT to 1,000,000 USDT, every result published - including the ones that make me look...
HOW I TESTED IT
I stopped assuming what trading costs and measured it: 48 controlled round trips, entering and exiting immediately, recording the actual fill against the reference price.
Fee was constant at 0.04% per side. Slippage was not - ETH filled at essentially zero, while DOGE cost 50 to 100 basis points per round trip.
On a 150 USDT position, a round trip costs 0.36 USDT before the market moves at all.
THE NUMBERS
Taker fee, both sides: 0.080%
Slippage, both sides: 0.160%
Cheapest symbol (ETH): 0.10bps
Worst symbol (DOGE): 50-100bps
Any strategy must clear 0.240% of position size per trade just to break even. Most published setups never mention this number, which is why most published setups lose money.
Part of a public experiment: 5,063 USDT to 1,000,000 USDT, every result published - including the ones that make me look...
I stopped assuming what trading costs and measured it: 48 controlled round trips, entering and exiting immediately, recording the actual fill against the reference price.
Fee was constant at 0.04% per side. Slippage was not - ETH filled at essentially zero, while DOGE cost 50 to 100 basis points per round trip.
On a 150 USDT position, a round trip costs 0.36 USDT before the market moves at all.
THE NUMBERS
Taker fee, both sides: 0.080%
Slippage, both sides: 0.160%
Cheapest symbol (ETH): 0.10bps
Worst symbol (DOGE): 50-100bps
Any strategy must clear 0.240% of position size per trade just to break even. Most published setups never mention this number, which is why most published setups lose money.
Part of a public experiment: 5,063 USDT to 1,000,000 USDT, every result published - including the ones that make me look...
9
Voir la traduction
HOW I TESTED IT
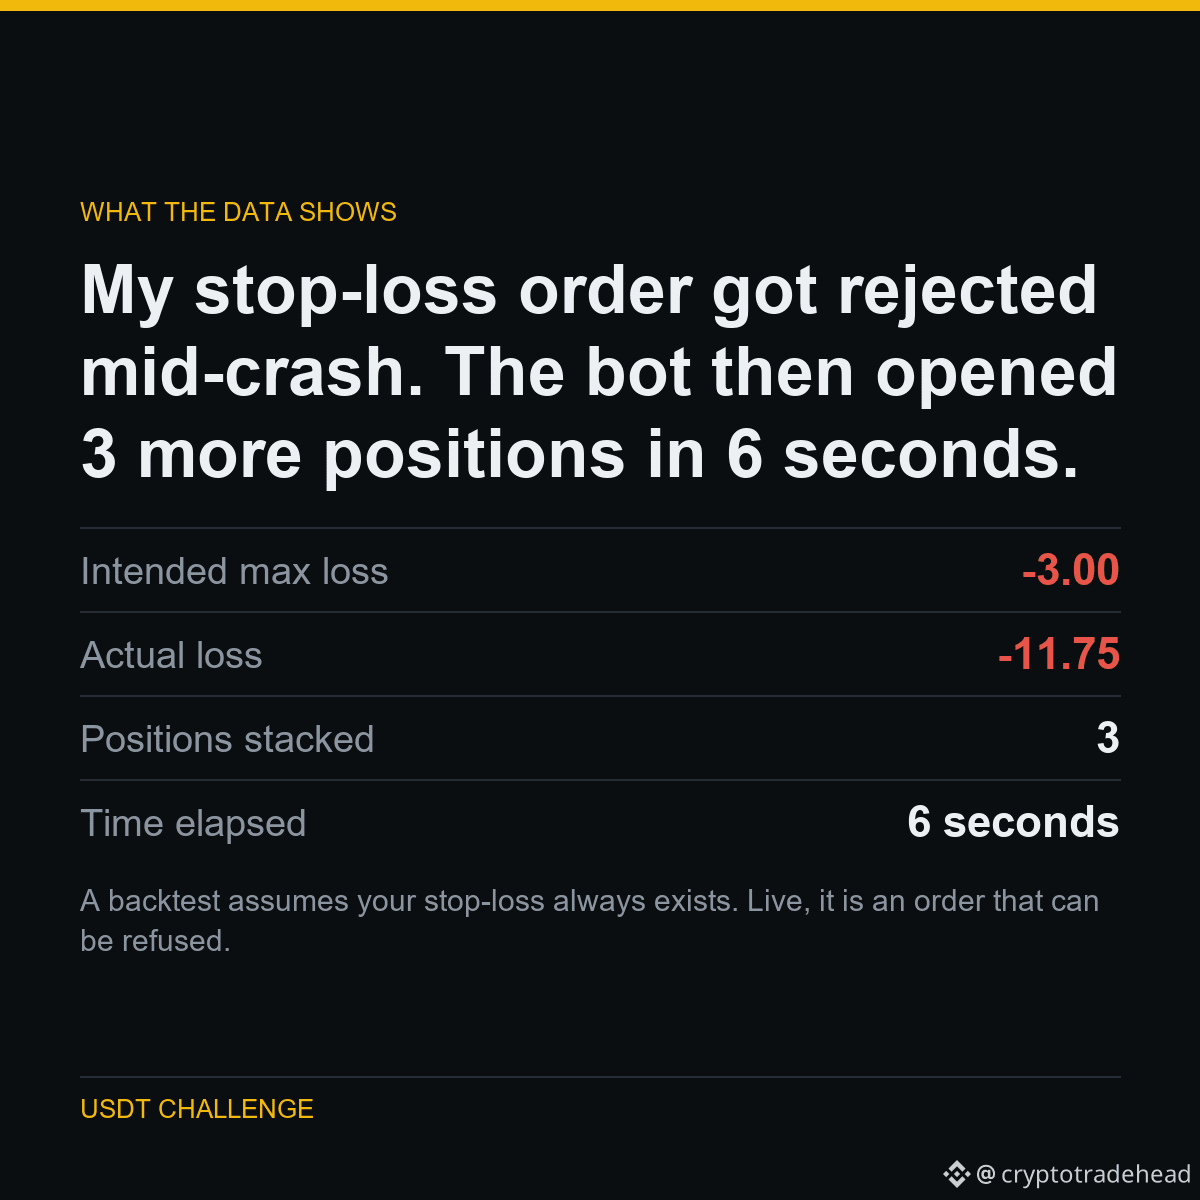
During a fast drop, Binance rejected my stop-loss with error -2021: the market had already moved past the trigger price before the order landed.
My code did not handle that rejection. The position stayed open with no stop, and because the bot's own state never recorded it, the next signal opened another position on top. Three times.
Intended risk was 3 USDT. Actual loss was 11.75 USDT.
THE NUMBERS
Intended max loss: -3.00
Actual loss: -11.75
Positions stacked: 3
Time elapsed: 6 seconds
A backtest assumes your stop-loss always exists. Live, it is an order that can be refused. The gap between those two assumptions is where real money goes.
Part of a public experiment: 5,063 USDT to 1,000,000 USDT, every result published - including the ones that make me look bad.
Run on $BNB
#Binance #Futures #Backtesting #TradingBot #CryptoData
HOW I TESTED IT
During a fast drop, Binance rejected my stop-loss with error -2021: the market had already moved past the trigger price before the order landed.
My code did not handle that rejection. The position stayed open with no stop, and because the bot's own state never recorded it, the next signal opened another position on top. Three times.
Intended risk was 3 USDT. Actual loss was 11.75 USDT.
THE NUMBERS
Intended max loss: -3.00
Actual loss: -11.75
Positions stacked: 3
Time elapsed: 6 seconds
A backtest assumes your stop-loss always exists. Live, it is an order that can be refused. The gap between those two assumptions is where real money goes.
Part of a public experiment: 5,063 USDT to 1,000,000 USDT, every result published - including the ones that make me look bad.
Run on $BNB
#Binance #Futures #Backtesting #TradingBot #CryptoData
During a fast drop, Binance rejected my stop-loss with error -2021: the market had already moved past the trigger price before the order landed.
My code did not handle that rejection. The position stayed open with no stop, and because the bot's own state never recorded it, the next signal opened another position on top. Three times.
Intended risk was 3 USDT. Actual loss was 11.75 USDT.
THE NUMBERS
Intended max loss: -3.00
Actual loss: -11.75
Positions stacked: 3
Time elapsed: 6 seconds
A backtest assumes your stop-loss always exists. Live, it is an order that can be refused. The gap between those two assumptions is where real money goes.
Part of a public experiment: 5,063 USDT to 1,000,000 USDT, every result published - including the ones that make me look bad.
Run on $BNB
#Binance #Futures #Backtesting #TradingBot #CryptoData
1
Article
Voir la traduction
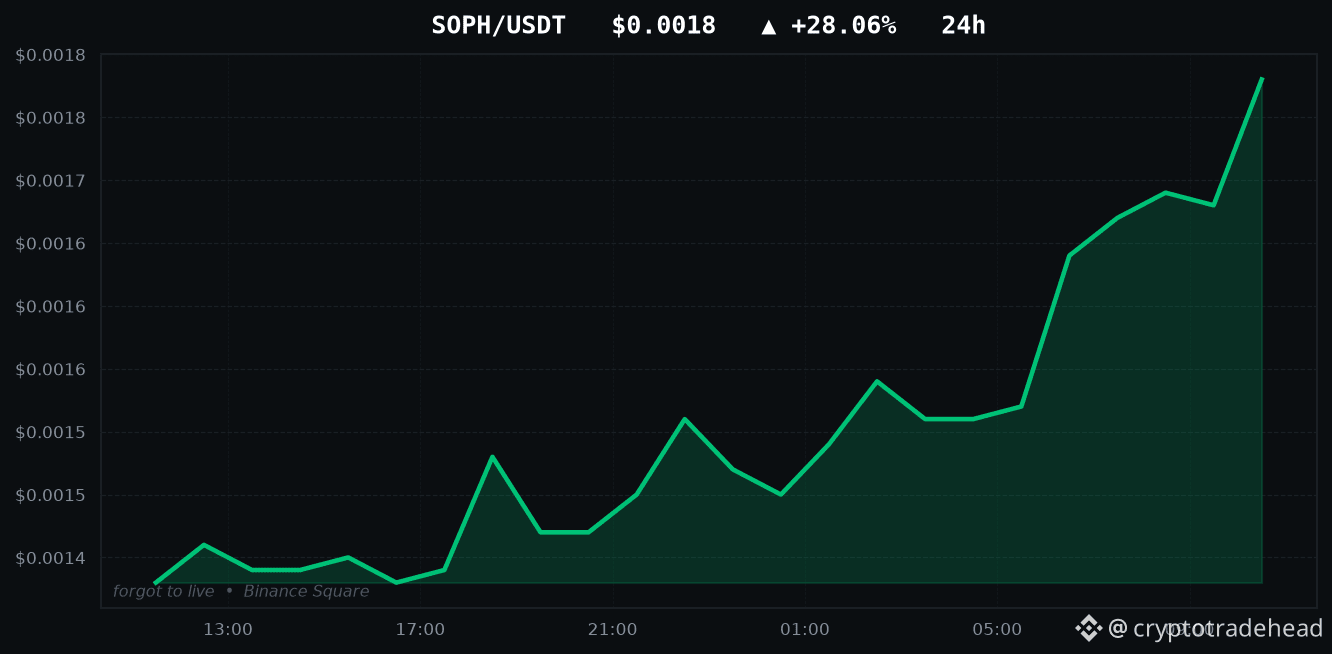
SOPH is up +28.06% - I tested both ways to trade itTODAY'S TOP GAINERS
SOPH: +28.06%
KORUB: +13.79%
HAEDAL: +11.01%
MITO: +9.80%
牛来: +9.17%
Every account on this app will show you this list. Here is the part they skip.
I backtested both ways of trading a move like SOPH's +28.06%: buying the breakout, and fading it on the assumption it reverts. Both lost money. Not narrowly - they lost roughly the transaction cost, 0.240% per round trip, which is what a signal carrying no information looks like once you charge it fees.
A large 24-hour move tells you something already happened. It does not tell you what happens next, and the data says so in both directions.
Part of a public experiment: every strategy I test gets published, working or not.
Movers above: $SOPH $KORUB $HAEDAL
#Binance #Altcoins #Futures #SOPH #CryptoData
SOPH is up +28.06% - I tested both ways to trade it
TODAY'S TOP GAINERS
SOPH: +28.06%
KORUB: +13.79%
HAEDAL: +11.01%
MITO: +9.80%
牛来: +9.17%
Every account on this app will show you this list. Here is the part they skip.
I backtested both ways of trading a move like SOPH's +28.06%: buying the breakout, and fading it on the assumption it reverts. Both lost money. Not narrowly - they lost roughly the transaction cost, 0.240% per round trip, which is what a signal carrying no information looks like once you charge it fees.
A large 24-hour move tells you something already happened. It does not tell you what happens next, and the data says so in both directions.
Part of a public experiment: every strategy I test gets published, working or not.
Movers above: $SOPH $KORUB $HAEDAL
#Binance #Altcoins #Futures #SOPH #CryptoData
SOPH: +28.06%
KORUB: +13.79%
HAEDAL: +11.01%
MITO: +9.80%
牛来: +9.17%
Every account on this app will show you this list. Here is the part they skip.
I backtested both ways of trading a move like SOPH's +28.06%: buying the breakout, and fading it on the assumption it reverts. Both lost money. Not narrowly - they lost roughly the transaction cost, 0.240% per round trip, which is what a signal carrying no information looks like once you charge it fees.
A large 24-hour move tells you something already happened. It does not tell you what happens next, and the data says so in both directions.
Part of a public experiment: every strategy I test gets published, working or not.
Movers above: $SOPH $KORUB $HAEDAL
#Binance #Altcoins #Futures #SOPH #CryptoData
Article
Voir la traduction
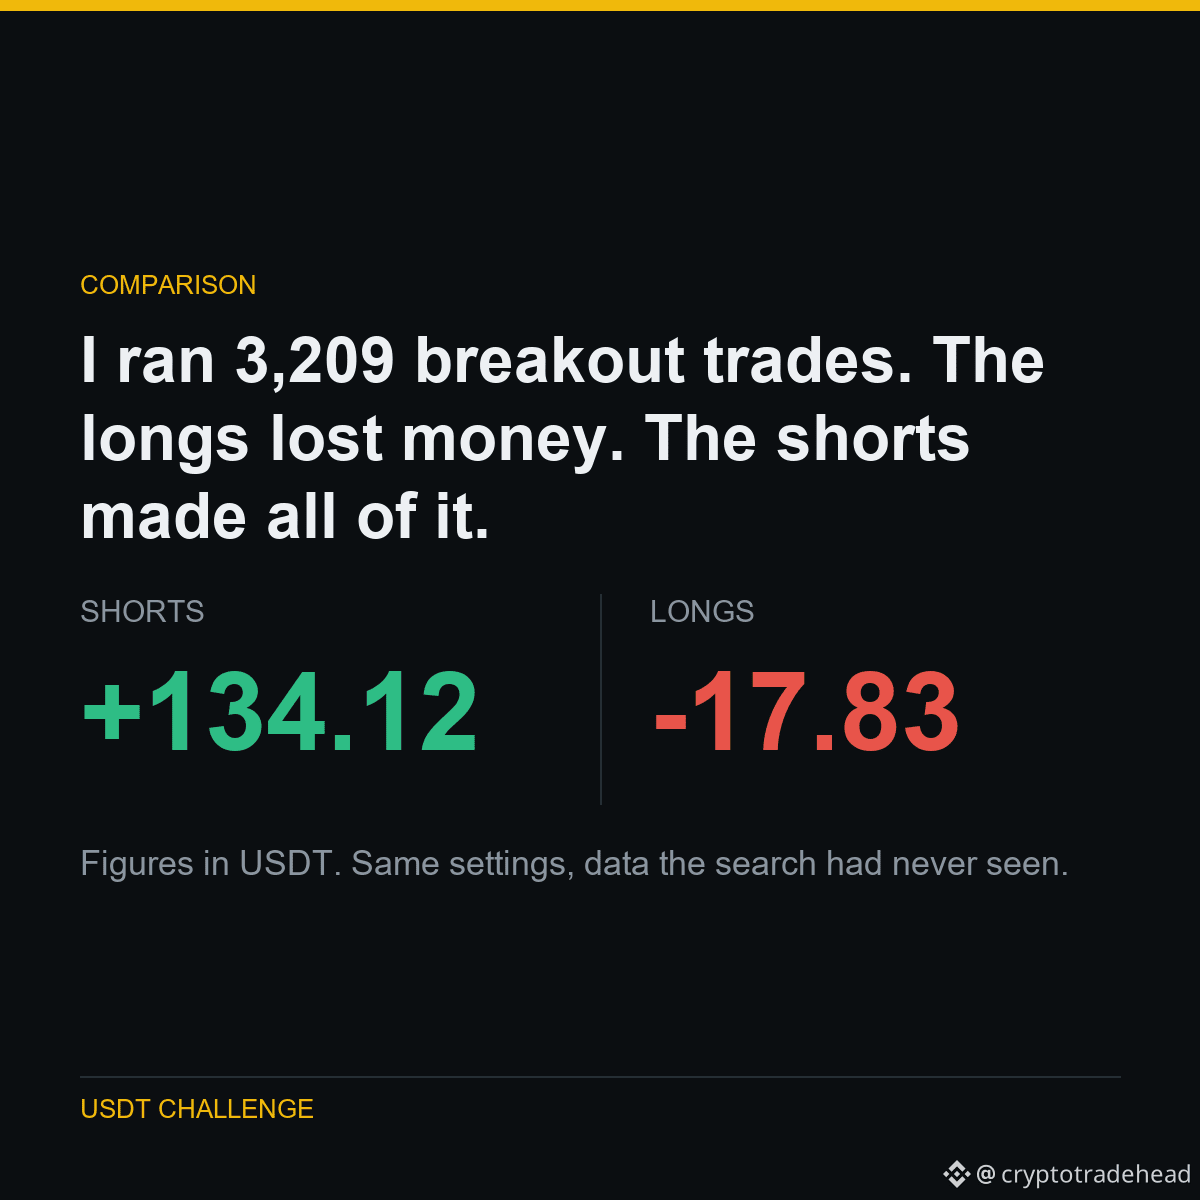
I ran 3,209 breakout trades. The longs lost money. The shorts made all of it.I ran 3,209 breakout trades. The longs lost money. The shorts made all of it.
Donchian 20 channel, ATR stop, 10 symbols, four and a half years.
If this were just riding a bull market, the longs would be the winners. They are not - they are negative.
The shorts even made money on coins that ROSE over the period. BTC gained 94% buy-and-hold, and shorting its breakdowns still returned +22.83 USDT. XRP gained 87%, shorts returned +24.27 USDT.
WHAT IT MEANS
Crypto falls faster than it rises - liquidation cascades are asymmetric. That is documented market structure, which is why this result is more believable than one that only works when everything goes up.
Part of a public experiment: 5,063 USDT to 1,000,000 USDT, every result published - including the ones that make me look bad.
Run on $BTC $XRP $LTC
#Binance #Futures #Backtesting #TradingBot #CryptoData
I ran 3,209 breakout trades. The longs lost money. The shorts made all of it.
I ran 3,209 breakout trades. The longs lost money. The shorts made all of it.
Donchian 20 channel, ATR stop, 10 symbols, four and a half years.
If this were just riding a bull market, the longs would be the winners. They are not - they are negative.
The shorts even made money on coins that ROSE over the period. BTC gained 94% buy-and-hold, and shorting its breakdowns still returned +22.83 USDT. XRP gained 87%, shorts returned +24.27 USDT.
WHAT IT MEANS
Crypto falls faster than it rises - liquidation cascades are asymmetric. That is documented market structure, which is why this result is more believable than one that only works when everything goes up.
Part of a public experiment: 5,063 USDT to 1,000,000 USDT, every result published - including the ones that make me look bad.
Run on $BTC $XRP $LTC
#Binance #Futures #Backtesting #TradingBot #CryptoData
Donchian 20 channel, ATR stop, 10 symbols, four and a half years.
If this were just riding a bull market, the longs would be the winners. They are not - they are negative.
The shorts even made money on coins that ROSE over the period. BTC gained 94% buy-and-hold, and shorting its breakdowns still returned +22.83 USDT. XRP gained 87%, shorts returned +24.27 USDT.
WHAT IT MEANS
Crypto falls faster than it rises - liquidation cascades are asymmetric. That is documented market structure, which is why this result is more believable than one that only works when everything goes up.
Part of a public experiment: 5,063 USDT to 1,000,000 USDT, every result published - including the ones that make me look bad.
Run on $BTC $XRP $LTC
#Binance #Futures #Backtesting #TradingBot #CryptoData
6
Voir la traduction
HOW I TESTED IT
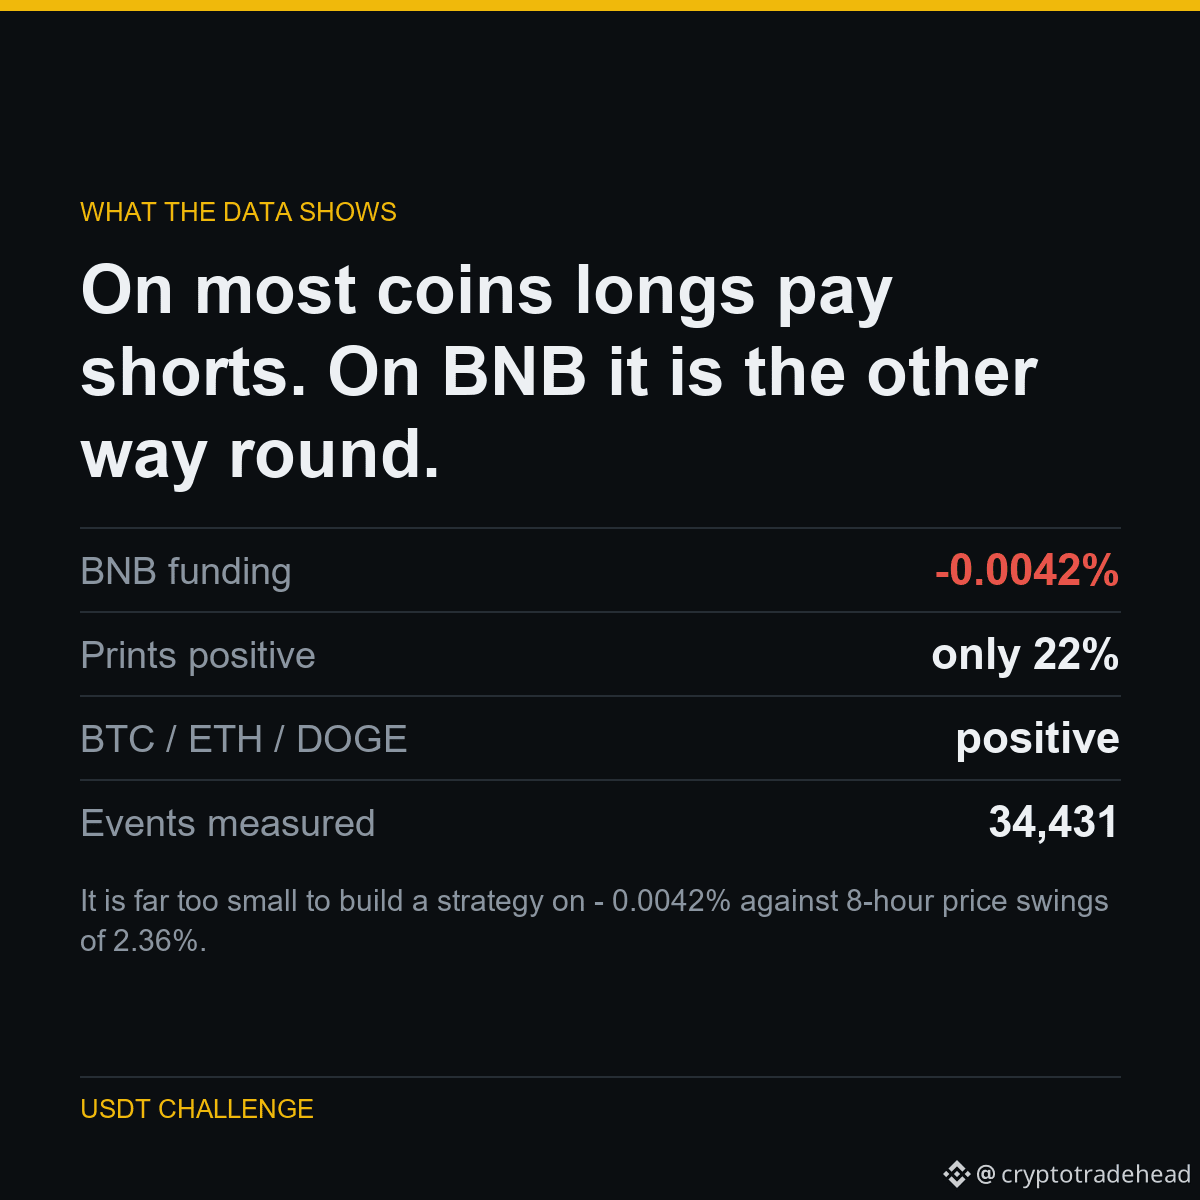
Funding is the payment between long and short holders of a perpetual. Positive means longs pay shorts, which is the usual state of a market where most people are betting up.
Across 34,431 prints, BNB averages NEGATIVE funding - shorts pay longs - and only 22% of its prints are positive. BTC, ETH and DOGE are all positive.
So holding a long BNB perp is paid to exist, where a long BTC perp pays rent.
THE NUMBERS
BNB funding: -0.0042%
Prints positive: only 22%
BTC / ETH / DOGE: positive
Events measured: 34,431
It is far too small to build a strategy on - 0.0042% against 8-hour price swings of 2.36%. But if you are already holding a position, the direction of funding is not the same on every coin, and most people assume it is.
Part of a public experiment: 5,063 USDT to 1,000,000 USDT, every result published - including the ones that make me look bad.
Run on $BNB $BTC $ETH
#Binance #Futures #Backtesting #TradingBot #CryptoData
HOW I TESTED IT
Funding is the payment between long and short holders of a perpetual. Positive means longs pay shorts, which is the usual state of a market where most people are betting up.
Across 34,431 prints, BNB averages NEGATIVE funding - shorts pay longs - and only 22% of its prints are positive. BTC, ETH and DOGE are all positive.
So holding a long BNB perp is paid to exist, where a long BTC perp pays rent.
THE NUMBERS
BNB funding: -0.0042%
Prints positive: only 22%
BTC / ETH / DOGE: positive
Events measured: 34,431
It is far too small to build a strategy on - 0.0042% against 8-hour price swings of 2.36%. But if you are already holding a position, the direction of funding is not the same on every coin, and most people assume it is.
Part of a public experiment: 5,063 USDT to 1,000,000 USDT, every result published - including the ones that make me look bad.
Run on $BNB $BTC $ETH
#Binance #Futures #Backtesting #TradingBot #CryptoData
Funding is the payment between long and short holders of a perpetual. Positive means longs pay shorts, which is the usual state of a market where most people are betting up.
Across 34,431 prints, BNB averages NEGATIVE funding - shorts pay longs - and only 22% of its prints are positive. BTC, ETH and DOGE are all positive.
So holding a long BNB perp is paid to exist, where a long BTC perp pays rent.
THE NUMBERS
BNB funding: -0.0042%
Prints positive: only 22%
BTC / ETH / DOGE: positive
Events measured: 34,431
It is far too small to build a strategy on - 0.0042% against 8-hour price swings of 2.36%. But if you are already holding a position, the direction of funding is not the same on every coin, and most people assume it is.
Part of a public experiment: 5,063 USDT to 1,000,000 USDT, every result published - including the ones that make me look bad.
Run on $BNB $BTC $ETH
#Binance #Futures #Backtesting #TradingBot #CryptoData
Article
Voir la traduction
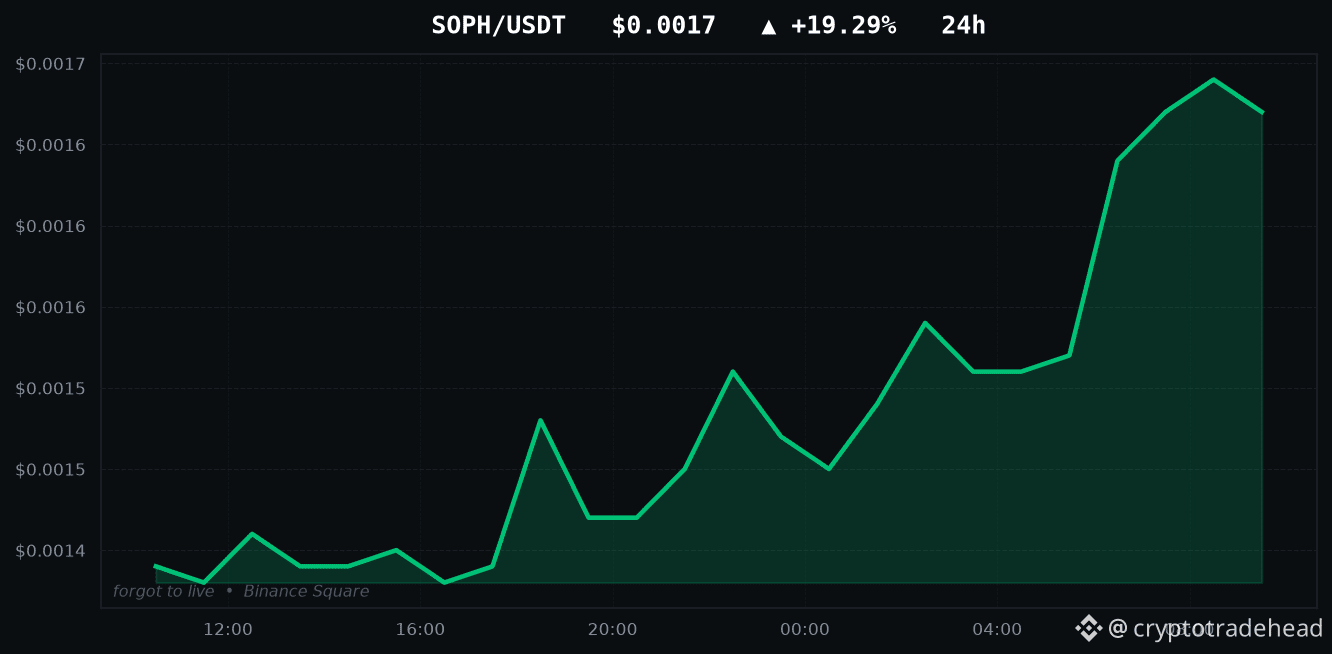
SOPH is up +19.29% - I tested both ways to trade itTODAY'S TOP GAINERS
SOPH: +19.29%
牛来: +14.54%
KORUB: +12.56%
HAEDAL: +9.82%
MITO: +8.70%
Every account on this app will show you this list. Here is the part they skip.
I backtested both ways of trading a move like SOPH's +19.29%: buying the breakout, and fading it on the assumption it reverts. Both lost money. Not narrowly - they lost roughly the transaction cost, 0.240% per round trip, which is what a signal carrying no information looks like once you charge it fees.
A large 24-hour move tells you something already happened. It does not tell you what happens next, and the data says so in both directions.
Part of a public experiment: every strategy I test gets published, working or not.
Movers above: $SOPH $牛来 $KORUB
#Binance #Altcoins #Futures #SOPH #CryptoData
SOPH is up +19.29% - I tested both ways to trade it
TODAY'S TOP GAINERS
SOPH: +19.29%
牛来: +14.54%
KORUB: +12.56%
HAEDAL: +9.82%
MITO: +8.70%
Every account on this app will show you this list. Here is the part they skip.
I backtested both ways of trading a move like SOPH's +19.29%: buying the breakout, and fading it on the assumption it reverts. Both lost money. Not narrowly - they lost roughly the transaction cost, 0.240% per round trip, which is what a signal carrying no information looks like once you charge it fees.
A large 24-hour move tells you something already happened. It does not tell you what happens next, and the data says so in both directions.
Part of a public experiment: every strategy I test gets published, working or not.
Movers above: $SOPH $牛来 $KORUB
#Binance #Altcoins #Futures #SOPH #CryptoData
SOPH: +19.29%
牛来: +14.54%
KORUB: +12.56%
HAEDAL: +9.82%
MITO: +8.70%
Every account on this app will show you this list. Here is the part they skip.
I backtested both ways of trading a move like SOPH's +19.29%: buying the breakout, and fading it on the assumption it reverts. Both lost money. Not narrowly - they lost roughly the transaction cost, 0.240% per round trip, which is what a signal carrying no information looks like once you charge it fees.
A large 24-hour move tells you something already happened. It does not tell you what happens next, and the data says so in both directions.
Part of a public experiment: every strategy I test gets published, working or not.
Movers above: $SOPH $牛来 $KORUB
#Binance #Altcoins #Futures #SOPH #CryptoData
4
Voir la traduction
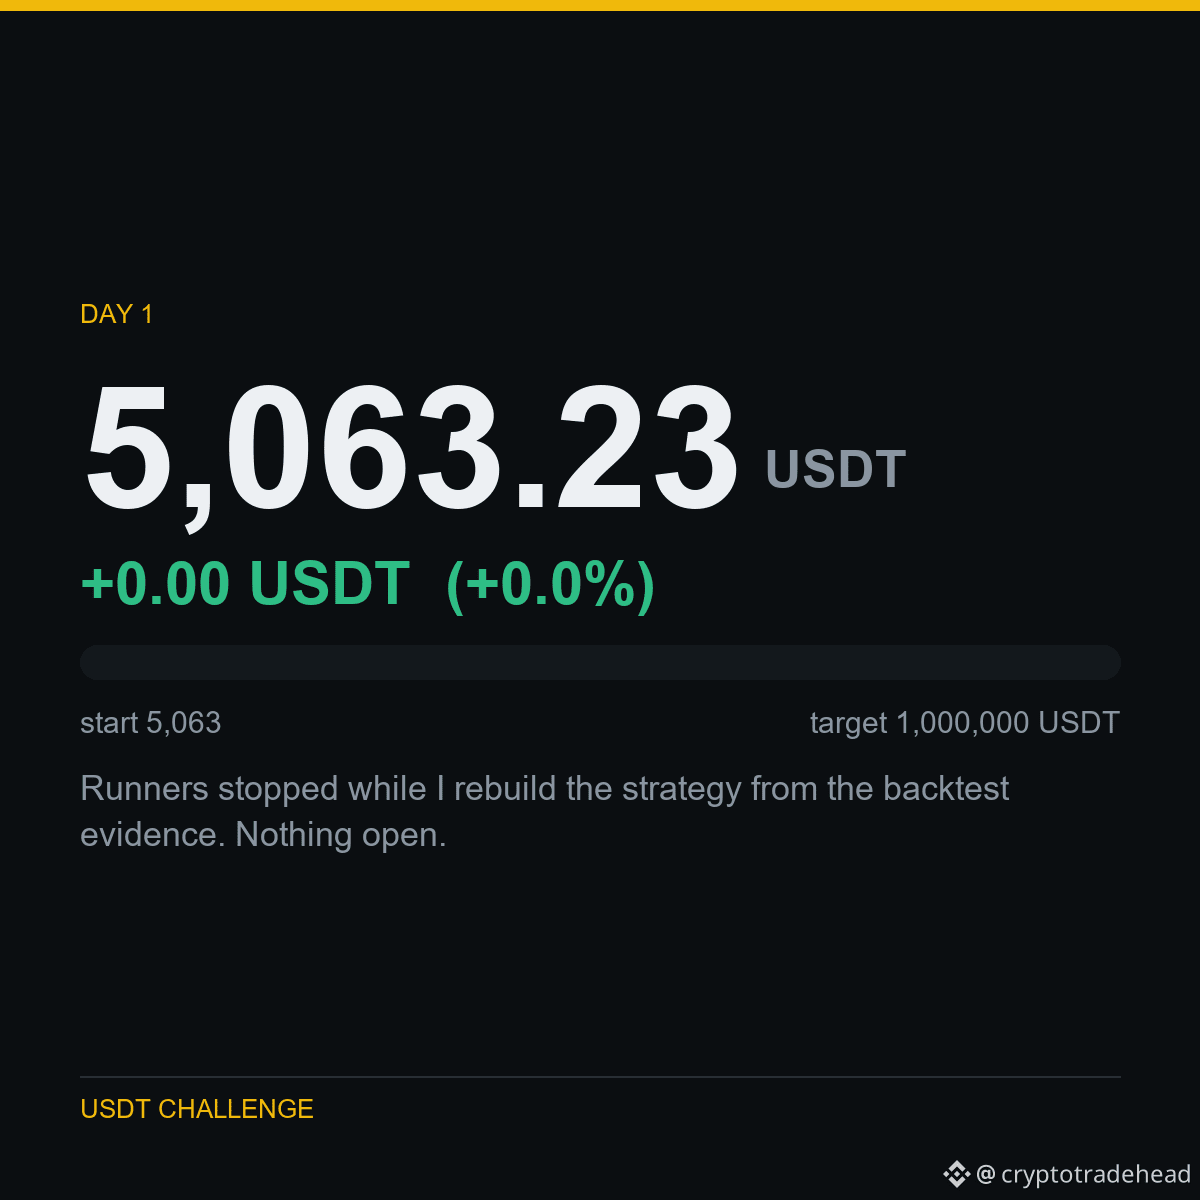
DAY 1 - 5,063 USDT to 1,000,000 USDT
Balance: 5,063.23 USDT
Change: +0.00 USDT (+0.0%)
Runners stopped while I rebuild the strategy from the backtest evidence. Nothing open.
Running on a Binance testnet account, so this is demo capital - I would rather say that than let you assume otherwise. The strategy, the costs and the losses are all real.
No signals for sale, no course, no affiliate link. Just the account and the data behind it.
Traded in this challenge: $BTC $SOL $AVAX
#Binance #USDT #Futures #TradingChallenge #Crypto
DAY 1 - 5,063 USDT to 1,000,000 USDT
Balance: 5,063.23 USDT
Change: +0.00 USDT (+0.0%)
Runners stopped while I rebuild the strategy from the backtest evidence. Nothing open.
Running on a Binance testnet account, so this is demo capital - I would rather say that than let you assume otherwise. The strategy, the costs and the losses are all real.
No signals for sale, no course, no affiliate link. Just the account and the data behind it.
Traded in this challenge: $BTC $SOL $AVAX
#Binance #USDT #Futures #TradingChallenge #Crypto
Balance: 5,063.23 USDT
Change: +0.00 USDT (+0.0%)
Runners stopped while I rebuild the strategy from the backtest evidence. Nothing open.
Running on a Binance testnet account, so this is demo capital - I would rather say that than let you assume otherwise. The strategy, the costs and the losses are all real.
No signals for sale, no course, no affiliate link. Just the account and the data behind it.
Traded in this challenge: $BTC $SOL $AVAX
#Binance #USDT #Futures #TradingChallenge #Crypto
5
COMMENT JE L’AI TESTÉ
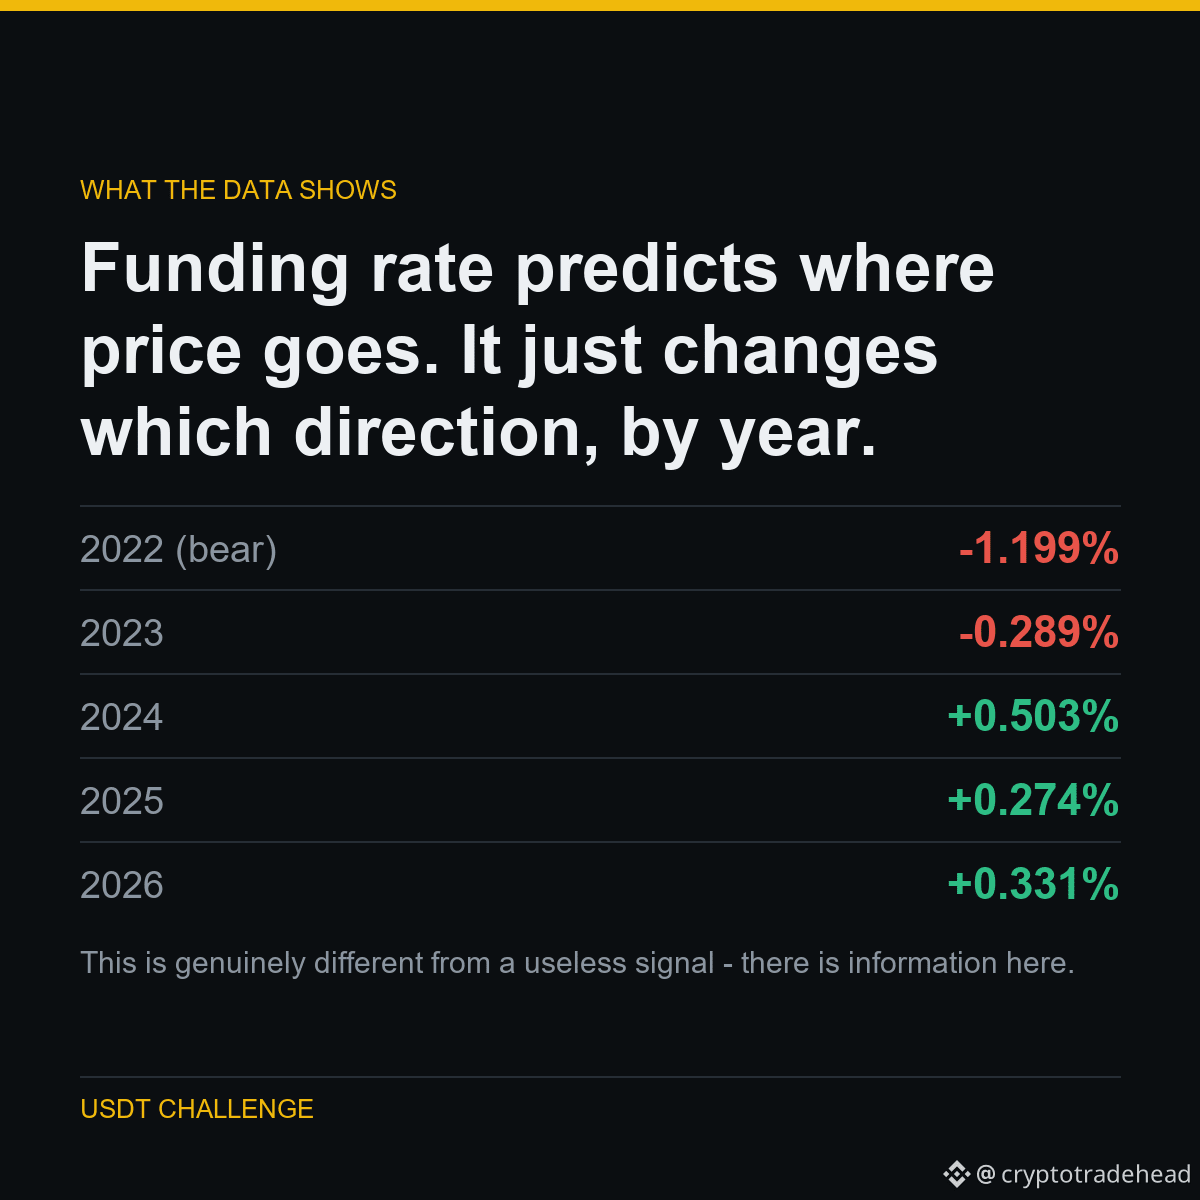
J’ai réparti chaque relevé de financement en quintiles et mesuré le rendement sur les 72 heures suivantes du quintile le plus élevé par rapport au plus faible.
Sur les marchés baissiers, un financement élevé précédait de PIRES rendements — les positions longues surchargées se faisaient presser. À partir de 2024, il précédait de MEILLEURS rendements — signe de momentum.
Le signal est réel. Son signe n’est pas stable. En faisant la moyenne sur toutes les années, on obtient -0.08 %, soit moins que les 0.240 % de frais de transaction.
LES CHIFFRES
2022 (marché baissier) : -1.199 %
2023 : -0.289 %
2024 : +0.503 %
2025 : +0.274 %
2026 : +0.331 %
Ce signal est vraiment différent d’un signal inutile : il contient des informations. Mais pour l’utiliser, il faudrait connaître le régime à l’avance, et c’est le même problème circulaire qui fait échouer tout le reste.
Dans le cadre d’une expérience publique : de 5,063 USDT à 1,000,000 USDT, tous les résultats publiés — y compris ceux qui me desservent.
Exécuté sur $BTC $ETH $DOGE
#Binance #Futures #Backtesting #TradingBot #CryptoData
COMMENT JE L’AI TESTÉ
J’ai réparti chaque relevé de financement en quintiles et mesuré le rendement sur les 72 heures suivantes du quintile le plus élevé par rapport au plus faible.
Sur les marchés baissiers, un financement élevé précédait de PIRES rendements — les positions longues surchargées se faisaient presser. À partir de 2024, il précédait de MEILLEURS rendements — signe de momentum.
Le signal est réel. Son signe n’est pas stable. En faisant la moyenne sur toutes les années, on obtient -0.08 %, soit moins que les 0.240 % de frais de transaction.
LES CHIFFRES
2022 (marché baissier) : -1.199 %
2023 : -0.289 %
2024 : +0.503 %
2025 : +0.274 %
2026 : +0.331 %
Ce signal est vraiment différent d’un signal inutile : il contient des informations. Mais pour l’utiliser, il faudrait connaître le régime à l’avance, et c’est le même problème circulaire qui fait échouer tout le reste.
Dans le cadre d’une expérience publique : de 5,063 USDT à 1,000,000 USDT, tous les résultats publiés — y compris ceux qui me desservent.
Exécuté sur $BTC $ETH $DOGE
#Binance #Futures #Backtesting #TradingBot #CryptoData
J’ai réparti chaque relevé de financement en quintiles et mesuré le rendement sur les 72 heures suivantes du quintile le plus élevé par rapport au plus faible.
Sur les marchés baissiers, un financement élevé précédait de PIRES rendements — les positions longues surchargées se faisaient presser. À partir de 2024, il précédait de MEILLEURS rendements — signe de momentum.
Le signal est réel. Son signe n’est pas stable. En faisant la moyenne sur toutes les années, on obtient -0.08 %, soit moins que les 0.240 % de frais de transaction.
LES CHIFFRES
2022 (marché baissier) : -1.199 %
2023 : -0.289 %
2024 : +0.503 %
2025 : +0.274 %
2026 : +0.331 %
Ce signal est vraiment différent d’un signal inutile : il contient des informations. Mais pour l’utiliser, il faudrait connaître le régime à l’avance, et c’est le même problème circulaire qui fait échouer tout le reste.
Dans le cadre d’une expérience publique : de 5,063 USDT à 1,000,000 USDT, tous les résultats publiés — y compris ceux qui me desservent.
Exécuté sur $BTC $ETH $DOGE
#Binance #Futures #Backtesting #TradingBot #CryptoData
2
Article
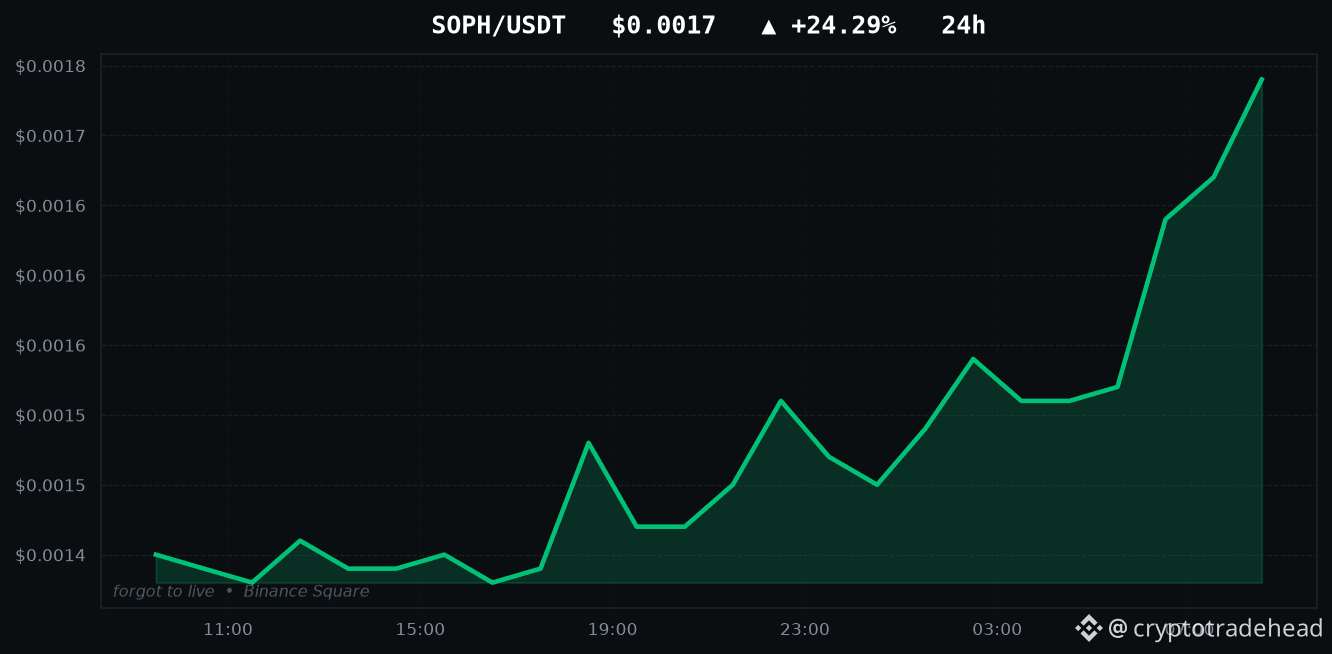
SOPH est en hausse de +24.29 % — j’ai testé les deux façons de le traderLES PLUS FORTES HAUSSES DU JOUR
SOPH : +24.29 %
HOT : +13.48 %
Le bœuf arrive : +11.26 %
KORUB : +11.07 %
TRUMP : +9.11 %
Tous les comptes de cette application vous montreront cette liste. Voici ce qu’ils ne vous disent pas.
J’ai testé rétrospectivement les deux façons de trader un mouvement comme celui de SOPH (+24.29 %) : acheter la cassure, ou parier contre elle en supposant que le cours revient à son niveau initial. Les deux stratégies ont fait perdre de l’argent. Et pas de peu : elles ont perdu à peu près l’équivalent des frais de transaction, soit 0.240 % par aller-retour — c’est ce que donne un signal sans information une fois les frais pris en compte.
Une forte variation sur 24 heures vous indique que quelque chose s’est déjà produit. Elle ne vous dit pas ce qui va se passer ensuite, et les données le confirment dans les deux sens.
SOPH est en hausse de +24.29 % — j’ai testé les deux façons de le trader
LES PLUS FORTES HAUSSES DU JOUR
SOPH : +24.29 %
HOT : +13.48 %
Le bœuf arrive : +11.26 %
KORUB : +11.07 %
TRUMP : +9.11 %
Tous les comptes de cette application vous montreront cette liste. Voici ce qu’ils ne vous disent pas.
J’ai testé rétrospectivement les deux façons de trader un mouvement comme celui de SOPH (+24.29 %) : acheter la cassure, ou parier contre elle en supposant que le cours revient à son niveau initial. Les deux stratégies ont fait perdre de l’argent. Et pas de peu : elles ont perdu à peu près l’équivalent des frais de transaction, soit 0.240 % par aller-retour — c’est ce que donne un signal sans information une fois les frais pris en compte.
Une forte variation sur 24 heures vous indique que quelque chose s’est déjà produit. Elle ne vous dit pas ce qui va se passer ensuite, et les données le confirment dans les deux sens.
SOPH : +24.29 %
HOT : +13.48 %
Le bœuf arrive : +11.26 %
KORUB : +11.07 %
TRUMP : +9.11 %
Tous les comptes de cette application vous montreront cette liste. Voici ce qu’ils ne vous disent pas.
J’ai testé rétrospectivement les deux façons de trader un mouvement comme celui de SOPH (+24.29 %) : acheter la cassure, ou parier contre elle en supposant que le cours revient à son niveau initial. Les deux stratégies ont fait perdre de l’argent. Et pas de peu : elles ont perdu à peu près l’équivalent des frais de transaction, soit 0.240 % par aller-retour — c’est ce que donne un signal sans information une fois les frais pris en compte.
Une forte variation sur 24 heures vous indique que quelque chose s’est déjà produit. Elle ne vous dit pas ce qui va se passer ensuite, et les données le confirment dans les deux sens.
7
COMMENT JE L’AI TESTÉ
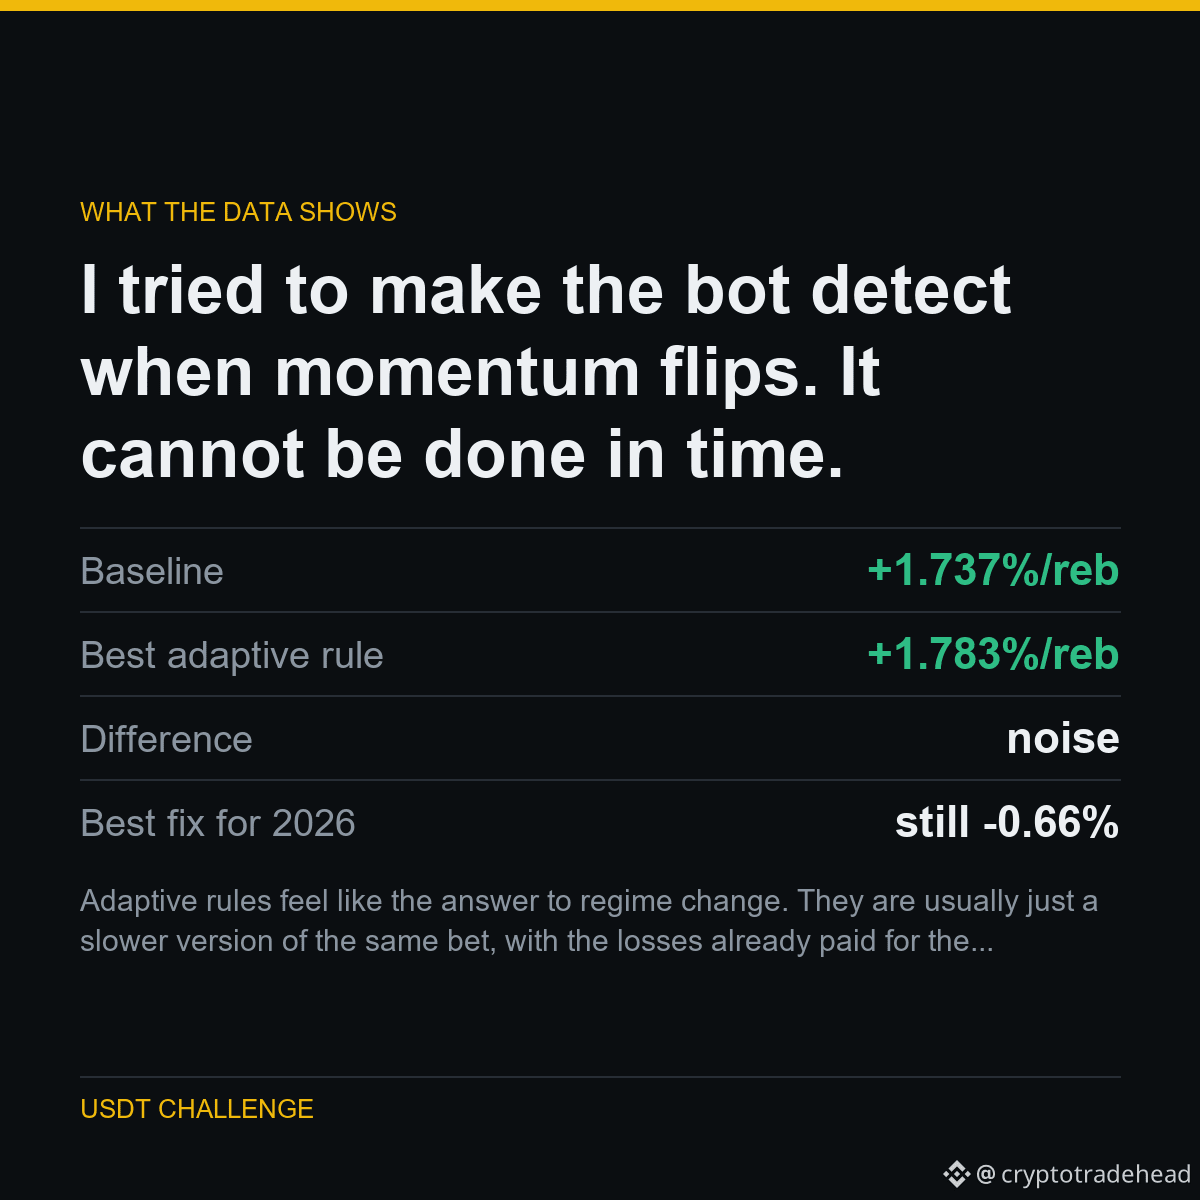
Le momentum s’est inversé en 2026. La solution évidente : surveiller les performances récentes et passer à la règle opposée lorsque le momentum cesse d’être rentable.
J’ai testé cette approche sur six fenêtres rétrospectives différentes. La meilleure a rapporté +1.783% par rééquilibrage, contre une référence de +1.737% — un écart impossible à distinguer du bruit. Toutes les autres fenêtres ont donné de moins bons résultats. Aucune n’a corrigé le problème de 2026.
La raison est simple : quand les performances passées vous indiquent que le régime a changé, vous avez déjà subi les pertes qui vous l’ont appris.
LES CHIFFRES
Référence : +1.737%/rééquilibrage
Meilleure règle adaptative : +1.783%/rééquilibrage
Écart : du bruit
Meilleure solution pour 2026 : toujours -0.66%
Les règles adaptatives semblent être la réponse aux changements de régime. En général, ce n’est qu’une version plus lente du même pari, dont les pertes ont déjà été encaissées pour obtenir le signal.
Dans le cadre d’une expérience publique : de 5,063 USDT à 1,000,000 USDT, chaque résultat est publié — y compris ceux qui me font mal paraître.
Exécuté sur $SOL $BTC
#Binance #Futures #Backtesting #TradingBot #CryptoData
COMMENT JE L’AI TESTÉ
Le momentum s’est inversé en 2026. La solution évidente : surveiller les performances récentes et passer à la règle opposée lorsque le momentum cesse d’être rentable.
J’ai testé cette approche sur six fenêtres rétrospectives différentes. La meilleure a rapporté +1.783% par rééquilibrage, contre une référence de +1.737% — un écart impossible à distinguer du bruit. Toutes les autres fenêtres ont donné de moins bons résultats. Aucune n’a corrigé le problème de 2026.
La raison est simple : quand les performances passées vous indiquent que le régime a changé, vous avez déjà subi les pertes qui vous l’ont appris.
LES CHIFFRES
Référence : +1.737%/rééquilibrage
Meilleure règle adaptative : +1.783%/rééquilibrage
Écart : du bruit
Meilleure solution pour 2026 : toujours -0.66%
Les règles adaptatives semblent être la réponse aux changements de régime. En général, ce n’est qu’une version plus lente du même pari, dont les pertes ont déjà été encaissées pour obtenir le signal.
Dans le cadre d’une expérience publique : de 5,063 USDT à 1,000,000 USDT, chaque résultat est publié — y compris ceux qui me font mal paraître.
Exécuté sur $SOL $BTC
#Binance #Futures #Backtesting #TradingBot #CryptoData
Le momentum s’est inversé en 2026. La solution évidente : surveiller les performances récentes et passer à la règle opposée lorsque le momentum cesse d’être rentable.
J’ai testé cette approche sur six fenêtres rétrospectives différentes. La meilleure a rapporté +1.783% par rééquilibrage, contre une référence de +1.737% — un écart impossible à distinguer du bruit. Toutes les autres fenêtres ont donné de moins bons résultats. Aucune n’a corrigé le problème de 2026.
La raison est simple : quand les performances passées vous indiquent que le régime a changé, vous avez déjà subi les pertes qui vous l’ont appris.
LES CHIFFRES
Référence : +1.737%/rééquilibrage
Meilleure règle adaptative : +1.783%/rééquilibrage
Écart : du bruit
Meilleure solution pour 2026 : toujours -0.66%
Les règles adaptatives semblent être la réponse aux changements de régime. En général, ce n’est qu’une version plus lente du même pari, dont les pertes ont déjà été encaissées pour obtenir le signal.
Dans le cadre d’une expérience publique : de 5,063 USDT à 1,000,000 USDT, chaque résultat est publié — y compris ceux qui me font mal paraître.
Exécuté sur $SOL $BTC
#Binance #Futures #Backtesting #TradingBot #CryptoData
Article
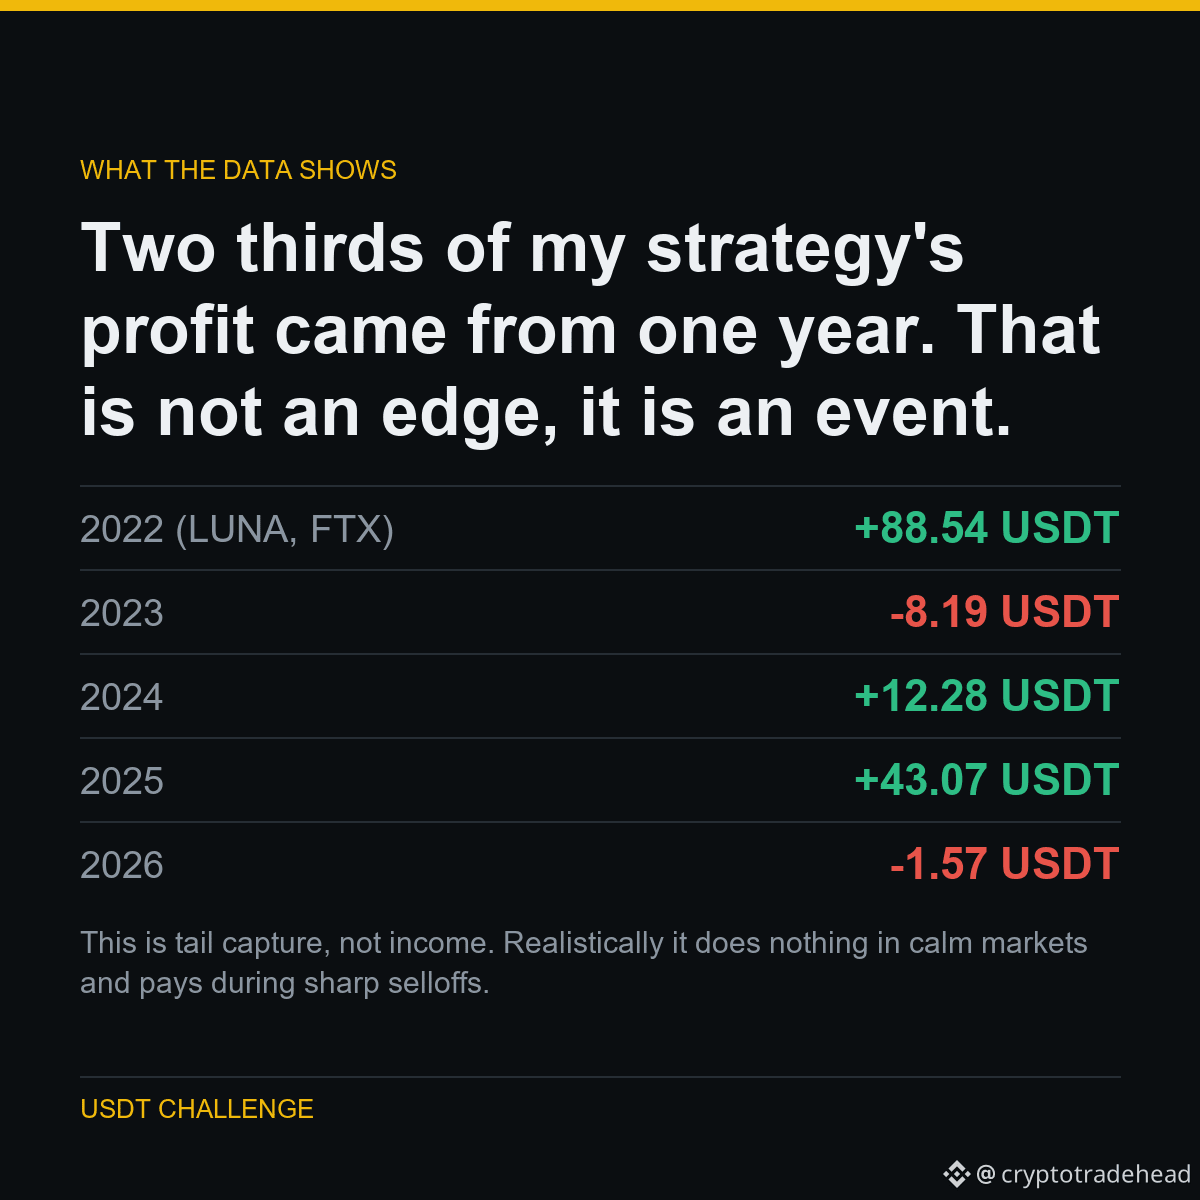
Les deux tiers des profits de ma stratégie proviennent d’une seule année. Ce n’est pas un avantage, c’est un événementLes deux tiers des profits de ma stratégie proviennent d’une seule année. Ce n’est pas un avantage, c’est un événement.
Le chiffre mis en avant était de +134,12 USDT grâce aux cassures baissières. Puis, j’ai ventilé le résultat par année.
2022 — l’année de l’effondrement de LUNA et de la faillite de FTX — en a généré 88,54. En retirant cette année, quatre années de trading ont rapporté 45,59 USDT, dont la majeure partie en 2025.
Jusqu’ici, 2026 est à l’équilibre.
CE QUE CELA SIGNIFIE
Il s’agit de capter les mouvements extrêmes, pas de générer des revenus. En pratique, cette stratégie ne fait rien sur des marchés calmes et rapporte lors de fortes chutes. S’attendre à ce qu’elle rapporte chaque mois, c’est risquer d’abandonner une stratégie juste avant qu’elle ne fonctionne.
Les deux tiers des profits de ma stratégie proviennent d’une seule année. Ce n’est pas un avantage, c’est un événement
Les deux tiers des profits de ma stratégie proviennent d’une seule année. Ce n’est pas un avantage, c’est un événement.
Le chiffre mis en avant était de +134,12 USDT grâce aux cassures baissières. Puis, j’ai ventilé le résultat par année.
2022 — l’année de l’effondrement de LUNA et de la faillite de FTX — en a généré 88,54. En retirant cette année, quatre années de trading ont rapporté 45,59 USDT, dont la majeure partie en 2025.
Jusqu’ici, 2026 est à l’équilibre.
CE QUE CELA SIGNIFIE
Il s’agit de capter les mouvements extrêmes, pas de générer des revenus. En pratique, cette stratégie ne fait rien sur des marchés calmes et rapporte lors de fortes chutes. S’attendre à ce qu’elle rapporte chaque mois, c’est risquer d’abandonner une stratégie juste avant qu’elle ne fonctionne.
Le chiffre mis en avant était de +134,12 USDT grâce aux cassures baissières. Puis, j’ai ventilé le résultat par année.
2022 — l’année de l’effondrement de LUNA et de la faillite de FTX — en a généré 88,54. En retirant cette année, quatre années de trading ont rapporté 45,59 USDT, dont la majeure partie en 2025.
Jusqu’ici, 2026 est à l’équilibre.
CE QUE CELA SIGNIFIE
Il s’agit de capter les mouvements extrêmes, pas de générer des revenus. En pratique, cette stratégie ne fait rien sur des marchés calmes et rapporte lors de fortes chutes. S’attendre à ce qu’elle rapporte chaque mois, c’est risquer d’abandonner une stratégie juste avant qu’elle ne fonctionne.
2
Article
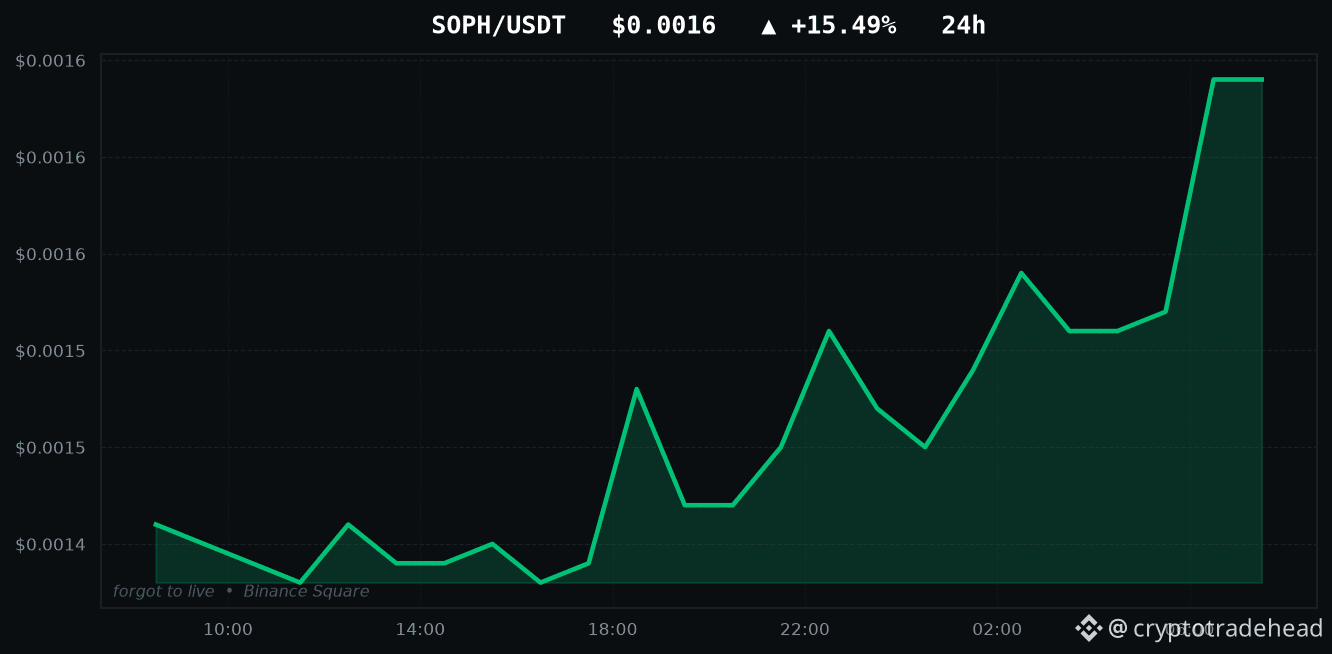
SOPH est en hausse de +15.49 % : j’ai testé les deux façons de la traderLES PLUS FORTES HAUSSES DU JOUR
SOPH : +15.49%
INIT : +10.73%
Le bœuf arrive : +9.55%
KORUB : +8.92%
MITO : +8.75%
Tous les comptes de cette application vous montreront cette liste. Voici la partie qu’ils passent sous silence.
J’ai testé rétrospectivement les deux façons de trader un mouvement comme celui de SOPH (+15.49 %) : acheter la cassure, ou parier contre le mouvement en supposant qu’il s’inversera. Les deux ont fait perdre de l’argent. Pas de peu : les pertes correspondaient à peu près aux frais de transaction, soit 0.240 % par aller-retour. C’est ce que donne un signal sans valeur prédictive une fois les frais pris en compte.
Une forte variation sur 24 heures vous indique qu’il s’est déjà passé quelque chose. Elle ne vous dit pas ce qui va se passer ensuite, et les données le confirment dans les deux sens.
SOPH est en hausse de +15.49 % : j’ai testé les deux façons de la trader
LES PLUS FORTES HAUSSES DU JOUR
SOPH : +15.49%
INIT : +10.73%
Le bœuf arrive : +9.55%
KORUB : +8.92%
MITO : +8.75%
Tous les comptes de cette application vous montreront cette liste. Voici la partie qu’ils passent sous silence.
J’ai testé rétrospectivement les deux façons de trader un mouvement comme celui de SOPH (+15.49 %) : acheter la cassure, ou parier contre le mouvement en supposant qu’il s’inversera. Les deux ont fait perdre de l’argent. Pas de peu : les pertes correspondaient à peu près aux frais de transaction, soit 0.240 % par aller-retour. C’est ce que donne un signal sans valeur prédictive une fois les frais pris en compte.
Une forte variation sur 24 heures vous indique qu’il s’est déjà passé quelque chose. Elle ne vous dit pas ce qui va se passer ensuite, et les données le confirment dans les deux sens.
SOPH : +15.49%
INIT : +10.73%
Le bœuf arrive : +9.55%
KORUB : +8.92%
MITO : +8.75%
Tous les comptes de cette application vous montreront cette liste. Voici la partie qu’ils passent sous silence.
J’ai testé rétrospectivement les deux façons de trader un mouvement comme celui de SOPH (+15.49 %) : acheter la cassure, ou parier contre le mouvement en supposant qu’il s’inversera. Les deux ont fait perdre de l’argent. Pas de peu : les pertes correspondaient à peu près aux frais de transaction, soit 0.240 % par aller-retour. C’est ce que donne un signal sans valeur prédictive une fois les frais pris en compte.
Une forte variation sur 24 heures vous indique qu’il s’est déjà passé quelque chose. Elle ne vous dit pas ce qui va se passer ensuite, et les données le confirment dans les deux sens.
15
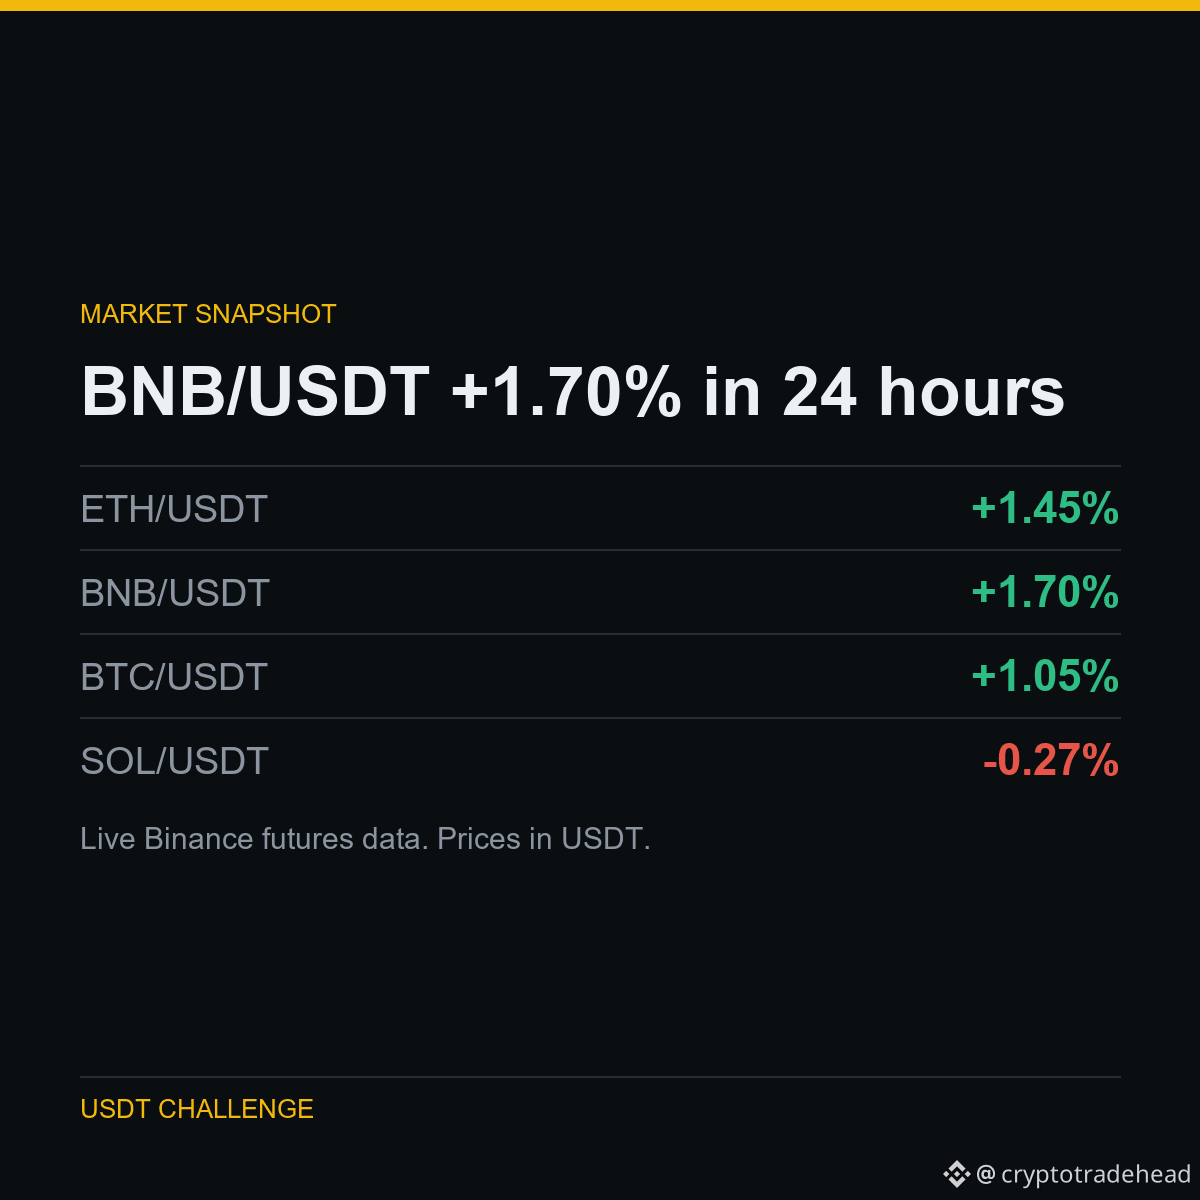
APERÇU SUR 24 H
ETH/USDT : 2,296.65 USDT (+1.45%)
BNB/USDT : 714.80 USDT (+1.70%)
BTC/USDT : 78,494.30 USDT (+1.05%)
SOL/USDT : 95.19 USDT (-0.27%)
Le taux de financement du BNB/USDT est de +0.0057 % toutes les 8 h.
Contexte, pas un signal : je ne publie ni points d’entrée ni objectifs. Toutes mes transactions sont consignées et publiées après coup, qu’elles soient gagnantes ou perdantes.
Mentionné ci-dessus : $BNB $ETH $BTC
#Binance #Crypto #Futures #BTC #Altcoins
APERÇU SUR 24 H
ETH/USDT : 2,296.65 USDT (+1.45%)
BNB/USDT : 714.80 USDT (+1.70%)
BTC/USDT : 78,494.30 USDT (+1.05%)
SOL/USDT : 95.19 USDT (-0.27%)
Le taux de financement du BNB/USDT est de +0.0057 % toutes les 8 h.
Contexte, pas un signal : je ne publie ni points d’entrée ni objectifs. Toutes mes transactions sont consignées et publiées après coup, qu’elles soient gagnantes ou perdantes.
Mentionné ci-dessus : $BNB $ETH $BTC
#Binance #Crypto #Futures #BTC #Altcoins
ETH/USDT : 2,296.65 USDT (+1.45%)
BNB/USDT : 714.80 USDT (+1.70%)
BTC/USDT : 78,494.30 USDT (+1.05%)
SOL/USDT : 95.19 USDT (-0.27%)
Le taux de financement du BNB/USDT est de +0.0057 % toutes les 8 h.
Contexte, pas un signal : je ne publie ni points d’entrée ni objectifs. Toutes mes transactions sont consignées et publiées après coup, qu’elles soient gagnantes ou perdantes.
Mentionné ci-dessus : $BNB $ETH $BTC
#Binance #Crypto #Futures #BTC #Altcoins
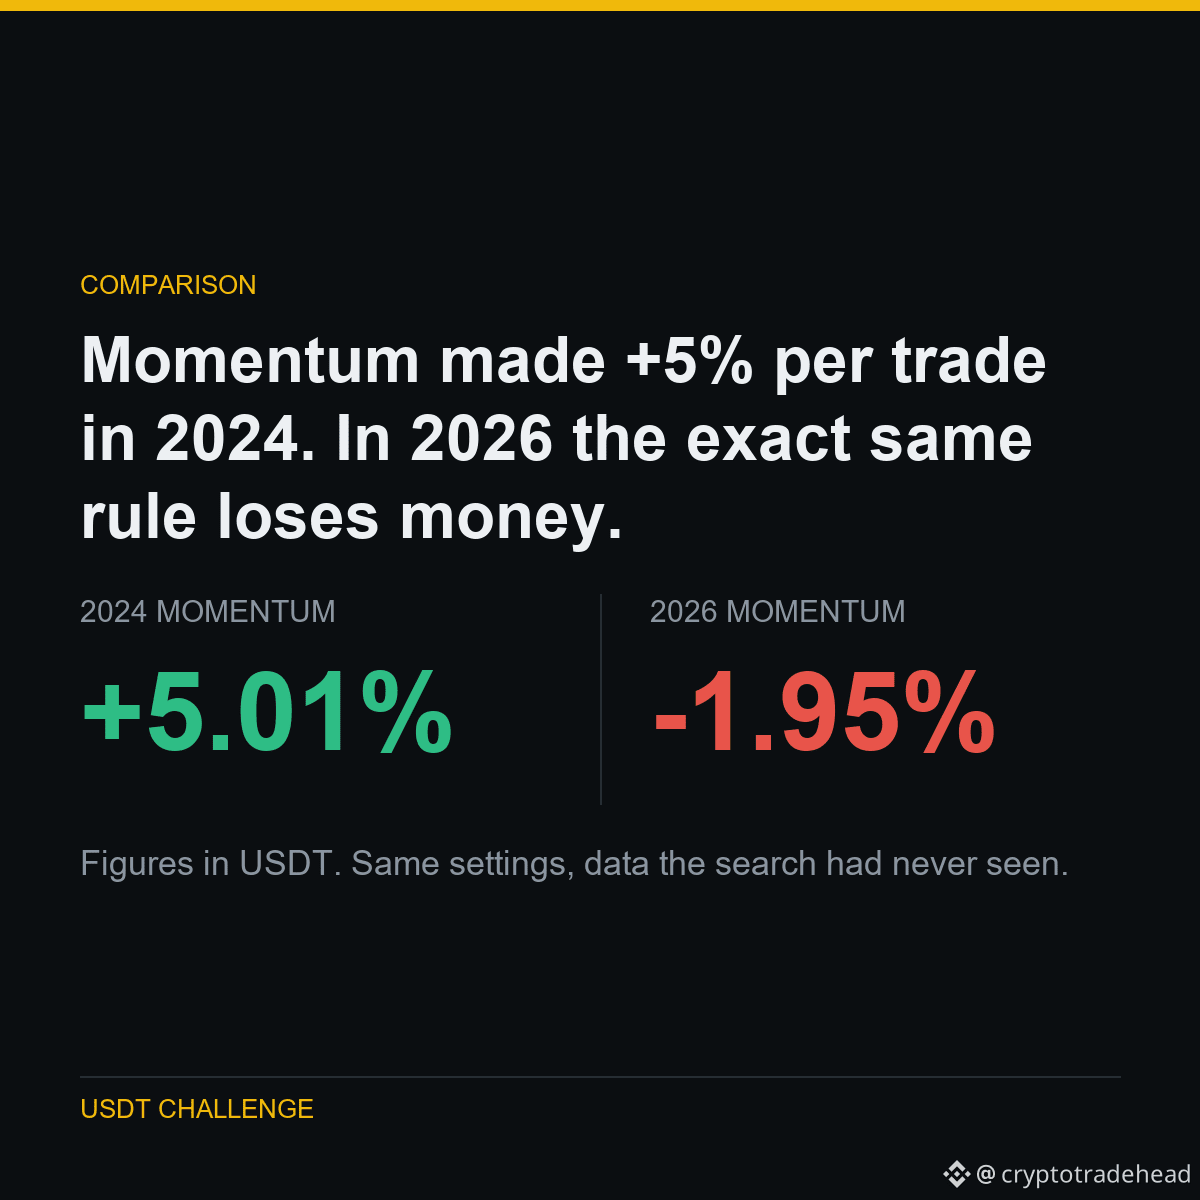
COMMENT JE L’AI TESTÉ
Même univers, même règle de classement, même période de détention, cinq années différentes.
2024 et 2025 ont porté toute la stratégie. 2026 est la pire des cinq années : un taux de réussite de 25 % sur environ neuf mois.
Acheter les cryptos les plus performantes et vendre à découvert les moins performantes ne fonctionne plus cette année. Faire l’inverse aurait rapporté +1.47% par rééquilibrage, avec un taux de réussite de 69 %.
LES CHIFFRES
2022 : +0.510%
2023 : -0.323%
2024 : +5.008%
2025 : +3.900%
2026 depuis le début de l’année : -1.950%
Une stratégie n’est pas une vérité sur les marchés, mais une vérité sur une période. Quiconque vous présente un backtest sans le détail année par année vous cache les années où la stratégie n’a pas fonctionné.
Dans le cadre d’une expérience publique : faire passer 5,063 USDT à 1,000,000 USDT, en publiant chaque résultat, y compris ceux qui me donnent mauvaise réputation.
Exécuté sur $SOL $BTC $ETH
#Binance #Futures #Backtesting #TradingBot #CryptoData
COMMENT JE L’AI TESTÉ
Même univers, même règle de classement, même période de détention, cinq années différentes.
2024 et 2025 ont porté toute la stratégie. 2026 est la pire des cinq années : un taux de réussite de 25 % sur environ neuf mois.
Acheter les cryptos les plus performantes et vendre à découvert les moins performantes ne fonctionne plus cette année. Faire l’inverse aurait rapporté +1.47% par rééquilibrage, avec un taux de réussite de 69 %.
LES CHIFFRES
2022 : +0.510%
2023 : -0.323%
2024 : +5.008%
2025 : +3.900%
2026 depuis le début de l’année : -1.950%
Une stratégie n’est pas une vérité sur les marchés, mais une vérité sur une période. Quiconque vous présente un backtest sans le détail année par année vous cache les années où la stratégie n’a pas fonctionné.
Dans le cadre d’une expérience publique : faire passer 5,063 USDT à 1,000,000 USDT, en publiant chaque résultat, y compris ceux qui me donnent mauvaise réputation.
Exécuté sur $SOL $BTC $ETH
#Binance #Futures #Backtesting #TradingBot #CryptoData
Même univers, même règle de classement, même période de détention, cinq années différentes.
2024 et 2025 ont porté toute la stratégie. 2026 est la pire des cinq années : un taux de réussite de 25 % sur environ neuf mois.
Acheter les cryptos les plus performantes et vendre à découvert les moins performantes ne fonctionne plus cette année. Faire l’inverse aurait rapporté +1.47% par rééquilibrage, avec un taux de réussite de 69 %.
LES CHIFFRES
2022 : +0.510%
2023 : -0.323%
2024 : +5.008%
2025 : +3.900%
2026 depuis le début de l’année : -1.950%
Une stratégie n’est pas une vérité sur les marchés, mais une vérité sur une période. Quiconque vous présente un backtest sans le détail année par année vous cache les années où la stratégie n’a pas fonctionné.
Dans le cadre d’une expérience publique : faire passer 5,063 USDT à 1,000,000 USDT, en publiant chaque résultat, y compris ceux qui me donnent mauvaise réputation.
Exécuté sur $SOL $BTC $ETH
#Binance #Futures #Backtesting #TradingBot #CryptoData
2
Article
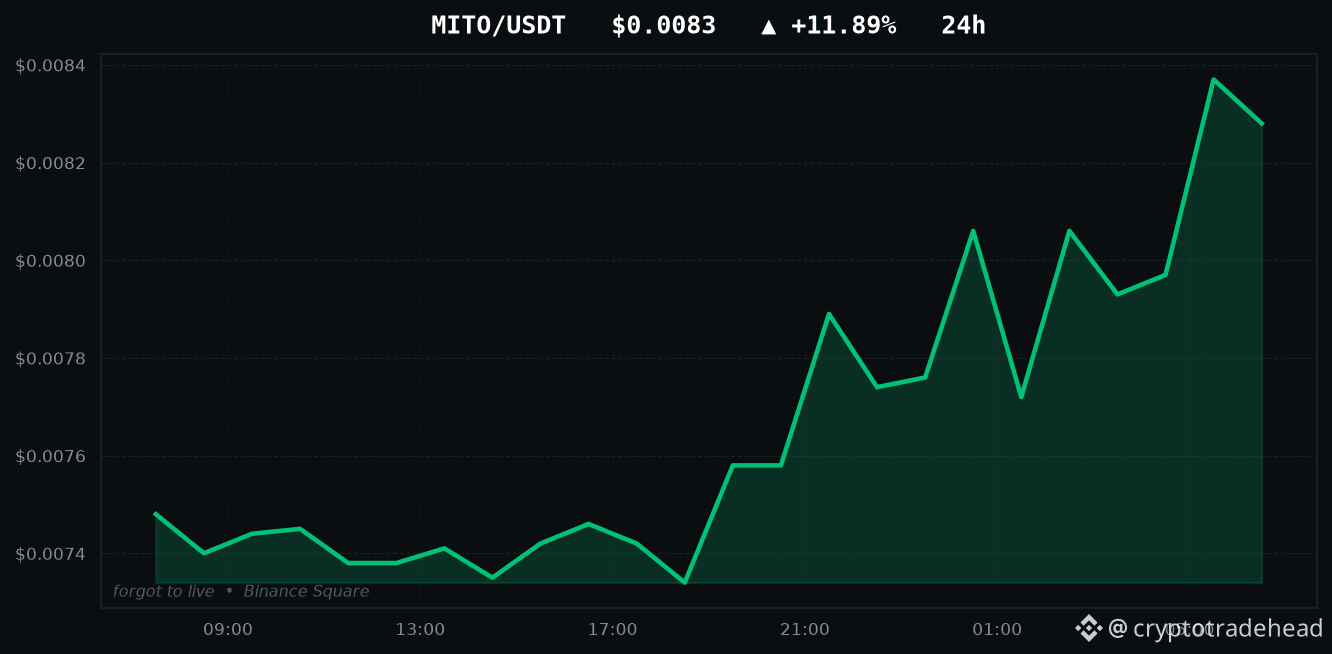
MITO est en hausse de +11.89 % — j’ai testé les deux façons de le traderLES PLUS FORTES HAUSSES DU JOUR
MITO : +11.89 %
SOPH : +11.64 %
TRUMP : +10.15 %
牛来 : +10.01 %
BEAMX : +9.13 %
Chaque compte sur cette application verra cette liste. Voici la partie qu’on vous cache.
J’ai testé rétrospectivement les deux façons de trader un mouvement comme celui de MITO (+11.89 %) : acheter la cassure, ou parier contre elle en supposant que le cours revient à son niveau initial. Les deux stratégies ont perdu de l’argent. Pas de peu : elles ont perdu à peu près le coût de transaction, soit 0.240 % par aller-retour, ce qui caractérise un signal sans information une fois les frais pris en compte.
Une forte variation sur 24 heures vous indique que quelque chose s’est déjà produit. Elle ne vous dit pas ce qui va se passer ensuite, et les données le confirment dans les deux sens.
MITO est en hausse de +11.89 % — j’ai testé les deux façons de le trader
LES PLUS FORTES HAUSSES DU JOUR
MITO : +11.89 %
SOPH : +11.64 %
TRUMP : +10.15 %
牛来 : +10.01 %
BEAMX : +9.13 %
Chaque compte sur cette application verra cette liste. Voici la partie qu’on vous cache.
J’ai testé rétrospectivement les deux façons de trader un mouvement comme celui de MITO (+11.89 %) : acheter la cassure, ou parier contre elle en supposant que le cours revient à son niveau initial. Les deux stratégies ont perdu de l’argent. Pas de peu : elles ont perdu à peu près le coût de transaction, soit 0.240 % par aller-retour, ce qui caractérise un signal sans information une fois les frais pris en compte.
Une forte variation sur 24 heures vous indique que quelque chose s’est déjà produit. Elle ne vous dit pas ce qui va se passer ensuite, et les données le confirment dans les deux sens.
MITO : +11.89 %
SOPH : +11.64 %
TRUMP : +10.15 %
牛来 : +10.01 %
BEAMX : +9.13 %
Chaque compte sur cette application verra cette liste. Voici la partie qu’on vous cache.
J’ai testé rétrospectivement les deux façons de trader un mouvement comme celui de MITO (+11.89 %) : acheter la cassure, ou parier contre elle en supposant que le cours revient à son niveau initial. Les deux stratégies ont perdu de l’argent. Pas de peu : elles ont perdu à peu près le coût de transaction, soit 0.240 % par aller-retour, ce qui caractérise un signal sans information une fois les frais pris en compte.
Une forte variation sur 24 heures vous indique que quelque chose s’est déjà produit. Elle ne vous dit pas ce qui va se passer ensuite, et les données le confirment dans les deux sens.
2
Connectez-vous pour découvrir plus de contenu
Rejoignez la communauté mondiale des adeptes de cryptomonnaies sur Binance Square
⚡️ Suviez les dernières informations importantes sur les cryptomonnaies.
💬 Jugé digne de confiance par la plus grande plateforme d’échange de cryptomonnaies au monde.
👍 Découvrez les connaissances que partagent les créateurs vérifiés.
Adresse e-mail/Nº de téléphone
Sujets d’actualité
BinanceRestores28FiatWithdrawals
0 vues
0 mentions
Binance rétablit les retraits en monnaies fiduciaires en USD, AED et trois devises asiatiques, portant le total à 28
Binance News
·0 mentions J’aime
·99 vues
BinanceProcesses$4.65BWithdrawals
57,978 vues
251 mentions
BitcoinDropsBelow$78K
0 vues
20 mentions