
#cryptomarketanalysis
cryptomarketanalysis
13.1M vues
25,647 mentions
Populaire
Récents


·
--
Article
Récapitulatif hebdomadaire du marché crypto : plus fortes hausses, plus grosses baisses et niveaux clés à surveiller📊 Crypto
Vainqueurs et perdants hebdomadaires
🌐 Tendance défensive du marché
📉 La hausse des rendements du Trésor, des prix du pétrole plus élevés et des attentes plus fortes de hausse des taux de la Fed ont fait retomber le Bitcoin sous 77 000 $, créant un environnement crypto plus défensif.
💰 Malgré la pression, les capitaux ont continué de se diriger vers des valeurs DeFi, confidentialité, IA et axées sur l’utilité.
🚀 Gagnants de la semaine
🔥 Jeton de Venise (VVV) : +35%+
📈 VVV a été le meilleur grand acteur de la semaine, franchissant la résistance clé des 20 $ tandis que son RSI hebdomadaire restait sous la zone de surachat.
Récapitulatif hebdomadaire du marché crypto : plus fortes hausses, plus grosses baisses et niveaux clés à surveiller
📊 Crypto
Vainqueurs et perdants hebdomadaires
🌐 Tendance défensive du marché
📉 La hausse des rendements du Trésor, des prix du pétrole plus élevés et des attentes plus fortes de hausse des taux de la Fed ont fait retomber le Bitcoin sous 77 000 $, créant un environnement crypto plus défensif.
💰 Malgré la pression, les capitaux ont continué de se diriger vers des valeurs DeFi, confidentialité, IA et axées sur l’utilité.
🚀 Gagnants de la semaine
🔥 Jeton de Venise (VVV) : +35%+
📈 VVV a été le meilleur grand acteur de la semaine, franchissant la résistance clé des 20 $ tandis que son RSI hebdomadaire restait sous la zone de surachat.
Vainqueurs et perdants hebdomadaires
🌐 Tendance défensive du marché
📉 La hausse des rendements du Trésor, des prix du pétrole plus élevés et des attentes plus fortes de hausse des taux de la Fed ont fait retomber le Bitcoin sous 77 000 $, créant un environnement crypto plus défensif.
💰 Malgré la pression, les capitaux ont continué de se diriger vers des valeurs DeFi, confidentialité, IA et axées sur l’utilité.
🚀 Gagnants de la semaine
🔥 Jeton de Venise (VVV) : +35%+
📈 VVV a été le meilleur grand acteur de la semaine, franchissant la résistance clé des 20 $ tandis que son RSI hebdomadaire restait sous la zone de surachat.
3
455
·
--

Article
Aperçu du marché des cryptomonnaies : élan sélectif, percées des altcoins et flambée des memecoins🌐 Structure globale du marché
📊 Le marché des cryptomonnaies traverse actuellement une phase de correction légère, avec une capitalisation globale qui oscille autour de 2,2T$ à 2,7T$.
₿ La dominance de Bitcoin reste élevée, proche de 57% à 59%, indiquant que le capital continue de privilégier Bitcoin plutôt que de nombreux altcoins, malgré de fortes hausses sur certains actifs à plus petite capitalisation.
📉 Les principaux indices de marché ont subi une baisse d’environ 2% au cours des dernières 24 heures, ce qui suggère une prise de profits à court terme et une position plus prudente.
Aperçu du marché des cryptomonnaies : élan sélectif, percées des altcoins et flambée des memecoins
🌐 Structure globale du marché
📊 Le marché des cryptomonnaies traverse actuellement une phase de correction légère, avec une capitalisation globale qui oscille autour de 2,2T$ à 2,7T$.
₿ La dominance de Bitcoin reste élevée, proche de 57% à 59%, indiquant que le capital continue de privilégier Bitcoin plutôt que de nombreux altcoins, malgré de fortes hausses sur certains actifs à plus petite capitalisation.
📉 Les principaux indices de marché ont subi une baisse d’environ 2% au cours des dernières 24 heures, ce qui suggère une prise de profits à court terme et une position plus prudente.
📊 Le marché des cryptomonnaies traverse actuellement une phase de correction légère, avec une capitalisation globale qui oscille autour de 2,2T$ à 2,7T$.
₿ La dominance de Bitcoin reste élevée, proche de 57% à 59%, indiquant que le capital continue de privilégier Bitcoin plutôt que de nombreux altcoins, malgré de fortes hausses sur certains actifs à plus petite capitalisation.
📉 Les principaux indices de marché ont subi une baisse d’environ 2% au cours des dernières 24 heures, ce qui suggère une prise de profits à court terme et une position plus prudente.
1
2
195

·
--
Haussier
💰 LA MONNAIE LA PLUS LIQUIDE CONTINUE DE PASSER LE MESSAGE
Après tout le remue-ménage des altcoins, nous devons revenir à l’actif qui continue de dominer le marché.
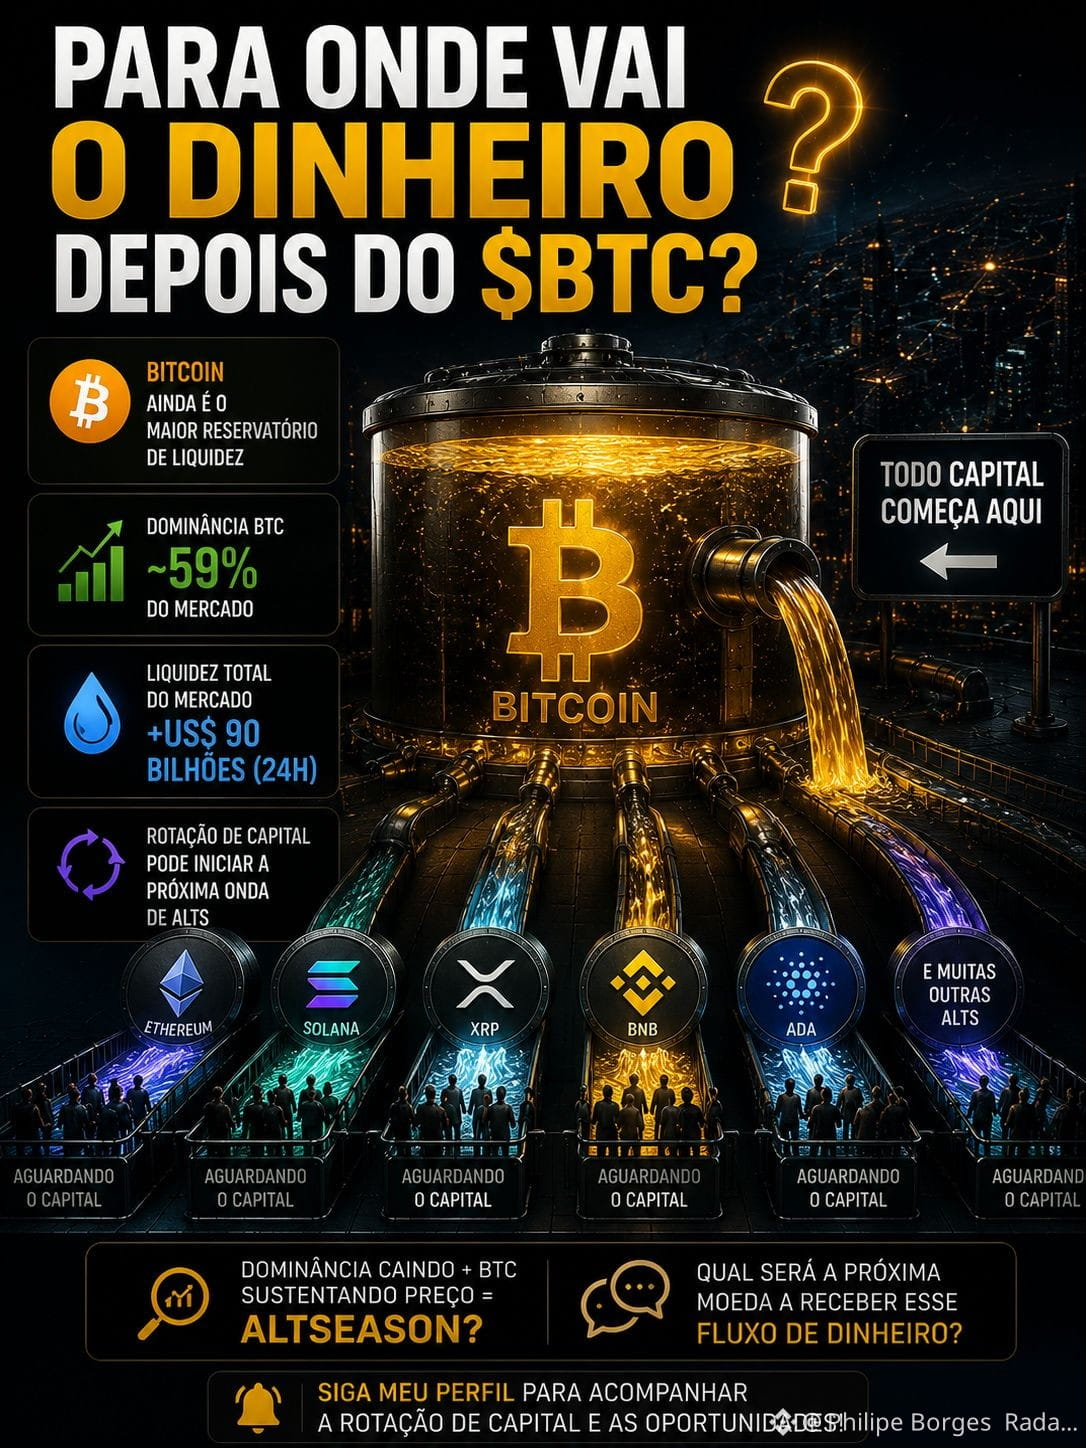
$BTC se situe dans la zone de 77–78 mille dollars, et CoinDesk indique environ 13,7 milliards de dollars d’échanges sur les dernières 24h dans sa référence actuelle. La domination du Bitcoin reste aussi proche de 59% sur une autre lecture du marché.
Cela signifie que, malgré le bruit des altcoins, une énorme part du capital reste concentrée sur le Bitcoin.
Et voici la donnée que j’observerais :
si la domination commence à baisser tandis que le BTC maintient le prix, les altcoins peuvent commencer à recevoir une plus grande part de cet argent.
💬 Le prochain grand mouvement sera à nouveau celui de $BTC ou des ALTCOINS ?
🔔 Suivez mon profil pour suivre cette rotation.
#Bitcoin #BTC #Altcoins #CryptoMarketAnalysis
{spot}(BTCUSDT)
💰 LA MONNAIE LA PLUS LIQUIDE CONTINUE DE PASSER LE MESSAGE
Après tout le remue-ménage des altcoins, nous devons revenir à l’actif qui continue de dominer le marché.
$BTC se situe dans la zone de 77–78 mille dollars, et CoinDesk indique environ 13,7 milliards de dollars d’échanges sur les dernières 24h dans sa référence actuelle. La domination du Bitcoin reste aussi proche de 59% sur une autre lecture du marché.
Cela signifie que, malgré le bruit des altcoins, une énorme part du capital reste concentrée sur le Bitcoin.
Et voici la donnée que j’observerais :
si la domination commence à baisser tandis que le BTC maintient le prix, les altcoins peuvent commencer à recevoir une plus grande part de cet argent.
💬 Le prochain grand mouvement sera à nouveau celui de $BTC ou des ALTCOINS ?
🔔 Suivez mon profil pour suivre cette rotation.
#Bitcoin #BTC #Altcoins #CryptoMarketAnalysis
Après tout le remue-ménage des altcoins, nous devons revenir à l’actif qui continue de dominer le marché.
$BTC se situe dans la zone de 77–78 mille dollars, et CoinDesk indique environ 13,7 milliards de dollars d’échanges sur les dernières 24h dans sa référence actuelle. La domination du Bitcoin reste aussi proche de 59% sur une autre lecture du marché.
Cela signifie que, malgré le bruit des altcoins, une énorme part du capital reste concentrée sur le Bitcoin.
Et voici la donnée que j’observerais :
si la domination commence à baisser tandis que le BTC maintient le prix, les altcoins peuvent commencer à recevoir une plus grande part de cet argent.
💬 Le prochain grand mouvement sera à nouveau celui de $BTC ou des ALTCOINS ?
🔔 Suivez mon profil pour suivre cette rotation.
#Bitcoin #BTC #Altcoins #CryptoMarketAnalysis
152
·
--

Article
La saison des altcoins s’embrase ? Top 5 des plus grands gagnants, rallye des memecoins et analyse des échanges Binance📊 Analyse du marché des altcoins et des memecoins — 21 août 2026
Le marché au sens large est fortement positif : la capitalisation mondiale des crypto-monnaies est d’environ 2,47 T$ (+4,40% sur 24 h), le volume sur 24 h est d’environ 129,38 Md$ (+13,72%), tandis que la dominance BTC est de 59,31%.
🚀 Leaders actuels du marché
Vers 05h07 le 21 août, les plus forts mouvements des grandes/moyennes capitalisations rapportés sur le marché étaient :
Ces chiffres sont rapportés en INR par Economic Times, mais les variations en pourcentage offrent un aperçu utile de la performance entre marchés.
📈 Momentum relatif
🐸 Secteur des memecoins
La saison des altcoins s’embrase ? Top 5 des plus grands gagnants, rallye des memecoins et analyse des échanges Binance
📊 Analyse du marché des altcoins et des memecoins — 21 août 2026
Le marché au sens large est fortement positif : la capitalisation mondiale des crypto-monnaies est d’environ 2,47 T$ (+4,40% sur 24 h), le volume sur 24 h est d’environ 129,38 Md$ (+13,72%), tandis que la dominance BTC est de 59,31%.
🚀 Leaders actuels du marché
Vers 05h07 le 21 août, les plus forts mouvements des grandes/moyennes capitalisations rapportés sur le marché étaient :
Ces chiffres sont rapportés en INR par Economic Times, mais les variations en pourcentage offrent un aperçu utile de la performance entre marchés.
📈 Momentum relatif
🐸 Secteur des memecoins
Le marché au sens large est fortement positif : la capitalisation mondiale des crypto-monnaies est d’environ 2,47 T$ (+4,40% sur 24 h), le volume sur 24 h est d’environ 129,38 Md$ (+13,72%), tandis que la dominance BTC est de 59,31%.
🚀 Leaders actuels du marché
Vers 05h07 le 21 août, les plus forts mouvements des grandes/moyennes capitalisations rapportés sur le marché étaient :
Ces chiffres sont rapportés en INR par Economic Times, mais les variations en pourcentage offrent un aperçu utile de la performance entre marchés.
📈 Momentum relatif
🐸 Secteur des memecoins
2
5
696

·
--
Bitcoin surpasse tous les secteurs lors d’une baisse de 26%
Bitcoin a chuté d’environ 26% au cours des trois derniers mois pour s’établir autour de 86 000 $, mais il a malgré tout surpassé presque tous les principaux secteurs de cryptomonnaies, selon Glassnode. Ether a reculé d’environ 36% depuis la mi-septembre, passant sous les 3 000 $, tandis que les jetons liés à l’IA ont baissé de 48% et que les memecoins ont plongé de 56%.
La catégorie de tokenisation d’actifs du monde réel est en baisse de 46% sur trois mois, et les jetons DeFi ont reculé de 38%, d’après les données de CoinGecko. Nick Ruck, directeur de LVRG Research, a noté que les entrées de capitaux continuent de favoriser Bitcoin, reflétant une forte préférence des investisseurs pour la stabilité du BTC.
L’analyse de Glassnode révèle que le rendement moyen sur presque tous les secteurs crypto a été inférieur à celui de Bitcoin, ce qui indique que le capital continue de se concentrer sur la principale cryptomonnaie. Cela souligne la position dominante de Bitcoin, reléguant les altcoins dans une posture difficile pour maintenir leur pertinence.
Cette tendance suggère que les investisseurs traitent Bitcoin comme une garantie numérique et une couverture macro. Quel est votre avis — les altcoins vont-ils sortir de l’ombre de Bitcoin, ou cette domination est-elle appelée à durer ?
#BitcoinDominance #CryptoMarketAnalysis #GlassnodeData
Bitcoin surpasse tous les secteurs lors d’une baisse de 26%
Bitcoin a chuté d’environ 26% au cours des trois derniers mois pour s’établir autour de 86 000 $, mais il a malgré tout surpassé presque tous les principaux secteurs de cryptomonnaies, selon Glassnode. Ether a reculé d’environ 36% depuis la mi-septembre, passant sous les 3 000 $, tandis que les jetons liés à l’IA ont baissé de 48% et que les memecoins ont plongé de 56%.
La catégorie de tokenisation d’actifs du monde réel est en baisse de 46% sur trois mois, et les jetons DeFi ont reculé de 38%, d’après les données de CoinGecko. Nick Ruck, directeur de LVRG Research, a noté que les entrées de capitaux continuent de favoriser Bitcoin, reflétant une forte préférence des investisseurs pour la stabilité du BTC.
L’analyse de Glassnode révèle que le rendement moyen sur presque tous les secteurs crypto a été inférieur à celui de Bitcoin, ce qui indique que le capital continue de se concentrer sur la principale cryptomonnaie. Cela souligne la position dominante de Bitcoin, reléguant les altcoins dans une posture difficile pour maintenir leur pertinence.
Cette tendance suggère que les investisseurs traitent Bitcoin comme une garantie numérique et une couverture macro. Quel est votre avis — les altcoins vont-ils sortir de l’ombre de Bitcoin, ou cette domination est-elle appelée à durer ?
#BitcoinDominance #CryptoMarketAnalysis #GlassnodeData
Bitcoin a chuté d’environ 26% au cours des trois derniers mois pour s’établir autour de 86 000 $, mais il a malgré tout surpassé presque tous les principaux secteurs de cryptomonnaies, selon Glassnode. Ether a reculé d’environ 36% depuis la mi-septembre, passant sous les 3 000 $, tandis que les jetons liés à l’IA ont baissé de 48% et que les memecoins ont plongé de 56%.
La catégorie de tokenisation d’actifs du monde réel est en baisse de 46% sur trois mois, et les jetons DeFi ont reculé de 38%, d’après les données de CoinGecko. Nick Ruck, directeur de LVRG Research, a noté que les entrées de capitaux continuent de favoriser Bitcoin, reflétant une forte préférence des investisseurs pour la stabilité du BTC.
L’analyse de Glassnode révèle que le rendement moyen sur presque tous les secteurs crypto a été inférieur à celui de Bitcoin, ce qui indique que le capital continue de se concentrer sur la principale cryptomonnaie. Cela souligne la position dominante de Bitcoin, reléguant les altcoins dans une posture difficile pour maintenir leur pertinence.
Cette tendance suggère que les investisseurs traitent Bitcoin comme une garantie numérique et une couverture macro. Quel est votre avis — les altcoins vont-ils sortir de l’ombre de Bitcoin, ou cette domination est-elle appelée à durer ?
#BitcoinDominance #CryptoMarketAnalysis #GlassnodeData
148

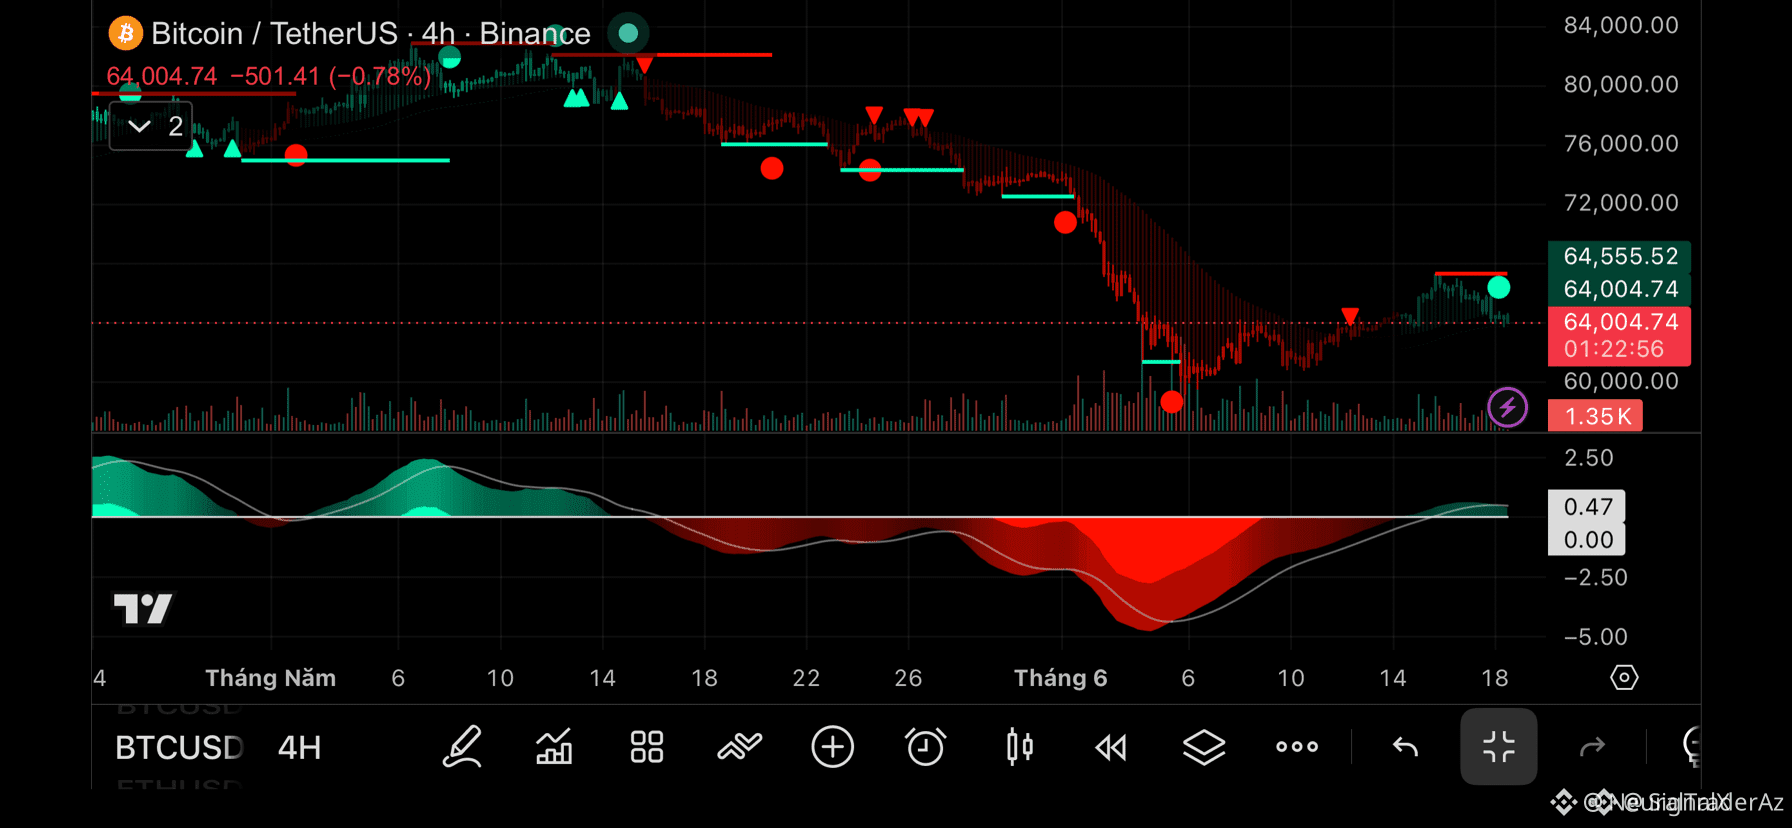
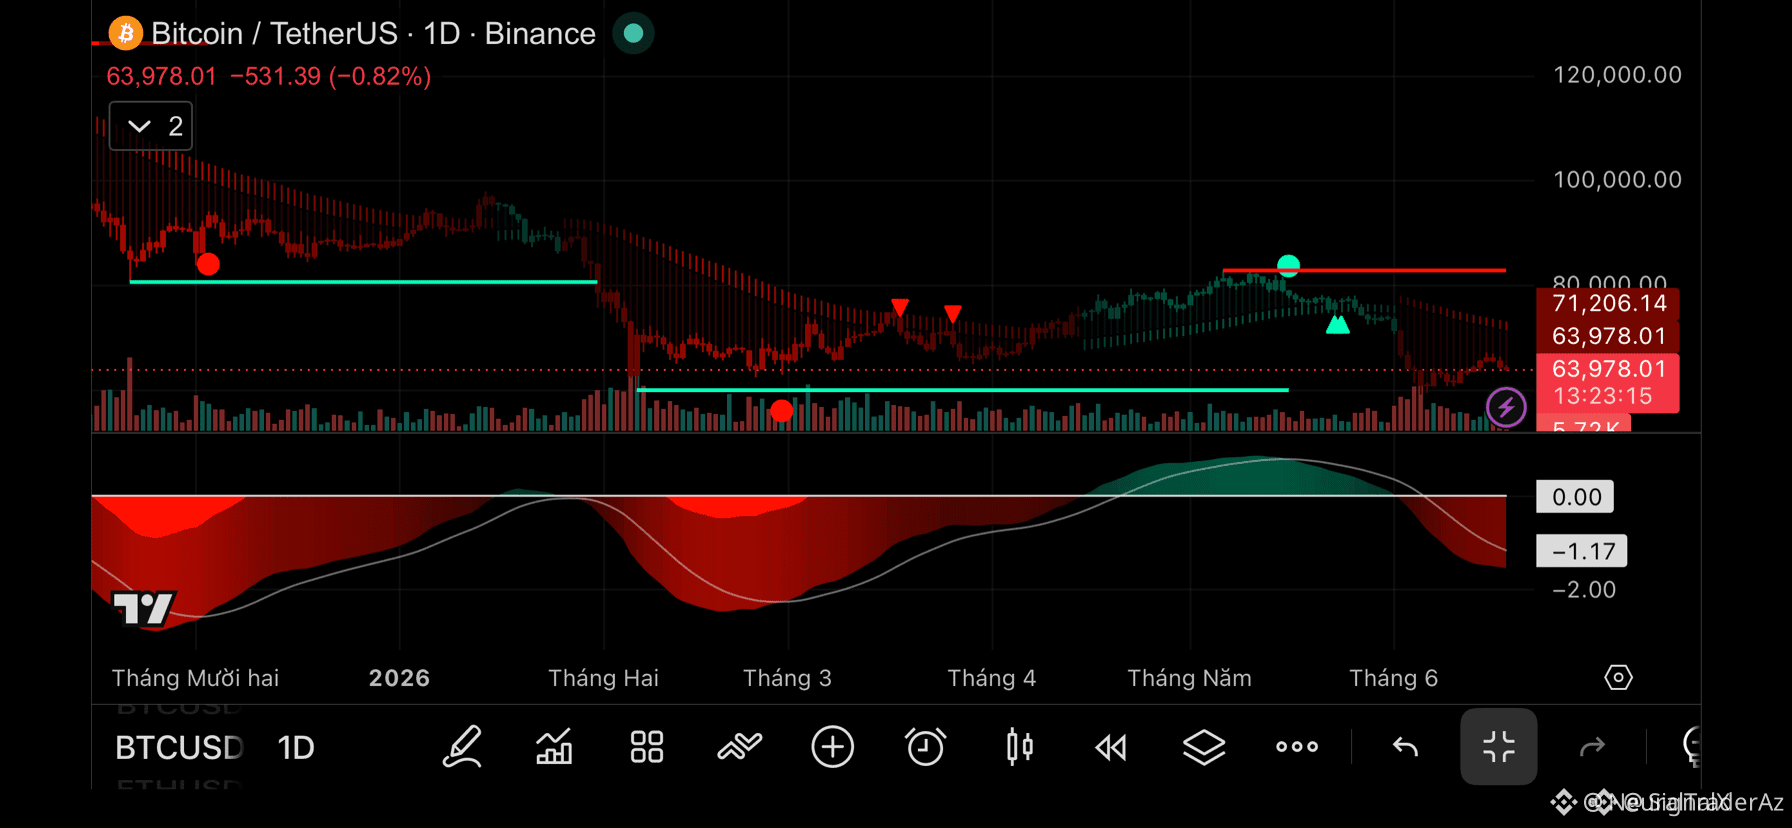
$BTC est à un point de décision critique, avec la structure dominante restant baissière sur des périodes plus longues 🔍
Entrée : 65 500 $
Cible : 67 500 $
Stop Loss : 63 000 $
Le marché montre des signes de faiblesse à court terme, avec le prix peinant à établir un plus haut et les vendeurs défendant la zone des 65k-66k. L'élan s'aplatit après un rebond de courte durée.
Ce n'est pas un conseil financier. Gérez votre risque.
#BTC #LongSetup #CryptoMarketAnalysis
⚡
$BTC est à un point de décision critique, avec la structure dominante restant baissière sur des périodes plus longues 🔍
Entrée : 65 500 $
Cible : 67 500 $
Stop Loss : 63 000 $
Le marché montre des signes de faiblesse à court terme, avec le prix peinant à établir un plus haut et les vendeurs défendant la zone des 65k-66k. L'élan s'aplatit après un rebond de courte durée.
Ce n'est pas un conseil financier. Gérez votre risque.
#BTC #LongSetup #CryptoMarketAnalysis
⚡
Entrée : 65 500 $
Cible : 67 500 $
Stop Loss : 63 000 $
Le marché montre des signes de faiblesse à court terme, avec le prix peinant à établir un plus haut et les vendeurs défendant la zone des 65k-66k. L'élan s'aplatit après un rebond de courte durée.
Ce n'est pas un conseil financier. Gérez votre risque.
#BTC #LongSetup #CryptoMarketAnalysis
⚡
47

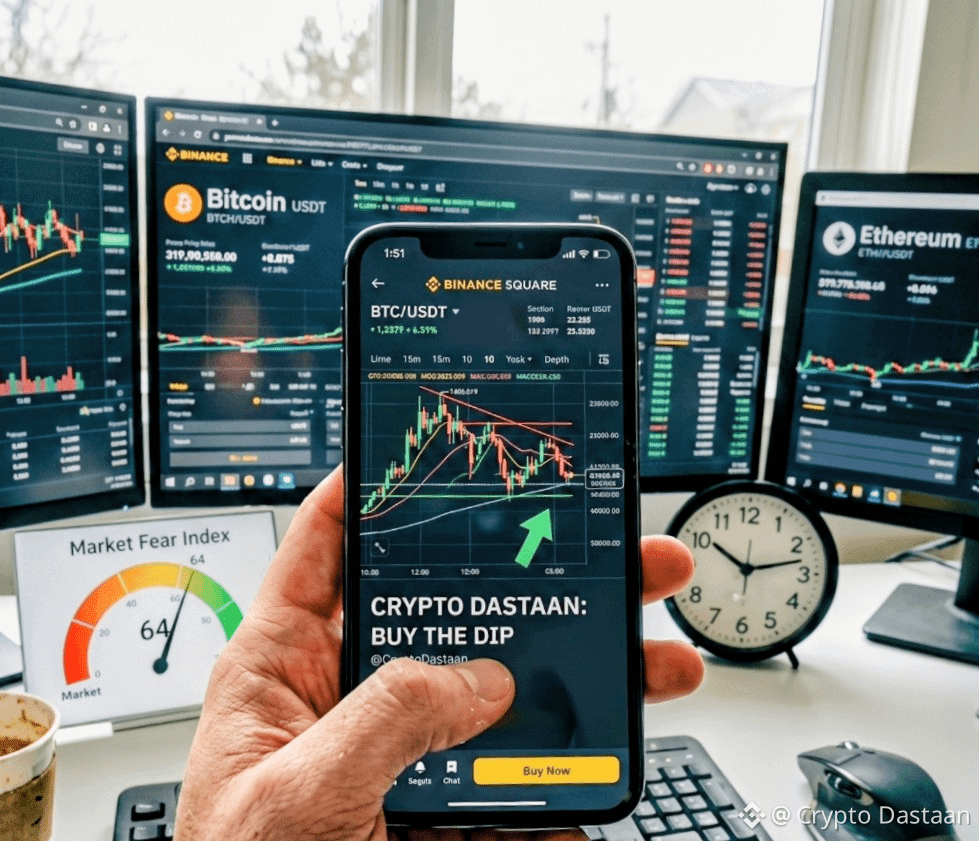
🚨 BTC plonge en dessous de 64K $ : Crash du marché ou la meilleure opportunité d'achat ? 📉🔥
Le marché des cryptos subit une correction significative aujourd'hui ! Bitcoin ($BTC) a officiellement cassé le niveau de support crucial de 64 000 $, déclenchant des alertes de prix sur tout le front. Avec BTC, Ethereum ($ETH) a glissé sous 1 700 $, et BNB se négocie en dessous de 600 $.
Pour de nombreux traders particuliers, la peur s'installe. Mais les vétérans du marché savent que les liquidations majeures préparent souvent le terrain pour les rebonds les plus sains. ### 📊 Niveaux clés à surveiller en ce moment :
Support immédiat : La précédente zone d'accumulation majeure autour de 62 500 $ – 63 000 $. Si BTC maintient ce niveau, nous pourrions voir un puissant rallye de soulagement.
Résistance : Pour récupérer un élan haussier, les acheteurs doivent pousser BTC au-dessus du niveau de 65 500 $ avec un volume fort.
💡 Stratégie pour les traders malins :
Paniquer pendant une baisse n'est jamais la solution. Au lieu de cela, cherchez des projets solides montrant une résilience ou envisagez le Dollar-Cost Averaging (DCA) dans des positions solides pendant que l'indice de peur est élevé. Historiquement, acheter les jours rouges offre les meilleures récompenses.
Achetez-vous cette baisse, ou attendez-vous des entrées plus basses ? Partagez votre analyse technique dans les commentaires ci-dessous ! 👇
#BitcoinBinance #CryptoMarketAnalysis #BuyTheDip #TradingSignals #BinanceSquare
🚨 BTC plonge en dessous de 64K $ : Crash du marché ou la meilleure opportunité d'achat ? 📉🔥
Le marché des cryptos subit une correction significative aujourd'hui ! Bitcoin ($BTC) a officiellement cassé le niveau de support crucial de 64 000 $, déclenchant des alertes de prix sur tout le front. Avec BTC, Ethereum ($ETH) a glissé sous 1 700 $, et BNB se négocie en dessous de 600 $.
Pour de nombreux traders particuliers, la peur s'installe. Mais les vétérans du marché savent que les liquidations majeures préparent souvent le terrain pour les rebonds les plus sains. ### 📊 Niveaux clés à surveiller en ce moment :
Support immédiat : La précédente zone d'accumulation majeure autour de 62 500 $ – 63 000 $. Si BTC maintient ce niveau, nous pourrions voir un puissant rallye de soulagement.
Résistance : Pour récupérer un élan haussier, les acheteurs doivent pousser BTC au-dessus du niveau de 65 500 $ avec un volume fort.
💡 Stratégie pour les traders malins :
Paniquer pendant une baisse n'est jamais la solution. Au lieu de cela, cherchez des projets solides montrant une résilience ou envisagez le Dollar-Cost Averaging (DCA) dans des positions solides pendant que l'indice de peur est élevé. Historiquement, acheter les jours rouges offre les meilleures récompenses.
Achetez-vous cette baisse, ou attendez-vous des entrées plus basses ? Partagez votre analyse technique dans les commentaires ci-dessous ! 👇
#BitcoinBinance #CryptoMarketAnalysis #BuyTheDip #TradingSignals #BinanceSquare
Le marché des cryptos subit une correction significative aujourd'hui ! Bitcoin ($BTC) a officiellement cassé le niveau de support crucial de 64 000 $, déclenchant des alertes de prix sur tout le front. Avec BTC, Ethereum ($ETH) a glissé sous 1 700 $, et BNB se négocie en dessous de 600 $.
Pour de nombreux traders particuliers, la peur s'installe. Mais les vétérans du marché savent que les liquidations majeures préparent souvent le terrain pour les rebonds les plus sains. ### 📊 Niveaux clés à surveiller en ce moment :
Support immédiat : La précédente zone d'accumulation majeure autour de 62 500 $ – 63 000 $. Si BTC maintient ce niveau, nous pourrions voir un puissant rallye de soulagement.
Résistance : Pour récupérer un élan haussier, les acheteurs doivent pousser BTC au-dessus du niveau de 65 500 $ avec un volume fort.
💡 Stratégie pour les traders malins :
Paniquer pendant une baisse n'est jamais la solution. Au lieu de cela, cherchez des projets solides montrant une résilience ou envisagez le Dollar-Cost Averaging (DCA) dans des positions solides pendant que l'indice de peur est élevé. Historiquement, acheter les jours rouges offre les meilleures récompenses.
Achetez-vous cette baisse, ou attendez-vous des entrées plus basses ? Partagez votre analyse technique dans les commentaires ci-dessous ! 👇
#BitcoinBinance #CryptoMarketAnalysis #BuyTheDip #TradingSignals #BinanceSquare
123

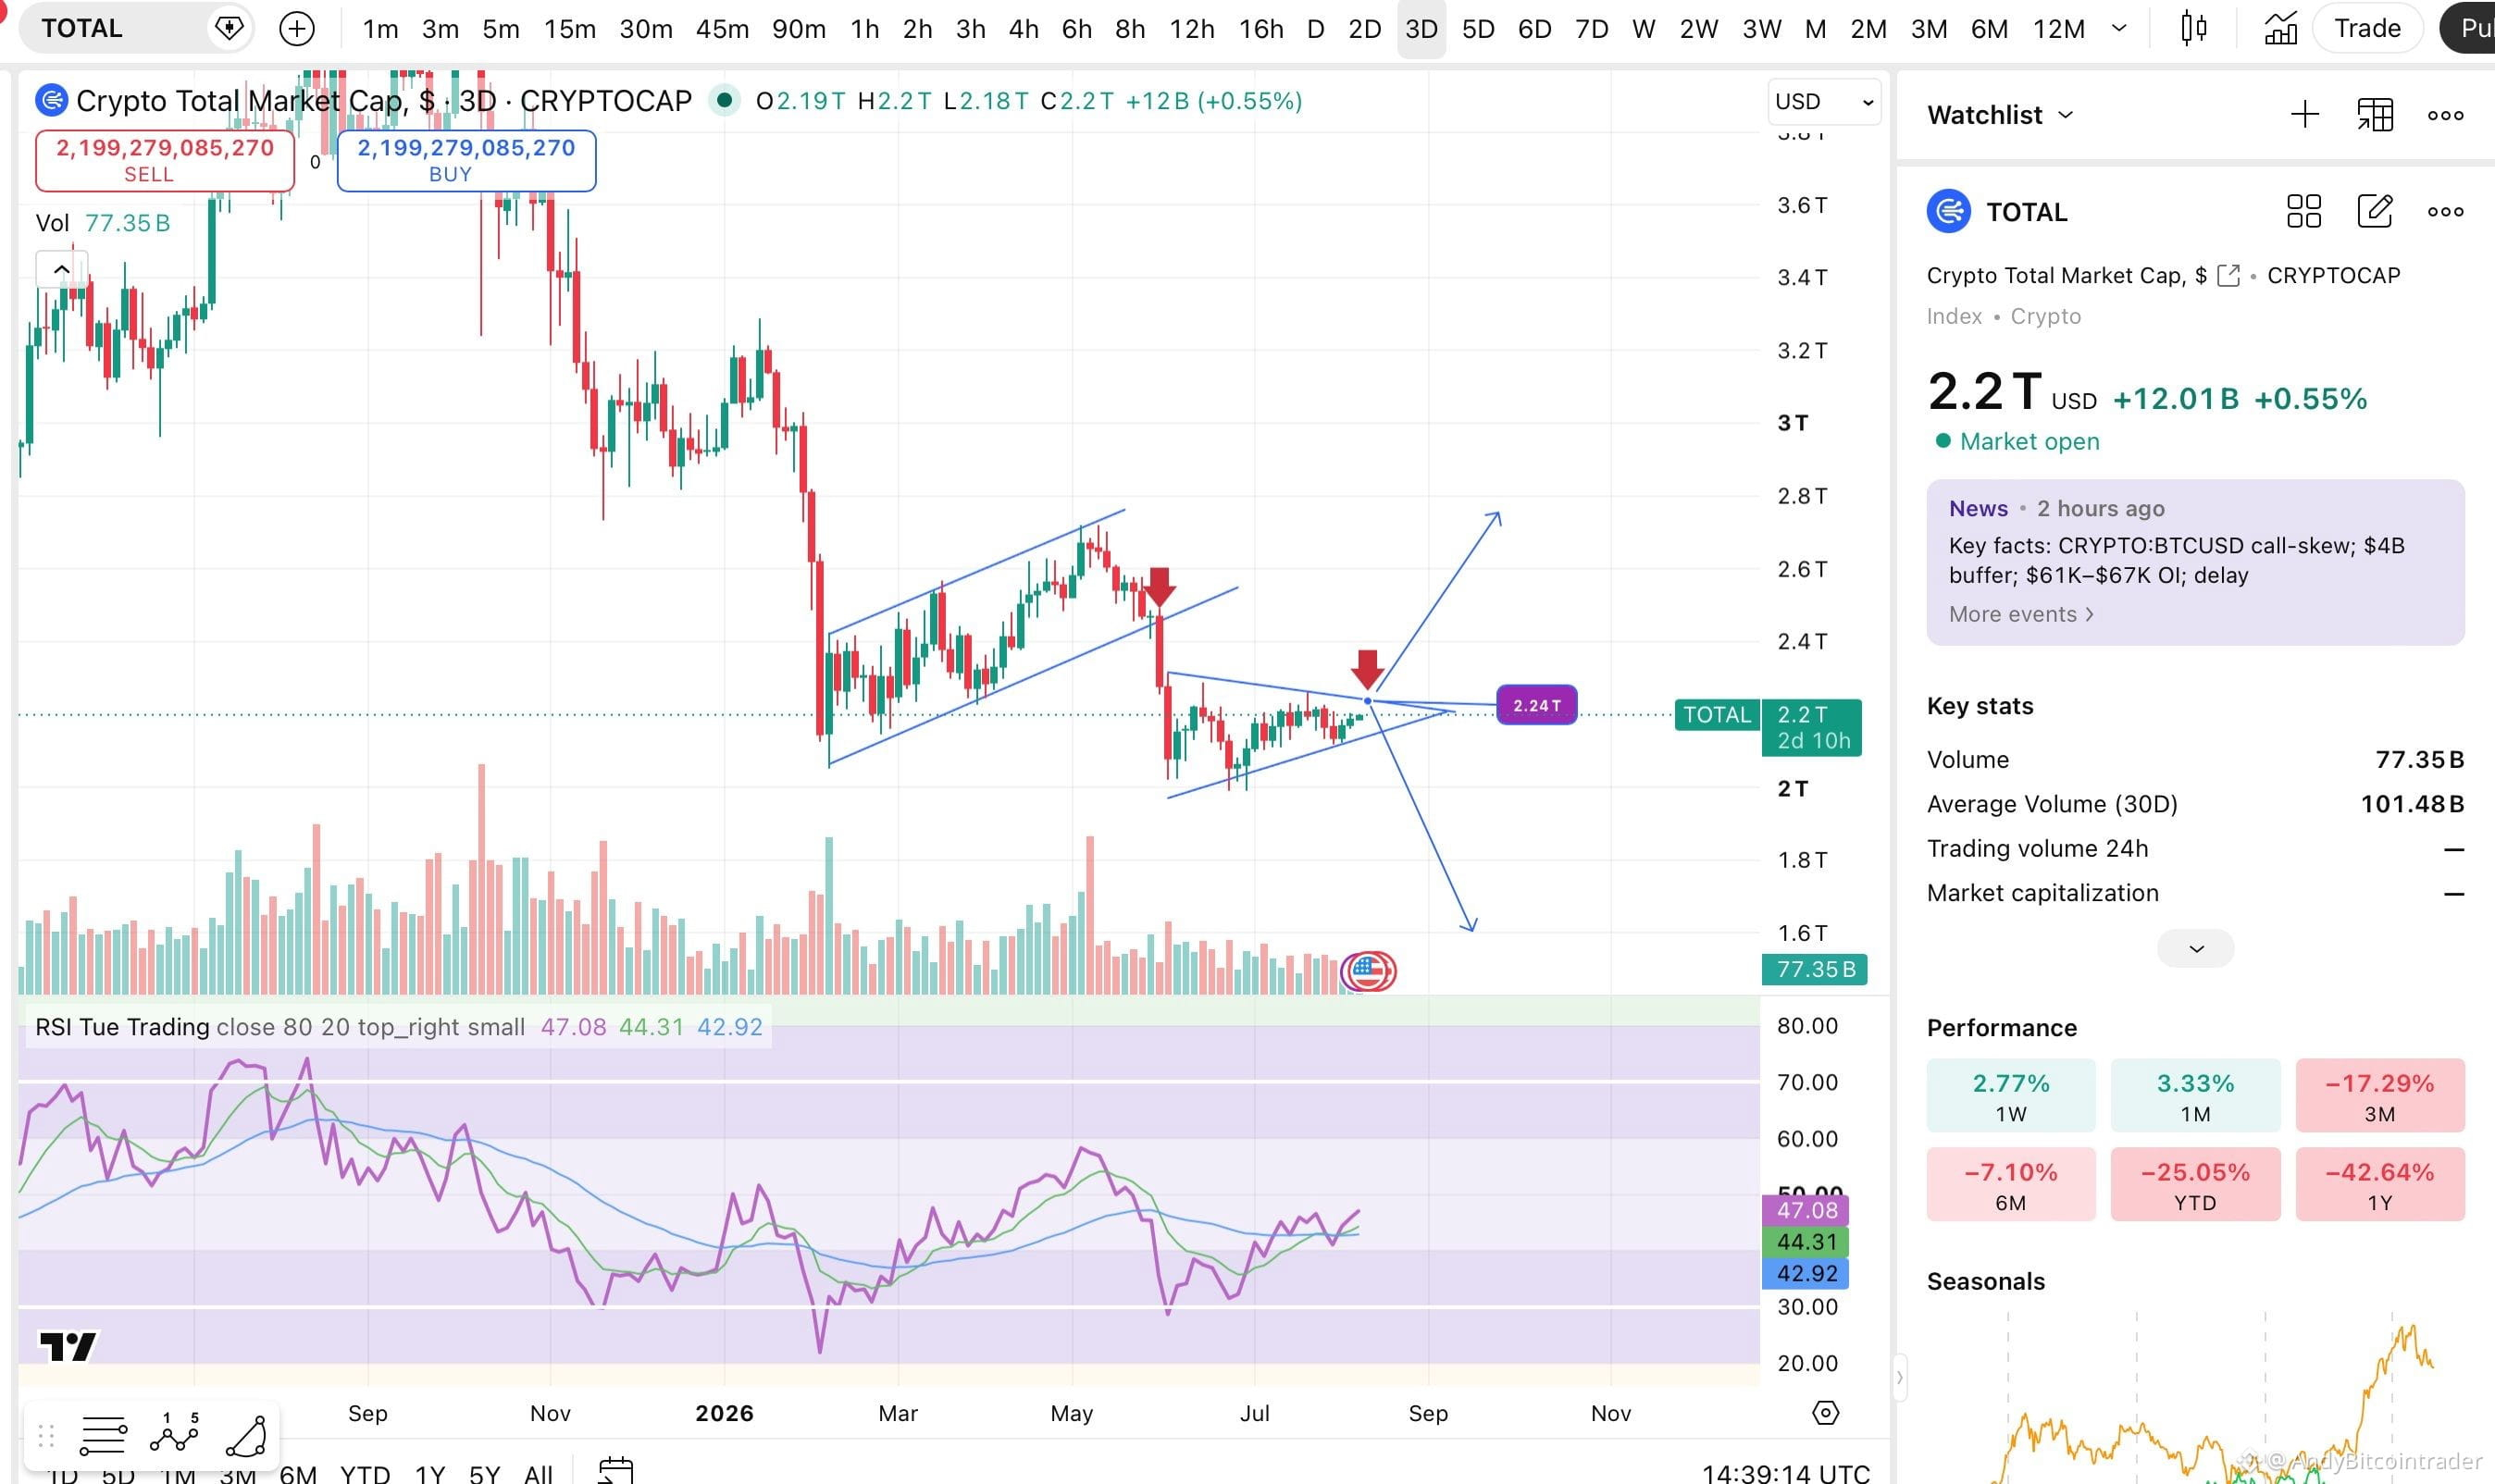
Aujourd’hui 9.8/2026 je vais parler de la capitalisation totale du marché crypto
$Crypto - La capitalisation boursière Crypto essaie de repasser la résistance 2,3-2,4 billions... si ce niveau est rejeté une 3e fois de plus, nous aurons un scénario de baisse profonde du BTC et le creux du marché de la capitalisation pourrait baisser encore plus, à plus de 1,8 billion
#CryptoMarketAnalysis
Aujourd’hui 9.8/2026 je vais parler de la capitalisation totale du marché crypto
$Crypto - La capitalisation boursière Crypto essaie de repasser la résistance 2,3-2,4 billions... si ce niveau est rejeté une 3e fois de plus, nous aurons un scénario de baisse profonde du BTC et le creux du marché de la capitalisation pourrait baisser encore plus, à plus de 1,8 billion
#CryptoMarketAnalysis
$Crypto - La capitalisation boursière Crypto essaie de repasser la résistance 2,3-2,4 billions... si ce niveau est rejeté une 3e fois de plus, nous aurons un scénario de baisse profonde du BTC et le creux du marché de la capitalisation pourrait baisser encore plus, à plus de 1,8 billion
#CryptoMarketAnalysis
34

·
--
📈 APERÇU SUR LES BALEINES : Bitcoin s’approche du prix réalisé de 53 300 $, un signal de creux historique
Bitcoin est à environ 5 000 $ d’atteindre son prix réalisé de 53 300 $, un niveau qui a historiquement marqué le bas des cycles baissiers et est considéré comme une excellente opportunité d’achat. Toutefois, la présence d’investisseurs institutionnels pourrait modifier la dynamique du marché par rapport au passé.
Le prix réalisé, qui représente le coût moyen de l’ensemble des $BTC en circulation, se situe actuellement autour de 53 300 $. D’après CryptoQuant, $BTC se négocie environ 10 % au-dessus de ce niveau. Depuis la fin du marché baissier de 2022, $BTC n’a pas évolué en dessous de ce seuil, rendant un dépassement potentiel ou une approche du prix réalisé un événement notable.
Des analystes, dont Crypto Sunmoon, soulignent qu’auparavant, à chaque cycle baissier, $BTC passait sous son prix réalisé, ce qui a toujours constitué une opportunité d’achat de choix pour le cycle suivant. Si $BTC devait à nouveau tomber sous son prix réalisé, cela pourrait être un signal d’investissement pour le prochain cycle, au vu de la constance de ce modèle sur plusieurs décennies.
#halvingjobs #Bitcoin #AnalyseDuMarchéCrypto
📈 APERÇU SUR LES BALEINES : Bitcoin s’approche du prix réalisé de 53 300 $, un signal de creux historique
Bitcoin est à environ 5 000 $ d’atteindre son prix réalisé de 53 300 $, un niveau qui a historiquement marqué le bas des cycles baissiers et est considéré comme une excellente opportunité d’achat. Toutefois, la présence d’investisseurs institutionnels pourrait modifier la dynamique du marché par rapport au passé.
Le prix réalisé, qui représente le coût moyen de l’ensemble des $BTC en circulation, se situe actuellement autour de 53 300 $. D’après CryptoQuant, $BTC se négocie environ 10 % au-dessus de ce niveau. Depuis la fin du marché baissier de 2022, $BTC n’a pas évolué en dessous de ce seuil, rendant un dépassement potentiel ou une approche du prix réalisé un événement notable.
Des analystes, dont Crypto Sunmoon, soulignent qu’auparavant, à chaque cycle baissier, $BTC passait sous son prix réalisé, ce qui a toujours constitué une opportunité d’achat de choix pour le cycle suivant. Si $BTC devait à nouveau tomber sous son prix réalisé, cela pourrait être un signal d’investissement pour le prochain cycle, au vu de la constance de ce modèle sur plusieurs décennies.
#halvingjobs #Bitcoin #AnalyseDuMarchéCrypto
Bitcoin est à environ 5 000 $ d’atteindre son prix réalisé de 53 300 $, un niveau qui a historiquement marqué le bas des cycles baissiers et est considéré comme une excellente opportunité d’achat. Toutefois, la présence d’investisseurs institutionnels pourrait modifier la dynamique du marché par rapport au passé.
Le prix réalisé, qui représente le coût moyen de l’ensemble des $BTC en circulation, se situe actuellement autour de 53 300 $. D’après CryptoQuant, $BTC se négocie environ 10 % au-dessus de ce niveau. Depuis la fin du marché baissier de 2022, $BTC n’a pas évolué en dessous de ce seuil, rendant un dépassement potentiel ou une approche du prix réalisé un événement notable.
Des analystes, dont Crypto Sunmoon, soulignent qu’auparavant, à chaque cycle baissier, $BTC passait sous son prix réalisé, ce qui a toujours constitué une opportunité d’achat de choix pour le cycle suivant. Si $BTC devait à nouveau tomber sous son prix réalisé, cela pourrait être un signal d’investissement pour le prochain cycle, au vu de la constance de ce modèle sur plusieurs décennies.
#halvingjobs #Bitcoin #AnalyseDuMarchéCrypto
98
·
--
La loi de puissance du Bitcoin dit que 58K est normal.
Le Bitcoin vient de franchir 58 000 $ et Internet a perdu la tête. Mais le modèle de loi de puissance — qui a suivi la trajectoire du prix du Bitcoin depuis 2012 — dit que c’est exactement là où nous devrions en être dans le cycle en cours.
Le modèle met en relation le prix et le temps sur une échelle logarithmique, montrant que la croissance à long terme du Bitcoin suit un canal prévisible. À chaque cycle, les plus bas ont rebondi contre la borne inférieure du modèle, et 58K se situe juste dessus.
Cependant, les données sur les contrats à terme brossent un tableau plus sombre. L’intérêt ouvert est en baisse, les taux de financement sont négatifs et les marchés d’options intègrent un mouvement vers 50K. L’écart entre le plancher de la loi de puissance et le sentiment des produits dérivés est le plus large depuis le point bas de 2022.
Voici la vraie question : la loi de puissance tiendra-t-elle à nouveau, ou est-ce le cycle où le modèle se brise ? Chaque fois que le Bitcoin a chuté jusqu’à la borne inférieure auparavant, il s’est redressé et a atteint de nouveaux sommets. Mais cette fois, les vents contraires macroéconomiques sont différents — l’incertitude sur les taux, les sorties des ETF et des actions faibles pèsent tous en même temps.
Les ordres d’achat s’accumulent entre 56K et 58K sur les carnets d’ordres majeurs. Si ce plancher tient, nous pourrions assister à un rallye de soulagement. S’il cède, le prochain support se situe autour de 48K.
Où pensez-vous que le Bitcoin trouve son plancher cette fois-ci ? 👇
#BitcoinPowerLaw #BTCPriceModel #CryptoMarketAnalysis
La loi de puissance du Bitcoin dit que 58K est normal.
Le Bitcoin vient de franchir 58 000 $ et Internet a perdu la tête. Mais le modèle de loi de puissance — qui a suivi la trajectoire du prix du Bitcoin depuis 2012 — dit que c’est exactement là où nous devrions en être dans le cycle en cours.
Le modèle met en relation le prix et le temps sur une échelle logarithmique, montrant que la croissance à long terme du Bitcoin suit un canal prévisible. À chaque cycle, les plus bas ont rebondi contre la borne inférieure du modèle, et 58K se situe juste dessus.
Cependant, les données sur les contrats à terme brossent un tableau plus sombre. L’intérêt ouvert est en baisse, les taux de financement sont négatifs et les marchés d’options intègrent un mouvement vers 50K. L’écart entre le plancher de la loi de puissance et le sentiment des produits dérivés est le plus large depuis le point bas de 2022.
Voici la vraie question : la loi de puissance tiendra-t-elle à nouveau, ou est-ce le cycle où le modèle se brise ? Chaque fois que le Bitcoin a chuté jusqu’à la borne inférieure auparavant, il s’est redressé et a atteint de nouveaux sommets. Mais cette fois, les vents contraires macroéconomiques sont différents — l’incertitude sur les taux, les sorties des ETF et des actions faibles pèsent tous en même temps.
Les ordres d’achat s’accumulent entre 56K et 58K sur les carnets d’ordres majeurs. Si ce plancher tient, nous pourrions assister à un rallye de soulagement. S’il cède, le prochain support se situe autour de 48K.
Où pensez-vous que le Bitcoin trouve son plancher cette fois-ci ? 👇
#BitcoinPowerLaw #BTCPriceModel #CryptoMarketAnalysis
Le Bitcoin vient de franchir 58 000 $ et Internet a perdu la tête. Mais le modèle de loi de puissance — qui a suivi la trajectoire du prix du Bitcoin depuis 2012 — dit que c’est exactement là où nous devrions en être dans le cycle en cours.
Le modèle met en relation le prix et le temps sur une échelle logarithmique, montrant que la croissance à long terme du Bitcoin suit un canal prévisible. À chaque cycle, les plus bas ont rebondi contre la borne inférieure du modèle, et 58K se situe juste dessus.
Cependant, les données sur les contrats à terme brossent un tableau plus sombre. L’intérêt ouvert est en baisse, les taux de financement sont négatifs et les marchés d’options intègrent un mouvement vers 50K. L’écart entre le plancher de la loi de puissance et le sentiment des produits dérivés est le plus large depuis le point bas de 2022.
Voici la vraie question : la loi de puissance tiendra-t-elle à nouveau, ou est-ce le cycle où le modèle se brise ? Chaque fois que le Bitcoin a chuté jusqu’à la borne inférieure auparavant, il s’est redressé et a atteint de nouveaux sommets. Mais cette fois, les vents contraires macroéconomiques sont différents — l’incertitude sur les taux, les sorties des ETF et des actions faibles pèsent tous en même temps.
Les ordres d’achat s’accumulent entre 56K et 58K sur les carnets d’ordres majeurs. Si ce plancher tient, nous pourrions assister à un rallye de soulagement. S’il cède, le prochain support se situe autour de 48K.
Où pensez-vous que le Bitcoin trouve son plancher cette fois-ci ? 👇
#BitcoinPowerLaw #BTCPriceModel #CryptoMarketAnalysis
1
58

·
--
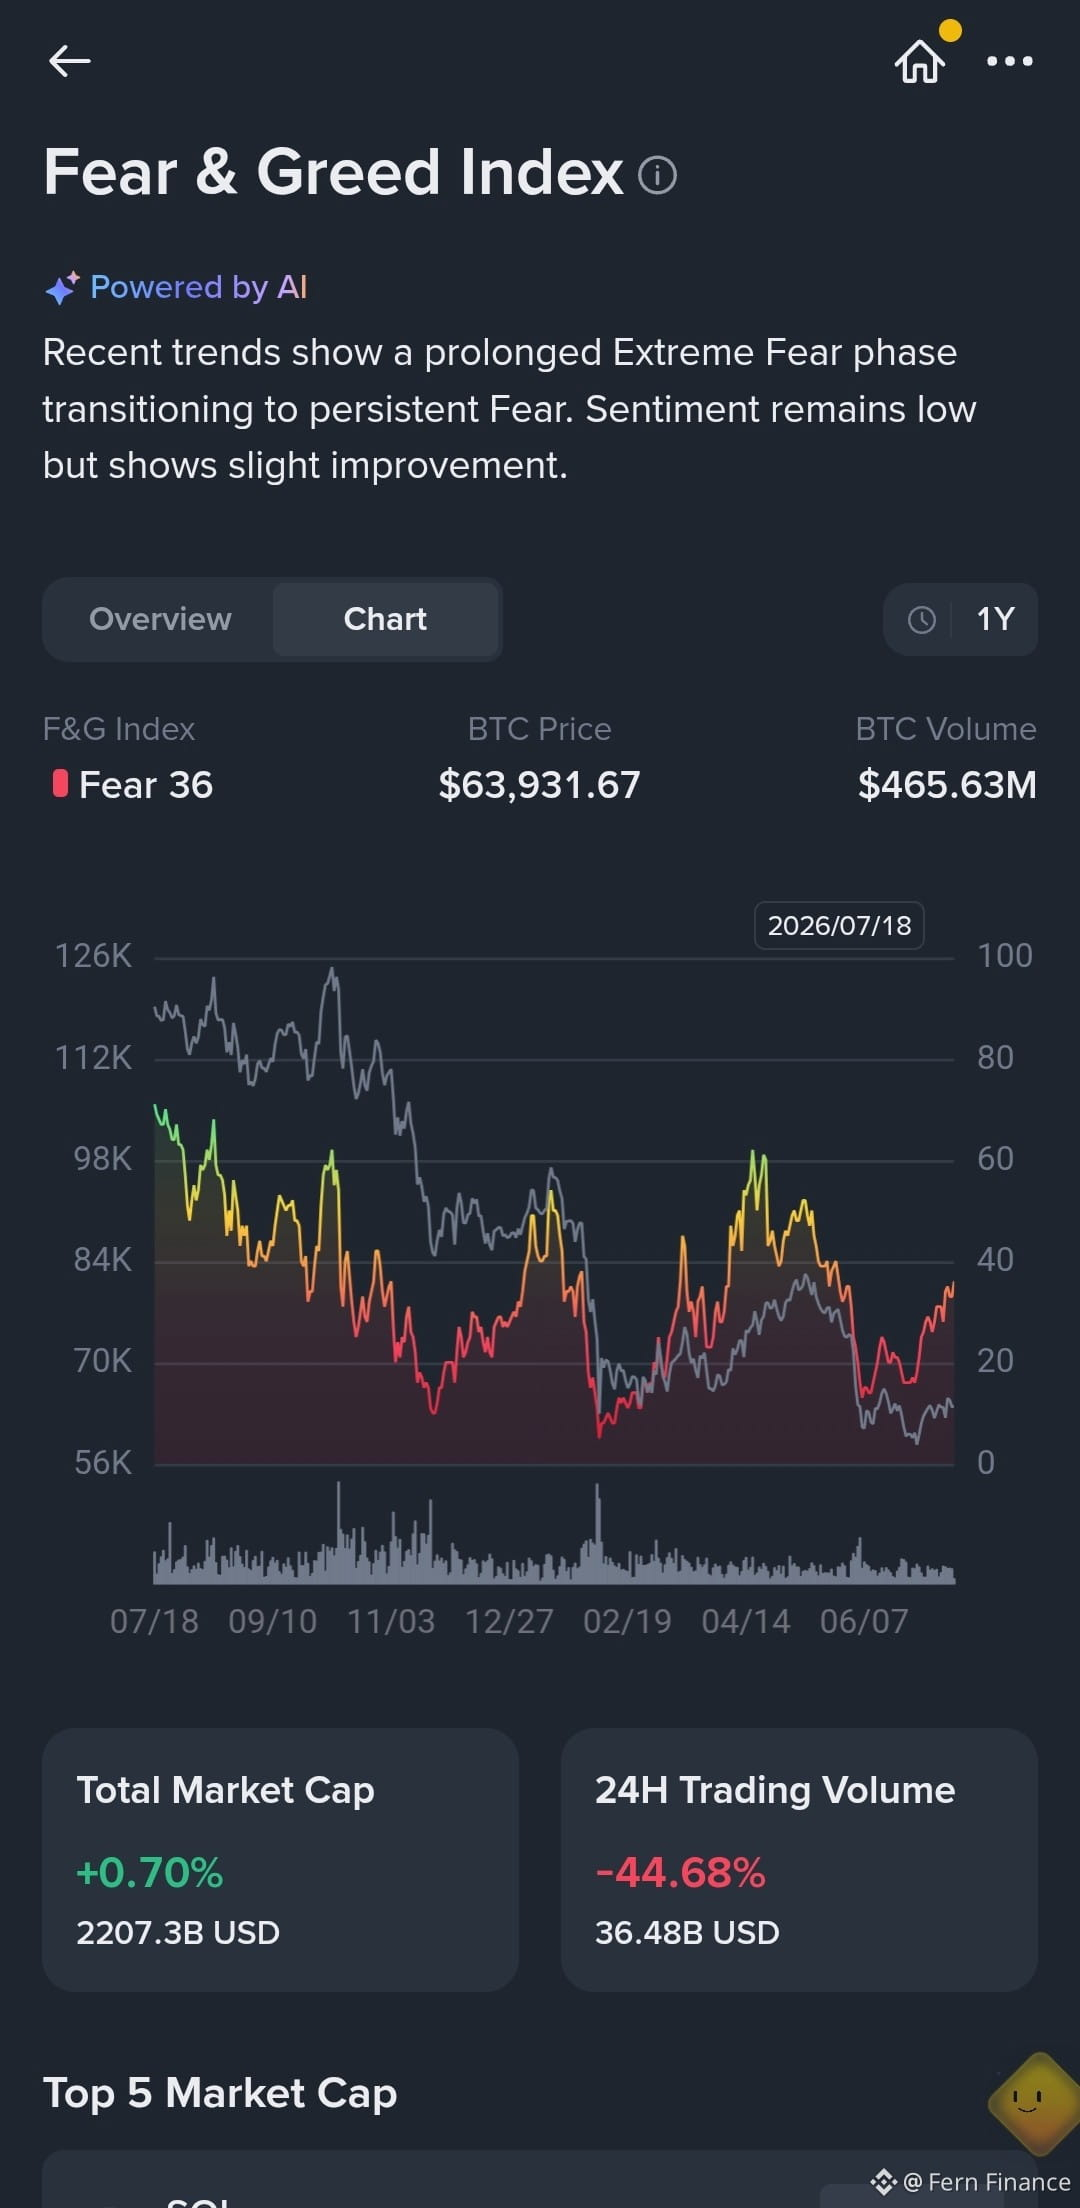
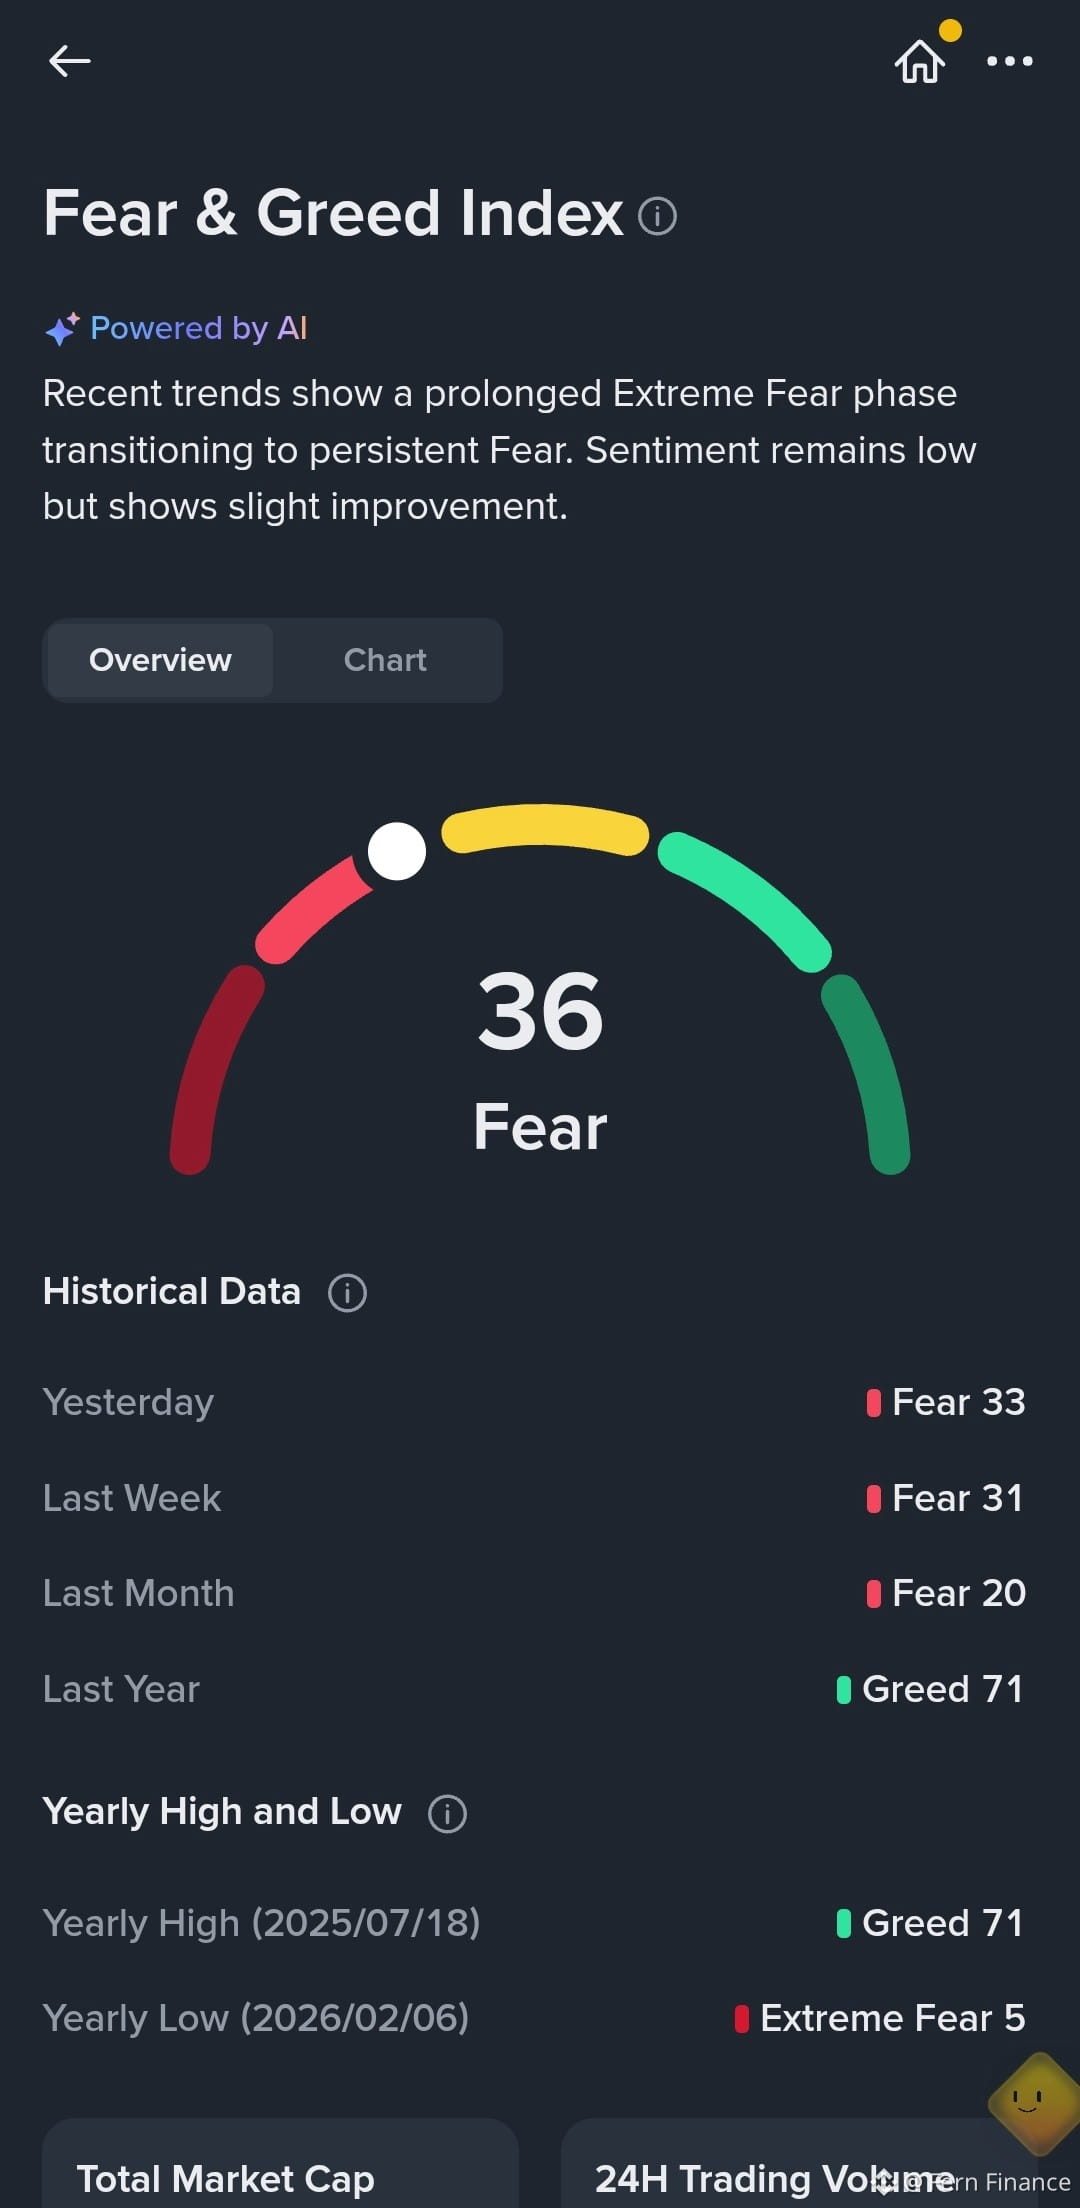
🚨 Changement de sentiment : l’indice crypto atteint 36 ! Les accumulateurs malins achètent-ils secrètement l’ennui ? 📉📈
Hey Square Traders ! 🚀
Le marché crypto nous envoie aujourd’hui un signal psychologique majeur. Si vous ne regardez que les graphiques de prix, vous passez à côté de l’image globale. Décomposons exactement ce que l’indice Fear & Greed (Peur & Convoitise) et les métriques on-chain nous disent en ce moment. 🧠
🔍 La grande anomalie : les prix montent, le volume se déserte
Le point de données le plus intéressant de notre tableau de bord n’est pas le prix — c’est la liquidité.
Capitalisation boursière totale : 2,20T $ (+0,70%)
Volume de trading sur 24h : 36,48 Md $ (-44,68%)
💡 Que signifie cela ? La capitalisation boursière totale reste stable et progresse légèrement, mais le volume de trading est complètement tombé dans un gouffre (en baisse d’environ 45 %). Cela indique une phase classique d’ennui et d’épuisement. Les vendeurs sont fatigués de vendre, et les traders particuliers restent les bras croisés en attendant un déclencheur clair. Historiquement, les phases de consolidation à faible volume dans une zone de « Peur » représentent de grandes fenêtres d’accumulation pour le capital patient.
🎯 Mon plan
Quand le marché est en mode « Peur » à faible volume, poursuivre des bougies vertes est généralement une embûche. À la place, c’est un environnement où la moyenne des coûts (DCA) sur les positions spot paie. Je surveille une flambée du volume pour confirmer si cette légère amélioration du sentiment a de vrais atouts derrière elle.
👇 Parlons-en en commentaires !
Achetez-vous cette consolidation à faible volume, ou pensez-vous qu’on va subir une nouvelle vague de FUD avant de repartir plus haut ? Laissez vos objectifs en dessous !
#CryptoMarketAnalysis #tradingstrategy
$BTC $BNB $BANK
{spot}(BTCUSDT)
🚨 Changement de sentiment : l’indice crypto atteint 36 ! Les accumulateurs malins achètent-ils secrètement l’ennui ? 📉📈
Hey Square Traders ! 🚀
Le marché crypto nous envoie aujourd’hui un signal psychologique majeur. Si vous ne regardez que les graphiques de prix, vous passez à côté de l’image globale. Décomposons exactement ce que l’indice Fear & Greed (Peur & Convoitise) et les métriques on-chain nous disent en ce moment. 🧠
🔍 La grande anomalie : les prix montent, le volume se déserte
Le point de données le plus intéressant de notre tableau de bord n’est pas le prix — c’est la liquidité.
Capitalisation boursière totale : 2,20T $ (+0,70%)
Volume de trading sur 24h : 36,48 Md $ (-44,68%)
💡 Que signifie cela ? La capitalisation boursière totale reste stable et progresse légèrement, mais le volume de trading est complètement tombé dans un gouffre (en baisse d’environ 45 %). Cela indique une phase classique d’ennui et d’épuisement. Les vendeurs sont fatigués de vendre, et les traders particuliers restent les bras croisés en attendant un déclencheur clair. Historiquement, les phases de consolidation à faible volume dans une zone de « Peur » représentent de grandes fenêtres d’accumulation pour le capital patient.
🎯 Mon plan
Quand le marché est en mode « Peur » à faible volume, poursuivre des bougies vertes est généralement une embûche. À la place, c’est un environnement où la moyenne des coûts (DCA) sur les positions spot paie. Je surveille une flambée du volume pour confirmer si cette légère amélioration du sentiment a de vrais atouts derrière elle.
👇 Parlons-en en commentaires !
Achetez-vous cette consolidation à faible volume, ou pensez-vous qu’on va subir une nouvelle vague de FUD avant de repartir plus haut ? Laissez vos objectifs en dessous !
#CryptoMarketAnalysis #tradingstrategy
$BTC $BNB $BANK
Hey Square Traders ! 🚀
Le marché crypto nous envoie aujourd’hui un signal psychologique majeur. Si vous ne regardez que les graphiques de prix, vous passez à côté de l’image globale. Décomposons exactement ce que l’indice Fear & Greed (Peur & Convoitise) et les métriques on-chain nous disent en ce moment. 🧠
🔍 La grande anomalie : les prix montent, le volume se déserte
Le point de données le plus intéressant de notre tableau de bord n’est pas le prix — c’est la liquidité.
Capitalisation boursière totale : 2,20T $ (+0,70%)
Volume de trading sur 24h : 36,48 Md $ (-44,68%)
💡 Que signifie cela ? La capitalisation boursière totale reste stable et progresse légèrement, mais le volume de trading est complètement tombé dans un gouffre (en baisse d’environ 45 %). Cela indique une phase classique d’ennui et d’épuisement. Les vendeurs sont fatigués de vendre, et les traders particuliers restent les bras croisés en attendant un déclencheur clair. Historiquement, les phases de consolidation à faible volume dans une zone de « Peur » représentent de grandes fenêtres d’accumulation pour le capital patient.
🎯 Mon plan
Quand le marché est en mode « Peur » à faible volume, poursuivre des bougies vertes est généralement une embûche. À la place, c’est un environnement où la moyenne des coûts (DCA) sur les positions spot paie. Je surveille une flambée du volume pour confirmer si cette légère amélioration du sentiment a de vrais atouts derrière elle.
👇 Parlons-en en commentaires !
Achetez-vous cette consolidation à faible volume, ou pensez-vous qu’on va subir une nouvelle vague de FUD avant de repartir plus haut ? Laissez vos objectifs en dessous !
#CryptoMarketAnalysis #tradingstrategy
$BTC $BNB $BANK
173
·
--
📈 Aperçu global du marché des cryptomonnaies
🌐 Statut du marché mondial : La capitalisation totale du marché se maintient près de 2,7 billions de dollars, avec un léger changement structurel alors que les traders se positionnent en prévision des prochaines décisions de taux des banques centrales.
👑 Dominance du Bitcoin : Continue de capter la majeure partie de la liquidité, à 59,04 %, avec un BTC qui s’échange autour de 78 830 $.
⚡ Principales blockchains de couche 1 : Ethereum (ETH) se consolide étroitement près de 2 548 $, tandis que XRP affiche une relative solidité, en hausse de plus de +6,47 % pour s’échanger près de 1,45 $.
🚀 Hausse des 5 meilleurs altcoins — Binance
🥇SENT ~ 0,0167 $ +14,77%
🥈MTL ~ 0,3215 $ +14,02%
🥉]ARK ~ 0,1656 $ +12,27%
4️⃣CRWDB ~ 238,14 $ +13,34%
5️⃣SOXSB ~ 50,65 $ +11,17%
🐸 Principaux meme coins / mouvements spéculatifs à bêta élevé
🥇 PEPE — +17,2 %
🥈 FLOKI — +13,5 %
🥉 SHIB — +10,1 %
4️⃣ DOGE — +8,9 %
5️⃣ BONK — +7,4 %
Note : Les prix des memes et des altcoins fluctuent rapidement en même temps que les mouvements macroéconomiques du Bitcoin ; vérifiez donc directement l’onglet « Gainers » / « Markets » de Binance en temps réel avant de passer des ordres.
#CryptoMarketAnalysis #BinanceTopGainers #AltcoinSeason
#MemeCoinRally
$SENT $ARK $CRWDB
{spot}(CRWDBUSDT)
{spot}(ARKUSDT)
{spot}(SENTUSDT)
📈 Aperçu global du marché des cryptomonnaies
🌐 Statut du marché mondial : La capitalisation totale du marché se maintient près de 2,7 billions de dollars, avec un léger changement structurel alors que les traders se positionnent en prévision des prochaines décisions de taux des banques centrales.
👑 Dominance du Bitcoin : Continue de capter la majeure partie de la liquidité, à 59,04 %, avec un BTC qui s’échange autour de 78 830 $.
⚡ Principales blockchains de couche 1 : Ethereum (ETH) se consolide étroitement près de 2 548 $, tandis que XRP affiche une relative solidité, en hausse de plus de +6,47 % pour s’échanger près de 1,45 $.
🚀 Hausse des 5 meilleurs altcoins — Binance
🥇SENT ~ 0,0167 $ +14,77%
🥈MTL ~ 0,3215 $ +14,02%
🥉]ARK ~ 0,1656 $ +12,27%
4️⃣CRWDB ~ 238,14 $ +13,34%
5️⃣SOXSB ~ 50,65 $ +11,17%
🐸 Principaux meme coins / mouvements spéculatifs à bêta élevé
🥇 PEPE — +17,2 %
🥈 FLOKI — +13,5 %
🥉 SHIB — +10,1 %
4️⃣ DOGE — +8,9 %
5️⃣ BONK — +7,4 %
Note : Les prix des memes et des altcoins fluctuent rapidement en même temps que les mouvements macroéconomiques du Bitcoin ; vérifiez donc directement l’onglet « Gainers » / « Markets » de Binance en temps réel avant de passer des ordres.
#CryptoMarketAnalysis #BinanceTopGainers #AltcoinSeason
#MemeCoinRally
$SENT $ARK $CRWDB
🌐 Statut du marché mondial : La capitalisation totale du marché se maintient près de 2,7 billions de dollars, avec un léger changement structurel alors que les traders se positionnent en prévision des prochaines décisions de taux des banques centrales.
👑 Dominance du Bitcoin : Continue de capter la majeure partie de la liquidité, à 59,04 %, avec un BTC qui s’échange autour de 78 830 $.
⚡ Principales blockchains de couche 1 : Ethereum (ETH) se consolide étroitement près de 2 548 $, tandis que XRP affiche une relative solidité, en hausse de plus de +6,47 % pour s’échanger près de 1,45 $.
🚀 Hausse des 5 meilleurs altcoins — Binance
🥇SENT ~ 0,0167 $ +14,77%
🥈MTL ~ 0,3215 $ +14,02%
🥉]ARK ~ 0,1656 $ +12,27%
4️⃣CRWDB ~ 238,14 $ +13,34%
5️⃣SOXSB ~ 50,65 $ +11,17%
🐸 Principaux meme coins / mouvements spéculatifs à bêta élevé
🥇 PEPE — +17,2 %
🥈 FLOKI — +13,5 %
🥉 SHIB — +10,1 %
4️⃣ DOGE — +8,9 %
5️⃣ BONK — +7,4 %
Note : Les prix des memes et des altcoins fluctuent rapidement en même temps que les mouvements macroéconomiques du Bitcoin ; vérifiez donc directement l’onglet « Gainers » / « Markets » de Binance en temps réel avant de passer des ordres.
#CryptoMarketAnalysis #BinanceTopGainers #AltcoinSeason
#MemeCoinRally
$SENT $ARK $CRWDB

1
3
131
·
--
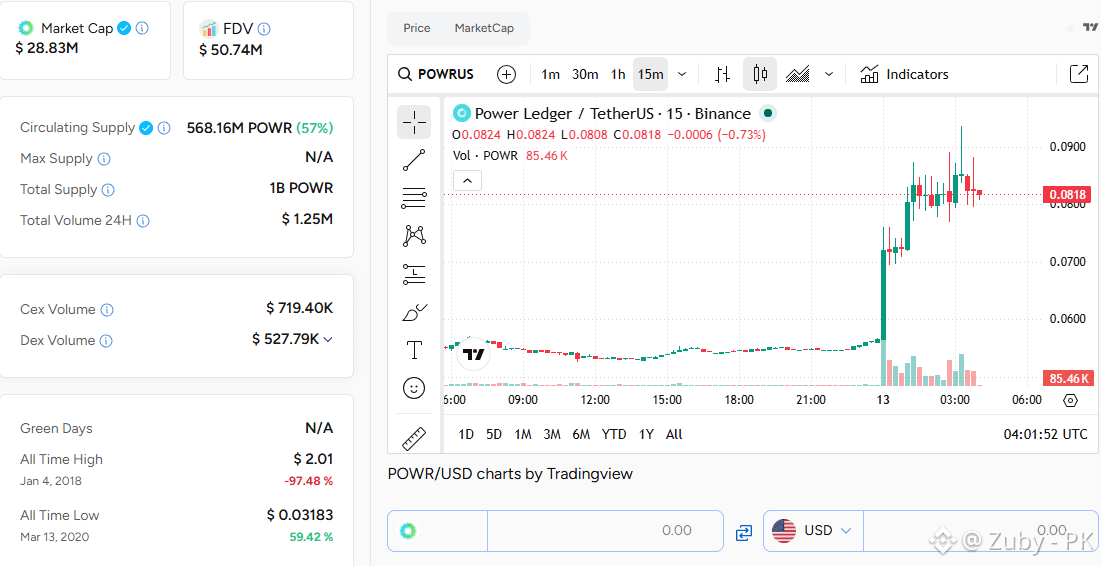
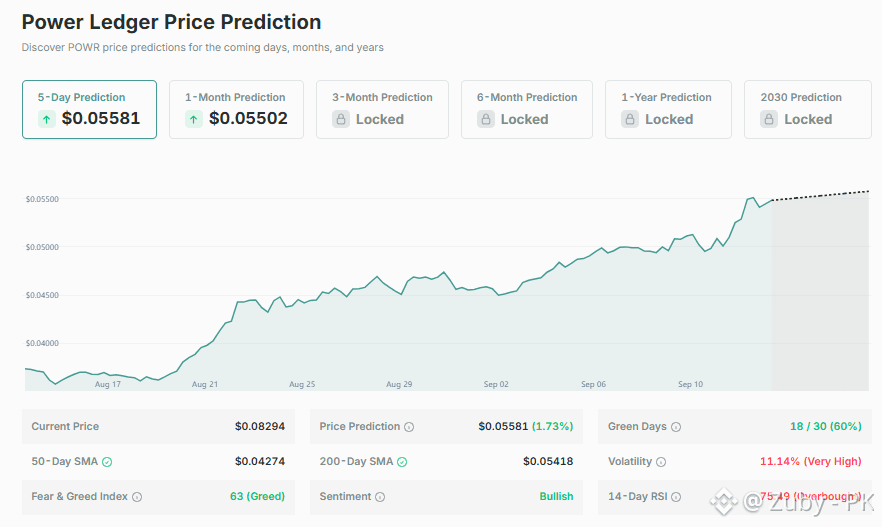
⚡ Analyse des Altcoins Tendances du Jour : Powerledger (POWR) — Aperçu du Marché
💰 Prix Actuel : 0,05074 $
📊 Volume sur 24 h : ~1,25 M$
📈 Variation sur 24 h : +2,83%
📉 Variation sur 1 h : -0,54%
🪙 Offre en circulation : 568,16 M POWR
🔄 Activité de Trading
🏦 Volume CEX : ~719,4 K$
🔄 Volume DEX : ~527,8 K$
📊 L’activité totale de trading reste d’environ 1,24 M$, montrant une participation active à la fois sur les marchés centralisés et décentralisés.
📍 Historique des Prix
🚀 Plus Haut historique : 2,01 $ — 4 janv. 2018
🔻 Plus Bas historique : 0,03183 $ — 13 mars 2020
📉 POWR reste à environ 97,48 % en dessous de son ATH, tandis qu’il a récupéré d’environ 59,42 % par rapport à son ATL.
🧠 À retenir pour le marché
⚡ POWR affiche un redressement modeste à court terme, mais sa grande distance par rapport à l’ATH met en évidence la volatilité à long terme du token et son potentiel de reprise.
📢 Ce contenu est fourni à des fins d’information et d’éducation uniquement et ne constitue pas un conseil financier, d’investissement, de trading ou juridique.
🏷️ #Powerledger #POWR #PowerledgerToken #CryptoMarketAnalysis
$POWR
{spot}(POWRUSDT)
⚡ Analyse des Altcoins Tendances du Jour : Powerledger (POWR) — Aperçu du Marché
💰 Prix Actuel : 0,05074 $
📊 Volume sur 24 h : ~1,25 M$
📈 Variation sur 24 h : +2,83%
📉 Variation sur 1 h : -0,54%
🪙 Offre en circulation : 568,16 M POWR
🔄 Activité de Trading
🏦 Volume CEX : ~719,4 K$
🔄 Volume DEX : ~527,8 K$
📊 L’activité totale de trading reste d’environ 1,24 M$, montrant une participation active à la fois sur les marchés centralisés et décentralisés.
📍 Historique des Prix
🚀 Plus Haut historique : 2,01 $ — 4 janv. 2018
🔻 Plus Bas historique : 0,03183 $ — 13 mars 2020
📉 POWR reste à environ 97,48 % en dessous de son ATH, tandis qu’il a récupéré d’environ 59,42 % par rapport à son ATL.
🧠 À retenir pour le marché
⚡ POWR affiche un redressement modeste à court terme, mais sa grande distance par rapport à l’ATH met en évidence la volatilité à long terme du token et son potentiel de reprise.
📢 Ce contenu est fourni à des fins d’information et d’éducation uniquement et ne constitue pas un conseil financier, d’investissement, de trading ou juridique.
🏷️ #Powerledger #POWR #PowerledgerToken #CryptoMarketAnalysis
$POWR
💰 Prix Actuel : 0,05074 $
📊 Volume sur 24 h : ~1,25 M$
📈 Variation sur 24 h : +2,83%
📉 Variation sur 1 h : -0,54%
🪙 Offre en circulation : 568,16 M POWR
🔄 Activité de Trading
🏦 Volume CEX : ~719,4 K$
🔄 Volume DEX : ~527,8 K$
📊 L’activité totale de trading reste d’environ 1,24 M$, montrant une participation active à la fois sur les marchés centralisés et décentralisés.
📍 Historique des Prix
🚀 Plus Haut historique : 2,01 $ — 4 janv. 2018
🔻 Plus Bas historique : 0,03183 $ — 13 mars 2020
📉 POWR reste à environ 97,48 % en dessous de son ATH, tandis qu’il a récupéré d’environ 59,42 % par rapport à son ATL.
🧠 À retenir pour le marché
⚡ POWR affiche un redressement modeste à court terme, mais sa grande distance par rapport à l’ATH met en évidence la volatilité à long terme du token et son potentiel de reprise.
📢 Ce contenu est fourni à des fins d’information et d’éducation uniquement et ne constitue pas un conseil financier, d’investissement, de trading ou juridique.
🏷️ #Powerledger #POWR #PowerledgerToken #CryptoMarketAnalysis
$POWR
3
243

·
--
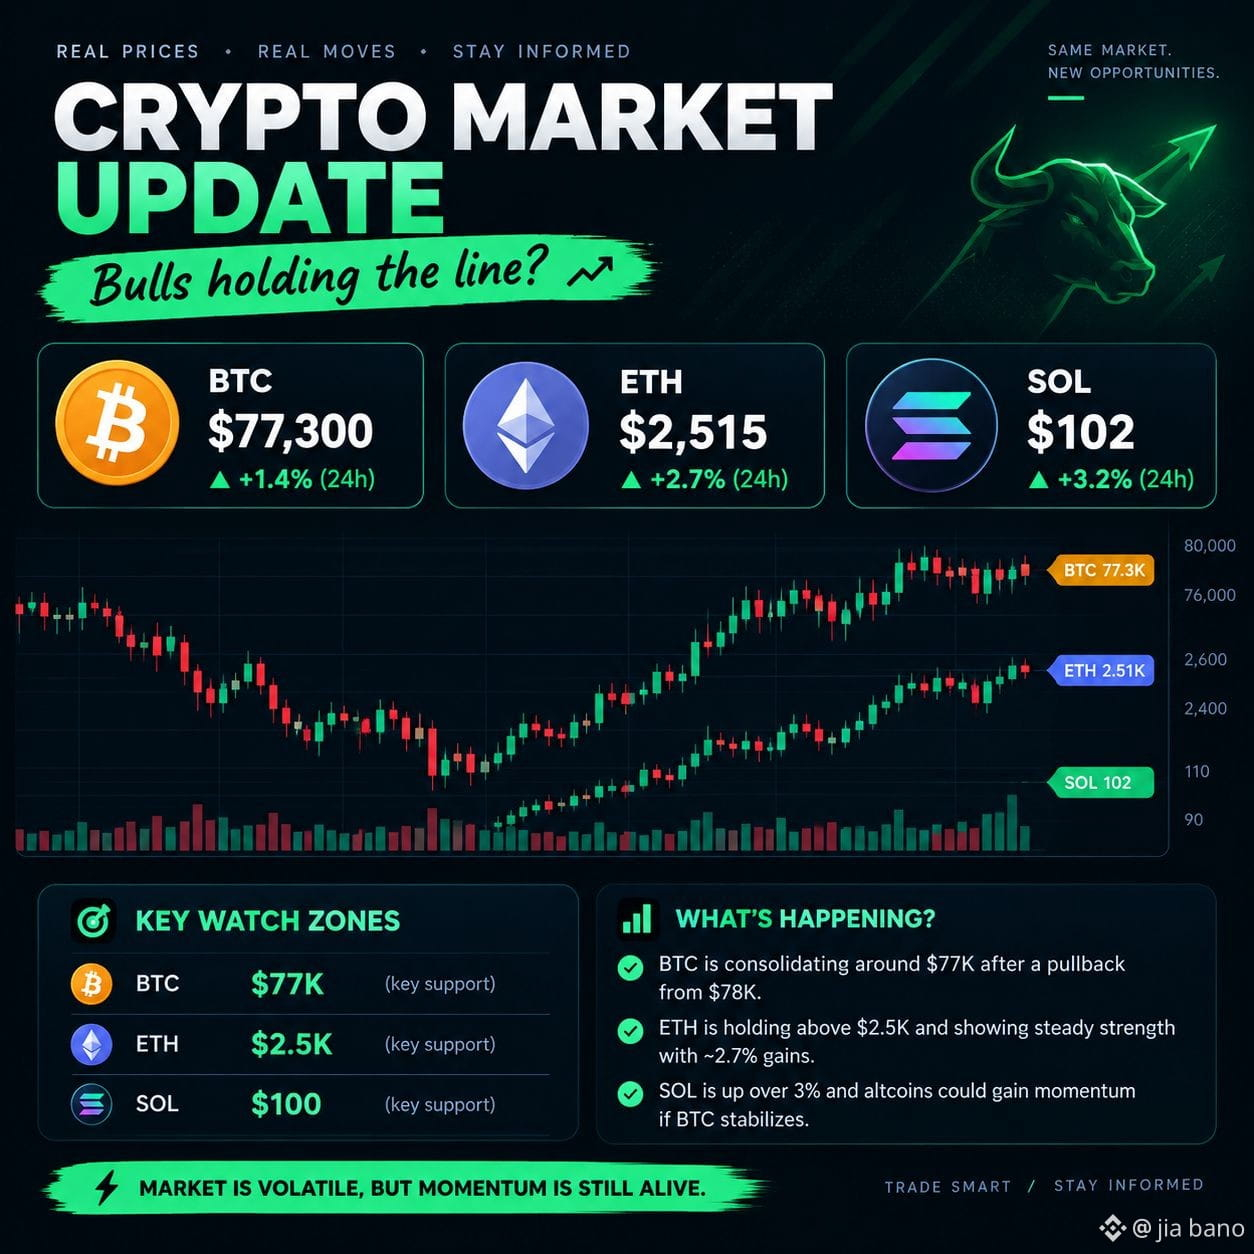
🚨 Mise à jour du marché crypto — Les haussiers ripostent ! 📈🔥
$BTC se maintient autour de 77K$ après un repli depuis 78K$, tandis que $ETH reste proche de 2,5K$ et continue de montrer de la force. �
The Economic Times +1
$ETH : 🔥 Le fait de tenir la zone des 2,5K$ pourrait maintenir le scénario haussier en vie.
$BTC : ⚔️ Les 77K$ sont la zone clé à surveiller pour le prochain mouvement.
$SOL : 👀 Les altcoins pourraient s’enflammer si le BTC se stabilise.
#CryptoMarketAnalysis
#bitcoin
#ETH(二饼)
#SOL空投
🚨 Mise à jour du marché crypto — Les haussiers ripostent ! 📈🔥
$BTC se maintient autour de 77K$ après un repli depuis 78K$, tandis que $ETH reste proche de 2,5K$ et continue de montrer de la force. �
The Economic Times +1
$ETH : 🔥 Le fait de tenir la zone des 2,5K$ pourrait maintenir le scénario haussier en vie.
$BTC : ⚔️ Les 77K$ sont la zone clé à surveiller pour le prochain mouvement.
$SOL : 👀 Les altcoins pourraient s’enflammer si le BTC se stabilise.
#CryptoMarketAnalysis
#bitcoin
#ETH(二饼)
#SOL空投
$BTC se maintient autour de 77K$ après un repli depuis 78K$, tandis que $ETH reste proche de 2,5K$ et continue de montrer de la force. �
The Economic Times +1
$ETH : 🔥 Le fait de tenir la zone des 2,5K$ pourrait maintenir le scénario haussier en vie.
$BTC : ⚔️ Les 77K$ sont la zone clé à surveiller pour le prochain mouvement.
$SOL : 👀 Les altcoins pourraient s’enflammer si le BTC se stabilise.
#CryptoMarketAnalysis
#bitcoin
#ETH(二饼)
#SOL空投
1
104
·
--
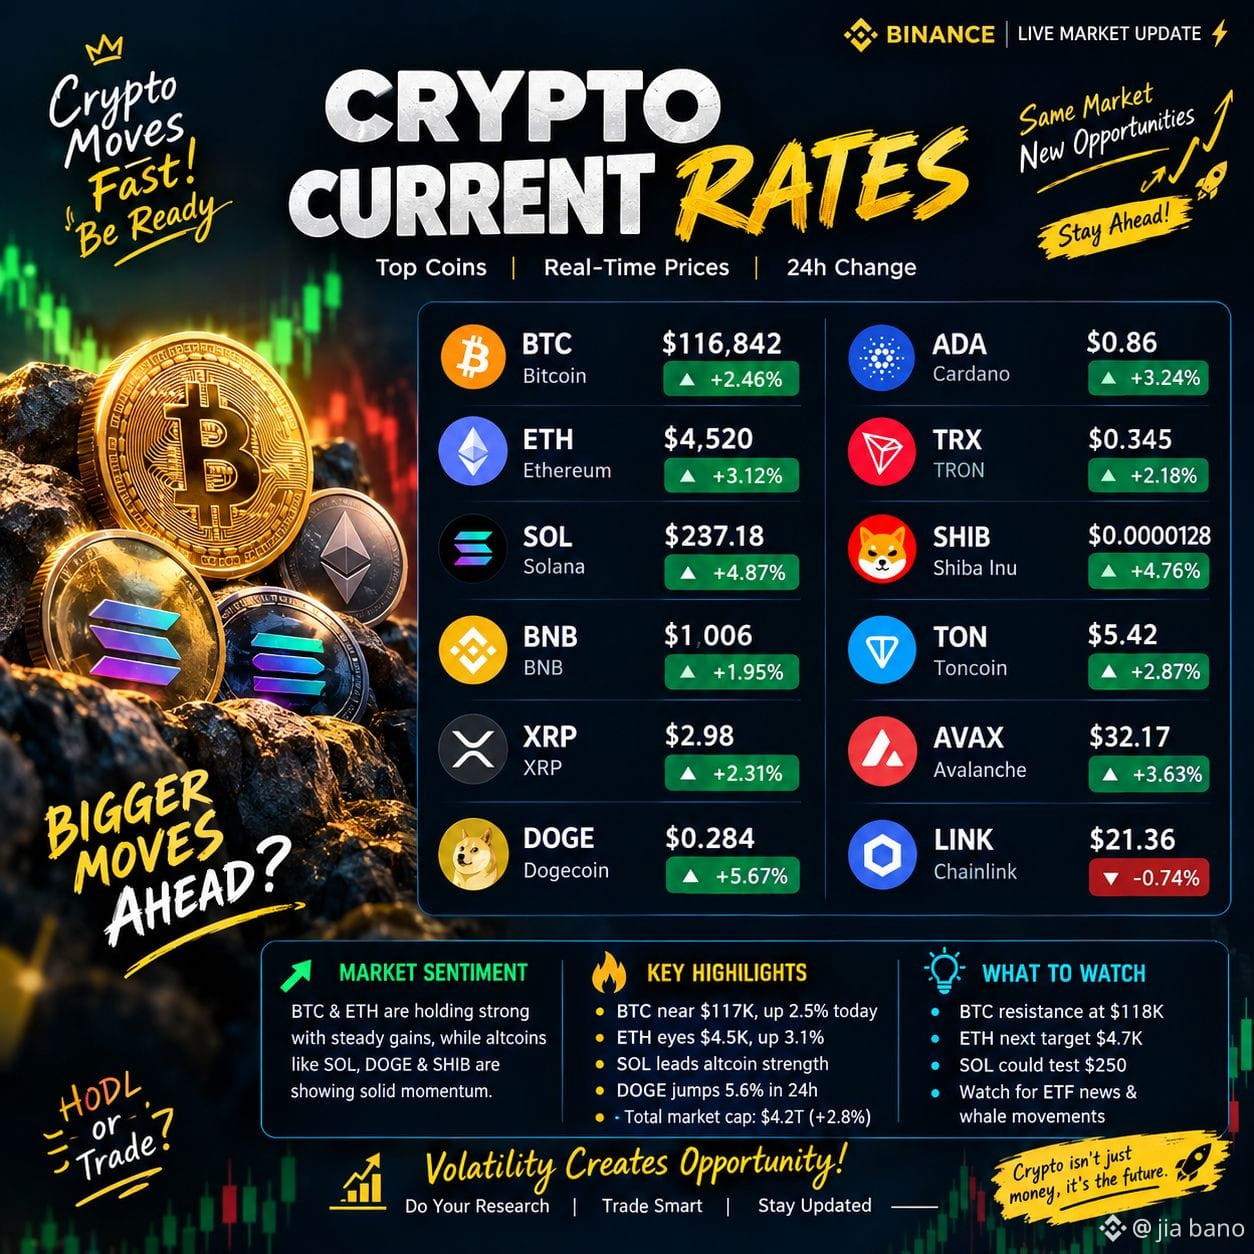
🚀 Mise à jour du marché des crypto : $BTC & $ETH restent solides, tandis que $SOL , DOGE & SHIB affichent une dynamique impressionnante. 📈🔥
👀 La volatilité augmente—le prochain grand mouvement serait-il juste au coin de la rue ? Restez aux aguets, tradez intelligemment ! ⚡📊
#CryptoMarketAnalysis
🚀 Mise à jour du marché des crypto : $BTC & $ETH restent solides, tandis que $SOL , DOGE & SHIB affichent une dynamique impressionnante. 📈🔥
👀 La volatilité augmente—le prochain grand mouvement serait-il juste au coin de la rue ? Restez aux aguets, tradez intelligemment ! ⚡📊
#CryptoMarketAnalysis
👀 La volatilité augmente—le prochain grand mouvement serait-il juste au coin de la rue ? Restez aux aguets, tradez intelligemment ! ⚡📊
#CryptoMarketAnalysis
93
·
--
⚡Aperçu du marché crypto : consolidation du BTC, cassures des altcoins & dynamique des memecoins
📊 Aperçu du marché crypto — 12 septembre 2026
🌐 Capitalisation totale : ~2,74 T$, consolidant autour de 0,7% sur 24 heures.
₿ Bitcoin : évolue de façon latérale entre 76 800$ et 78 300$, sous pression à cause de données d’inflation plus solides et des attentes d’une Fed restrictive.
♦️ Ethereum : se maintient autour de 2 485$–2 543$, légèrement plus faible que le BTC.
📈 Domination du BTC : élevée, proche de 56,5%–58,8%, signe d’une solidité persistante du Bitcoin.
🏛️ Réglementation : le Clarity Act, les propositions de safe-harbor de la SEC et la décision de la Fed la semaine prochaine restent des catalyseurs clés pour le marché.
🚀 Top 5 des plus fortes hausses d’altcoins
🟢 Storj (STORJ) — 0,62$ | +123,4% | volume : 93,9 M$
🔥 Meteora (MET) — 0,27$ | +23,7% | volume : 140,9 M$
⚡ Theta Fuel (TFUEL) — 0,011$ | +22,2% | volume : 58,4 M$
🚀 Raydium (RAY) — 1,55$ | +19,2% | volume : 342,8 M$
📈 Mina Protocol (MINA) — 0,10$ | +12,2% | volume : 32,0 M$
🐸 Top 5 des plus fortes hausses de memecoins
🦞 Lobster (LOBSTER) — 0,062$ | +88,0% | volume : 15,9 M$
📈 The Stonks Exchange (STONKEX) — 0,072$ | +79,9% | volume : 15,9 M$
🔥 LAB (LAB) — 0,067$ | +59,9% | volume : 46,8 M$
😂 Wojak (WOJAK) — 0,0033$ | +53,4% | volume : 276,8 K$
💥 STONK (STONK) — 0,28$ | +48,3% | volume : 131,6 M$
📊 Point rapide sur le marché
🚀 STORJ est l’altcoin le plus en vue, avec une hausse exceptionnelle de +123,4% sur 24h, tandis que RAY affiche le volume le plus élevé avec 342,8 M$.
🐸 Lobster mène le groupe des memecoins, en hausse de 88%, tandis que STONK combine un mouvement solide de +48,3% avec un volume inhabituellement important de 131,6 M$.
⚠️ Ces gains extrêmes indiquent aussi une volatilité très élevée. Poursuivre une hausse verticale peut comporter un risque de baisse important ; le volume, la liquidité, les niveaux de support et la confirmation après une cassure sont donc essentiels.
🏷️ #CryptoMarketAnalysis #AltcoinGainersToday #CryptoMarketTrends #AltcoinSeasonWatch #MemeCoinMarket
$MET $MINA $RAY
{spot}(RAYUSDT)
{spot}(MINAUSDT)
{spot}(METUSDT)
⚡Aperçu du marché crypto : consolidation du BTC, cassures des altcoins & dynamique des memecoins
📊 Aperçu du marché crypto — 12 septembre 2026
🌐 Capitalisation totale : ~2,74 T$, consolidant autour de 0,7% sur 24 heures.
₿ Bitcoin : évolue de façon latérale entre 76 800$ et 78 300$, sous pression à cause de données d’inflation plus solides et des attentes d’une Fed restrictive.
♦️ Ethereum : se maintient autour de 2 485$–2 543$, légèrement plus faible que le BTC.
📈 Domination du BTC : élevée, proche de 56,5%–58,8%, signe d’une solidité persistante du Bitcoin.
🏛️ Réglementation : le Clarity Act, les propositions de safe-harbor de la SEC et la décision de la Fed la semaine prochaine restent des catalyseurs clés pour le marché.
🚀 Top 5 des plus fortes hausses d’altcoins
🟢 Storj (STORJ) — 0,62$ | +123,4% | volume : 93,9 M$
🔥 Meteora (MET) — 0,27$ | +23,7% | volume : 140,9 M$
⚡ Theta Fuel (TFUEL) — 0,011$ | +22,2% | volume : 58,4 M$
🚀 Raydium (RAY) — 1,55$ | +19,2% | volume : 342,8 M$
📈 Mina Protocol (MINA) — 0,10$ | +12,2% | volume : 32,0 M$
🐸 Top 5 des plus fortes hausses de memecoins
🦞 Lobster (LOBSTER) — 0,062$ | +88,0% | volume : 15,9 M$
📈 The Stonks Exchange (STONKEX) — 0,072$ | +79,9% | volume : 15,9 M$
🔥 LAB (LAB) — 0,067$ | +59,9% | volume : 46,8 M$
😂 Wojak (WOJAK) — 0,0033$ | +53,4% | volume : 276,8 K$
💥 STONK (STONK) — 0,28$ | +48,3% | volume : 131,6 M$
📊 Point rapide sur le marché
🚀 STORJ est l’altcoin le plus en vue, avec une hausse exceptionnelle de +123,4% sur 24h, tandis que RAY affiche le volume le plus élevé avec 342,8 M$.
🐸 Lobster mène le groupe des memecoins, en hausse de 88%, tandis que STONK combine un mouvement solide de +48,3% avec un volume inhabituellement important de 131,6 M$.
⚠️ Ces gains extrêmes indiquent aussi une volatilité très élevée. Poursuivre une hausse verticale peut comporter un risque de baisse important ; le volume, la liquidité, les niveaux de support et la confirmation après une cassure sont donc essentiels.
🏷️ #CryptoMarketAnalysis #AltcoinGainersToday #CryptoMarketTrends #AltcoinSeasonWatch #MemeCoinMarket
$MET $MINA $RAY
📊 Aperçu du marché crypto — 12 septembre 2026
🌐 Capitalisation totale : ~2,74 T$, consolidant autour de 0,7% sur 24 heures.
₿ Bitcoin : évolue de façon latérale entre 76 800$ et 78 300$, sous pression à cause de données d’inflation plus solides et des attentes d’une Fed restrictive.
♦️ Ethereum : se maintient autour de 2 485$–2 543$, légèrement plus faible que le BTC.
📈 Domination du BTC : élevée, proche de 56,5%–58,8%, signe d’une solidité persistante du Bitcoin.
🏛️ Réglementation : le Clarity Act, les propositions de safe-harbor de la SEC et la décision de la Fed la semaine prochaine restent des catalyseurs clés pour le marché.
🚀 Top 5 des plus fortes hausses d’altcoins
🟢 Storj (STORJ) — 0,62$ | +123,4% | volume : 93,9 M$
🔥 Meteora (MET) — 0,27$ | +23,7% | volume : 140,9 M$
⚡ Theta Fuel (TFUEL) — 0,011$ | +22,2% | volume : 58,4 M$
🚀 Raydium (RAY) — 1,55$ | +19,2% | volume : 342,8 M$
📈 Mina Protocol (MINA) — 0,10$ | +12,2% | volume : 32,0 M$
🐸 Top 5 des plus fortes hausses de memecoins
🦞 Lobster (LOBSTER) — 0,062$ | +88,0% | volume : 15,9 M$
📈 The Stonks Exchange (STONKEX) — 0,072$ | +79,9% | volume : 15,9 M$
🔥 LAB (LAB) — 0,067$ | +59,9% | volume : 46,8 M$
😂 Wojak (WOJAK) — 0,0033$ | +53,4% | volume : 276,8 K$
💥 STONK (STONK) — 0,28$ | +48,3% | volume : 131,6 M$
📊 Point rapide sur le marché
🚀 STORJ est l’altcoin le plus en vue, avec une hausse exceptionnelle de +123,4% sur 24h, tandis que RAY affiche le volume le plus élevé avec 342,8 M$.
🐸 Lobster mène le groupe des memecoins, en hausse de 88%, tandis que STONK combine un mouvement solide de +48,3% avec un volume inhabituellement important de 131,6 M$.
⚠️ Ces gains extrêmes indiquent aussi une volatilité très élevée. Poursuivre une hausse verticale peut comporter un risque de baisse important ; le volume, la liquidité, les niveaux de support et la confirmation après une cassure sont donc essentiels.
🏷️ #CryptoMarketAnalysis #AltcoinGainersToday #CryptoMarketTrends #AltcoinSeasonWatch #MemeCoinMarket
$MET $MINA $RAY

1
4
476
·
--
🚀 Analyse des altcoins tendance du jour : Saga (SAGA) — Mise à jour rapide du marché
💰 Aperçu du marché
📊 Prix : 0,01597 $
📈 24H : +12,44 % | 📉 1H : -4,57 %
💵 Volume : 64,18 M$
🪙 Offre en circulation : 416,51 M SAGA
📈 Situation technique
🟢 SMA sur 50 jours : 0,01410 $ — positionnement haussier à court terme.
🔴 SMA sur 200 jours : 0,01958 $ — résistance clé à plus long terme.
🔥 RSI : 64,45 — dynamique positive, pas encore extrême.
📈 MACD : +0,000455 — pression haussière modérée.
🚀 ROC : 22,69 — dynamique positive.
🎯 À retenir
🚀 SAGA montre un fort redressement à court terme, mais le fait de reconquérir la zone de 0,01958 $ pourrait être important pour une tendance à plus long terme plus solide.
🗣📢 Avertissement relatif aux investissements : cet article est fourni à titre informatif uniquement et ne doit pas être considéré comme un conseil financier ou d’investissement. ⚠️
🔥#SagaSAGA #SAGAToken #CryptoMarketAnalysis #CryptoTechnicalAnalysis
$SAGA
{spot}(SAGAUSDT)
🚀 Analyse des altcoins tendance du jour : Saga (SAGA) — Mise à jour rapide du marché
💰 Aperçu du marché
📊 Prix : 0,01597 $
📈 24H : +12,44 % | 📉 1H : -4,57 %
💵 Volume : 64,18 M$
🪙 Offre en circulation : 416,51 M SAGA
📈 Situation technique
🟢 SMA sur 50 jours : 0,01410 $ — positionnement haussier à court terme.
🔴 SMA sur 200 jours : 0,01958 $ — résistance clé à plus long terme.
🔥 RSI : 64,45 — dynamique positive, pas encore extrême.
📈 MACD : +0,000455 — pression haussière modérée.
🚀 ROC : 22,69 — dynamique positive.
🎯 À retenir
🚀 SAGA montre un fort redressement à court terme, mais le fait de reconquérir la zone de 0,01958 $ pourrait être important pour une tendance à plus long terme plus solide.
🗣📢 Avertissement relatif aux investissements : cet article est fourni à titre informatif uniquement et ne doit pas être considéré comme un conseil financier ou d’investissement. ⚠️
🔥#SagaSAGA #SAGAToken #CryptoMarketAnalysis #CryptoTechnicalAnalysis
$SAGA
💰 Aperçu du marché
📊 Prix : 0,01597 $
📈 24H : +12,44 % | 📉 1H : -4,57 %
💵 Volume : 64,18 M$
🪙 Offre en circulation : 416,51 M SAGA
📈 Situation technique
🟢 SMA sur 50 jours : 0,01410 $ — positionnement haussier à court terme.
🔴 SMA sur 200 jours : 0,01958 $ — résistance clé à plus long terme.
🔥 RSI : 64,45 — dynamique positive, pas encore extrême.
📈 MACD : +0,000455 — pression haussière modérée.
🚀 ROC : 22,69 — dynamique positive.
🎯 À retenir
🚀 SAGA montre un fort redressement à court terme, mais le fait de reconquérir la zone de 0,01958 $ pourrait être important pour une tendance à plus long terme plus solide.
🗣📢 Avertissement relatif aux investissements : cet article est fourni à titre informatif uniquement et ne doit pas être considéré comme un conseil financier ou d’investissement. ⚠️
🔥#SagaSAGA #SAGAToken #CryptoMarketAnalysis #CryptoTechnicalAnalysis
$SAGA


2
217
·
--
$BTC — $80K approche.
$79,103 maintenant.
Plus haut 24 h : $79,216.
Le Bitcoin n’a pas besoin de battage ici.
Il a besoin d’une seule chose :
Passer les $80K → Tenir bon → Laisser le marché réagir.
Jusqu’à ce moment-là, $80K reste la ligne que tout le monde devrait surveiller.
$BTC #Bitcoin #CryptoMarketAnalysis
$BTC — $80K approche.
$79,103 maintenant.
Plus haut 24 h : $79,216.
Le Bitcoin n’a pas besoin de battage ici.
Il a besoin d’une seule chose :
Passer les $80K → Tenir bon → Laisser le marché réagir.
Jusqu’à ce moment-là, $80K reste la ligne que tout le monde devrait surveiller.
$BTC #Bitcoin #CryptoMarketAnalysis
$79,103 maintenant.
Plus haut 24 h : $79,216.
Le Bitcoin n’a pas besoin de battage ici.
Il a besoin d’une seule chose :
Passer les $80K → Tenir bon → Laisser le marché réagir.
Jusqu’à ce moment-là, $80K reste la ligne que tout le monde devrait surveiller.
$BTC #Bitcoin #CryptoMarketAnalysis
1
43
·
--
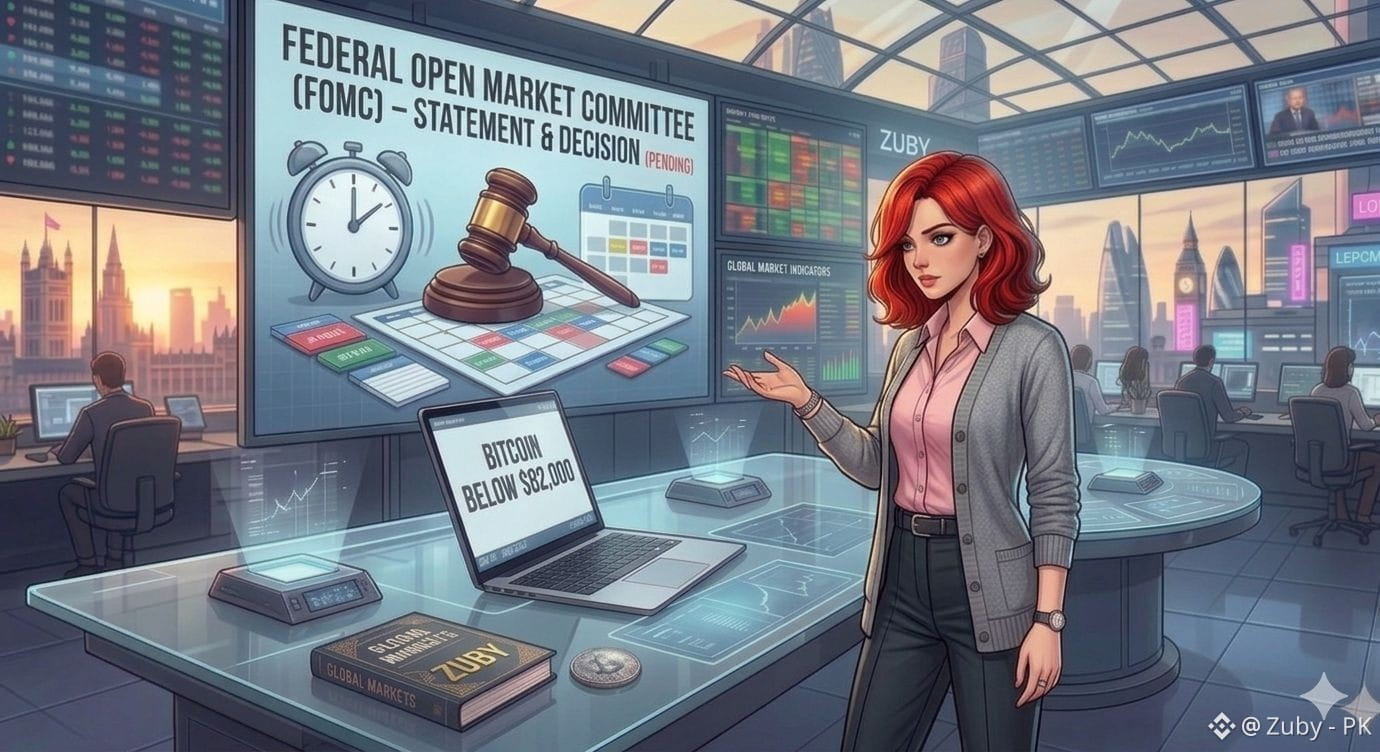
₿ Bitcoin pourrait rester sous 82 000 $ jusqu’à la décision de la Fed
📊 Le BTC reste en range
🔹 Le Bitcoin s’établit autour de 79 176 $, en baisse d’environ 0,8 %.
📉 Les analystes s’attendent à ce que le BTC demeure entre 78 000 $ et 82 000 $ jusqu’à la décision de la Fed.
🚧 80,5 K$ constitue la première résistance, tandis que 77,2 K$ est le support clé à la baisse.
💰 Les entrées des ETF soutiennent le BTC
💵 Les ETF spot Bitcoin américains ont attiré près de 987 M$ d’entrées hebdomadaires.
📈 Les flux sur trois semaines ont atteint environ 3,8 Md$, contribuant à maintenir le BTC près de 79 000 $.
🏦 Focus sur la Fed & l’IPC
📅 L’IPC du 11 septembre et la décision de la Fed du 16 septembre pourraient déclencher le prochain grand mouvement du Bitcoin.
🔥 Une inflation chaude et des rendements plus élevés pourraient peser sur le BTC.
🚀 Une inflation plus faible et des rendements en baisse pourraient soutenir une cassure.
🎯 Niveaux clés
🟢 Haussier : passage au-dessus de 82 K$
🔴 Résistance : 80,5 K$–82 K$
🟡 Support : 78 K$–79 K$
⚠️ Baissier : sous 77,2 K$
🔥 Perspectives
⏳ Le Bitcoin pourrait rester volatil et cantonné dans une fourchette jusqu’aux prochains indicateurs économiques américains et à ce que la Fed fournisse une direction plus claire.
🏷️#BitcoinPriceAnalysis #BTCMarketOutlook #BitcoinFedDecision #CryptoMarketAnalysis
$BTC
{spot}(BTCUSDT)
₿ Bitcoin pourrait rester sous 82 000 $ jusqu’à la décision de la Fed
📊 Le BTC reste en range
🔹 Le Bitcoin s’établit autour de 79 176 $, en baisse d’environ 0,8 %.
📉 Les analystes s’attendent à ce que le BTC demeure entre 78 000 $ et 82 000 $ jusqu’à la décision de la Fed.
🚧 80,5 K$ constitue la première résistance, tandis que 77,2 K$ est le support clé à la baisse.
💰 Les entrées des ETF soutiennent le BTC
💵 Les ETF spot Bitcoin américains ont attiré près de 987 M$ d’entrées hebdomadaires.
📈 Les flux sur trois semaines ont atteint environ 3,8 Md$, contribuant à maintenir le BTC près de 79 000 $.
🏦 Focus sur la Fed & l’IPC
📅 L’IPC du 11 septembre et la décision de la Fed du 16 septembre pourraient déclencher le prochain grand mouvement du Bitcoin.
🔥 Une inflation chaude et des rendements plus élevés pourraient peser sur le BTC.
🚀 Une inflation plus faible et des rendements en baisse pourraient soutenir une cassure.
🎯 Niveaux clés
🟢 Haussier : passage au-dessus de 82 K$
🔴 Résistance : 80,5 K$–82 K$
🟡 Support : 78 K$–79 K$
⚠️ Baissier : sous 77,2 K$
🔥 Perspectives
⏳ Le Bitcoin pourrait rester volatil et cantonné dans une fourchette jusqu’aux prochains indicateurs économiques américains et à ce que la Fed fournisse une direction plus claire.
🏷️#BitcoinPriceAnalysis #BTCMarketOutlook #BitcoinFedDecision #CryptoMarketAnalysis
$BTC
📊 Le BTC reste en range
🔹 Le Bitcoin s’établit autour de 79 176 $, en baisse d’environ 0,8 %.
📉 Les analystes s’attendent à ce que le BTC demeure entre 78 000 $ et 82 000 $ jusqu’à la décision de la Fed.
🚧 80,5 K$ constitue la première résistance, tandis que 77,2 K$ est le support clé à la baisse.
💰 Les entrées des ETF soutiennent le BTC
💵 Les ETF spot Bitcoin américains ont attiré près de 987 M$ d’entrées hebdomadaires.
📈 Les flux sur trois semaines ont atteint environ 3,8 Md$, contribuant à maintenir le BTC près de 79 000 $.
🏦 Focus sur la Fed & l’IPC
📅 L’IPC du 11 septembre et la décision de la Fed du 16 septembre pourraient déclencher le prochain grand mouvement du Bitcoin.
🔥 Une inflation chaude et des rendements plus élevés pourraient peser sur le BTC.
🚀 Une inflation plus faible et des rendements en baisse pourraient soutenir une cassure.
🎯 Niveaux clés
🟢 Haussier : passage au-dessus de 82 K$
🔴 Résistance : 80,5 K$–82 K$
🟡 Support : 78 K$–79 K$
⚠️ Baissier : sous 77,2 K$
🔥 Perspectives
⏳ Le Bitcoin pourrait rester volatil et cantonné dans une fourchette jusqu’aux prochains indicateurs économiques américains et à ce que la Fed fournisse une direction plus claire.
🏷️#BitcoinPriceAnalysis #BTCMarketOutlook #BitcoinFedDecision #CryptoMarketAnalysis
$BTC
1
28
·
--
Article
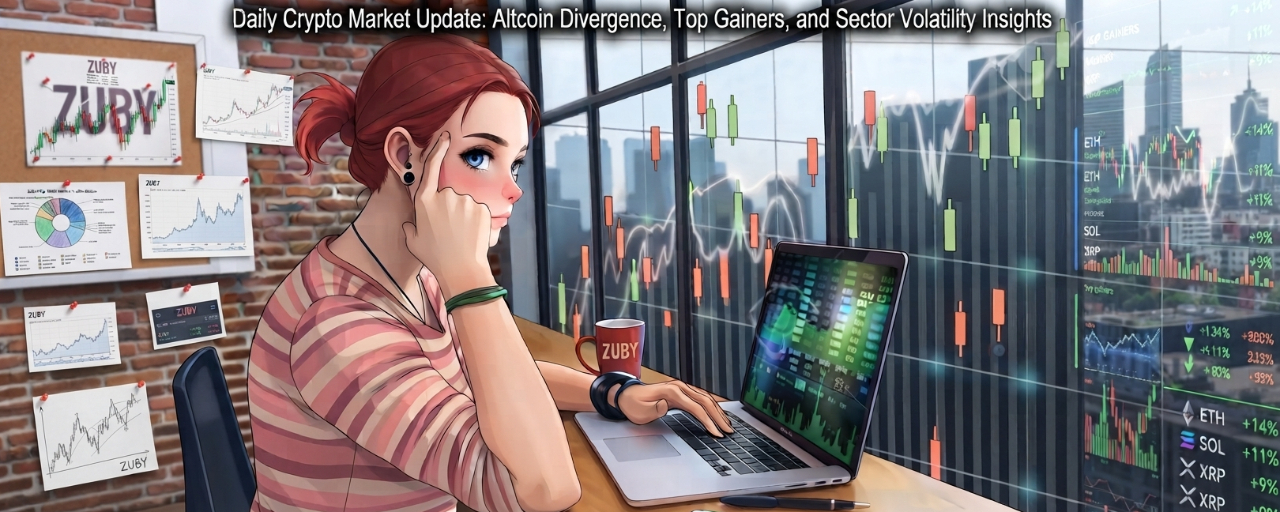
Mise à jour quotidienne du marché des cryptomonnaies : divergence des altcoins, principaux gagnants et perspectives sur la volatilité sectorielle📈 Aperçu mondial des cryptomonnaies (3 septembre 2026) 🌐💎
La capitalisation boursière mondiale du marché des cryptomonnaies s’élève à 2,71 billions de dollars, marquant une légère consolidation avec une variation de -0,3 % au cours des dernières 24 heures.
Le sentiment du marché reste mitigé en raison de pressions géopolitiques à court terme et de légers retraits des ETF spot, même si les fondamentaux de l’adoption à long terme mûrissent avec des discussions en tables rondes institutionnelles au sujet des opérations d’actions et de cryptomonnaies 24/7.
🪙 Bitcoin (BTC) : Trading à 77 250,55 $ avec une correction quotidienne de -0,20 %. La dominance du Bitcoin reste stable à 57,4 %.
Mise à jour quotidienne du marché des cryptomonnaies : divergence des altcoins, principaux gagnants et perspectives sur la volatilité sectorielle
📈 Aperçu mondial des cryptomonnaies (3 septembre 2026) 🌐💎
La capitalisation boursière mondiale du marché des cryptomonnaies s’élève à 2,71 billions de dollars, marquant une légère consolidation avec une variation de -0,3 % au cours des dernières 24 heures.
Le sentiment du marché reste mitigé en raison de pressions géopolitiques à court terme et de légers retraits des ETF spot, même si les fondamentaux de l’adoption à long terme mûrissent avec des discussions en tables rondes institutionnelles au sujet des opérations d’actions et de cryptomonnaies 24/7.
🪙 Bitcoin (BTC) : Trading à 77 250,55 $ avec une correction quotidienne de -0,20 %. La dominance du Bitcoin reste stable à 57,4 %.
La capitalisation boursière mondiale du marché des cryptomonnaies s’élève à 2,71 billions de dollars, marquant une légère consolidation avec une variation de -0,3 % au cours des dernières 24 heures.
Le sentiment du marché reste mitigé en raison de pressions géopolitiques à court terme et de légers retraits des ETF spot, même si les fondamentaux de l’adoption à long terme mûrissent avec des discussions en tables rondes institutionnelles au sujet des opérations d’actions et de cryptomonnaies 24/7.
🪙 Bitcoin (BTC) : Trading à 77 250,55 $ avec une correction quotidienne de -0,20 %. La dominance du Bitcoin reste stable à 57,4 %.
1
1
5
411
Connectez-vous pour découvrir plus de contenu
Rejoignez la communauté mondiale des adeptes de cryptomonnaies sur Binance Square
⚡️ Suviez les dernières informations importantes sur les cryptomonnaies.
💬 Jugé digne de confiance par la plus grande plateforme d’échange de cryptomonnaies au monde.
👍 Découvrez les connaissances que partagent les créateurs vérifiés.
Adresse e-mail/Nº de téléphone
Sujets d’actualité
1
#BitcoinReboundsTo$79K
20,044 vues
171 mentions
2
#BitcoinSpotETFsNetInflow$160M
114 vues
25 mentions
3
#SouthKoreaCryptoTaxDelayPetitionTops50000
9,113 vues
247 mentions
4
#SolanaTransactionV1GoesLiveOnMainnet
4,981 vues
163 mentions
5
#RussianCentralBankFlagsCryptoAsFinancialRisk
5,410 vues
188 mentions
6
#GrayscalePutsXRPAt26.11%InAdvisorPortfolio
17,272 vues
293 mentions
7
#PhiladelphiaSemiconductorIndexFalls5.9%
5,396 vues
178 mentions
8
#SECChairUrgesCongressToAdvanceClarityAct
17,917 vues
204 mentions
9
#FedHikeOddsRiseTo89%
109,303 vues
1,219 mentions
10
#RLUSDSupplyHitsRecord$2.442B
7,890 vues
70 mentions