

Shamaldi
3.1k Publications

Shamaldi
Signaler
Bloquer l’utilisateur
Ouvert au trading
Trade régulièrement
3 an(s)
251 Suivis
3.0K+ Abonnés
199 J’aime
Publications
Portefeuille
Tous
Citations
Direct
·
--
BEFORE SHARE ANY SIGNAL, BEFORE ENTERING ANY SIGNAL PLEASE READI know some people may not like what I’m saying, but I genuinely believe this is something we all need to think about.
Everyone has the freedom to write, post, and share whatever they want. That’s part of being in a trading community. But with that freedom also comes responsibility.
Before you share a trading signal, please stop for a moment and ask yourself:
“Have I really checked everything?”
Have you checked the latest market news?
Have you checked important economic data?
Have you considered geopolitics and global events?
Have you listened to the latest statements from Trump or other major leaders that could move the market?
Have you checked BTC and overall market sentiment if you’re sharing a crypto signal?
Have you properly analyzed the higher-timeframe and lower-timeframe charts?
Have you considered support, resistance, liquidity, volume, invalidation, and possible fake breakouts?
Because one simple post can have a much bigger impact than we realize.
Imagine someone sees your signal and thinks, “This person sounds confident, so I’ll trust it.” They may put in $50, $100, $500—or money they genuinely cannot afford to lose.
Then the market suddenly moves in the opposite direction because of breaking news, geopolitics, a speech, economic data, or a technical invalidation that wasn’t considered.
For some people, that loss might be just a number on a screen.
For someone else, it could be their food money, rent, school fees, savings, or money they worked extremely hard to earn.
That’s why I’m not saying “don’t share signals.”
I’m saying:
Please double-check before you share.
Please explain the risks.
Please avoid presenting speculation as certainty.
Please include the invalidation/SL and possible scenarios.
Please remember that real people may act on your words.
Nobody can predict the market with 100% accuracy. Not me, not you, not anyone.
A good trader should be willing to say “I could be wrong.”
Trading isn’t only about finding an entry. It’s also about protecting capital, understanding risk, and knowing what could make your idea invalid.
So before you post that next signal, take a few extra minutes.
Check the news. Check geopolitics. Check the major headlines and speeches. Check the charts. Check the market structure. Check the risk. Then share.
Because behind every trading account is a real person.
And sometimes, your post isn’t just a post—it can influence someone’s real money and their real life.
If you agree with this message, please like and share it. Maybe it will remind even one person to do more research before risking their hard-earned money. ❤️🙏
Trade responsibly. Protect your capital. Never blindly follow a signal.
#Binance
#solana
#ETHETFsApproved
#AI
BEFORE SHARE ANY SIGNAL, BEFORE ENTERING ANY SIGNAL PLEASE READ
I know some people may not like what I’m saying, but I genuinely believe this is something we all need to think about.
Everyone has the freedom to write, post, and share whatever they want. That’s part of being in a trading community. But with that freedom also comes responsibility.
Before you share a trading signal, please stop for a moment and ask yourself:
“Have I really checked everything?”
Have you checked the latest market news?
Have you checked important economic data?
Have you considered geopolitics and global events?
Have you listened to the latest statements from Trump or other major leaders that could move the market?
Have you checked BTC and overall market sentiment if you’re sharing a crypto signal?
Have you properly analyzed the higher-timeframe and lower-timeframe charts?
Have you considered support, resistance, liquidity, volume, invalidation, and possible fake breakouts?
Because one simple post can have a much bigger impact than we realize.
Imagine someone sees your signal and thinks, “This person sounds confident, so I’ll trust it.” They may put in $50, $100, $500—or money they genuinely cannot afford to lose.
Then the market suddenly moves in the opposite direction because of breaking news, geopolitics, a speech, economic data, or a technical invalidation that wasn’t considered.
For some people, that loss might be just a number on a screen.
For someone else, it could be their food money, rent, school fees, savings, or money they worked extremely hard to earn.
That’s why I’m not saying “don’t share signals.”
I’m saying:
Please double-check before you share.
Please explain the risks.
Please avoid presenting speculation as certainty.
Please include the invalidation/SL and possible scenarios.
Please remember that real people may act on your words.
Nobody can predict the market with 100% accuracy. Not me, not you, not anyone.
A good trader should be willing to say “I could be wrong.”
Trading isn’t only about finding an entry. It’s also about protecting capital, understanding risk, and knowing what could make your idea invalid.
So before you post that next signal, take a few extra minutes.
Check the news. Check geopolitics. Check the major headlines and speeches. Check the charts. Check the market structure. Check the risk. Then share.
Because behind every trading account is a real person.
And sometimes, your post isn’t just a post—it can influence someone’s real money and their real life.
If you agree with this message, please like and share it. Maybe it will remind even one person to do more research before risking their hard-earned money. ❤️🙏
Trade responsibly. Protect your capital. Never blindly follow a signal.
#Binance
#solana
#ETHETFsApproved
#AI
Everyone has the freedom to write, post, and share whatever they want. That’s part of being in a trading community. But with that freedom also comes responsibility.
Before you share a trading signal, please stop for a moment and ask yourself:
“Have I really checked everything?”
Have you checked the latest market news?
Have you checked important economic data?
Have you considered geopolitics and global events?
Have you listened to the latest statements from Trump or other major leaders that could move the market?
Have you checked BTC and overall market sentiment if you’re sharing a crypto signal?
Have you properly analyzed the higher-timeframe and lower-timeframe charts?
Have you considered support, resistance, liquidity, volume, invalidation, and possible fake breakouts?
Because one simple post can have a much bigger impact than we realize.
Imagine someone sees your signal and thinks, “This person sounds confident, so I’ll trust it.” They may put in $50, $100, $500—or money they genuinely cannot afford to lose.
Then the market suddenly moves in the opposite direction because of breaking news, geopolitics, a speech, economic data, or a technical invalidation that wasn’t considered.
For some people, that loss might be just a number on a screen.
For someone else, it could be their food money, rent, school fees, savings, or money they worked extremely hard to earn.
That’s why I’m not saying “don’t share signals.”
I’m saying:
Please double-check before you share.
Please explain the risks.
Please avoid presenting speculation as certainty.
Please include the invalidation/SL and possible scenarios.
Please remember that real people may act on your words.
Nobody can predict the market with 100% accuracy. Not me, not you, not anyone.
A good trader should be willing to say “I could be wrong.”
Trading isn’t only about finding an entry. It’s also about protecting capital, understanding risk, and knowing what could make your idea invalid.
So before you post that next signal, take a few extra minutes.
Check the news. Check geopolitics. Check the major headlines and speeches. Check the charts. Check the market structure. Check the risk. Then share.
Because behind every trading account is a real person.
And sometimes, your post isn’t just a post—it can influence someone’s real money and their real life.
If you agree with this message, please like and share it. Maybe it will remind even one person to do more research before risking their hard-earned money. ❤️🙏
Trade responsibly. Protect your capital. Never blindly follow a signal.
#Binance
#solana
#ETHETFsApproved
#AI
78
·
--
Let’s click that button and manifest 30 BNB! 🤞🔥 So grateful to be part of a community that celebrates wins, supports each other, and keeps spreading generosity. ❤️ Whatever happens, thank you for creating moments like this and giving everyone a chance to dream big. 🙏
[Let’s click that button and manifest 30 BNB! 🤞🔥 So grateful to be part of a community that celebrates wins, supports each other, and keeps spreading generosity. ❤️ Whatever happens, thank you for creating moments like this and giving everyone a chance to dream big](https://www.binance.com/game/button/30BNBButtonGame?ref=GRO_100023520_NCJE1®isterChannel=GRO-BTN-30BNBButtonGame&utm_source=share). 🙏
Let’s click that button and manifest 30 BNB! 🤞🔥 So grateful to be part of a community that celebrates wins, supports each other, and keeps spreading generosity. ❤️ Whatever happens, thank you for creating moments like this and giving everyone a chance to dream big. 🙏
Let’s click that button and manifest 30 BNB! 🤞🔥 So grateful to be part of a community that celebrates wins, supports each other, and keeps spreading generosity. ❤️ Whatever happens, thank you for creating moments like this and giving everyone a chance to dream big. 🙏
Let’s click that button and manifest 30 BNB! 🤞🔥 So grateful to be part of a community that celebrates wins, supports each other, and keeps spreading generosity. ❤️ Whatever happens, thank you for creating moments like this and giving everyone a chance to dream big. 🙏
13
·
--
#cpiwatch
🚨 CPI WATCH 🚨
NFP already came in much stronger than expected — now CPI is the big test.
🔥 HOT CPI: Inflation stays sticky → Fed hike becomes more likely → USD/Yields ↑ → risk assets, BTC & stocks could turn BEARISH.
❄️ COOL CPI: Inflation eases → Fed can HOLD → USD/Yields ↓ → BTC, stocks & gold could turn BULLISH.
The real question: Will CPI confirm the rate hike or save the Fed from hiking? 👀
#CPIWatch
#cpi
#Bitcoin
#Markets
#cpiwatch
🚨 CPI WATCH 🚨
NFP already came in much stronger than expected — now CPI is the big test.
🔥 HOT CPI: Inflation stays sticky → Fed hike becomes more likely → USD/Yields ↑ → risk assets, BTC & stocks could turn BEARISH.
❄️ COOL CPI: Inflation eases → Fed can HOLD → USD/Yields ↓ → BTC, stocks & gold could turn BULLISH.
The real question: Will CPI confirm the rate hike or save the Fed from hiking? 👀
#CPIWatch
#cpi
#Bitcoin
#Markets
🚨 CPI WATCH 🚨
NFP already came in much stronger than expected — now CPI is the big test.
🔥 HOT CPI: Inflation stays sticky → Fed hike becomes more likely → USD/Yields ↑ → risk assets, BTC & stocks could turn BEARISH.
❄️ COOL CPI: Inflation eases → Fed can HOLD → USD/Yields ↓ → BTC, stocks & gold could turn BULLISH.
The real question: Will CPI confirm the rate hike or save the Fed from hiking? 👀
#CPIWatch
#cpi
#Bitcoin
#Markets
1
1
97
·
--
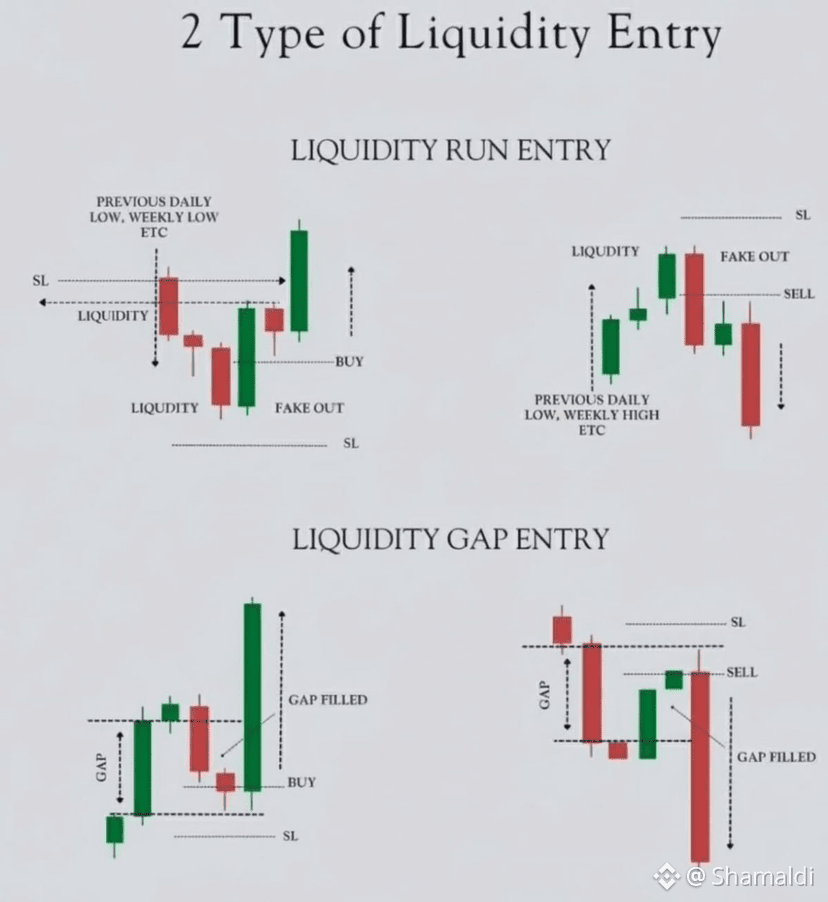
📌 LESSON: LIQUIDITY ENTRY – ONE SETUP FOR LIFE
Take a close look at the pattern in the image. This setup focuses on Liquidity Run, Liquidity Gap, and confirmation before entry
The logic is simple:
✅ Wait for price to reach an important liquidity level such as the Previous Daily High/Low or Weekly High/Low. Do not enter randomly in the middle of the move
✅ Price often creates a “Stop Hunt” by sweeping the liquidity before moving in the primary direction
✅ After the liquidity sweep, wait for a Fake Out / reversal confirmation instead of entering immediately
✅ For a Buy, wait for price to sweep the low and reclaim the level. For a Sell, wait for price to sweep the high and reject it
✅ For Liquidity Gap Entry, wait for price to return and fill the Gap before looking for confirmation
✅ Only enter after sufficient confirmation. Do not chase the price after a strong candle has already moved
✅ Entry: Enter on the next candle after the confirmation candle closes
✅ Target Risk:Reward ratio: 1:2
👉 The most important thing isn't catching every single price move
It is patiently waiting for the right liquidity, the right reaction, and the right confirmation.TX
📌 LESSON: LIQUIDITY ENTRY – ONE SETUP FOR LIFE
Take a close look at the pattern in the image. This setup focuses on Liquidity Run, Liquidity Gap, and confirmation before entry
The logic is simple:
✅ Wait for price to reach an important liquidity level such as the Previous Daily High/Low or Weekly High/Low. Do not enter randomly in the middle of the move
✅ Price often creates a “Stop Hunt” by sweeping the liquidity before moving in the primary direction
✅ After the liquidity sweep, wait for a Fake Out / reversal confirmation instead of entering immediately
✅ For a Buy, wait for price to sweep the low and reclaim the level. For a Sell, wait for price to sweep the high and reject it
✅ For Liquidity Gap Entry, wait for price to return and fill the Gap before looking for confirmation
✅ Only enter after sufficient confirmation. Do not chase the price after a strong candle has already moved
✅ Entry: Enter on the next candle after the confirmation candle closes
✅ Target Risk:Reward ratio: 1:2
👉 The most important thing isn't catching every single price move
It is patiently waiting for the right liquidity, the right reaction, and the right confirmation.TX
Take a close look at the pattern in the image. This setup focuses on Liquidity Run, Liquidity Gap, and confirmation before entry
The logic is simple:
✅ Wait for price to reach an important liquidity level such as the Previous Daily High/Low or Weekly High/Low. Do not enter randomly in the middle of the move
✅ Price often creates a “Stop Hunt” by sweeping the liquidity before moving in the primary direction
✅ After the liquidity sweep, wait for a Fake Out / reversal confirmation instead of entering immediately
✅ For a Buy, wait for price to sweep the low and reclaim the level. For a Sell, wait for price to sweep the high and reject it
✅ For Liquidity Gap Entry, wait for price to return and fill the Gap before looking for confirmation
✅ Only enter after sufficient confirmation. Do not chase the price after a strong candle has already moved
✅ Entry: Enter on the next candle after the confirmation candle closes
✅ Target Risk:Reward ratio: 1:2
👉 The most important thing isn't catching every single price move
It is patiently waiting for the right liquidity, the right reaction, and the right confirmation.TX
61
·
--
Baissier
$ONDO
🔻 #ONDO UPDATED SHORT SETUP
Entry Zone: 0.3700– 0.3670
🎯 TP1: 0.3450
🎯 TP2: 0.3350
🎯 TP3: 0.3200
🎯 TP4: 0.3050
🛑 Stop Loss: 0.3715
⏱️ Timeframe: M30 / H1
⚖️ Risk: Keep it low; don’t chase the short at market.
Invalidation: H1 closes above 0.3715 → cancel the short idea.
Management:
* At TP1 → secure partial profit
* At TP2 → move SL toward entry
* Let TP3/TP4 run only if BTC remains weak
This is a technical trading setup, not a guaranteed prediction.
$ONDO
🔻 #ONDO UPDATED SHORT SETUP
Entry Zone: 0.3700– 0.3670
🎯 TP1: 0.3450
🎯 TP2: 0.3350
🎯 TP3: 0.3200
🎯 TP4: 0.3050
🛑 Stop Loss: 0.3715
⏱️ Timeframe: M30 / H1
⚖️ Risk: Keep it low; don’t chase the short at market.
Invalidation: H1 closes above 0.3715 → cancel the short idea.
Management:
* At TP1 → secure partial profit
* At TP2 → move SL toward entry
* Let TP3/TP4 run only if BTC remains weak
This is a technical trading setup, not a guaranteed prediction.
🔻 #ONDO UPDATED SHORT SETUP
Entry Zone: 0.3700– 0.3670
🎯 TP1: 0.3450
🎯 TP2: 0.3350
🎯 TP3: 0.3200
🎯 TP4: 0.3050
🛑 Stop Loss: 0.3715
⏱️ Timeframe: M30 / H1
⚖️ Risk: Keep it low; don’t chase the short at market.
Invalidation: H1 closes above 0.3715 → cancel the short idea.
Management:
* At TP1 → secure partial profit
* At TP2 → move SL toward entry
* Let TP3/TP4 run only if BTC remains weak
This is a technical trading setup, not a guaranteed prediction.
1
109
·
--
Haussier
💸 ROSE LONG SETUP 🌹
⏱️ Timeframe: 15M
📍 Entry: 0.006268
🎯 TP1: 0.006333
🎯 TP2: 0.006451
🎯 TP3: 0.006557
🎯 TP4: 0.006890
🛡️ SL: 0.005958
➡️ Move SL to breakeven after TP1.
Stay patient, manage risk, and let the setup play out. 🚀📈
#rose
#LONG✅
#TradingSignals
#TradingCommunity
💸 ROSE LONG SETUP 🌹
⏱️ Timeframe: 15M
📍 Entry: 0.006268
🎯 TP1: 0.006333
🎯 TP2: 0.006451
🎯 TP3: 0.006557
🎯 TP4: 0.006890
🛡️ SL: 0.005958
➡️ Move SL to breakeven after TP1.
Stay patient, manage risk, and let the setup play out. 🚀📈
#rose
#LONG✅
#TradingSignals
#TradingCommunity
⏱️ Timeframe: 15M
📍 Entry: 0.006268
🎯 TP1: 0.006333
🎯 TP2: 0.006451
🎯 TP3: 0.006557
🎯 TP4: 0.006890
🛡️ SL: 0.005958
➡️ Move SL to breakeven after TP1.
Stay patient, manage risk, and let the setup play out. 🚀📈
#rose
#LONG✅
#TradingSignals
#TradingCommunity
2
175
·
--
Looking at the current charts alongside the geopolitical situation, especially the developments surrounding the Iran war, I’m starting to notice several similarities with the market environment we saw last year. The combination of geopolitical uncertainty, changing oil prices, rising yields, and shifts in overall risk sentiment makes the current setup feel somewhat familiar to me.
I’m not a professional trader or analyst, so this is only my personal observation rather than a confident prediction. It’s possible that these similarities mean very little this time, and the market could react completely differently.
Still, I feel there’s a reasonable chance of increased volatility and potentially another meaningful correction, similar to what we saw last October. On the other hand, if geopolitical tensions ease or market conditions improve, we could see the opposite reaction.
So I’m not expecting a crash or saying a big drop is definitely coming. I’m simply staying a little more cautious, watching for confirmation, and keeping both bullish and bearish scenarios in mind. 👀📊
Looking at the current charts alongside the geopolitical situation, especially the developments surrounding the Iran war, I’m starting to notice several similarities with the market environment we saw last year. The combination of geopolitical uncertainty, changing oil prices, rising yields, and shifts in overall risk sentiment makes the current setup feel somewhat familiar to me.
I’m not a professional trader or analyst, so this is only my personal observation rather than a confident prediction. It’s possible that these similarities mean very little this time, and the market could react completely differently.
Still, I feel there’s a reasonable chance of increased volatility and potentially another meaningful correction, similar to what we saw last October. On the other hand, if geopolitical tensions ease or market conditions improve, we could see the opposite reaction.
So I’m not expecting a crash or saying a big drop is definitely coming. I’m simply staying a little more cautious, watching for confirmation, and keeping both bullish and bearish scenarios in mind. 👀📊
I’m not a professional trader or analyst, so this is only my personal observation rather than a confident prediction. It’s possible that these similarities mean very little this time, and the market could react completely differently.
Still, I feel there’s a reasonable chance of increased volatility and potentially another meaningful correction, similar to what we saw last October. On the other hand, if geopolitical tensions ease or market conditions improve, we could see the opposite reaction.
So I’m not expecting a crash or saying a big drop is definitely coming. I’m simply staying a little more cautious, watching for confirmation, and keeping both bullish and bearish scenarios in mind. 👀📊
77
·
--
Pakistan is trying to revive the Islamadabad MoU,What is actually happening?
Pakistan is trying to revive the Islamadabad MoU, an interim US–Iran peace framework signed in June. Pakistan says its latest discussions with Iran produced “significant progress,” with the focus on de-escalation, the Strait of Hormuz and getting the US–Iran negotiation process moving again.
There are several important developments:
🇵🇰 Pakistan’s army chief Asim Munir and Interior Minister Mohsin Naqvi met Iranian leadership.
🇺🇸 Trump had reportedly spoken with Munir before the Tehran visit and encouraged Pakistan to use its influence to bring Iran back toward negotiations.
🇮🇷 Iran has indicated that it wants the US to honor its commitments under the existing Islamabad MoU.
🛢️ The Strait of Hormuz is a major issue because disruption there threatens global energy supplies.
⚠️ At the same time, the US has expanded sanctions on Iran and Iran has threatened retaliation, so the situation remains highly fragile.
Pakistan’s own foreign ministry has previously said that resolving the Hormuz standoff could create conditions for the US and Iran to return to technical-level negotiations.
What could happen to Bitcoin and crypto?
I would look at three scenarios:
Scenario
Bitcoin/crypto reaction
Risk
🟢 Peace talks progress
Bullish
Lower geopolitical risk
🟡 Talks continue but no agreement
Sideways/volatile
Medium
🔴 Talks collapse / war escalates
Bearish initially
High
🟢 1. If negotiations genuinely progress
This is the most bullish scenario for crypto.
If the US and Iran move toward a real ceasefire and eventually reopen/secure Hormuz, markets could see:
Iran peace progress → oil risk falls → inflation fears ease → risk appetite improves → crypto benefits.
Bitcoin could receive additional support because investors tend to move back into risk assets when geopolitical uncertainty decreases.
We have already seen this type of relationship during previous Iran peace developments: reports of peace talks have coincided with falling oil prices and rising Bitcoin.
And recently Bitcoin has already shown strong momentum; BTC reportedly gained more than 20% over the previous week, while ETH, SOL and XRP also posted large gains.
🟡 2. If we only get diplomatic headlines
This is where I would be careful.
“Significant progress” ≠ peace agreement.
The US has not yet publicly confirmed a new agreement, and Iran continues to face sanctions and tensions remain around Hormuz.
So we could see:
Headline → BTC pumps → traders take profit → BTC retraces → another headline → pump again.
That would create very high volatility.
🔴 3. If negotiations fail
This could become dangerous for crypto.
If Iran blocks Hormuz, attacks increase, or the US expands military action:
War escalation → oil ↑ → inflation fears ↑ → risk-off → stocks/crypto ↓
Bitcoin could initially behave more like a risk asset rather than a traditional safe haven.
Altcoins would probably be hit harder than BTC.
For example, in a major risk-off move I would expect something roughly like:
BTC → relatively strongest
ETH → more volatile
SOL/XRP → higher volatility
small-cap altcoins → potentially severe downside
My current view
The Pakistan development is bullish for the medium-term crypto outlook, but I would call it “early bullish” rather than “confirmed bullish.”
The biggest confirmation I would watch is:
1. US officially agrees to negotiations
↓
2. Iran agrees to negotiations
↓
3. Hormuz reopening/de-escalation
↓
4. Actual ceasefire/settlement
If we get #1 + #2, crypto could start pricing in peace.
If we get #3, I would become considerably more bullish.
If we get #4, the geopolitical risk premium could fall substantially.
For BTC specifically
I wouldn’t chase a huge green candle simply because of today’s Pakistan/Iran news.
I’d watch BTC price + oil + US dollar + gold together.
A particularly bullish combination would be:
Oil ↓ + Gold ↓ + DXY ↓ + BTC ↑
That would suggest money is moving away from geopolitical/inflation protection and back toward risk assets.
Conversely:
Oil ↑ + Gold ↑ + DXY ↑ + BTC ↓
would indicate the market is becoming more defensive.
Bottom line: Today’s news is positive, but the real market-moving event isn’t Pakistan saying “significant progress.” The major catalyst would be Washington and Tehran officially agreeing to restart negotiations and taking concrete steps toward reopening Hormuz. That could be a strong bullish catalyst for BTC and especially for high-beta altcoins.
Pakistan is trying to revive the Islamadabad MoU,
What is actually happening?
Pakistan is trying to revive the Islamadabad MoU, an interim US–Iran peace framework signed in June. Pakistan says its latest discussions with Iran produced “significant progress,” with the focus on de-escalation, the Strait of Hormuz and getting the US–Iran negotiation process moving again.
There are several important developments:
🇵🇰 Pakistan’s army chief Asim Munir and Interior Minister Mohsin Naqvi met Iranian leadership.
🇺🇸 Trump had reportedly spoken with Munir before the Tehran visit and encouraged Pakistan to use its influence to bring Iran back toward negotiations.
🇮🇷 Iran has indicated that it wants the US to honor its commitments under the existing Islamabad MoU.
🛢️ The Strait of Hormuz is a major issue because disruption there threatens global energy supplies.
⚠️ At the same time, the US has expanded sanctions on Iran and Iran has threatened retaliation, so the situation remains highly fragile.
Pakistan’s own foreign ministry has previously said that resolving the Hormuz standoff could create conditions for the US and Iran to return to technical-level negotiations.
What could happen to Bitcoin and crypto?
I would look at three scenarios:
Scenario
Bitcoin/crypto reaction
Risk
🟢 Peace talks progress
Bullish
Lower geopolitical risk
🟡 Talks continue but no agreement
Sideways/volatile
Medium
🔴 Talks collapse / war escalates
Bearish initially
High
🟢 1. If negotiations genuinely progress
This is the most bullish scenario for crypto.
If the US and Iran move toward a real ceasefire and eventually reopen/secure Hormuz, markets could see:
Iran peace progress → oil risk falls → inflation fears ease → risk appetite improves → crypto benefits.
Bitcoin could receive additional support because investors tend to move back into risk assets when geopolitical uncertainty decreases.
We have already seen this type of relationship during previous Iran peace developments: reports of peace talks have coincided with falling oil prices and rising Bitcoin.
And recently Bitcoin has already shown strong momentum; BTC reportedly gained more than 20% over the previous week, while ETH, SOL and XRP also posted large gains.
🟡 2. If we only get diplomatic headlines
This is where I would be careful.
“Significant progress” ≠ peace agreement.
The US has not yet publicly confirmed a new agreement, and Iran continues to face sanctions and tensions remain around Hormuz.
So we could see:
Headline → BTC pumps → traders take profit → BTC retraces → another headline → pump again.
That would create very high volatility.
🔴 3. If negotiations fail
This could become dangerous for crypto.
If Iran blocks Hormuz, attacks increase, or the US expands military action:
War escalation → oil ↑ → inflation fears ↑ → risk-off → stocks/crypto ↓
Bitcoin could initially behave more like a risk asset rather than a traditional safe haven.
Altcoins would probably be hit harder than BTC.
For example, in a major risk-off move I would expect something roughly like:
BTC → relatively strongest
ETH → more volatile
SOL/XRP → higher volatility
small-cap altcoins → potentially severe downside
My current view
The Pakistan development is bullish for the medium-term crypto outlook, but I would call it “early bullish” rather than “confirmed bullish.”
The biggest confirmation I would watch is:
1. US officially agrees to negotiations
↓
2. Iran agrees to negotiations
↓
3. Hormuz reopening/de-escalation
↓
4. Actual ceasefire/settlement
If we get #1 + #2, crypto could start pricing in peace.
If we get #3, I would become considerably more bullish.
If we get #4, the geopolitical risk premium could fall substantially.
For BTC specifically
I wouldn’t chase a huge green candle simply because of today’s Pakistan/Iran news.
I’d watch BTC price + oil + US dollar + gold together.
A particularly bullish combination would be:
Oil ↓ + Gold ↓ + DXY ↓ + BTC ↑
That would suggest money is moving away from geopolitical/inflation protection and back toward risk assets.
Conversely:
Oil ↑ + Gold ↑ + DXY ↑ + BTC ↓
would indicate the market is becoming more defensive.
Bottom line: Today’s news is positive, but the real market-moving event isn’t Pakistan saying “significant progress.” The major catalyst would be Washington and Tehran officially agreeing to restart negotiations and taking concrete steps toward reopening Hormuz. That could be a strong bullish catalyst for BTC and especially for high-beta altcoins.
Pakistan is trying to revive the Islamadabad MoU, an interim US–Iran peace framework signed in June. Pakistan says its latest discussions with Iran produced “significant progress,” with the focus on de-escalation, the Strait of Hormuz and getting the US–Iran negotiation process moving again.
There are several important developments:
🇵🇰 Pakistan’s army chief Asim Munir and Interior Minister Mohsin Naqvi met Iranian leadership.
🇺🇸 Trump had reportedly spoken with Munir before the Tehran visit and encouraged Pakistan to use its influence to bring Iran back toward negotiations.
🇮🇷 Iran has indicated that it wants the US to honor its commitments under the existing Islamabad MoU.
🛢️ The Strait of Hormuz is a major issue because disruption there threatens global energy supplies.
⚠️ At the same time, the US has expanded sanctions on Iran and Iran has threatened retaliation, so the situation remains highly fragile.
Pakistan’s own foreign ministry has previously said that resolving the Hormuz standoff could create conditions for the US and Iran to return to technical-level negotiations.
What could happen to Bitcoin and crypto?
I would look at three scenarios:
Scenario
Bitcoin/crypto reaction
Risk
🟢 Peace talks progress
Bullish
Lower geopolitical risk
🟡 Talks continue but no agreement
Sideways/volatile
Medium
🔴 Talks collapse / war escalates
Bearish initially
High
🟢 1. If negotiations genuinely progress
This is the most bullish scenario for crypto.
If the US and Iran move toward a real ceasefire and eventually reopen/secure Hormuz, markets could see:
Iran peace progress → oil risk falls → inflation fears ease → risk appetite improves → crypto benefits.
Bitcoin could receive additional support because investors tend to move back into risk assets when geopolitical uncertainty decreases.
We have already seen this type of relationship during previous Iran peace developments: reports of peace talks have coincided with falling oil prices and rising Bitcoin.
And recently Bitcoin has already shown strong momentum; BTC reportedly gained more than 20% over the previous week, while ETH, SOL and XRP also posted large gains.
🟡 2. If we only get diplomatic headlines
This is where I would be careful.
“Significant progress” ≠ peace agreement.
The US has not yet publicly confirmed a new agreement, and Iran continues to face sanctions and tensions remain around Hormuz.
So we could see:
Headline → BTC pumps → traders take profit → BTC retraces → another headline → pump again.
That would create very high volatility.
🔴 3. If negotiations fail
This could become dangerous for crypto.
If Iran blocks Hormuz, attacks increase, or the US expands military action:
War escalation → oil ↑ → inflation fears ↑ → risk-off → stocks/crypto ↓
Bitcoin could initially behave more like a risk asset rather than a traditional safe haven.
Altcoins would probably be hit harder than BTC.
For example, in a major risk-off move I would expect something roughly like:
BTC → relatively strongest
ETH → more volatile
SOL/XRP → higher volatility
small-cap altcoins → potentially severe downside
My current view
The Pakistan development is bullish for the medium-term crypto outlook, but I would call it “early bullish” rather than “confirmed bullish.”
The biggest confirmation I would watch is:
1. US officially agrees to negotiations
↓
2. Iran agrees to negotiations
↓
3. Hormuz reopening/de-escalation
↓
4. Actual ceasefire/settlement
If we get #1 + #2, crypto could start pricing in peace.
If we get #3, I would become considerably more bullish.
If we get #4, the geopolitical risk premium could fall substantially.
For BTC specifically
I wouldn’t chase a huge green candle simply because of today’s Pakistan/Iran news.
I’d watch BTC price + oil + US dollar + gold together.
A particularly bullish combination would be:
Oil ↓ + Gold ↓ + DXY ↓ + BTC ↑
That would suggest money is moving away from geopolitical/inflation protection and back toward risk assets.
Conversely:
Oil ↑ + Gold ↑ + DXY ↑ + BTC ↓
would indicate the market is becoming more defensive.
Bottom line: Today’s news is positive, but the real market-moving event isn’t Pakistan saying “significant progress.” The major catalyst would be Washington and Tehran officially agreeing to restart negotiations and taking concrete steps toward reopening Hormuz. That could be a strong bullish catalyst for BTC and especially for high-beta altcoins.
109
·
--
Baissier
Shamaldi
·
--
$ETH
SHORT SETUP 📉
ETH is entering a potential short zone around 2434 - 2443. If price gets rejected from this area, the downside targets could be:
🔻 Entry Zone: 2434 - 2443
🛑 Stop Loss: 2465
🎯 TP1: 2360
🎯 TP2: 2260
🎯 TP3: 1900
The first target is the safer area to consider securing some profit. If bearish momentum continues, TP2 and TP3 become the extended targets.
⚠️ Risk management is important. Don’t use high leverage or risk your full balance on one trade. Wait for confirmation/rejection around the entry zone rather than blindly entering.
SHORT SETUP 📉
ETH is entering a potential short zone around 2434 - 2443. If price gets rejected from this area, the downside targets could be:
🔻 Entry Zone: 2434 - 2443
🛑 Stop Loss: 2465
🎯 TP1: 2360
🎯 TP2: 2260
🎯 TP3: 1900
The first target is the safer area to consider securing some profit. If bearish momentum continues, TP2 and TP3 become the extended targets.
⚠️ Risk management is important. Don’t use high leverage or risk your full balance on one trade. Wait for confirmation/rejection around the entry zone rather than blindly entering.
26
·
--
Shamaldi
·
--
$ETH
SHORT SETUP 📉
ETH is entering a potential short zone around 2434 - 2443. If price gets rejected from this area, the downside targets could be:
🔻 Entry Zone: 2434 - 2443
🛑 Stop Loss: 2465
🎯 TP1: 2360
🎯 TP2: 2260
🎯 TP3: 1900
The first target is the safer area to consider securing some profit. If bearish momentum continues, TP2 and TP3 become the extended targets.
⚠️ Risk management is important. Don’t use high leverage or risk your full balance on one trade. Wait for confirmation/rejection around the entry zone rather than blindly entering.
SHORT SETUP 📉
ETH is entering a potential short zone around 2434 - 2443. If price gets rejected from this area, the downside targets could be:
🔻 Entry Zone: 2434 - 2443
🛑 Stop Loss: 2465
🎯 TP1: 2360
🎯 TP2: 2260
🎯 TP3: 1900
The first target is the safer area to consider securing some profit. If bearish momentum continues, TP2 and TP3 become the extended targets.
⚠️ Risk management is important. Don’t use high leverage or risk your full balance on one trade. Wait for confirmation/rejection around the entry zone rather than blindly entering.
8
·
--
Guys lets go round 2
Guys lets go round 2
Shamaldi
·
--
$ETH
SHORT SETUP 📉
ETH is entering a potential short zone around 2434 - 2443. If price gets rejected from this area, the downside targets could be:
🔻 Entry Zone: 2434 - 2443
🛑 Stop Loss: 2465
🎯 TP1: 2360
🎯 TP2: 2260
🎯 TP3: 1900
The first target is the safer area to consider securing some profit. If bearish momentum continues, TP2 and TP3 become the extended targets.
⚠️ Risk management is important. Don’t use high leverage or risk your full balance on one trade. Wait for confirmation/rejection around the entry zone rather than blindly entering.
SHORT SETUP 📉
ETH is entering a potential short zone around 2434 - 2443. If price gets rejected from this area, the downside targets could be:
🔻 Entry Zone: 2434 - 2443
🛑 Stop Loss: 2465
🎯 TP1: 2360
🎯 TP2: 2260
🎯 TP3: 1900
The first target is the safer area to consider securing some profit. If bearish momentum continues, TP2 and TP3 become the extended targets.
⚠️ Risk management is important. Don’t use high leverage or risk your full balance on one trade. Wait for confirmation/rejection around the entry zone rather than blindly entering.
20
·
--
Shamaldi
·
--
$ETH
SHORT SETUP 📉
ETH is entering a potential short zone around 2434 - 2443. If price gets rejected from this area, the downside targets could be:
🔻 Entry Zone: 2434 - 2443
🛑 Stop Loss: 2465
🎯 TP1: 2360
🎯 TP2: 2260
🎯 TP3: 1900
The first target is the safer area to consider securing some profit. If bearish momentum continues, TP2 and TP3 become the extended targets.
⚠️ Risk management is important. Don’t use high leverage or risk your full balance on one trade. Wait for confirmation/rejection around the entry zone rather than blindly entering.
SHORT SETUP 📉
ETH is entering a potential short zone around 2434 - 2443. If price gets rejected from this area, the downside targets could be:
🔻 Entry Zone: 2434 - 2443
🛑 Stop Loss: 2465
🎯 TP1: 2360
🎯 TP2: 2260
🎯 TP3: 1900
The first target is the safer area to consider securing some profit. If bearish momentum continues, TP2 and TP3 become the extended targets.
⚠️ Risk management is important. Don’t use high leverage or risk your full balance on one trade. Wait for confirmation/rejection around the entry zone rather than blindly entering.
21
·
--
The real power of investing isn’t finding the perfect stock. It’s consistency + time. 📈
$500/month for 30 years at a hypothetical 10% annual return grows to roughly $1.13 million.
$1,000/month for 30 years? Roughly $2.26 million.
Here’s the part people often miss:
With $500/month, you personally contribute only $180,000 over 30 years. The remaining ~$950,000 comes from investment growth.
With $1,000/month, you contribute $360,000, while roughly $1.90 million comes from compounding.
That’s why increasing your contribution can be incredibly powerful. At the same return and time period, doubling the monthly contribution doubles the projected ending value.
And you don’t necessarily need to invest a huge amount from day one. The SEC emphasizes that regular investing + time is a powerful wealth-building combination, and dollar-cost averaging means investing consistently through market ups and downs. (investor.gov)
The 10% assumption isn’t a promise. Historically, the S&P 500 has averaged around 10% annually over its full history, but actual returns vary dramatically from year to year, and past performance doesn’t guarantee future results. (fidelity.com)
The biggest lesson:
Don’t spend your entire life chasing an extra 1–2% return while ignoring how much you’re investing.
Increase your income. Control unnecessary spending. Invest consistently. Give compounding enough time to work.
Time + consistency + higher contributions = a completely different financial future. 💰📊
The real power of investing isn’t finding the perfect stock. It’s consistency + time. 📈
$500/month for 30 years at a hypothetical 10% annual return grows to roughly $1.13 million.
$1,000/month for 30 years? Roughly $2.26 million.
Here’s the part people often miss:
With $500/month, you personally contribute only $180,000 over 30 years. The remaining ~$950,000 comes from investment growth.
With $1,000/month, you contribute $360,000, while roughly $1.90 million comes from compounding.
That’s why increasing your contribution can be incredibly powerful. At the same return and time period, doubling the monthly contribution doubles the projected ending value.
And you don’t necessarily need to invest a huge amount from day one. The SEC emphasizes that regular investing + time is a powerful wealth-building combination, and dollar-cost averaging means investing consistently through market ups and downs. (investor.gov)
The 10% assumption isn’t a promise. Historically, the S&P 500 has averaged around 10% annually over its full history, but actual returns vary dramatically from year to year, and past performance doesn’t guarantee future results. (fidelity.com)
The biggest lesson:
Don’t spend your entire life chasing an extra 1–2% return while ignoring how much you’re investing.
Increase your income. Control unnecessary spending. Invest consistently. Give compounding enough time to work.
Time + consistency + higher contributions = a completely different financial future. 💰📊
$500/month for 30 years at a hypothetical 10% annual return grows to roughly $1.13 million.
$1,000/month for 30 years? Roughly $2.26 million.
Here’s the part people often miss:
With $500/month, you personally contribute only $180,000 over 30 years. The remaining ~$950,000 comes from investment growth.
With $1,000/month, you contribute $360,000, while roughly $1.90 million comes from compounding.
That’s why increasing your contribution can be incredibly powerful. At the same return and time period, doubling the monthly contribution doubles the projected ending value.
And you don’t necessarily need to invest a huge amount from day one. The SEC emphasizes that regular investing + time is a powerful wealth-building combination, and dollar-cost averaging means investing consistently through market ups and downs. (investor.gov)
The 10% assumption isn’t a promise. Historically, the S&P 500 has averaged around 10% annually over its full history, but actual returns vary dramatically from year to year, and past performance doesn’t guarantee future results. (fidelity.com)
The biggest lesson:
Don’t spend your entire life chasing an extra 1–2% return while ignoring how much you’re investing.
Increase your income. Control unnecessary spending. Invest consistently. Give compounding enough time to work.
Time + consistency + higher contributions = a completely different financial future. 💰📊
101
·
--
THE SAFEST LONG-TERM STOCKS ARE OFTEN THE ONES NOBODY IS TALKING ABOUT. 📈
If you’ve ever bought a stock simply because someone on social media recommended it, remember this:
Once a stock becomes extremely popular, the price can start moving more on emotion and hype than on the actual business.
People buy because they’re excited.
They sell because they’re scared.
But sometimes the company itself hasn’t changed at all.
And when the hype disappears, you quickly discover who you’re invested alongside. Thousands of people may rush to sell at the first sign of bad news, creating even more pressure on the price.
That’s why I like looking at the boring businesses.
Companies like Fastenal, Cintas, and Copart may not dominate social media every day, but they have established businesses, strong demand, and long-term growth potential.
When everyone is talking about a stock, you’re often paying for the excitement as well as the company.
Long-term investing isn’t always about finding the next viral stock.
Sometimes the smartest opportunity is finding a great business before everyone starts talking about it. 🔥
Do your own research. Don’t buy simply because the crowd is excited.
THE SAFEST LONG-TERM STOCKS ARE OFTEN THE ONES NOBODY IS TALKING ABOUT. 📈
If you’ve ever bought a stock simply because someone on social media recommended it, remember this:
Once a stock becomes extremely popular, the price can start moving more on emotion and hype than on the actual business.
People buy because they’re excited.
They sell because they’re scared.
But sometimes the company itself hasn’t changed at all.
And when the hype disappears, you quickly discover who you’re invested alongside. Thousands of people may rush to sell at the first sign of bad news, creating even more pressure on the price.
That’s why I like looking at the boring businesses.
Companies like Fastenal, Cintas, and Copart may not dominate social media every day, but they have established businesses, strong demand, and long-term growth potential.
When everyone is talking about a stock, you’re often paying for the excitement as well as the company.
Long-term investing isn’t always about finding the next viral stock.
Sometimes the smartest opportunity is finding a great business before everyone starts talking about it. 🔥
Do your own research. Don’t buy simply because the crowd is excited.
If you’ve ever bought a stock simply because someone on social media recommended it, remember this:
Once a stock becomes extremely popular, the price can start moving more on emotion and hype than on the actual business.
People buy because they’re excited.
They sell because they’re scared.
But sometimes the company itself hasn’t changed at all.
And when the hype disappears, you quickly discover who you’re invested alongside. Thousands of people may rush to sell at the first sign of bad news, creating even more pressure on the price.
That’s why I like looking at the boring businesses.
Companies like Fastenal, Cintas, and Copart may not dominate social media every day, but they have established businesses, strong demand, and long-term growth potential.
When everyone is talking about a stock, you’re often paying for the excitement as well as the company.
Long-term investing isn’t always about finding the next viral stock.
Sometimes the smartest opportunity is finding a great business before everyone starts talking about it. 🔥
Do your own research. Don’t buy simply because the crowd is excited.
CPRTUS-0,03%
FASTUS+1,07%
CTASUS-0,34%
75
·
--
$ETH
SHORT SETUP 📉
ETH is entering a potential short zone around 2434 - 2443. If price gets rejected from this area, the downside targets could be:
🔻 Entry Zone: 2434 - 2443
🛑 Stop Loss: 2465
🎯 TP1: 2360
🎯 TP2: 2260
🎯 TP3: 1900
The first target is the safer area to consider securing some profit. If bearish momentum continues, TP2 and TP3 become the extended targets.
⚠️ Risk management is important. Don’t use high leverage or risk your full balance on one trade. Wait for confirmation/rejection around the entry zone rather than blindly entering.
$ETH
SHORT SETUP 📉
ETH is entering a potential short zone around 2434 - 2443. If price gets rejected from this area, the downside targets could be:
🔻 Entry Zone: 2434 - 2443
🛑 Stop Loss: 2465
🎯 TP1: 2360
🎯 TP2: 2260
🎯 TP3: 1900
The first target is the safer area to consider securing some profit. If bearish momentum continues, TP2 and TP3 become the extended targets.
⚠️ Risk management is important. Don’t use high leverage or risk your full balance on one trade. Wait for confirmation/rejection around the entry zone rather than blindly entering.
SHORT SETUP 📉
ETH is entering a potential short zone around 2434 - 2443. If price gets rejected from this area, the downside targets could be:
🔻 Entry Zone: 2434 - 2443
🛑 Stop Loss: 2465
🎯 TP1: 2360
🎯 TP2: 2260
🎯 TP3: 1900
The first target is the safer area to consider securing some profit. If bearish momentum continues, TP2 and TP3 become the extended targets.
⚠️ Risk management is important. Don’t use high leverage or risk your full balance on one trade. Wait for confirmation/rejection around the entry zone rather than blindly entering.
1
4
1
68
·
--
Be safe, everyone. ⚠️
Looks like we could be heading toward another major dump across the crypto market.
BTC, ETH, SOL, XRP and BNB have all been moving strongly, but remember: when the market moves too fast in one direction, a sharp correction can happen very quickly.
There is also an important geopolitical factor to watch. Trump has said that Iran wants an agreement, although he also said Iran is not yet ready to make what he considers the right deal. At the same time, reports today indicate that the situation remains uncertain, with negotiations still stalled and both sides maintaining pressure. (Nepal News)
But I still believe Iran could eventually announce that it is willing to agree to negotiations. If we suddenly get confirmation of serious talks, a ceasefire, or a major de-escalation, crypto could react very quickly in either direction as traders reprice geopolitical risk.
For me, the key levels remain:
🔴 BTC — $72K first
🔴 BTC — $67K as a deeper correction zone
🟠 ETH / SOL / XRP / BNB — watch closely if BTC loses support
I’m not saying the dump must happen today. My point is that we should be prepared. The market can turn around very quickly, especially when leverage is high.
I could be wrong, and BTC may continue higher. Always respect the trend and manage your own risk.
Don’t chase. Don’t over-leverage. Protect your balance first.
Be safe, everyone. 🛡️❤️
Hope share eveyone
Be safe, everyone. ⚠️
Looks like we could be heading toward another major dump across the crypto market.
BTC, ETH, SOL, XRP and BNB have all been moving strongly, but remember: when the market moves too fast in one direction, a sharp correction can happen very quickly.
There is also an important geopolitical factor to watch. Trump has said that Iran wants an agreement, although he also said Iran is not yet ready to make what he considers the right deal. At the same time, reports today indicate that the situation remains uncertain, with negotiations still stalled and both sides maintaining pressure. (Nepal News)
But I still believe Iran could eventually announce that it is willing to agree to negotiations. If we suddenly get confirmation of serious talks, a ceasefire, or a major de-escalation, crypto could react very quickly in either direction as traders reprice geopolitical risk.
For me, the key levels remain:
🔴 BTC — $72K first
🔴 BTC — $67K as a deeper correction zone
🟠 ETH / SOL / XRP / BNB — watch closely if BTC loses support
I’m not saying the dump must happen today. My point is that we should be prepared. The market can turn around very quickly, especially when leverage is high.
I could be wrong, and BTC may continue higher. Always respect the trend and manage your own risk.
Don’t chase. Don’t over-leverage. Protect your balance first.
Be safe, everyone. 🛡️❤️
Hope share eveyone
Looks like we could be heading toward another major dump across the crypto market.
BTC, ETH, SOL, XRP and BNB have all been moving strongly, but remember: when the market moves too fast in one direction, a sharp correction can happen very quickly.
There is also an important geopolitical factor to watch. Trump has said that Iran wants an agreement, although he also said Iran is not yet ready to make what he considers the right deal. At the same time, reports today indicate that the situation remains uncertain, with negotiations still stalled and both sides maintaining pressure. (Nepal News)
But I still believe Iran could eventually announce that it is willing to agree to negotiations. If we suddenly get confirmation of serious talks, a ceasefire, or a major de-escalation, crypto could react very quickly in either direction as traders reprice geopolitical risk.
For me, the key levels remain:
🔴 BTC — $72K first
🔴 BTC — $67K as a deeper correction zone
🟠 ETH / SOL / XRP / BNB — watch closely if BTC loses support
I’m not saying the dump must happen today. My point is that we should be prepared. The market can turn around very quickly, especially when leverage is high.
I could be wrong, and BTC may continue higher. Always respect the trend and manage your own risk.
Don’t chase. Don’t over-leverage. Protect your balance first.
Be safe, everyone. 🛡️❤️
Hope share eveyone
1
1
144
·
--
Most people didn’t like what I said. 😅
But sometimes you have to look beyond the green candles and pay attention to the warning signs. BTC has had a very strong move recently, rising more than 20% in just a few days and reaching around $79K. (Investopedia)
I’m not saying BTC must dump today. A strong rally can continue longer than we expect. But after such a fast move, profit-taking and a healthy correction are always possible.
My personal view is that BTC may not reach $67K today, but I believe there is a good chance we could see $67K again in the coming days if selling pressure increases.
Remember, markets don’t move straight up forever. Even during a bullish trend, BTC can make deep pullbacks before deciding its next direction.
If BTC continues higher, I’ll respect the trend. But if we start seeing rejection around the current highs, lower highs, and strong selling volume, I’ll be watching $72K first and $67K next.
I could be wrong—this is only my personal view, not financial advice.
Don’t chase green candles. Stay patient, manage your risk, and most importantly, protect your balance. 🛡️
Most people didn’t like what I said. 😅
But sometimes you have to look beyond the green candles and pay attention to the warning signs. BTC has had a very strong move recently, rising more than 20% in just a few days and reaching around $79K. (Investopedia)
I’m not saying BTC must dump today. A strong rally can continue longer than we expect. But after such a fast move, profit-taking and a healthy correction are always possible.
My personal view is that BTC may not reach $67K today, but I believe there is a good chance we could see $67K again in the coming days if selling pressure increases.
Remember, markets don’t move straight up forever. Even during a bullish trend, BTC can make deep pullbacks before deciding its next direction.
If BTC continues higher, I’ll respect the trend. But if we start seeing rejection around the current highs, lower highs, and strong selling volume, I’ll be watching $72K first and $67K next.
I could be wrong—this is only my personal view, not financial advice.
Don’t chase green candles. Stay patient, manage your risk, and most importantly, protect your balance. 🛡️
But sometimes you have to look beyond the green candles and pay attention to the warning signs. BTC has had a very strong move recently, rising more than 20% in just a few days and reaching around $79K. (Investopedia)
I’m not saying BTC must dump today. A strong rally can continue longer than we expect. But after such a fast move, profit-taking and a healthy correction are always possible.
My personal view is that BTC may not reach $67K today, but I believe there is a good chance we could see $67K again in the coming days if selling pressure increases.
Remember, markets don’t move straight up forever. Even during a bullish trend, BTC can make deep pullbacks before deciding its next direction.
If BTC continues higher, I’ll respect the trend. But if we start seeing rejection around the current highs, lower highs, and strong selling volume, I’ll be watching $72K first and $67K next.
I could be wrong—this is only my personal view, not financial advice.
Don’t chase green candles. Stay patient, manage your risk, and most importantly, protect your balance. 🛡️
1
131
·
--
What happened in October 2025?Bitcoin started October extremely strong. BTC reached a new ATH around $126,200–$126,000 in the first week. Then the market reversed sharply.
On October 10, 2025, a major risk-off event triggered an enormous crypto liquidation wave. CoinGecko reported roughly $19 billion in liquidations in one day, one of the largest liquidation events in crypto history.
BTC subsequently dropped toward the $103K–$104K area, while ETH also suffered a significant decline. By the end of October, BTC had fallen roughly 5% for the month, breaking its long-running pattern of positive October performance.
Why your warning makes sense
The important lesson isn’t “October = dump.” It’s:
Strong green candles → traders become confident → leverage increases → a sudden catalyst can cause liquidations → selling accelerates.
That’s why your point about “without selling, price can’t keep going up” is useful. Markets need profit-taking and corrections. A few green days don’t automatically mean BTC must continue higher.
But there is an important difference today
As of August 21, 2026, BTC has just experienced a very strong move. Recent reports say BTC pushed above $70K and toward $73K, while ETH also rallied strongly. The move has been supported by Treasury-market developments and positive crypto-policy news.
So I would not say a $72K → $67K correction is guaranteed.
I’d frame it as a risk scenario:
🟢 BTC holds above the recent breakout: bullish continuation remains possible.
🟡 BTC reaches ~$72K–$75K and gets rejected: profit-taking/correction becomes more interesting.
🔴 BTC loses ~$70K decisively: downside toward the upper-$60Ks becomes more plausible.
⚠️ Heavy leverage + sudden negative news: liquidation can make the move much faster than expected.
And remember: $72K is already being tested/reached in the current move, so your original “first 72K” target is no longer a distant target. The key question now is whether BTC can hold above that area, not simply touch it.
My view: don’t short simply because BTC has been green for two days. Wait for confirmation—especially a rejection or breakdown. If you’re trading with a small balance, protecting the balance is more important than catching every move.
What happened in October 2025?
Bitcoin started October extremely strong. BTC reached a new ATH around $126,200–$126,000 in the first week. Then the market reversed sharply.
On October 10, 2025, a major risk-off event triggered an enormous crypto liquidation wave. CoinGecko reported roughly $19 billion in liquidations in one day, one of the largest liquidation events in crypto history.
BTC subsequently dropped toward the $103K–$104K area, while ETH also suffered a significant decline. By the end of October, BTC had fallen roughly 5% for the month, breaking its long-running pattern of positive October performance.
Why your warning makes sense
The important lesson isn’t “October = dump.” It’s:
Strong green candles → traders become confident → leverage increases → a sudden catalyst can cause liquidations → selling accelerates.
That’s why your point about “without selling, price can’t keep going up” is useful. Markets need profit-taking and corrections. A few green days don’t automatically mean BTC must continue higher.
But there is an important difference today
As of August 21, 2026, BTC has just experienced a very strong move. Recent reports say BTC pushed above $70K and toward $73K, while ETH also rallied strongly. The move has been supported by Treasury-market developments and positive crypto-policy news.
So I would not say a $72K → $67K correction is guaranteed.
I’d frame it as a risk scenario:
🟢 BTC holds above the recent breakout: bullish continuation remains possible.
🟡 BTC reaches ~$72K–$75K and gets rejected: profit-taking/correction becomes more interesting.
🔴 BTC loses ~$70K decisively: downside toward the upper-$60Ks becomes more plausible.
⚠️ Heavy leverage + sudden negative news: liquidation can make the move much faster than expected.
And remember: $72K is already being tested/reached in the current move, so your original “first 72K” target is no longer a distant target. The key question now is whether BTC can hold above that area, not simply touch it.
My view: don’t short simply because BTC has been green for two days. Wait for confirmation—especially a rejection or breakdown. If you’re trading with a small balance, protecting the balance is more important than catching every move.
On October 10, 2025, a major risk-off event triggered an enormous crypto liquidation wave. CoinGecko reported roughly $19 billion in liquidations in one day, one of the largest liquidation events in crypto history.
BTC subsequently dropped toward the $103K–$104K area, while ETH also suffered a significant decline. By the end of October, BTC had fallen roughly 5% for the month, breaking its long-running pattern of positive October performance.
Why your warning makes sense
The important lesson isn’t “October = dump.” It’s:
Strong green candles → traders become confident → leverage increases → a sudden catalyst can cause liquidations → selling accelerates.
That’s why your point about “without selling, price can’t keep going up” is useful. Markets need profit-taking and corrections. A few green days don’t automatically mean BTC must continue higher.
But there is an important difference today
As of August 21, 2026, BTC has just experienced a very strong move. Recent reports say BTC pushed above $70K and toward $73K, while ETH also rallied strongly. The move has been supported by Treasury-market developments and positive crypto-policy news.
So I would not say a $72K → $67K correction is guaranteed.
I’d frame it as a risk scenario:
🟢 BTC holds above the recent breakout: bullish continuation remains possible.
🟡 BTC reaches ~$72K–$75K and gets rejected: profit-taking/correction becomes more interesting.
🔴 BTC loses ~$70K decisively: downside toward the upper-$60Ks becomes more plausible.
⚠️ Heavy leverage + sudden negative news: liquidation can make the move much faster than expected.
And remember: $72K is already being tested/reached in the current move, so your original “first 72K” target is no longer a distant target. The key question now is whether BTC can hold above that area, not simply touch it.
My view: don’t short simply because BTC has been green for two days. Wait for confirmation—especially a rejection or breakdown. If you’re trading with a small balance, protecting the balance is more important than catching every move.
128
Connectez-vous pour découvrir plus de contenu
Rejoignez la communauté mondiale des adeptes de cryptomonnaies sur Binance Square
⚡️ Suviez les dernières informations importantes sur les cryptomonnaies.
💬 Jugé digne de confiance par la plus grande plateforme d’échange de cryptomonnaies au monde.
👍 Découvrez les connaissances que partagent les créateurs vérifiés.
Adresse e-mail/Nº de téléphone
Sujets d’actualité
BNBSurpasses$790
14,219 vues
120 mentions
$BNB strategic long plan -> FOCUS NOW
BNB has created 2 strong lows after taking out internal liquidity
I'm expecting a move towards swing high $815-$830 and looking for a long on a retest of the green box
#BNBSurpasses$790 #bnb
Ghost Writer
·5 mentions J’aime
·6.7k vues
ZamaRises15.99%ToIntradayHigh$0.09
10,381 vues
93 mentions
BitcoinSpotETFsDraw$6.34BInflowsInQ3
4,833 vues
79 mentions