
Solana’s SOL continues to struggle with a decisive recovery as weakening on-chain activity, declining TVL, and the first negative ETF flows since launch dampen bullish momentum. A classic bear-flag breakdown is now pointing toward a potential move to $100—unless Solana can reclaim the critical $145–$150 resistance zone.
Key Takeaways
SOL ETF flows flipped negative for the first time, posting $8.2M in outflows.
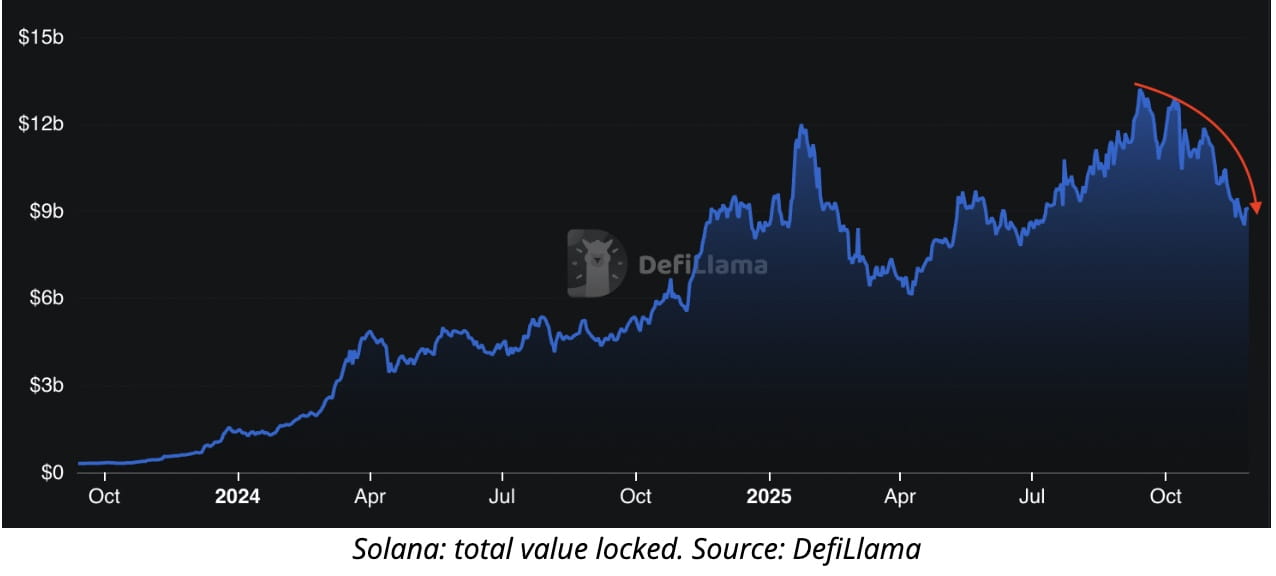
Solana TVL dropped 20% in November and 32% from September’s peak.
Network activity is weakening: active addresses down 6%, fees down 16% this week.
Bear flag pattern projects a deeper correction toward $100.
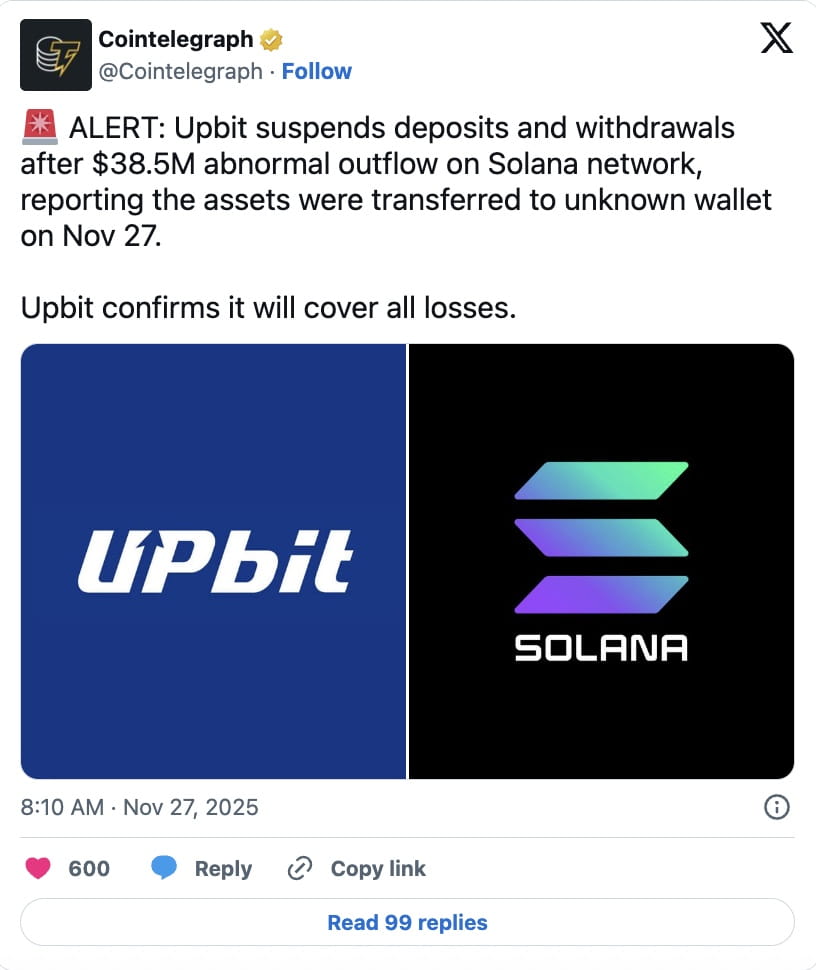
Upbit’s $36M SOL hot-wallet hack adds fresh uncertainty.
ETF Outflows Break Momentum as Network Activity Softens
Solana’s strong recovery attempt ran into trouble on Wednesday as spot SOL ETFs recorded their first daily net outflow, ending an uninterrupted streak of inflows since launch.
According to SoSoValue data, the $8.2M withdrawal suggests a cooling of institutional demand—just as network metrics begin to soften.
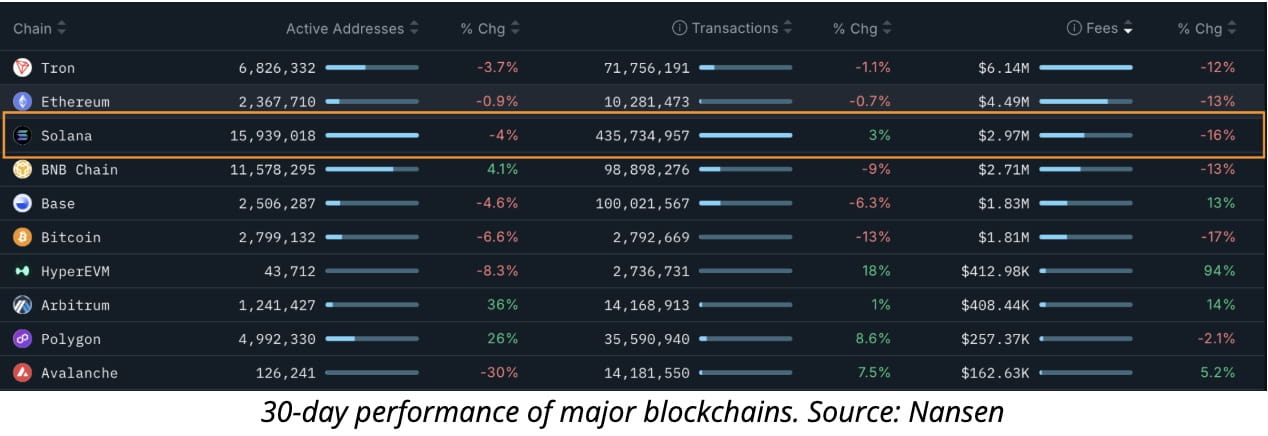
Network health weakening
Nansen data highlights a noticeable contraction:
Active addresses: ↓ 6%
Network fees: ↓ 16% (7-day decline)
TVL: ↓ 20% in November
TVL from September peak ($13.23B): ↓ 32% to $9.1B
Major protocols saw substantial monthly drawdowns:
Jito: ↓ 33%
Jupiter: ↓ 28%
Raydium: ↓ 31%
Sanctum: ↓ 22%
These trends typically reflect lower network usage, reduced capital efficiency, and lighter demand for blockspace—conditions that historically limit upside for SOL’s price.
Upbit’s $36M Solana Hack Adds Short-Term Risk
The $36 million theft from Upbit’s Solana hot wallet on Thursday further shook market confidence.
Why it matters:
Upbit’s temporary halt on SOL deposits and withdrawals restricts liquidity on one of Asia’s largest exchanges, potentially intensifying volatility.
Remarkably, SOL still climbed 3% to $143 after the announcement, signaling resilience—but this shock event may slow momentum toward the $150 level.
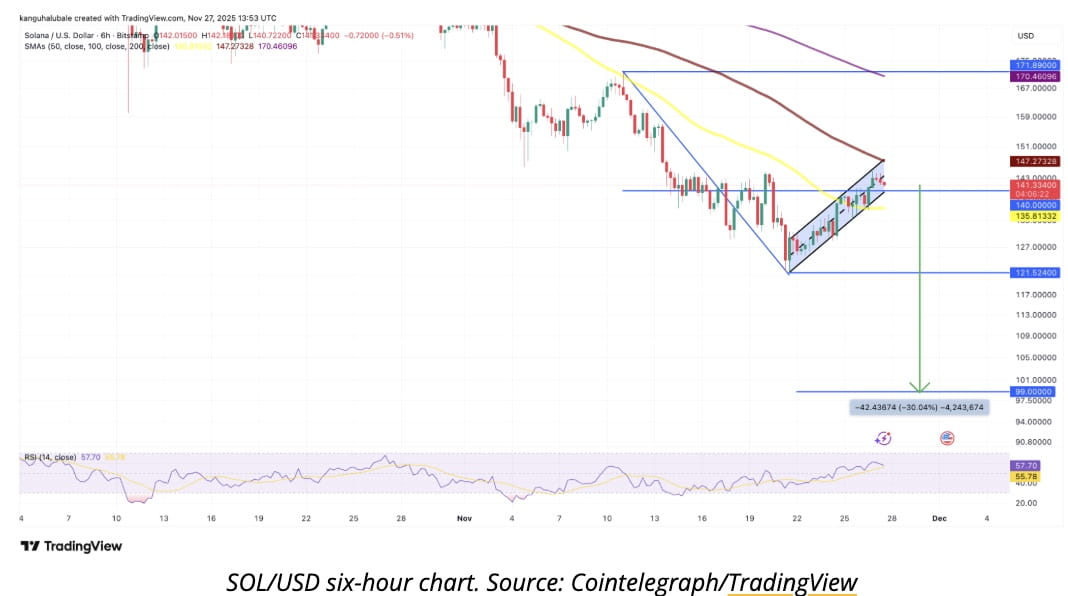
Technical Setup: Bear Flag Break Implies $100 Target
SOL is currently trading inside a classic bear flag—a bearish continuation pattern that forms after a sharp drop, followed by a weak upward consolidation.
Key levels
Flag support: ~$140
Flag resistance: ~$145
Breakdown trigger: Close below $140
Pattern target: $99–$100 zone (≈30% drop)
On the six-hour chart, SOL continues to make lower highs after topping around $170 on Nov. 17, signaling waning momentum.
Trader MR Ape highlights $145 as the critical rejection zone:
“$145 has rejected price three times already. Momentum is slowing again as SOL approaches it.”
A confirmed break below $120—the lower boundary of the flag—could accelerate the drop toward $110, and later $95, where fresh buyers are expected to step in.
Can SOL Break Above $150?
For now, the answer leans no, unless two conditions change:
1. Network activity improves
SOL needs rising fees, higher TPS utilization, and renewed DeFi inflows.
2. ETF flows return positive
Sustained inflows remain one of the strongest signals for institutional buy-side demand.
Until then, the $145–$150 resistance zone is likely to hold.
SOL’s Road to $150 Looks Difficult as $100 Looms Below
Solana’s price recovery faces multiple headwinds:
weakening network usage
declining TVL
negative ETF flows
fresh market uncertainty from the Upbit hack
Unless bulls reclaim $150, the technical structure strongly leans bearish—with a potential move toward $100 if the bear flag breaks down.
For now, Solana’s path forward depends on whether demand returns fast enough to invalidate the bearish continuation pattern, according to Cointelegraph.

