
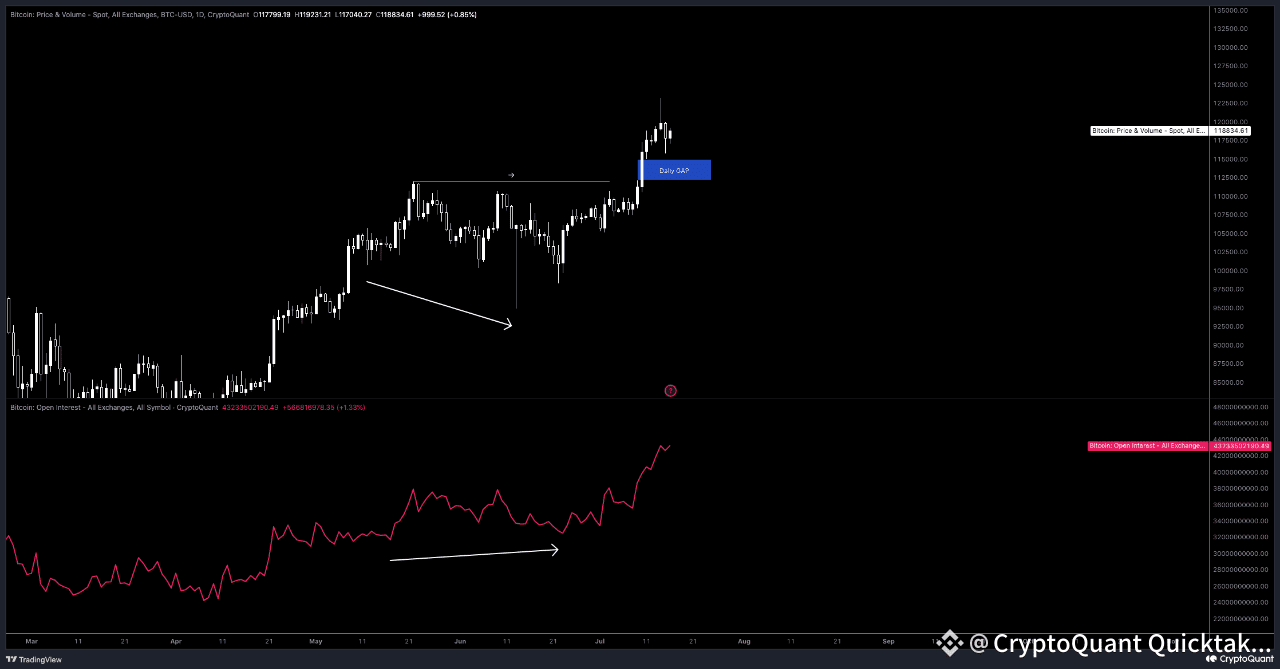
Let’s start with the price action analysis first. With the breakout of the 107,000 resistance level, the algorithm has entered the distribution phase. In case of a pullback, I might consider evaluating the daily gap level below us.
When we look at the Open Interest indicator, we see a divergence with the price. This was a positive signal for us, and we started to rise afterward. Currently, the rising Open Interest along with the rising price indicates that the market is in a strong bullish phase.
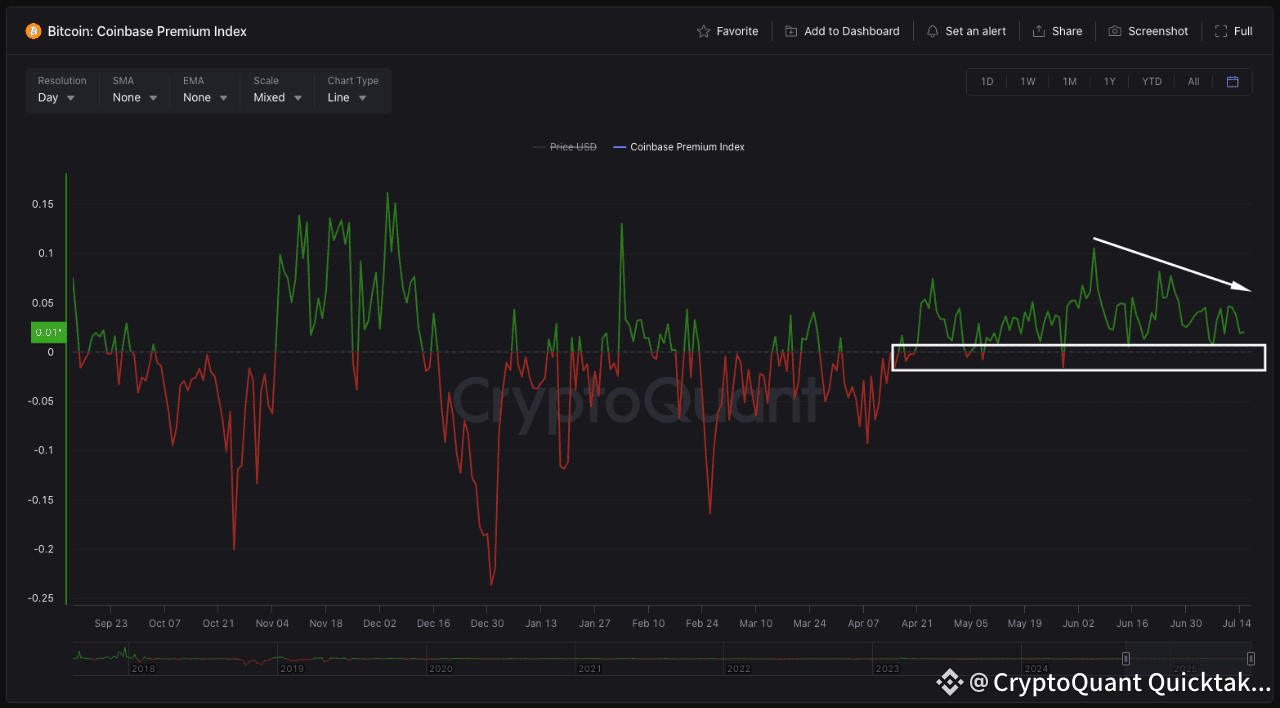
When we examine the data from the Coinbase Premium Index indicator, we can see that it is holding above the '0' level. Additionally, this area represents a Breaker structure. However, while the price is rising, the indicator remains flat. This suggests to me that major players are taking profits. If the descending trend structure I marked with an arrow is broken, the price is likely to rise much more strongly. On the other hand, if the indicator drops below the '0' level, I may consider it a buying signal, as we are still in a macro bullish market.
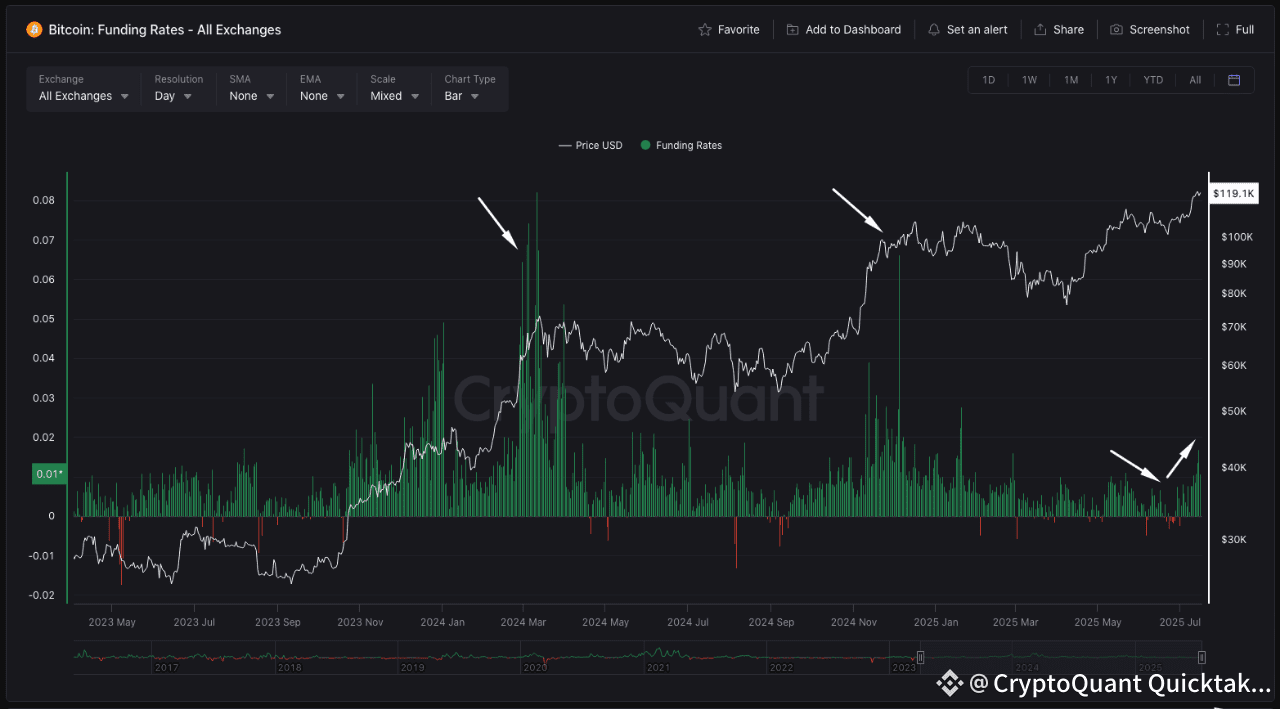
When we look at the funding rate indicator, we can see that it started to rise after a decline—this reflects growing confidence in the bullish move. However, when we examine the historical data I marked with an arrow, we notice extremely high funding rates. Back then, Bitcoin’s price was lower, yet funding rates were unusually high. Currently, the price is high, but the funding rate indicator is not showing any extremes. If it reaches an extreme level, I will take that as a potential signal.
Written by TraderOasis