
thesolidoke
245 Publicaciones

thesolidoke
Denunciar
Bloquear usuario
Real tests of crypto trading bots. Real money, real fees, wins AND losses. No hype, no signals. #TradingBots #AlgoTrading #BTC | NFA
62 Siguiendo
39 Seguidores
80 Me gusta
Publicaciones
·
--
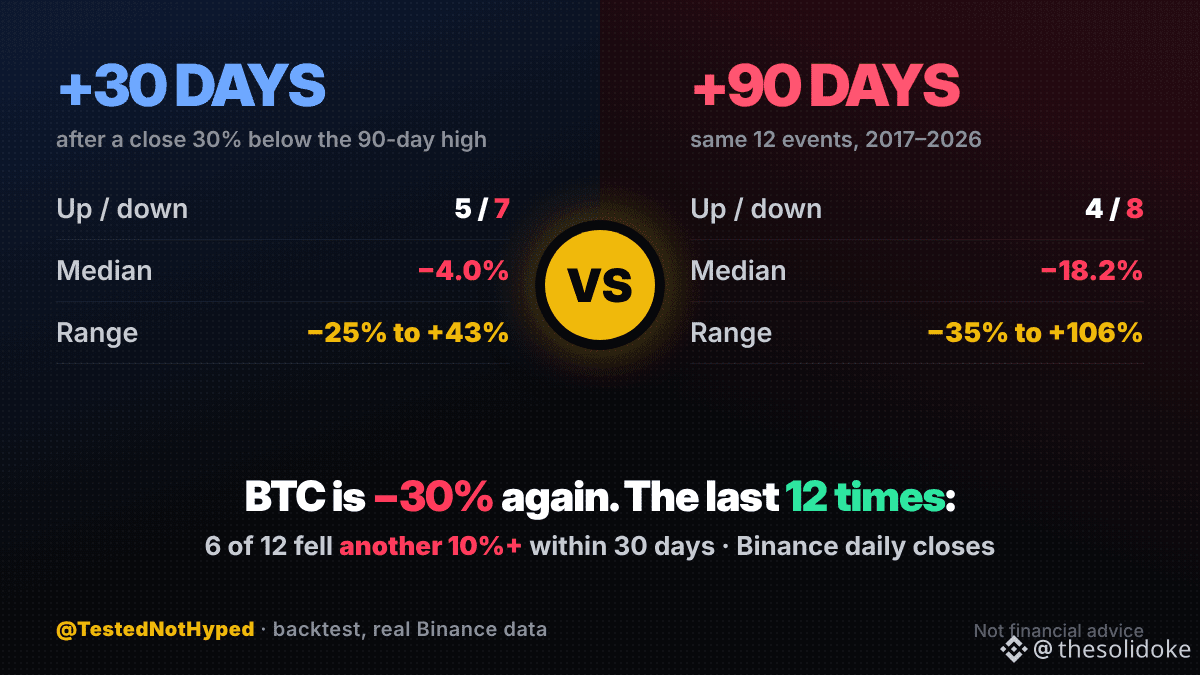
Bitcoin acaba de cerrar un 30 % por debajo de su máximo de los últimos 90 días. Encontré 12 ocasiones anteriores desde 2017 en los datos diarios de Binance y comprobé qué pasó después.
30 días después: subió 5 veces y bajó 7. Mediana: −4,0 %.
90 días después: subió 4 veces y bajó 8. Mediana: −18,2 %.
En 6 de las 12 ocasiones, cayó al menos otro 10 % en un plazo de 30 días.
Mejor resultado: marzo de 2020, +43 % en 30 días. Peor: noviembre de 2018, −25 %.
Así que los datos no dicen «compra durante la caída del 30 %». Tampoco dicen «se acabó». El rango es enorme.
12 casos es una muestra pequeña, y el mercado de 2017 no es el de ahora. Por eso mi bot de tendencias no intenta adivinar los mínimos: espera a que la tendencia cambie.
¿Compras después de una caída del 30 % o esperas a que cambie la tendencia? 👇
Esto no es asesoramiento financiero. Backtest con cierres diarios de Binance; los resultados pasados no se repiten.
#TradingBots #algoTrading #crypto #BTC #Write2Earn $BTC
Bitcoin acaba de cerrar un 30 % por debajo de su máximo de los últimos 90 días. Encontré 12 ocasiones anteriores desde 2017 en los datos diarios de Binance y comprobé qué pasó después.
30 días después: subió 5 veces y bajó 7. Mediana: −4,0 %.
90 días después: subió 4 veces y bajó 8. Mediana: −18,2 %.
En 6 de las 12 ocasiones, cayó al menos otro 10 % en un plazo de 30 días.
Mejor resultado: marzo de 2020, +43 % en 30 días. Peor: noviembre de 2018, −25 %.
Así que los datos no dicen «compra durante la caída del 30 %». Tampoco dicen «se acabó». El rango es enorme.
12 casos es una muestra pequeña, y el mercado de 2017 no es el de ahora. Por eso mi bot de tendencias no intenta adivinar los mínimos: espera a que la tendencia cambie.
¿Compras después de una caída del 30 % o esperas a que cambie la tendencia? 👇
Esto no es asesoramiento financiero. Backtest con cierres diarios de Binance; los resultados pasados no se repiten.
#TradingBots #algoTrading #crypto #BTC #Write2Earn $BTC
30 días después: subió 5 veces y bajó 7. Mediana: −4,0 %.
90 días después: subió 4 veces y bajó 8. Mediana: −18,2 %.
En 6 de las 12 ocasiones, cayó al menos otro 10 % en un plazo de 30 días.
Mejor resultado: marzo de 2020, +43 % en 30 días. Peor: noviembre de 2018, −25 %.
Así que los datos no dicen «compra durante la caída del 30 %». Tampoco dicen «se acabó». El rango es enorme.
12 casos es una muestra pequeña, y el mercado de 2017 no es el de ahora. Por eso mi bot de tendencias no intenta adivinar los mínimos: espera a que la tendencia cambie.
¿Compras después de una caída del 30 % o esperas a que cambie la tendencia? 👇
Esto no es asesoramiento financiero. Backtest con cierres diarios de Binance; los resultados pasados no se repiten.
#TradingBots #algoTrading #crypto #BTC #Write2Earn $BTC
52
·
--
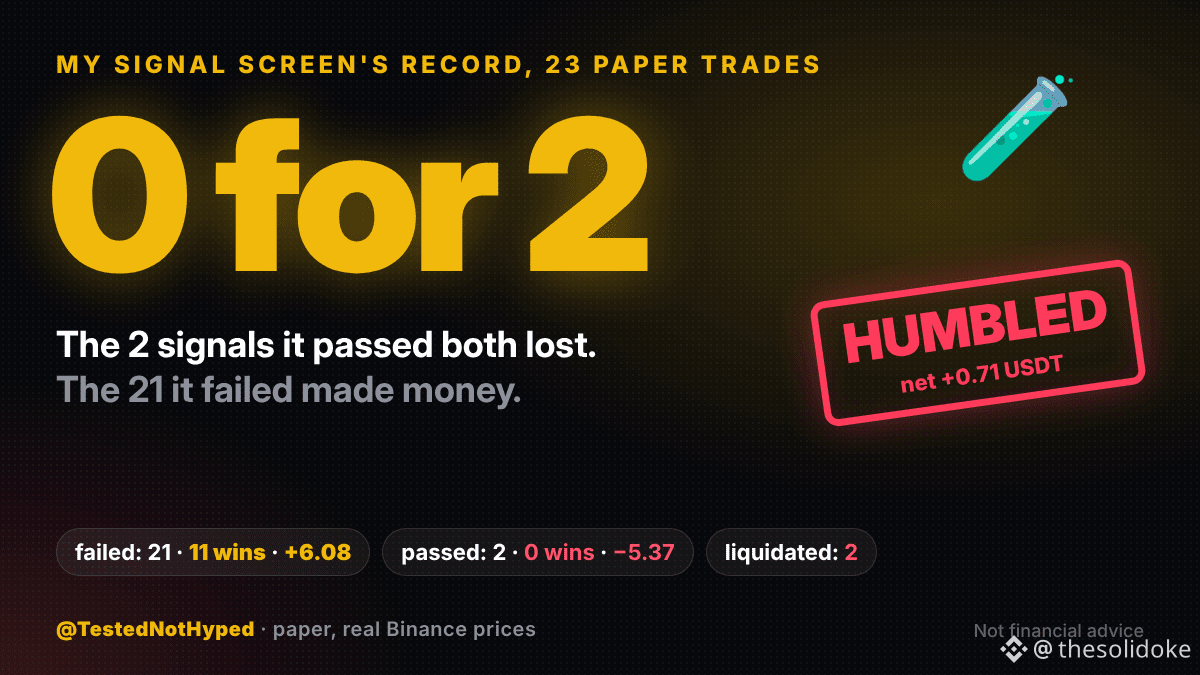
Mi filtro de señales está en 0 de 2. Las dos únicas señales de Square que aprobó acabaron en pérdidas. Las 21 que rechazó sumaron +6.08 USDT.
Con cada señal que pruebo en papel, reviso la configuración antes del resultado: ¿el stop está más lejos que el objetivo? ¿El stop está más allá del precio de liquidación? ¿Hay siquiera un punto de entrada?
Después de 23 operaciones cerradas (margen de 10 USDT cada una, precios reales de Binance):
• aprobadas por el filtro: 2 operaciones, 0 victorias, −5.37
• rechazadas por el filtro: 21 operaciones, 11 victorias, +6.08
• stop más allá de la liquidación: 6 operaciones, 2 liquidadas, 3 grandes victorias
Entonces, ¿mi filtro no sirve para nada? Todavía no. Dos operaciones no son nada, y el filtro se centra en cuánto puedes perder, no en si ganas. Las dos liquidaciones se produjeron exactamente con las configuraciones que señaló.
Lo que realmente muestra: 21 de las 23 señales que detecté incumplían al menos una regla básica de gestión del riesgo.
¿Revisas el stop y el precio de liquidación de una señal antes de copiarla? 👇
Esto no es asesoramiento financiero. Resultados de pruebas en papel, precios reales de Binance.
#TradingSignals #TradingBots #crypto #cryptotrading #Write2Earn $BTC
Mi filtro de señales está en 0 de 2. Las dos únicas señales de Square que aprobó acabaron en pérdidas. Las 21 que rechazó sumaron +6.08 USDT.
Con cada señal que pruebo en papel, reviso la configuración antes del resultado: ¿el stop está más lejos que el objetivo? ¿El stop está más allá del precio de liquidación? ¿Hay siquiera un punto de entrada?
Después de 23 operaciones cerradas (margen de 10 USDT cada una, precios reales de Binance):
• aprobadas por el filtro: 2 operaciones, 0 victorias, −5.37
• rechazadas por el filtro: 21 operaciones, 11 victorias, +6.08
• stop más allá de la liquidación: 6 operaciones, 2 liquidadas, 3 grandes victorias
Entonces, ¿mi filtro no sirve para nada? Todavía no. Dos operaciones no son nada, y el filtro se centra en cuánto puedes perder, no en si ganas. Las dos liquidaciones se produjeron exactamente con las configuraciones que señaló.
Lo que realmente muestra: 21 de las 23 señales que detecté incumplían al menos una regla básica de gestión del riesgo.
¿Revisas el stop y el precio de liquidación de una señal antes de copiarla? 👇
Esto no es asesoramiento financiero. Resultados de pruebas en papel, precios reales de Binance.
#TradingSignals #TradingBots #crypto #cryptotrading #Write2Earn $BTC
Con cada señal que pruebo en papel, reviso la configuración antes del resultado: ¿el stop está más lejos que el objetivo? ¿El stop está más allá del precio de liquidación? ¿Hay siquiera un punto de entrada?
Después de 23 operaciones cerradas (margen de 10 USDT cada una, precios reales de Binance):
• aprobadas por el filtro: 2 operaciones, 0 victorias, −5.37
• rechazadas por el filtro: 21 operaciones, 11 victorias, +6.08
• stop más allá de la liquidación: 6 operaciones, 2 liquidadas, 3 grandes victorias
Entonces, ¿mi filtro no sirve para nada? Todavía no. Dos operaciones no son nada, y el filtro se centra en cuánto puedes perder, no en si ganas. Las dos liquidaciones se produjeron exactamente con las configuraciones que señaló.
Lo que realmente muestra: 21 de las 23 señales que detecté incumplían al menos una regla básica de gestión del riesgo.
¿Revisas el stop y el precio de liquidación de una señal antes de copiarla? 👇
Esto no es asesoramiento financiero. Resultados de pruebas en papel, precios reales de Binance.
#TradingSignals #TradingBots #crypto #cryptotrading #Write2Earn $BTC
66
·
--
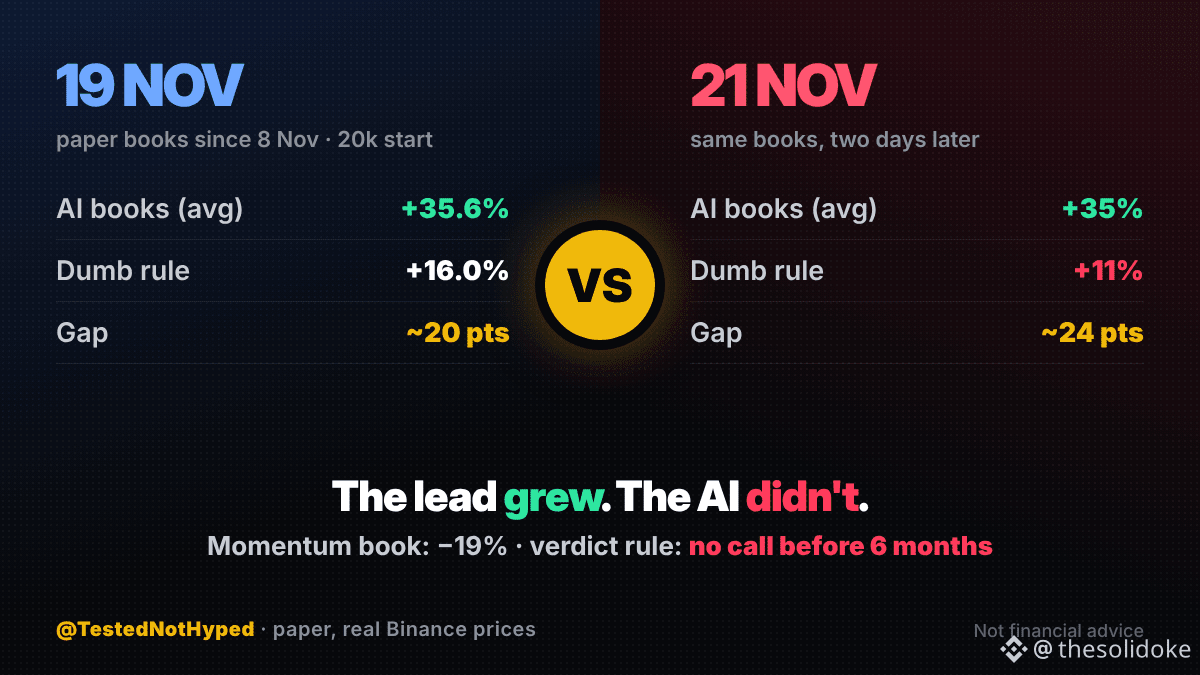
Hace dos días, las carteras simuladas de mi IA aventajaban en unos 20 puntos a una regla tonta. Hoy la ventaja es de unos 24. Pero la IA no ganó nada. La regla tonta perdió.
Resumen: Kronos, una IA entrenada con velas de precios, pronostica 28 monedas al día. Mis carteras simuladas se ponen en largo con sus 3 mejores y en corto con sus 3 peores, incluidas las comisiones. La regla tonta: comprar las 3 monedas que más bajaron ayer y ponerse en corto con las 3 que más subieron. Todo empezó el 8 de noviembre con 20.000 en una cuenta simulada.
• Carteras de la IA: +35,6 % el 19 de noviembre, +35 % hoy
• Regla tonta: +16,0 % entonces, +11 % hoy
• Momentum (comprar las ganadoras): −21 % entonces, −19 % hoy
Una ventaja mayor parece una buena noticia. Aquí solo significa que el referente tuvo dos días malos mientras la IA se mantuvo sin cambios. Si solo me fijara en la diferencia, me estaría engañando.
La regla se mantiene: no sacar conclusiones antes de 6 meses.
¿Contra qué comparas tu bot? 👇
Esto no es asesoramiento financiero. Resultados simulados, precios reales de Binance.
#AITrading #TradingBots #algoTrading #crypto #Write2Earn $BTC
Hace dos días, las carteras simuladas de mi IA aventajaban en unos 20 puntos a una regla tonta. Hoy la ventaja es de unos 24. Pero la IA no ganó nada. La regla tonta perdió.
Resumen: Kronos, una IA entrenada con velas de precios, pronostica 28 monedas al día. Mis carteras simuladas se ponen en largo con sus 3 mejores y en corto con sus 3 peores, incluidas las comisiones. La regla tonta: comprar las 3 monedas que más bajaron ayer y ponerse en corto con las 3 que más subieron. Todo empezó el 8 de noviembre con 20.000 en una cuenta simulada.
• Carteras de la IA: +35,6 % el 19 de noviembre, +35 % hoy
• Regla tonta: +16,0 % entonces, +11 % hoy
• Momentum (comprar las ganadoras): −21 % entonces, −19 % hoy
Una ventaja mayor parece una buena noticia. Aquí solo significa que el referente tuvo dos días malos mientras la IA se mantuvo sin cambios. Si solo me fijara en la diferencia, me estaría engañando.
La regla se mantiene: no sacar conclusiones antes de 6 meses.
¿Contra qué comparas tu bot? 👇
Esto no es asesoramiento financiero. Resultados simulados, precios reales de Binance.
#AITrading #TradingBots #algoTrading #crypto #Write2Earn $BTC
Resumen: Kronos, una IA entrenada con velas de precios, pronostica 28 monedas al día. Mis carteras simuladas se ponen en largo con sus 3 mejores y en corto con sus 3 peores, incluidas las comisiones. La regla tonta: comprar las 3 monedas que más bajaron ayer y ponerse en corto con las 3 que más subieron. Todo empezó el 8 de noviembre con 20.000 en una cuenta simulada.
• Carteras de la IA: +35,6 % el 19 de noviembre, +35 % hoy
• Regla tonta: +16,0 % entonces, +11 % hoy
• Momentum (comprar las ganadoras): −21 % entonces, −19 % hoy
Una ventaja mayor parece una buena noticia. Aquí solo significa que el referente tuvo dos días malos mientras la IA se mantuvo sin cambios. Si solo me fijara en la diferencia, me estaría engañando.
La regla se mantiene: no sacar conclusiones antes de 6 meses.
¿Contra qué comparas tu bot? 👇
Esto no es asesoramiento financiero. Resultados simulados, precios reales de Binance.
#AITrading #TradingBots #algoTrading #crypto #Write2Earn $BTC
55
·
--
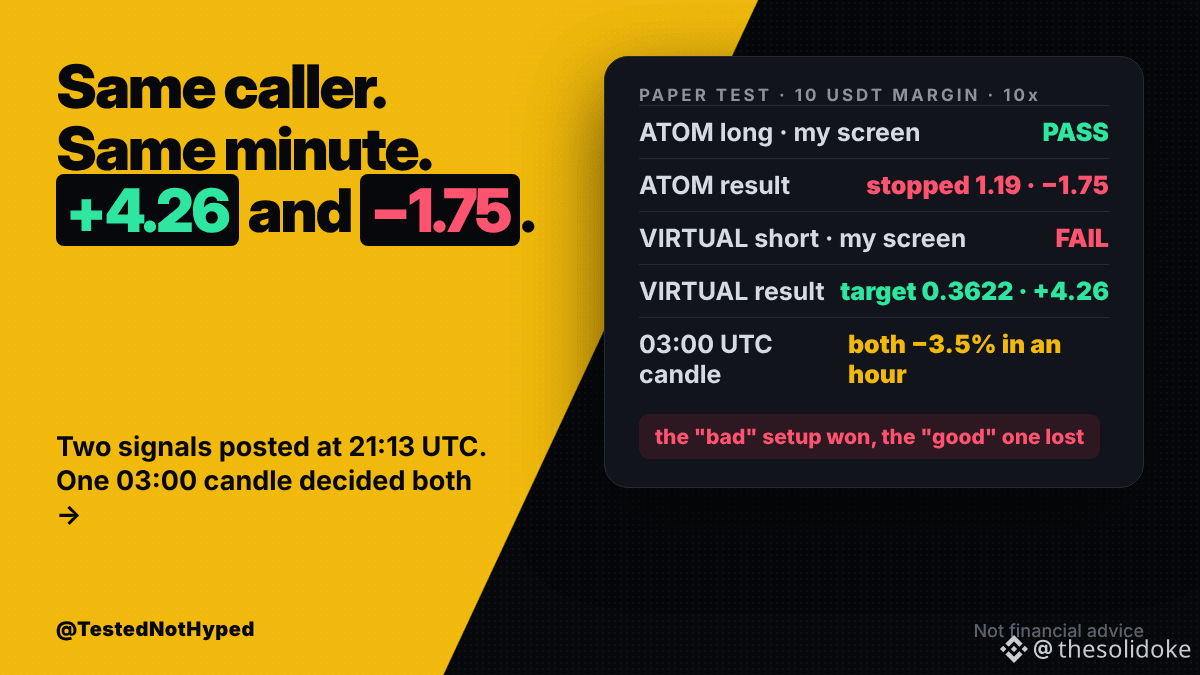
Dos señales del mismo emisor, publicadas en el mismo minuto anoche. Resultado en simulación: +4.26 y −1.75.
ATOM en largo (21:13 UTC): entrada 1.20–1.21, stop 1.19, objetivo 1.26. VIRTUAL en corto (mismo minuto): entrada 0.3765–0.3803, stop 0.4147, objetivo 0.3622. Como no se especificó apalancamiento, usé 10x en ambas. Añadí las dos a mi registro antes de conocer el resultado.
Mi pantalla favoreció la de ATOM: stop ajustado y objetivo a más del doble de distancia. No le gustó la de VIRTUAL: el stop estaba más lejos que el objetivo y por encima del precio de liquidación con 10x.
Esto fue lo que pasó: ATOM subió primero hasta 1.241 sin que se ejecutara la entrada, luego retrocedió y la entrada se ejecutó a 1.21 a las 02:00 UTC. Después, a las 03:00, una vela hizo caer ambas monedas cerca de un 3.5%. ATOM tocó el stop: −1.75. VIRTUAL alcanzó su objetivo: +4.26.
La misma vela, la misma dirección para todo el mercado. La configuración «buena» perdió y la «mala» ganó. Por eso evalúo las señales a lo largo de muchas operaciones, no por una sola.
Registro actualizado: 23 cerradas, 11 ganadoras, neto +0.71 USDT.
¿Juzgas una señal por su configuración o por si funcionó? 👇
Esto no es asesoramiento financiero. Resultados en simulación, precios reales de Binance.
#TradingSignals #TradingBots #crypto #cryptotrading #Write2Earn $BTC
Dos señales del mismo emisor, publicadas en el mismo minuto anoche. Resultado en simulación: +4.26 y −1.75.
ATOM en largo (21:13 UTC): entrada 1.20–1.21, stop 1.19, objetivo 1.26. VIRTUAL en corto (mismo minuto): entrada 0.3765–0.3803, stop 0.4147, objetivo 0.3622. Como no se especificó apalancamiento, usé 10x en ambas. Añadí las dos a mi registro antes de conocer el resultado.
Mi pantalla favoreció la de ATOM: stop ajustado y objetivo a más del doble de distancia. No le gustó la de VIRTUAL: el stop estaba más lejos que el objetivo y por encima del precio de liquidación con 10x.
Esto fue lo que pasó: ATOM subió primero hasta 1.241 sin que se ejecutara la entrada, luego retrocedió y la entrada se ejecutó a 1.21 a las 02:00 UTC. Después, a las 03:00, una vela hizo caer ambas monedas cerca de un 3.5%. ATOM tocó el stop: −1.75. VIRTUAL alcanzó su objetivo: +4.26.
La misma vela, la misma dirección para todo el mercado. La configuración «buena» perdió y la «mala» ganó. Por eso evalúo las señales a lo largo de muchas operaciones, no por una sola.
Registro actualizado: 23 cerradas, 11 ganadoras, neto +0.71 USDT.
¿Juzgas una señal por su configuración o por si funcionó? 👇
Esto no es asesoramiento financiero. Resultados en simulación, precios reales de Binance.
#TradingSignals #TradingBots #crypto #cryptotrading #Write2Earn $BTC
ATOM en largo (21:13 UTC): entrada 1.20–1.21, stop 1.19, objetivo 1.26. VIRTUAL en corto (mismo minuto): entrada 0.3765–0.3803, stop 0.4147, objetivo 0.3622. Como no se especificó apalancamiento, usé 10x en ambas. Añadí las dos a mi registro antes de conocer el resultado.
Mi pantalla favoreció la de ATOM: stop ajustado y objetivo a más del doble de distancia. No le gustó la de VIRTUAL: el stop estaba más lejos que el objetivo y por encima del precio de liquidación con 10x.
Esto fue lo que pasó: ATOM subió primero hasta 1.241 sin que se ejecutara la entrada, luego retrocedió y la entrada se ejecutó a 1.21 a las 02:00 UTC. Después, a las 03:00, una vela hizo caer ambas monedas cerca de un 3.5%. ATOM tocó el stop: −1.75. VIRTUAL alcanzó su objetivo: +4.26.
La misma vela, la misma dirección para todo el mercado. La configuración «buena» perdió y la «mala» ganó. Por eso evalúo las señales a lo largo de muchas operaciones, no por una sola.
Registro actualizado: 23 cerradas, 11 ganadoras, neto +0.71 USDT.
¿Juzgas una señal por su configuración o por si funcionó? 👇
Esto no es asesoramiento financiero. Resultados en simulación, precios reales de Binance.
#TradingSignals #TradingBots #crypto #cryptotrading #Write2Earn $BTC
333
·
--
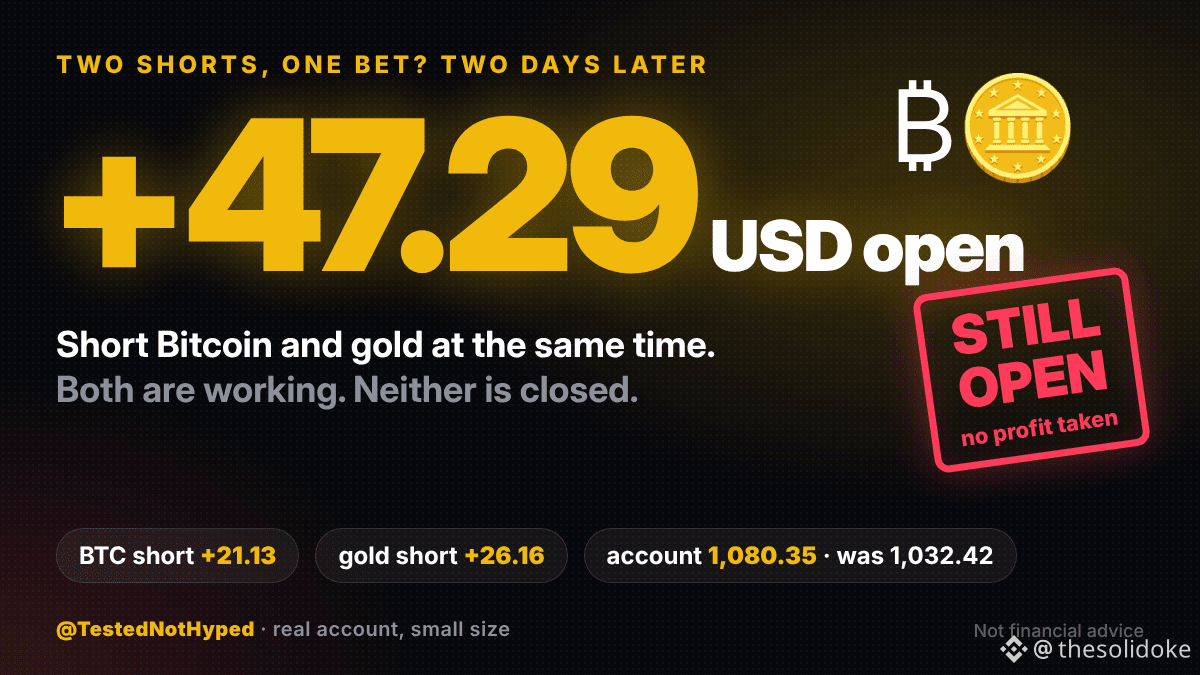
Mi bot de mercados está en corto en Bitcoin y oro al mismo tiempo. Hace dos días dije que era, en parte, una apuesta a favor de un dólar más fuerte, con un 5% de la cuenta en riesgo. Hoy ambas operaciones van ganando: +47.29 USD abiertos.
• BTC en corto desde 65,309: +21.13
• Oro en corto desde 3,741.53: +26.16
• cuenta: 1,080.35 USD, frente a 1,032.42 hace dos días
Es un bot de tendencias diarias en Exness. Cada operación arriesga un 2.5% hasta su propio stop. No hay un precio objetivo: mantiene la posición hasta que su regla de tendencia indica salir.
El riesgo que señalé no ha desaparecido. Si el dólar cambia de rumbo, ambas operaciones pueden cambiarlo a la vez. Que hoy ganen juntas significa que mañana pueden perder juntas.
¿Retirarías parte de las ganancias ahora o dejarías correr ambas operaciones? 👇
Esto no es asesoramiento financiero. Cuenta real, tamaño pequeño.
#TradingBots #algoTrading #BTC #crypto #GOLD $BTC
Mi bot de mercados está en corto en Bitcoin y oro al mismo tiempo. Hace dos días dije que era, en parte, una apuesta a favor de un dólar más fuerte, con un 5% de la cuenta en riesgo. Hoy ambas operaciones van ganando: +47.29 USD abiertos.
• BTC en corto desde 65,309: +21.13
• Oro en corto desde 3,741.53: +26.16
• cuenta: 1,080.35 USD, frente a 1,032.42 hace dos días
Es un bot de tendencias diarias en Exness. Cada operación arriesga un 2.5% hasta su propio stop. No hay un precio objetivo: mantiene la posición hasta que su regla de tendencia indica salir.
El riesgo que señalé no ha desaparecido. Si el dólar cambia de rumbo, ambas operaciones pueden cambiarlo a la vez. Que hoy ganen juntas significa que mañana pueden perder juntas.
¿Retirarías parte de las ganancias ahora o dejarías correr ambas operaciones? 👇
Esto no es asesoramiento financiero. Cuenta real, tamaño pequeño.
#TradingBots #algoTrading #BTC #crypto #GOLD $BTC
• BTC en corto desde 65,309: +21.13
• Oro en corto desde 3,741.53: +26.16
• cuenta: 1,080.35 USD, frente a 1,032.42 hace dos días
Es un bot de tendencias diarias en Exness. Cada operación arriesga un 2.5% hasta su propio stop. No hay un precio objetivo: mantiene la posición hasta que su regla de tendencia indica salir.
El riesgo que señalé no ha desaparecido. Si el dólar cambia de rumbo, ambas operaciones pueden cambiarlo a la vez. Que hoy ganen juntas significa que mañana pueden perder juntas.
¿Retirarías parte de las ganancias ahora o dejarías correr ambas operaciones? 👇
Esto no es asesoramiento financiero. Cuenta real, tamaño pequeño.
#TradingBots #algoTrading #BTC #crypto #GOLD $BTC
234
·
--
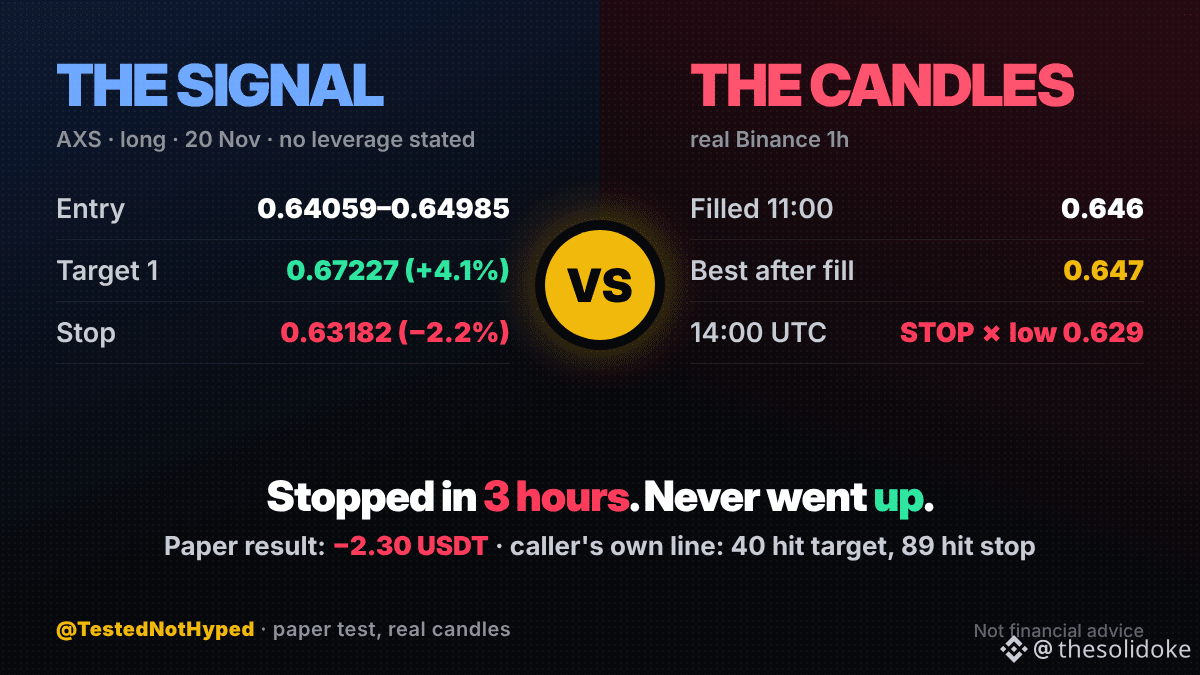
Prueba en papel de una señal long de AXS de Square: −2.30 USDT con un margen de 10 USDT. Liquidada por el stop en 3 horas.
Los niveles publicados (hoy, alrededor de las 10:40 UTC): entrada 0.64059–0.64985, stop 0.63182, objetivos 0.67227 / 0.68845 / 0.71271. No se indicó el apalancamiento, así que usé 10x. La añadí a mi registro antes del resultado.
Sobre el papel, esta operación estaba mejor planteada que la mayoría: el stop estaba a un 2.2% y el primer objetivo, a un 4.1%.
Lo que mostraron las velas reales de 1h: se ejecutó a 0.646 durante la hora de las 11:00 UTC. Lo máximo que llegó a alcanzar fue 0.647. Bajó cada hora a partir de entonces y, a las 14:00, una vela tocó 0.629, por debajo del stop. Una hora después, AXS estaba en 0.608.
La propia publicación del proveedor decía que, en los últimos 7 días, 40 de sus señales alcanzaron el objetivo y 89 tocaron el stop. Eso supone una tasa de acierto del 31%. Con el primer objetivo a unas 1.9 veces la distancia al stop, el punto de equilibrio está alrededor del 35%. Cerca, pero por debajo.
Registro: 21 operaciones cerradas, 10 ganadoras, neto de −1.80 USDT.
¿Qué tasa de acierto necesitarías ver antes de seguir a un proveedor de señales? 👇
Esto no es asesoramiento financiero. Resultados en papel, precios reales de Binance.
#TradingSignals #TradingBots #crypto #cryptotrading #Write2Earn $BTC
Prueba en papel de una señal long de AXS de Square: −2.30 USDT con un margen de 10 USDT. Liquidada por el stop en 3 horas.
Los niveles publicados (hoy, alrededor de las 10:40 UTC): entrada 0.64059–0.64985, stop 0.63182, objetivos 0.67227 / 0.68845 / 0.71271. No se indicó el apalancamiento, así que usé 10x. La añadí a mi registro antes del resultado.
Sobre el papel, esta operación estaba mejor planteada que la mayoría: el stop estaba a un 2.2% y el primer objetivo, a un 4.1%.
Lo que mostraron las velas reales de 1h: se ejecutó a 0.646 durante la hora de las 11:00 UTC. Lo máximo que llegó a alcanzar fue 0.647. Bajó cada hora a partir de entonces y, a las 14:00, una vela tocó 0.629, por debajo del stop. Una hora después, AXS estaba en 0.608.
La propia publicación del proveedor decía que, en los últimos 7 días, 40 de sus señales alcanzaron el objetivo y 89 tocaron el stop. Eso supone una tasa de acierto del 31%. Con el primer objetivo a unas 1.9 veces la distancia al stop, el punto de equilibrio está alrededor del 35%. Cerca, pero por debajo.
Registro: 21 operaciones cerradas, 10 ganadoras, neto de −1.80 USDT.
¿Qué tasa de acierto necesitarías ver antes de seguir a un proveedor de señales? 👇
Esto no es asesoramiento financiero. Resultados en papel, precios reales de Binance.
#TradingSignals #TradingBots #crypto #cryptotrading #Write2Earn $BTC
Los niveles publicados (hoy, alrededor de las 10:40 UTC): entrada 0.64059–0.64985, stop 0.63182, objetivos 0.67227 / 0.68845 / 0.71271. No se indicó el apalancamiento, así que usé 10x. La añadí a mi registro antes del resultado.
Sobre el papel, esta operación estaba mejor planteada que la mayoría: el stop estaba a un 2.2% y el primer objetivo, a un 4.1%.
Lo que mostraron las velas reales de 1h: se ejecutó a 0.646 durante la hora de las 11:00 UTC. Lo máximo que llegó a alcanzar fue 0.647. Bajó cada hora a partir de entonces y, a las 14:00, una vela tocó 0.629, por debajo del stop. Una hora después, AXS estaba en 0.608.
La propia publicación del proveedor decía que, en los últimos 7 días, 40 de sus señales alcanzaron el objetivo y 89 tocaron el stop. Eso supone una tasa de acierto del 31%. Con el primer objetivo a unas 1.9 veces la distancia al stop, el punto de equilibrio está alrededor del 35%. Cerca, pero por debajo.
Registro: 21 operaciones cerradas, 10 ganadoras, neto de −1.80 USDT.
¿Qué tasa de acierto necesitarías ver antes de seguir a un proveedor de señales? 👇
Esto no es asesoramiento financiero. Resultados en papel, precios reales de Binance.
#TradingSignals #TradingBots #crypto #cryptotrading #Write2Earn $BTC
286
·
--
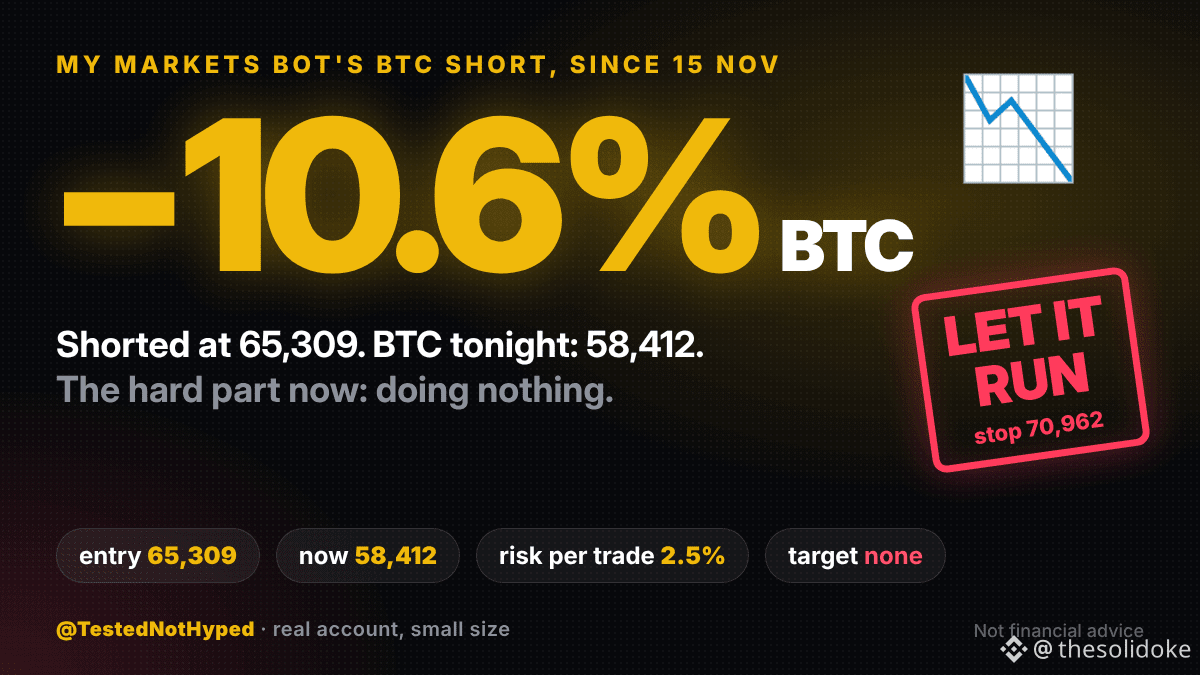
Mi bot de mercados abrió una posición corta en Bitcoin a 65,309 el 15 de noviembre. Esta noche, BTC está a 58,412: un 10,6 % a favor del bot.
Es un bot de tendencia diaria en Exness. Cada operación arriesga el 2,5 % de la cuenta, y el stop de esta está en 70,962. No hay un precio objetivo: mantiene la posición hasta que su regla de tendencia indique salir o hasta que se active el stop.
Lo que me tienta hacer: cerrarla y asegurar la ganancia. Lo que estoy haciendo: nada. En el seguimiento de tendencias, las pocas rachas largas compensan todas las pequeñas pérdidas, y son justo las operaciones que te tientan a cerrar antes de tiempo.
Una nota sincera: el backtest habría abierto esta posición corta dos días antes, a 71,205. Un flujo de datos desactualizado hizo que el bot en vivo no la detectara. Tarde, pero todavía dentro.
¿Dejas correr una operación ganadora o retiras el dinero? 👇
Esto no es asesoramiento financiero. Cuenta real, tamaño pequeño.
#TradingBots #algoTrading #BTC #crypto #Write2Earn $BTC
Mi bot de mercados abrió una posición corta en Bitcoin a 65,309 el 15 de noviembre. Esta noche, BTC está a 58,412: un 10,6 % a favor del bot.
Es un bot de tendencia diaria en Exness. Cada operación arriesga el 2,5 % de la cuenta, y el stop de esta está en 70,962. No hay un precio objetivo: mantiene la posición hasta que su regla de tendencia indique salir o hasta que se active el stop.
Lo que me tienta hacer: cerrarla y asegurar la ganancia. Lo que estoy haciendo: nada. En el seguimiento de tendencias, las pocas rachas largas compensan todas las pequeñas pérdidas, y son justo las operaciones que te tientan a cerrar antes de tiempo.
Una nota sincera: el backtest habría abierto esta posición corta dos días antes, a 71,205. Un flujo de datos desactualizado hizo que el bot en vivo no la detectara. Tarde, pero todavía dentro.
¿Dejas correr una operación ganadora o retiras el dinero? 👇
Esto no es asesoramiento financiero. Cuenta real, tamaño pequeño.
#TradingBots #algoTrading #BTC #crypto #Write2Earn $BTC
Es un bot de tendencia diaria en Exness. Cada operación arriesga el 2,5 % de la cuenta, y el stop de esta está en 70,962. No hay un precio objetivo: mantiene la posición hasta que su regla de tendencia indique salir o hasta que se active el stop.
Lo que me tienta hacer: cerrarla y asegurar la ganancia. Lo que estoy haciendo: nada. En el seguimiento de tendencias, las pocas rachas largas compensan todas las pequeñas pérdidas, y son justo las operaciones que te tientan a cerrar antes de tiempo.
Una nota sincera: el backtest habría abierto esta posición corta dos días antes, a 71,205. Un flujo de datos desactualizado hizo que el bot en vivo no la detectara. Tarde, pero todavía dentro.
¿Dejas correr una operación ganadora o retiras el dinero? 👇
Esto no es asesoramiento financiero. Cuenta real, tamaño pequeño.
#TradingBots #algoTrading #BTC #crypto #Write2Earn $BTC
114
·
--
Ver traducción
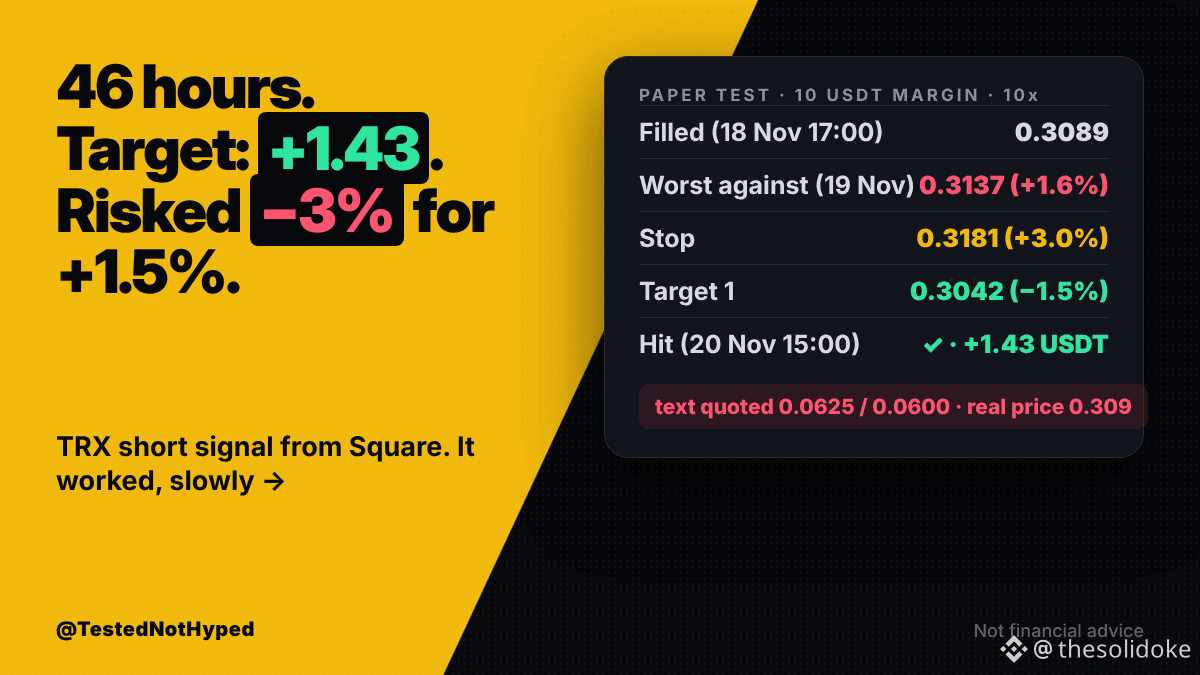
Paper test of a TRX short signal from Square: +1.43 USDT on 10 USDT margin. Target hit after 46 hours.
The levels as posted (18 Nov, about 16:43 UTC): entry 0.30851–0.30913, stop 0.31809, target 1 at 0.30419. No leverage stated, so I used 10x. I added it to my tracker before the result.
What the real 1h candles did: filled at 0.3089 in the 17:00 UTC hour. Next morning it went against the short to 0.3137, about halfway to the stop. Then it slowly came back, and at 15:00 UTC today a candle reached the target.
The setup risked 3% to make 1.5%. It worked this time, but a trade like that has to win about two times out of three just to break even.
Same caller as the BTC long I posted earlier. Both posts had text quoting price levels from another market: this one mentioned 0.0625 and 0.0600 for a coin trading at 0.309.
Tracker: 21 closed, 10 wins, net −1.80 USDT.
Would you take a trade that risks twice what it aims to make? 👇
Not financial advice. Paper results, real Binance prices.
#TradingSignals #TradingBots #crypto #cryptotrading #Write2Earn $BTC
Paper test of a TRX short signal from Square: +1.43 USDT on 10 USDT margin. Target hit after 46 hours.
The levels as posted (18 Nov, about 16:43 UTC): entry 0.30851–0.30913, stop 0.31809, target 1 at 0.30419. No leverage stated, so I used 10x. I added it to my tracker before the result.
What the real 1h candles did: filled at 0.3089 in the 17:00 UTC hour. Next morning it went against the short to 0.3137, about halfway to the stop. Then it slowly came back, and at 15:00 UTC today a candle reached the target.
The setup risked 3% to make 1.5%. It worked this time, but a trade like that has to win about two times out of three just to break even.
Same caller as the BTC long I posted earlier. Both posts had text quoting price levels from another market: this one mentioned 0.0625 and 0.0600 for a coin trading at 0.309.
Tracker: 21 closed, 10 wins, net −1.80 USDT.
Would you take a trade that risks twice what it aims to make? 👇
Not financial advice. Paper results, real Binance prices.
#TradingSignals #TradingBots #crypto #cryptotrading #Write2Earn $BTC
The levels as posted (18 Nov, about 16:43 UTC): entry 0.30851–0.30913, stop 0.31809, target 1 at 0.30419. No leverage stated, so I used 10x. I added it to my tracker before the result.
What the real 1h candles did: filled at 0.3089 in the 17:00 UTC hour. Next morning it went against the short to 0.3137, about halfway to the stop. Then it slowly came back, and at 15:00 UTC today a candle reached the target.
The setup risked 3% to make 1.5%. It worked this time, but a trade like that has to win about two times out of three just to break even.
Same caller as the BTC long I posted earlier. Both posts had text quoting price levels from another market: this one mentioned 0.0625 and 0.0600 for a coin trading at 0.309.
Tracker: 21 closed, 10 wins, net −1.80 USDT.
Would you take a trade that risks twice what it aims to make? 👇
Not financial advice. Paper results, real Binance prices.
#TradingSignals #TradingBots #crypto #cryptotrading #Write2Earn $BTC
193
·
--
Ver traducción
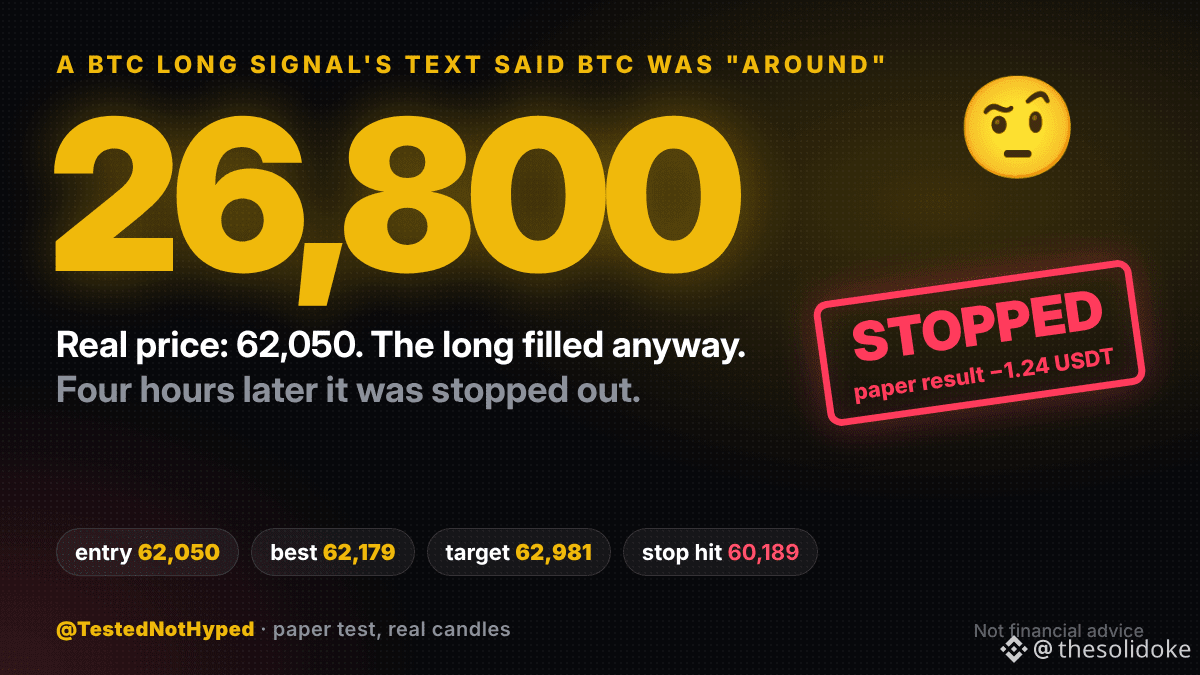
Paper test of a BTC long signal from Square: −1.24 USDT on 10 USDT margin. Stopped out in 4 hours.
The levels as posted (today, about 10:53 UTC): entry 61,988–62,113, stop 60,189, target 1 at 62,981. The post said "max 3–4x", so I used 4x. I added it to my tracker before the result.
One thing in the text: it said BTC was "grinding around the 26,800 level" and to take half profit "near 27,300". The real price was about 62,000. The entry and stop numbers were right, the story around them wasn't.
What the real 1h candles did: filled at 62,050 in the 11:00 UTC hour. The best it got was 62,179, never near the target. At 15:00 one candle dropped to 59,388 and hit the stop.
The stop did its job: −1.24 instead of riding BTC down to 58,769 an hour later.
Today three of my tracked signals closed: one target, two stops. Tracker: 21 closed, 10 wins, net −1.80 USDT.
Do you read the reasoning in a signal post, or just the numbers? 👇
Not financial advice. Paper results, real Binance prices.
#TradingSignals #TradingBots #BTC #cryptotrading #Write2Earn $BTC
Paper test of a BTC long signal from Square: −1.24 USDT on 10 USDT margin. Stopped out in 4 hours.
The levels as posted (today, about 10:53 UTC): entry 61,988–62,113, stop 60,189, target 1 at 62,981. The post said "max 3–4x", so I used 4x. I added it to my tracker before the result.
One thing in the text: it said BTC was "grinding around the 26,800 level" and to take half profit "near 27,300". The real price was about 62,000. The entry and stop numbers were right, the story around them wasn't.
What the real 1h candles did: filled at 62,050 in the 11:00 UTC hour. The best it got was 62,179, never near the target. At 15:00 one candle dropped to 59,388 and hit the stop.
The stop did its job: −1.24 instead of riding BTC down to 58,769 an hour later.
Today three of my tracked signals closed: one target, two stops. Tracker: 21 closed, 10 wins, net −1.80 USDT.
Do you read the reasoning in a signal post, or just the numbers? 👇
Not financial advice. Paper results, real Binance prices.
#TradingSignals #TradingBots #BTC #cryptotrading #Write2Earn $BTC
The levels as posted (today, about 10:53 UTC): entry 61,988–62,113, stop 60,189, target 1 at 62,981. The post said "max 3–4x", so I used 4x. I added it to my tracker before the result.
One thing in the text: it said BTC was "grinding around the 26,800 level" and to take half profit "near 27,300". The real price was about 62,000. The entry and stop numbers were right, the story around them wasn't.
What the real 1h candles did: filled at 62,050 in the 11:00 UTC hour. The best it got was 62,179, never near the target. At 15:00 one candle dropped to 59,388 and hit the stop.
The stop did its job: −1.24 instead of riding BTC down to 58,769 an hour later.
Today three of my tracked signals closed: one target, two stops. Tracker: 21 closed, 10 wins, net −1.80 USDT.
Do you read the reasoning in a signal post, or just the numbers? 👇
Not financial advice. Paper results, real Binance prices.
#TradingSignals #TradingBots #BTC #cryptotrading #Write2Earn $BTC
50
·
--
Ver traducción
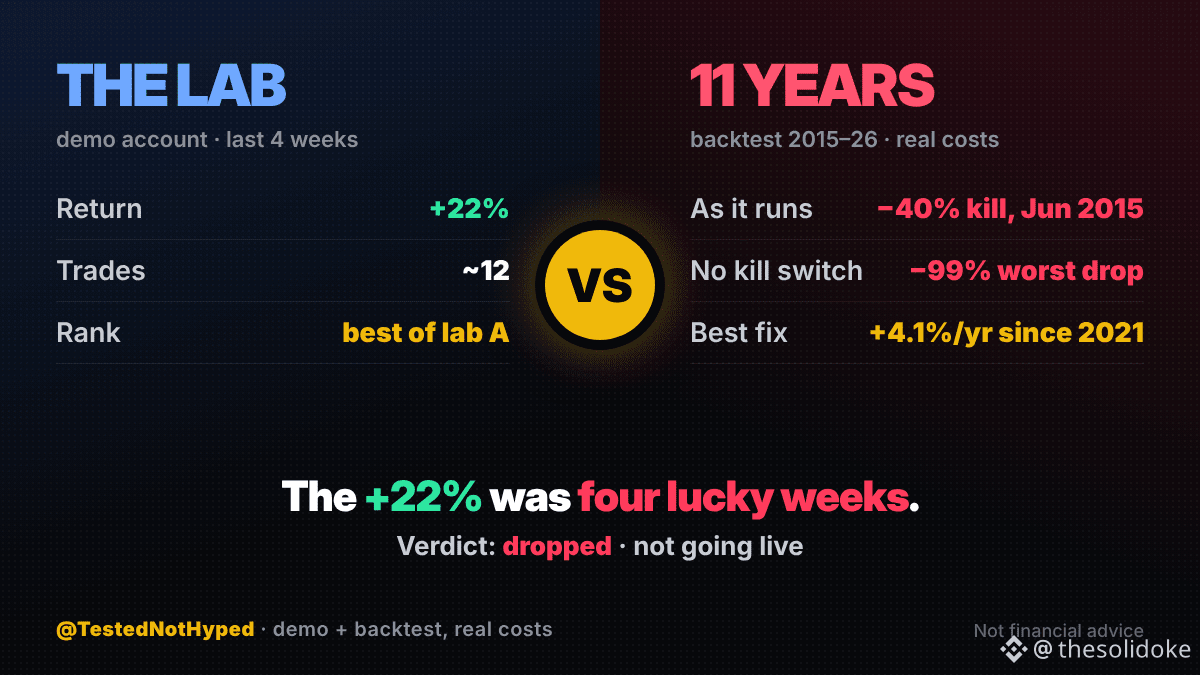
Yesterday I posted my best demo bot: +15.4% in 9 days. It's at +22% now. I backtested it over 11 years: it hit its −40% kill switch in June 2015.
The plan was to take the best bot from each of my 3 demo labs, improve it, and go live. Same rules, real FxPro spreads and financing, daily data 2015–2026:
• as it runs in the lab: killed in 2015. Without the kill switch: −99% worst drop
• long-only: killed in 2015 too
• long-only, half the risk, total risk capped: +4.1% a year since 2021, −21% worst drop
The +22% was four good weeks. Its shorts lost money in both halves of the data.
The other two picks: one dropped (it copies what my live bot already does), one passed but stays on paper for 3–6 months first.
So "go live with all three" became: none yet.
How long do you watch a demo bot before you trust its numbers? 👇
Not financial advice. Demo results and backtests, real costs.
#TradingBots #algoTrading #crypto #BTC #Write2Earn $BTC
Yesterday I posted my best demo bot: +15.4% in 9 days. It's at +22% now. I backtested it over 11 years: it hit its −40% kill switch in June 2015.
The plan was to take the best bot from each of my 3 demo labs, improve it, and go live. Same rules, real FxPro spreads and financing, daily data 2015–2026:
• as it runs in the lab: killed in 2015. Without the kill switch: −99% worst drop
• long-only: killed in 2015 too
• long-only, half the risk, total risk capped: +4.1% a year since 2021, −21% worst drop
The +22% was four good weeks. Its shorts lost money in both halves of the data.
The other two picks: one dropped (it copies what my live bot already does), one passed but stays on paper for 3–6 months first.
So "go live with all three" became: none yet.
How long do you watch a demo bot before you trust its numbers? 👇
Not financial advice. Demo results and backtests, real costs.
#TradingBots #algoTrading #crypto #BTC #Write2Earn $BTC
The plan was to take the best bot from each of my 3 demo labs, improve it, and go live. Same rules, real FxPro spreads and financing, daily data 2015–2026:
• as it runs in the lab: killed in 2015. Without the kill switch: −99% worst drop
• long-only: killed in 2015 too
• long-only, half the risk, total risk capped: +4.1% a year since 2021, −21% worst drop
The +22% was four good weeks. Its shorts lost money in both halves of the data.
The other two picks: one dropped (it copies what my live bot already does), one passed but stays on paper for 3–6 months first.
So "go live with all three" became: none yet.
How long do you watch a demo bot before you trust its numbers? 👇
Not financial advice. Demo results and backtests, real costs.
#TradingBots #algoTrading #crypto #BTC #Write2Earn $BTC
2
·
--
Ver traducción
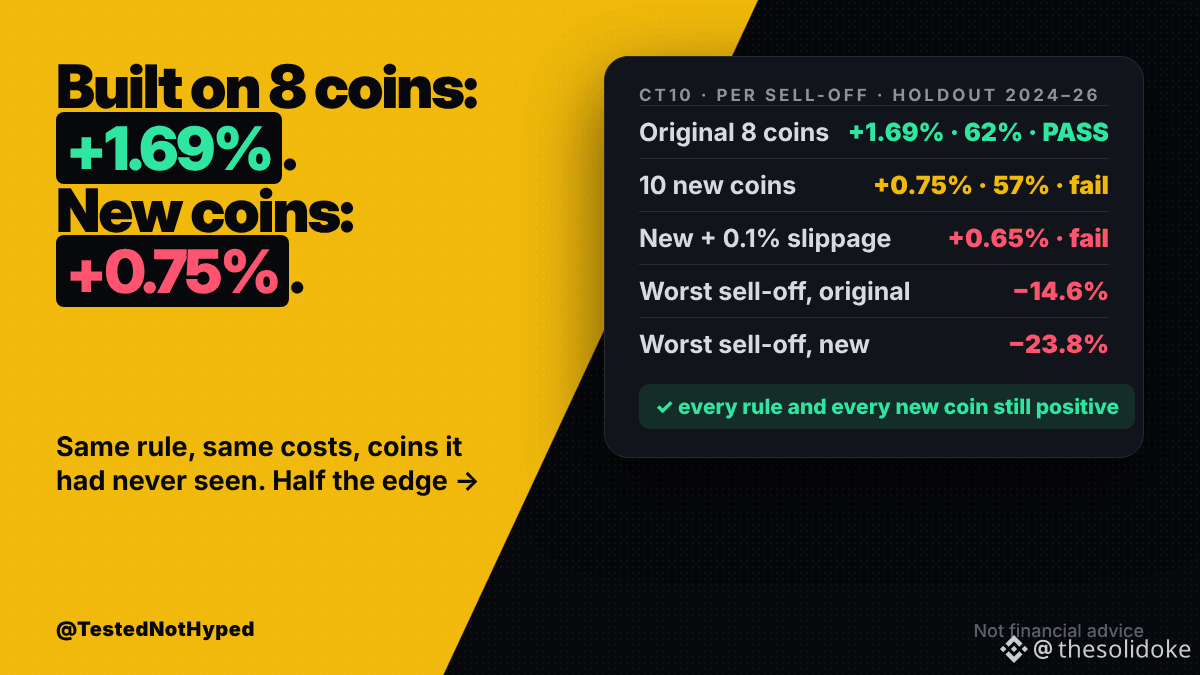
My best paper rule earns +1.69% per sell-off on the 8 coins I built it on. On 10 coins it had never seen: +0.75%.
The rule (CT10) buys when retail traders have capitulated. Same 27 settings, same costs, holdout 2024–2026, counted once per sell-off:
• original 8 coins: +1.69%, 62% positive, passes
• 10 new coins (AVAX, DOT, LTC, NEAR, UNI and 5 more): +0.75%, 57% positive, fails
• new coins with 0.1% extra slippage: +0.65%, fails
Worst single sell-off on the new coins: −23.8%, against −14.6% on the originals.
The good part: every rule and every new coin is still positive. So the effect is real. It's about half as strong on thinner coins, and slippage eats most of the rest.
So the live version stays on the original coin list. The new coins get paper at most.
Do you test a strategy on coins it was never built on? 👇
Not financial advice. Backtest, costs included.
#TradingBots #algoTrading #crypto #cryptotrading #Write2Earn $BTC
My best paper rule earns +1.69% per sell-off on the 8 coins I built it on. On 10 coins it had never seen: +0.75%.
The rule (CT10) buys when retail traders have capitulated. Same 27 settings, same costs, holdout 2024–2026, counted once per sell-off:
• original 8 coins: +1.69%, 62% positive, passes
• 10 new coins (AVAX, DOT, LTC, NEAR, UNI and 5 more): +0.75%, 57% positive, fails
• new coins with 0.1% extra slippage: +0.65%, fails
Worst single sell-off on the new coins: −23.8%, against −14.6% on the originals.
The good part: every rule and every new coin is still positive. So the effect is real. It's about half as strong on thinner coins, and slippage eats most of the rest.
So the live version stays on the original coin list. The new coins get paper at most.
Do you test a strategy on coins it was never built on? 👇
Not financial advice. Backtest, costs included.
#TradingBots #algoTrading #crypto #cryptotrading #Write2Earn $BTC
The rule (CT10) buys when retail traders have capitulated. Same 27 settings, same costs, holdout 2024–2026, counted once per sell-off:
• original 8 coins: +1.69%, 62% positive, passes
• 10 new coins (AVAX, DOT, LTC, NEAR, UNI and 5 more): +0.75%, 57% positive, fails
• new coins with 0.1% extra slippage: +0.65%, fails
Worst single sell-off on the new coins: −23.8%, against −14.6% on the originals.
The good part: every rule and every new coin is still positive. So the effect is real. It's about half as strong on thinner coins, and slippage eats most of the rest.
So the live version stays on the original coin list. The new coins get paper at most.
Do you test a strategy on coins it was never built on? 👇
Not financial advice. Backtest, costs included.
#TradingBots #algoTrading #crypto #cryptotrading #Write2Earn $BTC
62
·
--
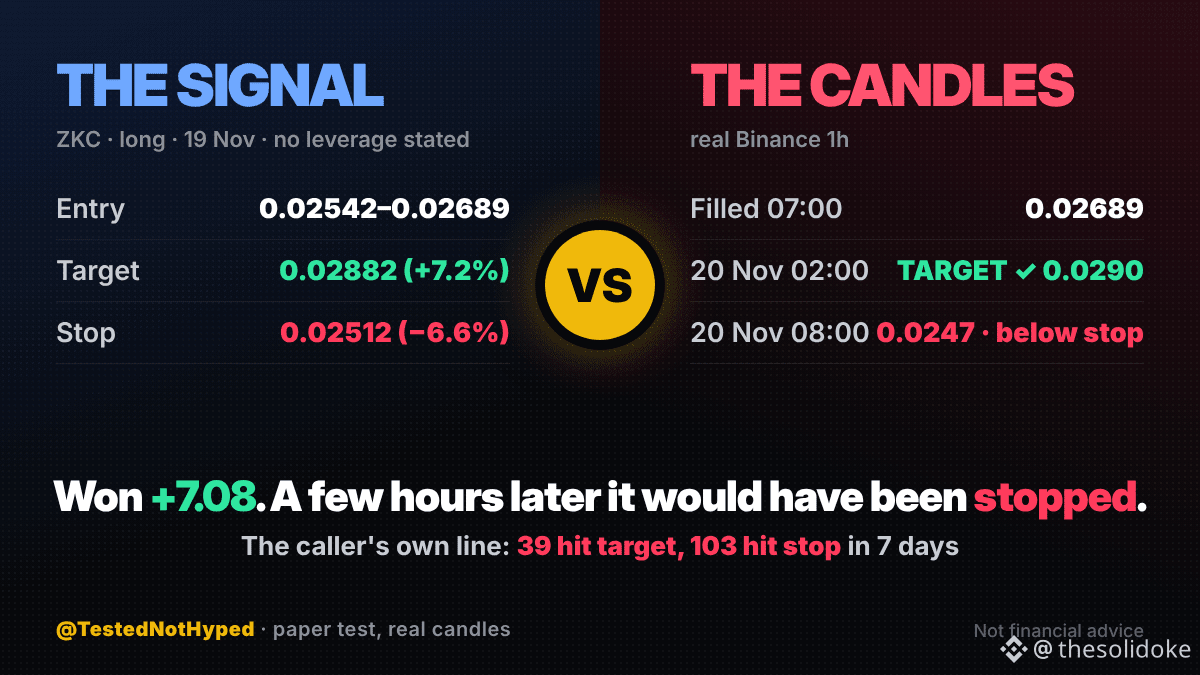
Prueba simulada de una señal de $ZKC long de Square: +7.08 USDT con un margen de 10 USDT. Objetivo alcanzado en 19 horas.
Los niveles publicados (19 nov., alrededor de las 06:20 UTC): entrada 0.02542–0.02689, objetivo 0.02882, stop 0.02512. No se indicó apalancamiento, así que usé 10x. La añadí a mi registro antes del resultado.
Lo que hicieron las velas reales de 1 h: el precio ya estaba en la parte superior de la zona, así que la orden se ejecutó a 0.02689 durante la hora de las 07:00 UTC. La caída máxima fue hasta 0.02580, muy por encima del stop. Hoy, a las 02:00 UTC, una vela llegó a 0.0290 y alcanzó el objetivo.
Luego mira las seis horas siguientes: $ZKC bajó hasta 0.0247, por debajo del stop. La misma señal, unas horas después, y se convierte en una pérdida en vez de una ganancia.
La publicación del propio proveedor lo decía claramente: en los últimos 7 días, 39 de sus señales alcanzaron el objetivo y 103 tocaron el stop.
Mi registro: 18 cerradas, 9 ganancias, neto +0.31 USDT.
¿Un historial de 39 frente a 103 hace que confíes más en un proveedor por ser sincero, o menos? 👇
Esto no es asesoramiento financiero. Resultados simulados, precios reales de Binance.
#TradingSignals #TradingBots #crypto #cryptotrading #Write2Earn $BTC
Prueba simulada de una señal de $ZKC long de Square: +7.08 USDT con un margen de 10 USDT. Objetivo alcanzado en 19 horas.
Los niveles publicados (19 nov., alrededor de las 06:20 UTC): entrada 0.02542–0.02689, objetivo 0.02882, stop 0.02512. No se indicó apalancamiento, así que usé 10x. La añadí a mi registro antes del resultado.
Lo que hicieron las velas reales de 1 h: el precio ya estaba en la parte superior de la zona, así que la orden se ejecutó a 0.02689 durante la hora de las 07:00 UTC. La caída máxima fue hasta 0.02580, muy por encima del stop. Hoy, a las 02:00 UTC, una vela llegó a 0.0290 y alcanzó el objetivo.
Luego mira las seis horas siguientes: $ZKC bajó hasta 0.0247, por debajo del stop. La misma señal, unas horas después, y se convierte en una pérdida en vez de una ganancia.
La publicación del propio proveedor lo decía claramente: en los últimos 7 días, 39 de sus señales alcanzaron el objetivo y 103 tocaron el stop.
Mi registro: 18 cerradas, 9 ganancias, neto +0.31 USDT.
¿Un historial de 39 frente a 103 hace que confíes más en un proveedor por ser sincero, o menos? 👇
Esto no es asesoramiento financiero. Resultados simulados, precios reales de Binance.
#TradingSignals #TradingBots #crypto #cryptotrading #Write2Earn $BTC
Los niveles publicados (19 nov., alrededor de las 06:20 UTC): entrada 0.02542–0.02689, objetivo 0.02882, stop 0.02512. No se indicó apalancamiento, así que usé 10x. La añadí a mi registro antes del resultado.
Lo que hicieron las velas reales de 1 h: el precio ya estaba en la parte superior de la zona, así que la orden se ejecutó a 0.02689 durante la hora de las 07:00 UTC. La caída máxima fue hasta 0.02580, muy por encima del stop. Hoy, a las 02:00 UTC, una vela llegó a 0.0290 y alcanzó el objetivo.
Luego mira las seis horas siguientes: $ZKC bajó hasta 0.0247, por debajo del stop. La misma señal, unas horas después, y se convierte en una pérdida en vez de una ganancia.
La publicación del propio proveedor lo decía claramente: en los últimos 7 días, 39 de sus señales alcanzaron el objetivo y 103 tocaron el stop.
Mi registro: 18 cerradas, 9 ganancias, neto +0.31 USDT.
¿Un historial de 39 frente a 103 hace que confíes más en un proveedor por ser sincero, o menos? 👇
Esto no es asesoramiento financiero. Resultados simulados, precios reales de Binance.
#TradingSignals #TradingBots #crypto #cryptotrading #Write2Earn $BTC
1
404
·
--
Ver traducción
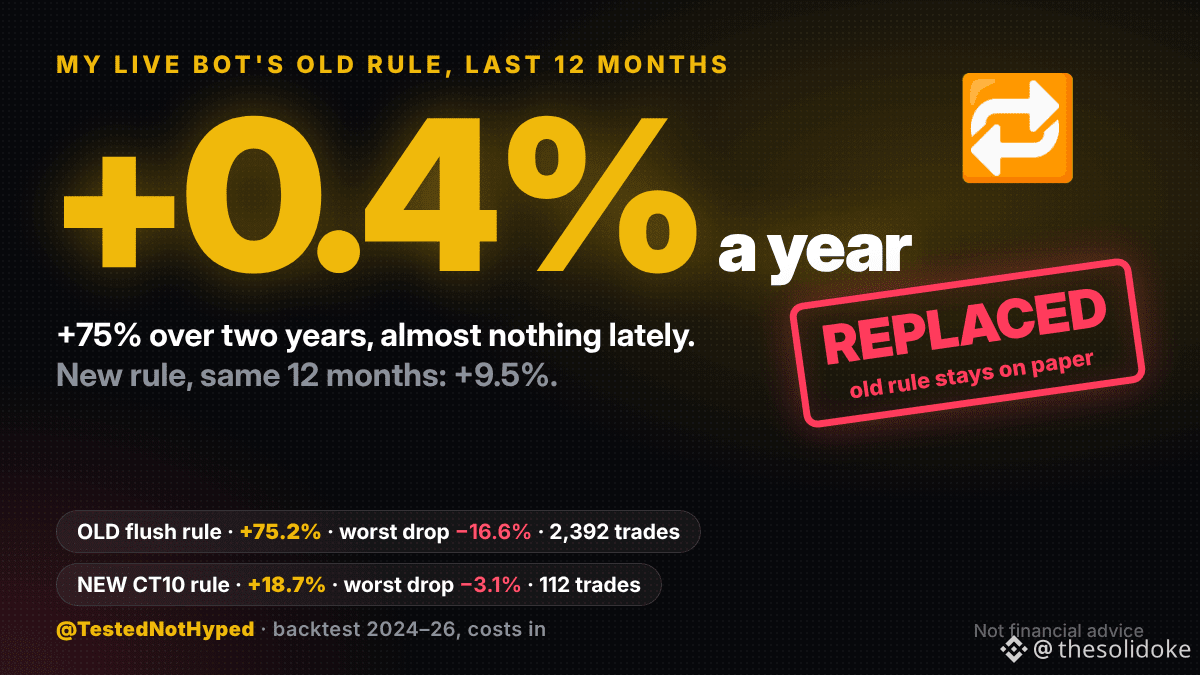
My live bot's old entry rule made +75% in a two-year backtest. Its last 12 months: +0.4%.
I'm replacing it.
Holdout 2024–26, same 6 coins, same size per trade (5.7% of the account):
• old flush rule: +75.2%, worst drop −16.6%, 2,392 trades
• new CT10 rule: +18.7%, worst drop −3.1%, 112 trades
• last 12 months: old +0.4%, new +9.5% (83% wins)
CT10 only buys when retail traders have capitulated. It trades about 20 times less, so on total return it loses, and my own pass rule says no. I'm making a written exception. Both AI reviewers agreed, one only as a reversible pilot.
Guard rails: same size per trade, the old rule keeps running on paper next to it, a weekly comparison, and one command undoes it.
Would you take +19% with a −3% worst drop, or +75% with −17%? 👇
Not financial advice. Backtest results; live starts at the same small size.
#TradingBots #algoTrading $BTC #crypto #BTC #Write2Earn
My live bot's old entry rule made +75% in a two-year backtest. Its last 12 months: +0.4%.
I'm replacing it.
Holdout 2024–26, same 6 coins, same size per trade (5.7% of the account):
• old flush rule: +75.2%, worst drop −16.6%, 2,392 trades
• new CT10 rule: +18.7%, worst drop −3.1%, 112 trades
• last 12 months: old +0.4%, new +9.5% (83% wins)
CT10 only buys when retail traders have capitulated. It trades about 20 times less, so on total return it loses, and my own pass rule says no. I'm making a written exception. Both AI reviewers agreed, one only as a reversible pilot.
Guard rails: same size per trade, the old rule keeps running on paper next to it, a weekly comparison, and one command undoes it.
Would you take +19% with a −3% worst drop, or +75% with −17%? 👇
Not financial advice. Backtest results; live starts at the same small size.
#TradingBots #algoTrading $BTC #crypto #BTC #Write2Earn
I'm replacing it.
Holdout 2024–26, same 6 coins, same size per trade (5.7% of the account):
• old flush rule: +75.2%, worst drop −16.6%, 2,392 trades
• new CT10 rule: +18.7%, worst drop −3.1%, 112 trades
• last 12 months: old +0.4%, new +9.5% (83% wins)
CT10 only buys when retail traders have capitulated. It trades about 20 times less, so on total return it loses, and my own pass rule says no. I'm making a written exception. Both AI reviewers agreed, one only as a reversible pilot.
Guard rails: same size per trade, the old rule keeps running on paper next to it, a weekly comparison, and one command undoes it.
Would you take +19% with a −3% worst drop, or +75% with −17%? 👇
Not financial advice. Backtest results; live starts at the same small size.
#TradingBots #algoTrading $BTC #crypto #BTC #Write2Earn
87
·
--
Ver traducción
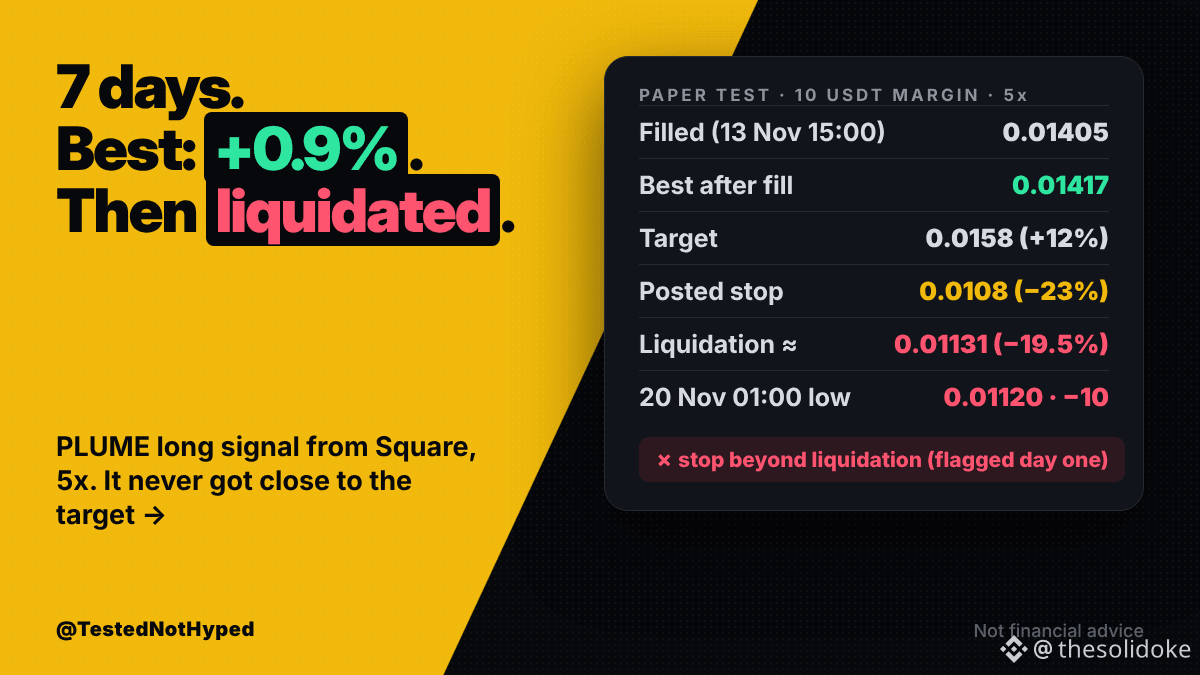
Paper test of a PLUME long signal from Square: −10.00 USDT on 10 USDT margin. Liquidated after 7 days.
The levels as posted (13 Nov, about 14:38 UTC): entry 0.0140–0.0142, target 0.0158, stop 0.0108, 5x. I added it to my tracker before the result.
What the real 1h candles did: filled at 0.01405 in the 15:00 UTC hour. The best it ever got was 0.01417, under 1% up. Then a slow bleed: a week between 0.0115 and 0.0122. At 01:00 UTC today a candle dipped to 0.01120. At 5x, liquidation sat near 0.01131.
The posted stop (0.0108) was below the liquidation price, so it could never fire. My screen flagged that on day one.
The caller did tighten it the next morning: 3x, stop 0.01211. That came after my fill, so I kept the original. The new stop would have hit on day 2 for about −4 instead of −10.
Overnight another signal hit its target (+7.08), so my tracker is now 18 closed, 9 wins, net +0.31 USDT. Basically flat after 18 trades.
Do you check where your liquidation price is before you set the stop? 👇
Not financial advice. Paper results, real Binance prices.
#TradingSignals #TradingBots #crypto #cryptotrading #Write2Earn $BTC
Paper test of a PLUME long signal from Square: −10.00 USDT on 10 USDT margin. Liquidated after 7 days.
The levels as posted (13 Nov, about 14:38 UTC): entry 0.0140–0.0142, target 0.0158, stop 0.0108, 5x. I added it to my tracker before the result.
What the real 1h candles did: filled at 0.01405 in the 15:00 UTC hour. The best it ever got was 0.01417, under 1% up. Then a slow bleed: a week between 0.0115 and 0.0122. At 01:00 UTC today a candle dipped to 0.01120. At 5x, liquidation sat near 0.01131.
The posted stop (0.0108) was below the liquidation price, so it could never fire. My screen flagged that on day one.
The caller did tighten it the next morning: 3x, stop 0.01211. That came after my fill, so I kept the original. The new stop would have hit on day 2 for about −4 instead of −10.
Overnight another signal hit its target (+7.08), so my tracker is now 18 closed, 9 wins, net +0.31 USDT. Basically flat after 18 trades.
Do you check where your liquidation price is before you set the stop? 👇
Not financial advice. Paper results, real Binance prices.
#TradingSignals #TradingBots #crypto #cryptotrading #Write2Earn $BTC
The levels as posted (13 Nov, about 14:38 UTC): entry 0.0140–0.0142, target 0.0158, stop 0.0108, 5x. I added it to my tracker before the result.
What the real 1h candles did: filled at 0.01405 in the 15:00 UTC hour. The best it ever got was 0.01417, under 1% up. Then a slow bleed: a week between 0.0115 and 0.0122. At 01:00 UTC today a candle dipped to 0.01120. At 5x, liquidation sat near 0.01131.
The posted stop (0.0108) was below the liquidation price, so it could never fire. My screen flagged that on day one.
The caller did tighten it the next morning: 3x, stop 0.01211. That came after my fill, so I kept the original. The new stop would have hit on day 2 for about −4 instead of −10.
Overnight another signal hit its target (+7.08), so my tracker is now 18 closed, 9 wins, net +0.31 USDT. Basically flat after 18 trades.
Do you check where your liquidation price is before you set the stop? 👇
Not financial advice. Paper results, real Binance prices.
#TradingSignals #TradingBots #crypto #cryptotrading #Write2Earn $BTC
121
·
--
Ver traducción
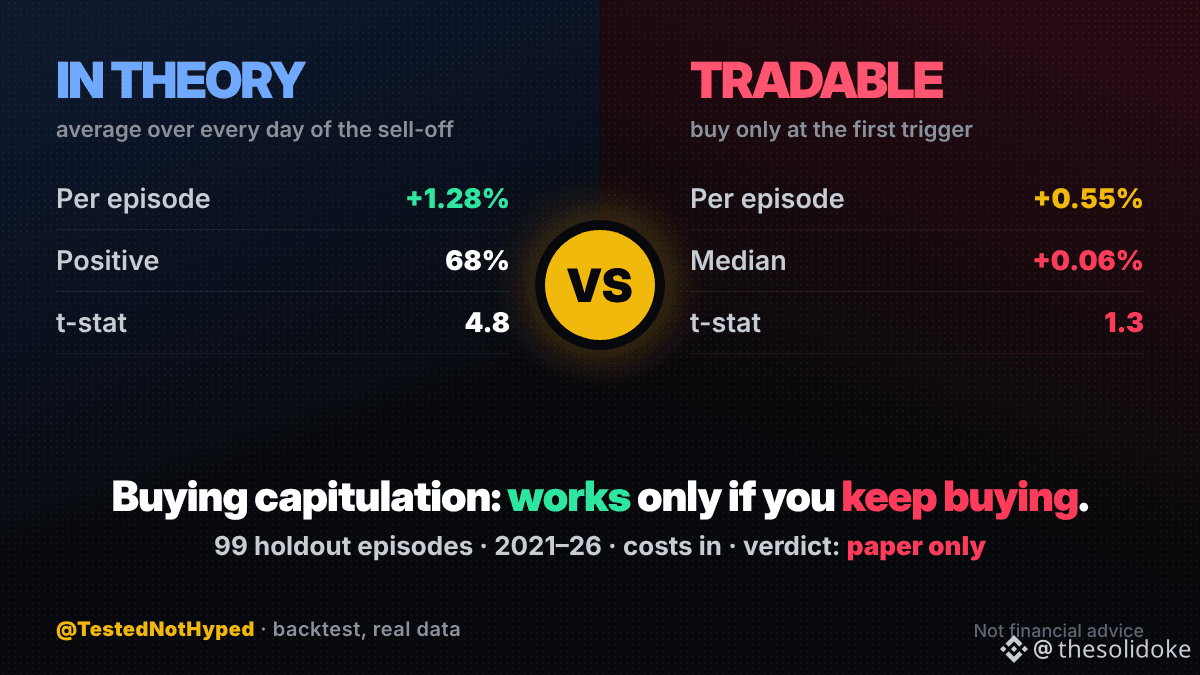
My backtest said buying crypto capitulation pays +1.28% per sell-off. The version I could actually trade: +0.55%.
I combined 55 rules into one "Capitulation" signal: retail margin calls, order-book drains, open-interest flushes. Data 2021–2026, costs included. Each sell-off counted once, not once per coin.
On 99 holdout episodes:
• averaging every day of each sell-off: +1.28%, 68% positive
• buying only at the first trigger: +0.55%, median +0.06%, 52% positive
The first number assumes you keep buying all the way down. That's not a bet you can place when the signal fires.
Two AI reviewers checked it, and one found exactly that hole.
The tradable version also swings by year: −0.97% in 2022, +2.08% in 2023.
So it stays on paper, and my live flush bot isn't replaced. Next test: adding on each new day of the sell-off, with a cap.
Would you buy the first capitulation signal, or wait and scale in? 👇
Not financial advice. Backtest, costs included.
#TradingBots #algoTrading $BTC #crypto #BTC #Write2Earn
My backtest said buying crypto capitulation pays +1.28% per sell-off. The version I could actually trade: +0.55%.
I combined 55 rules into one "Capitulation" signal: retail margin calls, order-book drains, open-interest flushes. Data 2021–2026, costs included. Each sell-off counted once, not once per coin.
On 99 holdout episodes:
• averaging every day of each sell-off: +1.28%, 68% positive
• buying only at the first trigger: +0.55%, median +0.06%, 52% positive
The first number assumes you keep buying all the way down. That's not a bet you can place when the signal fires.
Two AI reviewers checked it, and one found exactly that hole.
The tradable version also swings by year: −0.97% in 2022, +2.08% in 2023.
So it stays on paper, and my live flush bot isn't replaced. Next test: adding on each new day of the sell-off, with a cap.
Would you buy the first capitulation signal, or wait and scale in? 👇
Not financial advice. Backtest, costs included.
#TradingBots #algoTrading $BTC #crypto #BTC #Write2Earn
I combined 55 rules into one "Capitulation" signal: retail margin calls, order-book drains, open-interest flushes. Data 2021–2026, costs included. Each sell-off counted once, not once per coin.
On 99 holdout episodes:
• averaging every day of each sell-off: +1.28%, 68% positive
• buying only at the first trigger: +0.55%, median +0.06%, 52% positive
The first number assumes you keep buying all the way down. That's not a bet you can place when the signal fires.
Two AI reviewers checked it, and one found exactly that hole.
The tradable version also swings by year: −0.97% in 2022, +2.08% in 2023.
So it stays on paper, and my live flush bot isn't replaced. Next test: adding on each new day of the sell-off, with a cap.
Would you buy the first capitulation signal, or wait and scale in? 👇
Not financial advice. Backtest, costs included.
#TradingBots #algoTrading $BTC #crypto #BTC #Write2Earn
126
·
--
Ver traducción
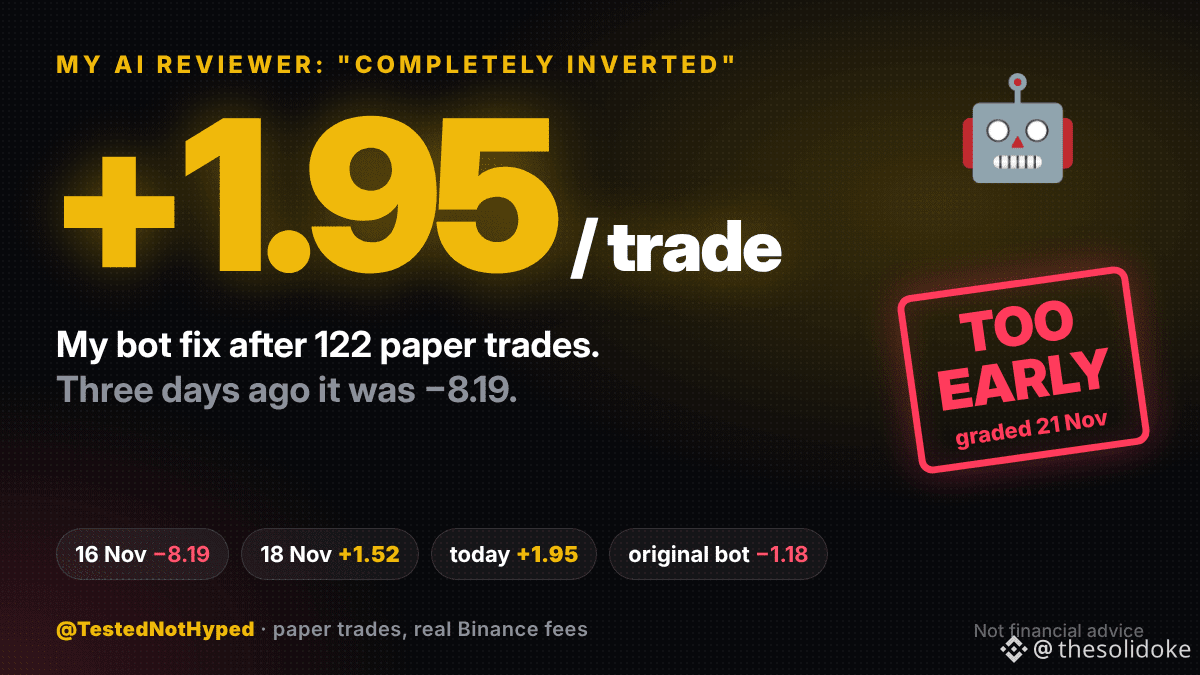
My AI reviewer says my bot fix turned −8.19 per trade into +1.95. I told it: too early.
Every morning one AI checks my bots and a second one argues with it.
Today's disagreement was about my premium-fade paper bot. The fix: only trade when the gap is 2%, not 1%. The original keeps running next to it.
The fix, per trade (paper, sized as a 20,000 USD account):
• 16 Nov: −8.19 (22 trades)
• 18 Nov: +1.52 (92 trades)
• today: +1.95 (122 trades)
• the original bot: −1.18
The reviewer called it "completely inverted". Three days ago the same fix looked broken. A good streak doesn't settle it either.
It also flagged a "trade explosion" (22 to 122 trades in 72 hours) and asked me to check for a re-entry loop. Fair question, but no: the original takes about 150 trades a day. A stricter filter getting about 35 a day is the expected share.
It gets graded at my weekly review on 21 Nov.
Do you let an AI review your trading, or does it just agree with you? 👇
Not financial advice. Paper trades, real Binance fees.
#TradingBots #AITrading #algoTrading $BTC #crypto #BTC
My AI reviewer says my bot fix turned −8.19 per trade into +1.95. I told it: too early.
Every morning one AI checks my bots and a second one argues with it.
Today's disagreement was about my premium-fade paper bot. The fix: only trade when the gap is 2%, not 1%. The original keeps running next to it.
The fix, per trade (paper, sized as a 20,000 USD account):
• 16 Nov: −8.19 (22 trades)
• 18 Nov: +1.52 (92 trades)
• today: +1.95 (122 trades)
• the original bot: −1.18
The reviewer called it "completely inverted". Three days ago the same fix looked broken. A good streak doesn't settle it either.
It also flagged a "trade explosion" (22 to 122 trades in 72 hours) and asked me to check for a re-entry loop. Fair question, but no: the original takes about 150 trades a day. A stricter filter getting about 35 a day is the expected share.
It gets graded at my weekly review on 21 Nov.
Do you let an AI review your trading, or does it just agree with you? 👇
Not financial advice. Paper trades, real Binance fees.
#TradingBots #AITrading #algoTrading $BTC #crypto #BTC
Every morning one AI checks my bots and a second one argues with it.
Today's disagreement was about my premium-fade paper bot. The fix: only trade when the gap is 2%, not 1%. The original keeps running next to it.
The fix, per trade (paper, sized as a 20,000 USD account):
• 16 Nov: −8.19 (22 trades)
• 18 Nov: +1.52 (92 trades)
• today: +1.95 (122 trades)
• the original bot: −1.18
The reviewer called it "completely inverted". Three days ago the same fix looked broken. A good streak doesn't settle it either.
It also flagged a "trade explosion" (22 to 122 trades in 72 hours) and asked me to check for a re-entry loop. Fair question, but no: the original takes about 150 trades a day. A stricter filter getting about 35 a day is the expected share.
It gets graded at my weekly review on 21 Nov.
Do you let an AI review your trading, or does it just agree with you? 👇
Not financial advice. Paper trades, real Binance fees.
#TradingBots #AITrading #algoTrading $BTC #crypto #BTC
65
·
--
Ver traducción
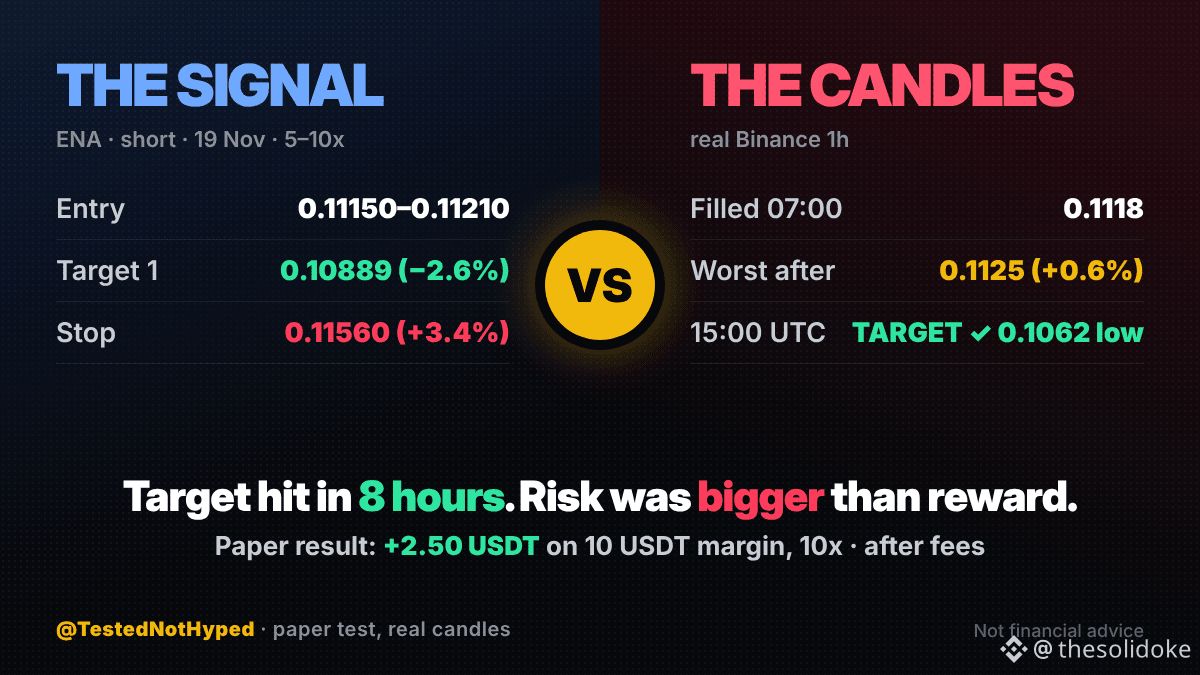
Paper test of an ENA short signal from Square: +2.50 USDT on 10 USDT margin. Target hit in 8 hours.
The levels as posted (19 Nov, about 06:50 UTC): entry 0.11150–0.11210, target 1 at 0.10889, stop 0.11560, "Lev: 5x - 10x". I used 10x and added it to my tracker before the result.
What the real 1h candles did: filled at 0.1118 in the 07:00 UTC hour. The worst it went against the short was 0.1125, about 0.6%. At 15:00 one candle dropped to 0.1062 and hit the target.
The win is real. My screen flagged it anyway: the stop was 3.4% away, the target 2.6%. A setup like that has to win about 57% of the time just to break even, before fees.
My tracker so far: 16 closed signals added before the result, 8 wins, net +3.23 USDT.
Would you take a trade where the stop is further away than the target? 👇
Not financial advice. Paper results, real Binance prices.
#TradingSignals #TradingBots #crypto #cryptotrading #Write2Earn $BTC
Paper test of an ENA short signal from Square: +2.50 USDT on 10 USDT margin. Target hit in 8 hours.
The levels as posted (19 Nov, about 06:50 UTC): entry 0.11150–0.11210, target 1 at 0.10889, stop 0.11560, "Lev: 5x - 10x". I used 10x and added it to my tracker before the result.
What the real 1h candles did: filled at 0.1118 in the 07:00 UTC hour. The worst it went against the short was 0.1125, about 0.6%. At 15:00 one candle dropped to 0.1062 and hit the target.
The win is real. My screen flagged it anyway: the stop was 3.4% away, the target 2.6%. A setup like that has to win about 57% of the time just to break even, before fees.
My tracker so far: 16 closed signals added before the result, 8 wins, net +3.23 USDT.
Would you take a trade where the stop is further away than the target? 👇
Not financial advice. Paper results, real Binance prices.
#TradingSignals #TradingBots #crypto #cryptotrading #Write2Earn $BTC
The levels as posted (19 Nov, about 06:50 UTC): entry 0.11150–0.11210, target 1 at 0.10889, stop 0.11560, "Lev: 5x - 10x". I used 10x and added it to my tracker before the result.
What the real 1h candles did: filled at 0.1118 in the 07:00 UTC hour. The worst it went against the short was 0.1125, about 0.6%. At 15:00 one candle dropped to 0.1062 and hit the target.
The win is real. My screen flagged it anyway: the stop was 3.4% away, the target 2.6%. A setup like that has to win about 57% of the time just to break even, before fees.
My tracker so far: 16 closed signals added before the result, 8 wins, net +3.23 USDT.
Would you take a trade where the stop is further away than the target? 👇
Not financial advice. Paper results, real Binance prices.
#TradingSignals #TradingBots #crypto #cryptotrading #Write2Earn $BTC
439
·
--
Ver traducción
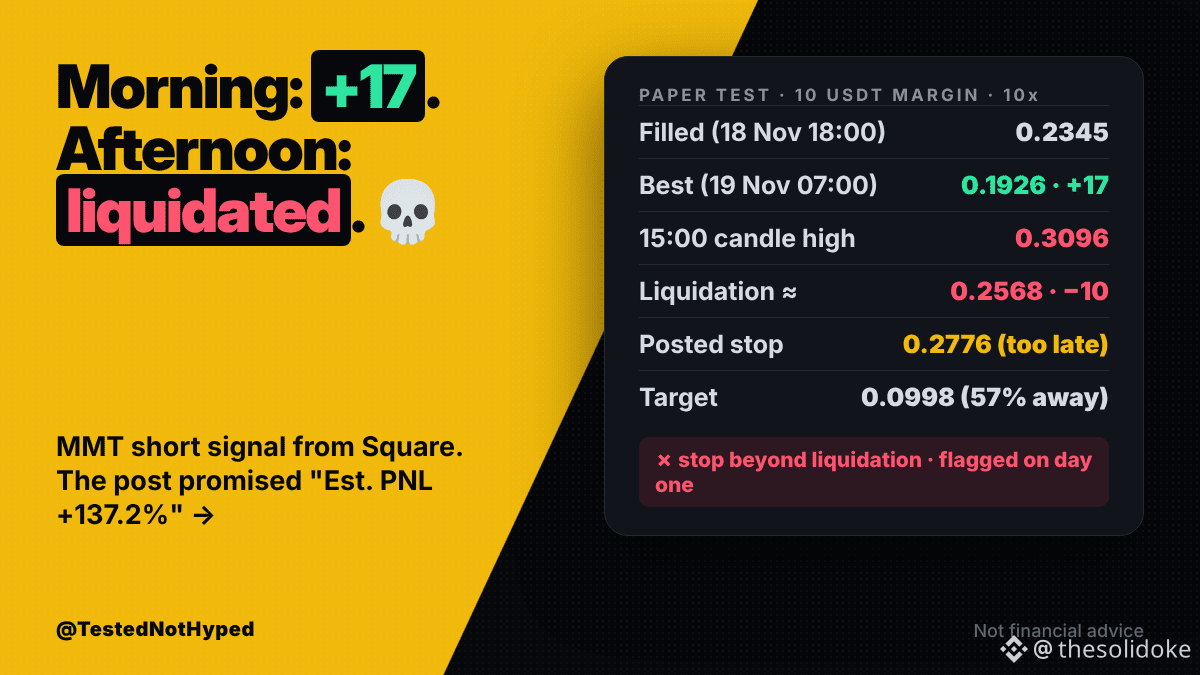
Paper test of an MMT short signal from Square: −10.00 USDT on 10 USDT margin. Liquidated. This morning it was +17.
The levels as posted (18 Nov, about 17:14 UTC): entry 0.2345–0.2422, target 0.0998, stop "a 4H close above 0.2776". The post showed "Est. PNL +137.2%". No leverage stated, so I used 10x. I added it to my tracker before the result.
What the real 1h candles did: filled at 0.2345 in the 18:00 UTC hour. By 07:00 today MMT was down to 0.1926, almost 18% in the short's favour: about +17 USDT on paper. No target was near, so nothing got booked.
Then it turned. At 15:00 one candle ran from 0.2206 to 0.3096. At 10x, liquidation sat near 0.2568. Gone.
My screen had flagged this one on day one: the stop (0.2776) was beyond the liquidation price, so it could never fire first. And a target 57% away is a hope, not a plan.
Would you have taken profit at +17, or held for the +137%? 👇
Not financial advice. Paper results, real Binance prices.
#TradingSignals #TradingBots #crypto #cryptotrading #Write2Earn $BTC
Paper test of an MMT short signal from Square: −10.00 USDT on 10 USDT margin. Liquidated. This morning it was +17.
The levels as posted (18 Nov, about 17:14 UTC): entry 0.2345–0.2422, target 0.0998, stop "a 4H close above 0.2776". The post showed "Est. PNL +137.2%". No leverage stated, so I used 10x. I added it to my tracker before the result.
What the real 1h candles did: filled at 0.2345 in the 18:00 UTC hour. By 07:00 today MMT was down to 0.1926, almost 18% in the short's favour: about +17 USDT on paper. No target was near, so nothing got booked.
Then it turned. At 15:00 one candle ran from 0.2206 to 0.3096. At 10x, liquidation sat near 0.2568. Gone.
My screen had flagged this one on day one: the stop (0.2776) was beyond the liquidation price, so it could never fire first. And a target 57% away is a hope, not a plan.
Would you have taken profit at +17, or held for the +137%? 👇
Not financial advice. Paper results, real Binance prices.
#TradingSignals #TradingBots #crypto #cryptotrading #Write2Earn $BTC
The levels as posted (18 Nov, about 17:14 UTC): entry 0.2345–0.2422, target 0.0998, stop "a 4H close above 0.2776". The post showed "Est. PNL +137.2%". No leverage stated, so I used 10x. I added it to my tracker before the result.
What the real 1h candles did: filled at 0.2345 in the 18:00 UTC hour. By 07:00 today MMT was down to 0.1926, almost 18% in the short's favour: about +17 USDT on paper. No target was near, so nothing got booked.
Then it turned. At 15:00 one candle ran from 0.2206 to 0.3096. At 10x, liquidation sat near 0.2568. Gone.
My screen had flagged this one on day one: the stop (0.2776) was beyond the liquidation price, so it could never fire first. And a target 57% away is a hope, not a plan.
Would you have taken profit at +17, or held for the +137%? 👇
Not financial advice. Paper results, real Binance prices.
#TradingSignals #TradingBots #crypto #cryptotrading #Write2Earn $BTC
67
·
--
Ver traducción
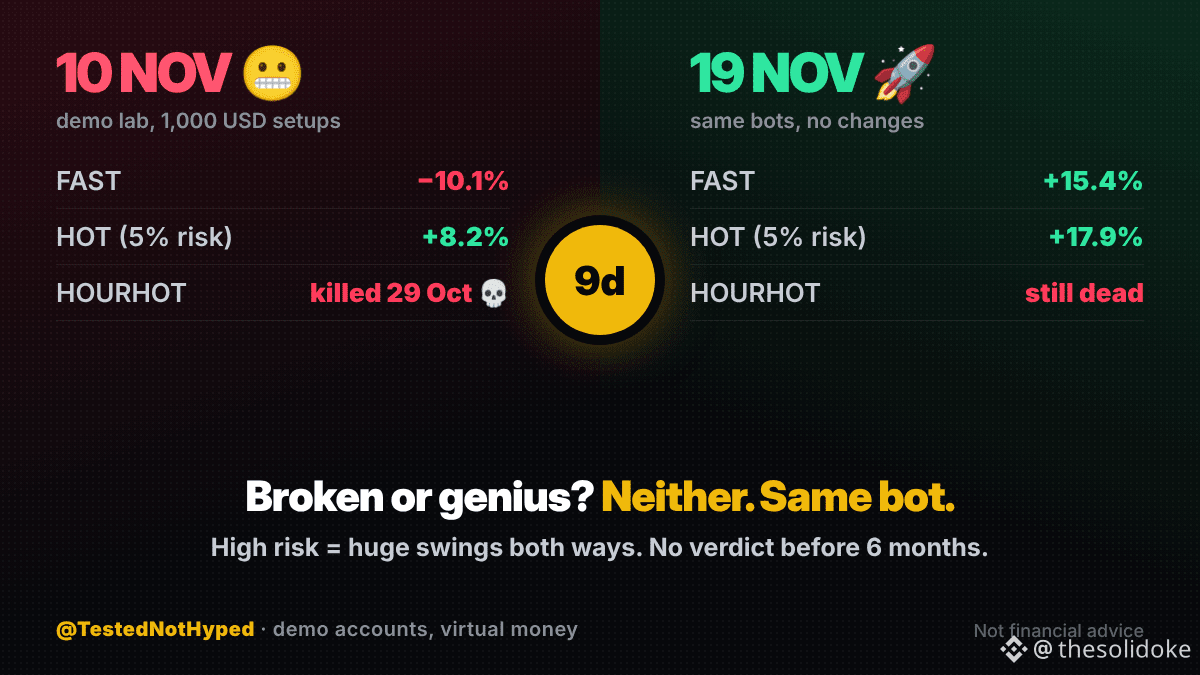
One of my demo bots went from −10.1% to +15.4% in 9 days. Same rules, no changes.
It's in my FxPro demo lab: 10 setups, each on a 1,000 USD demo account, some of them deliberately aggressive, to see what breaks.
10 Nov vs today:
• FAST: −10.1% → +15.4%
• HOT (5% risk per trade): +8.2% → +17.9%
• HOURHOT (hourly, high risk): killed by its kill switch on 29 Oct
High risk makes the swings huge both ways. 9 days ago FAST looked broken. Today it looks like a genius. It's neither. It's the same bot.
That's why nothing in this lab gets a verdict before 6 months, and nothing moves to real money because of a good week.
Which number would you have believed: the −10% or the +15%? 👇
Not financial advice. Demo accounts, virtual money.
#TradingBots #algoTrading #bitcoin $BTC #crypto #BTC
One of my demo bots went from −10.1% to +15.4% in 9 days. Same rules, no changes.
It's in my FxPro demo lab: 10 setups, each on a 1,000 USD demo account, some of them deliberately aggressive, to see what breaks.
10 Nov vs today:
• FAST: −10.1% → +15.4%
• HOT (5% risk per trade): +8.2% → +17.9%
• HOURHOT (hourly, high risk): killed by its kill switch on 29 Oct
High risk makes the swings huge both ways. 9 days ago FAST looked broken. Today it looks like a genius. It's neither. It's the same bot.
That's why nothing in this lab gets a verdict before 6 months, and nothing moves to real money because of a good week.
Which number would you have believed: the −10% or the +15%? 👇
Not financial advice. Demo accounts, virtual money.
#TradingBots #algoTrading #bitcoin $BTC #crypto #BTC
It's in my FxPro demo lab: 10 setups, each on a 1,000 USD demo account, some of them deliberately aggressive, to see what breaks.
10 Nov vs today:
• FAST: −10.1% → +15.4%
• HOT (5% risk per trade): +8.2% → +17.9%
• HOURHOT (hourly, high risk): killed by its kill switch on 29 Oct
High risk makes the swings huge both ways. 9 days ago FAST looked broken. Today it looks like a genius. It's neither. It's the same bot.
That's why nothing in this lab gets a verdict before 6 months, and nothing moves to real money because of a good week.
Which number would you have believed: the −10% or the +15%? 👇
Not financial advice. Demo accounts, virtual money.
#TradingBots #algoTrading #bitcoin $BTC #crypto #BTC
80
·
--
Ver traducción
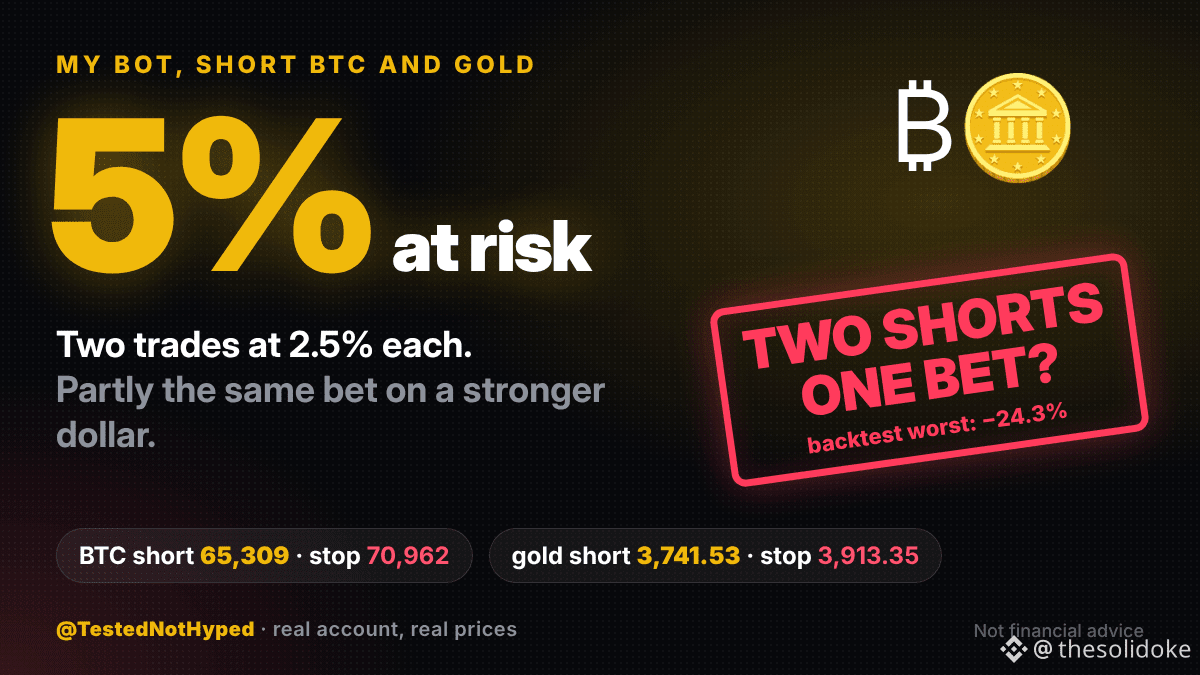
My markets bot is now short Bitcoin and gold at the same time. That's 5% of the account at risk, not 2.5%.
The bot trades daily trends on Exness. Each trade risks 2.5% of the account at its own stop:
• BTC short at 65,309 since 15 Nov, stop 70,962
• new gold short at 3,741.53, opened last night, stop 3,913.35
My AI reviewer flagged it this morning: the two are partly the same bet on a stronger dollar. If that bet goes wrong, both stops can hit together.
Is that a problem? I checked the backtest, which already has stretches with several trend trades open at once:
• worst drawdown: −24.3%
• 1-year Monte Carlo, bad case (5th percentile): −7%
So no change. It's within the design. But I now look at total open risk, not just risk per trade.
Do you check how connected your open trades are? 👇
Not financial advice. Real account, real prices.
#TradingBots #algoTrading #bitcoin $BTC #GOLD #BTC
My markets bot is now short Bitcoin and gold at the same time. That's 5% of the account at risk, not 2.5%.
The bot trades daily trends on Exness. Each trade risks 2.5% of the account at its own stop:
• BTC short at 65,309 since 15 Nov, stop 70,962
• new gold short at 3,741.53, opened last night, stop 3,913.35
My AI reviewer flagged it this morning: the two are partly the same bet on a stronger dollar. If that bet goes wrong, both stops can hit together.
Is that a problem? I checked the backtest, which already has stretches with several trend trades open at once:
• worst drawdown: −24.3%
• 1-year Monte Carlo, bad case (5th percentile): −7%
So no change. It's within the design. But I now look at total open risk, not just risk per trade.
Do you check how connected your open trades are? 👇
Not financial advice. Real account, real prices.
#TradingBots #algoTrading #bitcoin $BTC #GOLD #BTC
The bot trades daily trends on Exness. Each trade risks 2.5% of the account at its own stop:
• BTC short at 65,309 since 15 Nov, stop 70,962
• new gold short at 3,741.53, opened last night, stop 3,913.35
My AI reviewer flagged it this morning: the two are partly the same bet on a stronger dollar. If that bet goes wrong, both stops can hit together.
Is that a problem? I checked the backtest, which already has stretches with several trend trades open at once:
• worst drawdown: −24.3%
• 1-year Monte Carlo, bad case (5th percentile): −7%
So no change. It's within the design. But I now look at total open risk, not just risk per trade.
Do you check how connected your open trades are? 👇
Not financial advice. Real account, real prices.
#TradingBots #algoTrading #bitcoin $BTC #GOLD #BTC
166
Inicia sesión para explorar más contenidos
Únete a usuarios de criptomonedas de todo el mundo en Binance Square
⚡️ Obtén la información más reciente y útil sobre criptomonedas.
💬 Confía en el mayor exchange de criptomonedas del mundo.
👍 Descubre opiniones reales de creadores verificados.
Correo electrónico/número de teléfono
Temas en tendencia
NvidiaLoses$2.7TrillionInMonthAndAHalf
10,003 visualizaciones
89 participa(n) en el debate
El desplome de 2,7 billones de dólares de Nvidia: cuando la narrativa se impone a las cifras 📉
Crypto With Faisal
·5 «Me gusta»
·3.8k visualizaciones
CanBTCReboundAfterFallingBelow60K?
647,612 visualizaciones
2,762 participa(n) en el debate
GlobalStocksFaceLongestLosingStreakSince2023
233,981 visualizaciones
1,882 participa(n) en el debate