
minamium
11.2k Publicaciones

minamium
Denunciar
Bloquear usuario
1 Siguiendo
99 Seguidores
373 Me gusta
Publicaciones
·
--
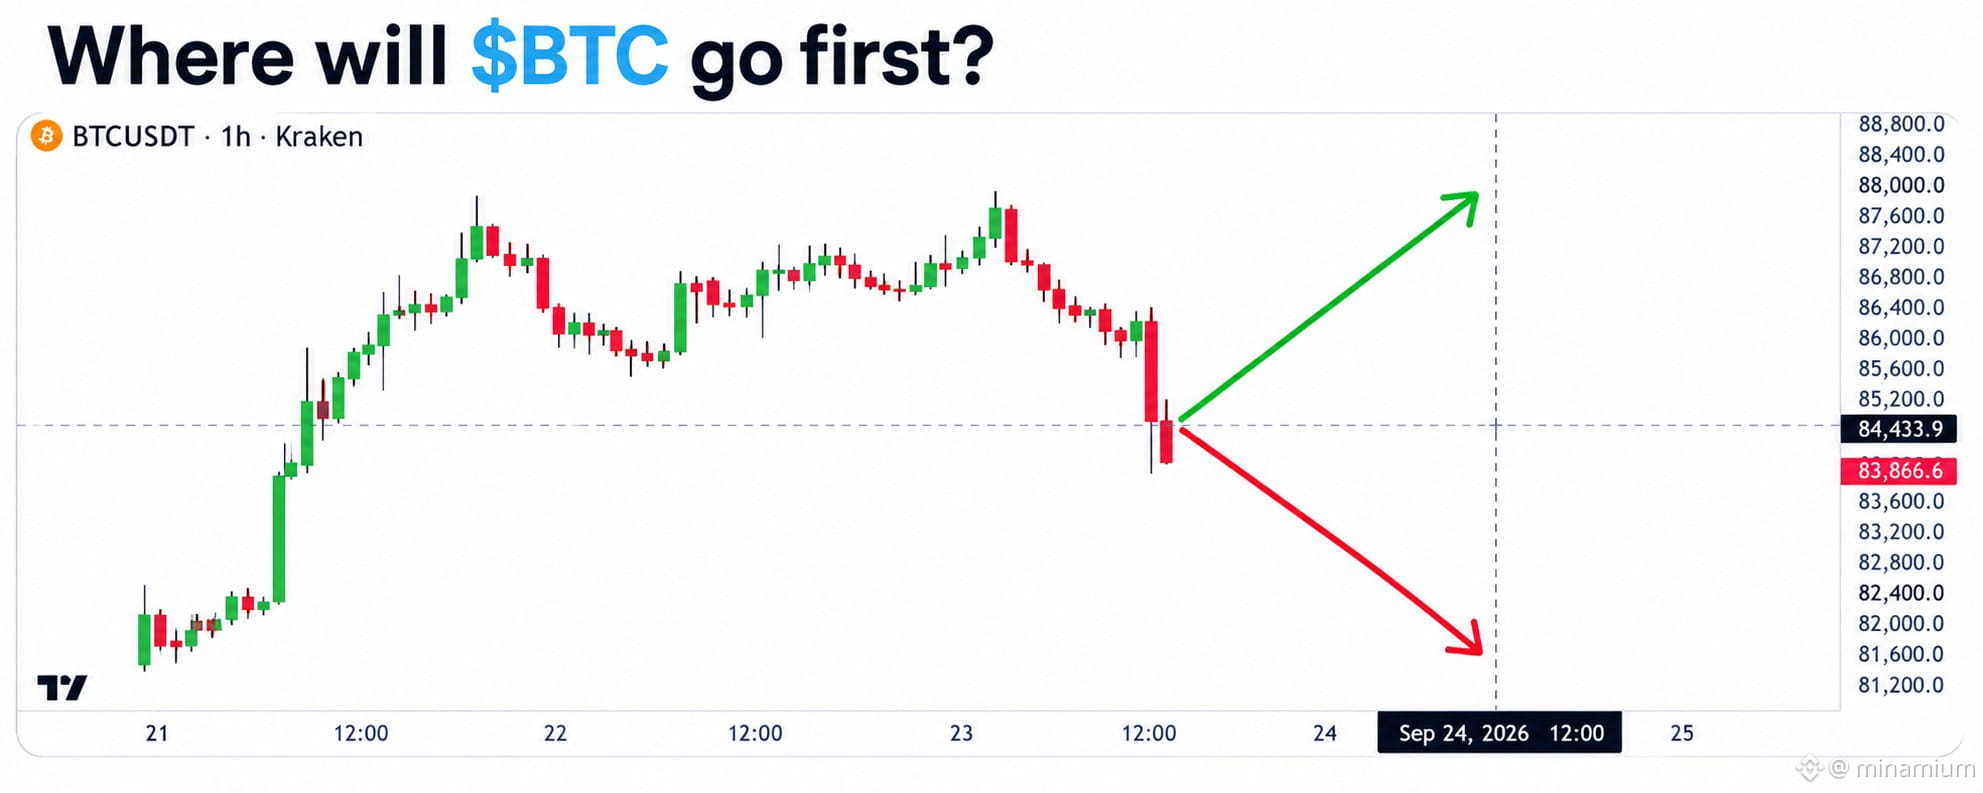
Todo el mundo piensa que los repuntes repentinos del mercado están impulsados por una enorme demanda de nuevos compradores, pero en realidad los movimientos más intensos suelen estar alimentados por vendedores atrapados que corren para salir.
La mayoría de los traders minoristas ve una vela verde rápida, entra cerca de la parte alta por FOMO y termina sosteniendo la bolsa cuando el impulso se frena de repente. Duele aceptar que compraste una liquidación forzada en lugar de una acumulación orgánica.
Piensa en un short squeeze como un teatro abarrotado donde, de repente, todos están obligados a comprar un boleto caro en la puerta solo para salir. Cuando $BTC superó el nivel de $82K, el movimiento no se aceleró porque llegaran inversores frescos. Explosiona porque posiciones cortas sobreapalancadas alcanzan sus gatillos de liquidación, creando una cascada de órdenes de compra obligatorias que empujan los precios hacia arriba en cada tick.
Esta reacción en cadena se propaga rápidamente por las principales bolsas, como $ETH cuando los algoritmos automatizados de liquidez reaccionan al desequilibrio repentino. Cuando ese volumen de compra forzada finalmente se agota, el impulso artificial desaparece, a menudo dejando a los compradores tardíos varados en máximos locales.
¿Estás esperando un retest limpio después de este avance más allá de $82K, o crees que el impulso continuará sin un retroceso?
#Bitcoin #CryptoTrading #Binance
Todo el mundo piensa que los repuntes repentinos del mercado están impulsados por una enorme demanda de nuevos compradores, pero en realidad los movimientos más intensos suelen estar alimentados por vendedores atrapados que corren para salir.
La mayoría de los traders minoristas ve una vela verde rápida, entra cerca de la parte alta por FOMO y termina sosteniendo la bolsa cuando el impulso se frena de repente. Duele aceptar que compraste una liquidación forzada en lugar de una acumulación orgánica.
Piensa en un short squeeze como un teatro abarrotado donde, de repente, todos están obligados a comprar un boleto caro en la puerta solo para salir. Cuando $BTC superó el nivel de $82K, el movimiento no se aceleró porque llegaran inversores frescos. Explosiona porque posiciones cortas sobreapalancadas alcanzan sus gatillos de liquidación, creando una cascada de órdenes de compra obligatorias que empujan los precios hacia arriba en cada tick.
Esta reacción en cadena se propaga rápidamente por las principales bolsas, como $ETH cuando los algoritmos automatizados de liquidez reaccionan al desequilibrio repentino. Cuando ese volumen de compra forzada finalmente se agota, el impulso artificial desaparece, a menudo dejando a los compradores tardíos varados en máximos locales.
¿Estás esperando un retest limpio después de este avance más allá de $82K, o crees que el impulso continuará sin un retroceso?
#Bitcoin #CryptoTrading #Binance
La mayoría de los traders minoristas ve una vela verde rápida, entra cerca de la parte alta por FOMO y termina sosteniendo la bolsa cuando el impulso se frena de repente. Duele aceptar que compraste una liquidación forzada en lugar de una acumulación orgánica.
Piensa en un short squeeze como un teatro abarrotado donde, de repente, todos están obligados a comprar un boleto caro en la puerta solo para salir. Cuando $BTC superó el nivel de $82K, el movimiento no se aceleró porque llegaran inversores frescos. Explosiona porque posiciones cortas sobreapalancadas alcanzan sus gatillos de liquidación, creando una cascada de órdenes de compra obligatorias que empujan los precios hacia arriba en cada tick.
Esta reacción en cadena se propaga rápidamente por las principales bolsas, como $ETH cuando los algoritmos automatizados de liquidez reaccionan al desequilibrio repentino. Cuando ese volumen de compra forzada finalmente se agota, el impulso artificial desaparece, a menudo dejando a los compradores tardíos varados en máximos locales.
¿Estás esperando un retest limpio después de este avance más allá de $82K, o crees que el impulso continuará sin un retroceso?
#Bitcoin #CryptoTrading #Binance
23
·
--
¿Te has dado cuenta de cómo la mayoría de los traders se apresuran a comprar la ruptura en $87K justo después de vender en pánico el mínimo del swing en $75.5K?
Es un ciclo agotador que constantemente deja a los traders minoristas cargando con la bolsa en máximos locales. Si estás cansado de que te despedacen con los impulsos del corto plazo, necesitas cambiar la forma en que operas estos movimientos violentos.
Todos están celebrando $BTC rompiendo más allá de $86K hoy, pero perseguir las velas verdes después de un movimiento de once mil dólares es una trampa clásica. La verdadera ventaja se construyó comprando el pánico en $75.5K la semana pasada. Cuando el sentimiento cambia de forma tan agresiva de miedo a codicia, entrar en resistencia normalmente termina atrapándote en un retroceso repentino.
En vez de comprar por FOMO ahora mismo, tu mejor jugada es la paciencia. Deja que $BTC establezca un mínimo más alto limpio en el gráfico diario, o busca capital para rotar hacia líderes como $ETH que se han quedado rezagados. Si fuiste lo suficientemente inteligente como para comprar la caída la semana pasada, reduce posiciones a corto plazo y espera a que el mercado ofrezca una reentrada con mejor relación riesgo-recompensa.
¿Estás tomando ganancias en estos niveles o esperando un retroceso?
#Bitcoin #CryptoTrading #MarketStrategy
¿Te has dado cuenta de cómo la mayoría de los traders se apresuran a comprar la ruptura en $87K justo después de vender en pánico el mínimo del swing en $75.5K?
Es un ciclo agotador que constantemente deja a los traders minoristas cargando con la bolsa en máximos locales. Si estás cansado de que te despedacen con los impulsos del corto plazo, necesitas cambiar la forma en que operas estos movimientos violentos.
Todos están celebrando $BTC rompiendo más allá de $86K hoy, pero perseguir las velas verdes después de un movimiento de once mil dólares es una trampa clásica. La verdadera ventaja se construyó comprando el pánico en $75.5K la semana pasada. Cuando el sentimiento cambia de forma tan agresiva de miedo a codicia, entrar en resistencia normalmente termina atrapándote en un retroceso repentino.
En vez de comprar por FOMO ahora mismo, tu mejor jugada es la paciencia. Deja que $BTC establezca un mínimo más alto limpio en el gráfico diario, o busca capital para rotar hacia líderes como $ETH que se han quedado rezagados. Si fuiste lo suficientemente inteligente como para comprar la caída la semana pasada, reduce posiciones a corto plazo y espera a que el mercado ofrezca una reentrada con mejor relación riesgo-recompensa.
¿Estás tomando ganancias en estos niveles o esperando un retroceso?
#Bitcoin #CryptoTrading #MarketStrategy
Es un ciclo agotador que constantemente deja a los traders minoristas cargando con la bolsa en máximos locales. Si estás cansado de que te despedacen con los impulsos del corto plazo, necesitas cambiar la forma en que operas estos movimientos violentos.
Todos están celebrando $BTC rompiendo más allá de $86K hoy, pero perseguir las velas verdes después de un movimiento de once mil dólares es una trampa clásica. La verdadera ventaja se construyó comprando el pánico en $75.5K la semana pasada. Cuando el sentimiento cambia de forma tan agresiva de miedo a codicia, entrar en resistencia normalmente termina atrapándote en un retroceso repentino.
En vez de comprar por FOMO ahora mismo, tu mejor jugada es la paciencia. Deja que $BTC establezca un mínimo más alto limpio en el gráfico diario, o busca capital para rotar hacia líderes como $ETH que se han quedado rezagados. Si fuiste lo suficientemente inteligente como para comprar la caída la semana pasada, reduce posiciones a corto plazo y espera a que el mercado ofrezca una reentrada con mejor relación riesgo-recompensa.
¿Estás tomando ganancias en estos niveles o esperando un retroceso?
#Bitcoin #CryptoTrading #MarketStrategy

15
·
--
Esto es lo que pasó cuando $BTC recuperó el mínimo de la semana pasada de $75.5K, superó $82K y marcó brevemente $87K.
La mayoría de las personas que se perdieron el rebote ahora están persiguiendo la fortaleza, mientras que cualquiera que se hubiera puesto corto en $82K simplemente fue arrollado. Ese es el bucle exacto en el que los traders pierden dinero por ambos lados de la misma vela.
El movimiento se aceleró en cuanto $BTC superó los $82K. Los cortos apalancados se vieron obligados a cubrir, y esa compra empujó el precio hasta $86K con casi ninguna pausa.
Los ETF spot de Bitcoin en EE. UU. captaron alrededor de $999M el lunes, la mayor entrada diaria desde $1.21B el 6 de octubre de 2025, después de otros $433M el viernes. $BTC también cerró por encima de su media móvil de 50 semanas.
Lo que la mayoría no vio es lo mecánico que fue. Un squeeze corto no es lo mismo que una demanda sostenida. Esos flujos de ETF pueden volverse negativos en una sola sesión, y un cierre semanal de la MA ha fallado como soporte antes. Cuando $BTC aprieta tan fuerte, el dinero tardío que rota hacia $ETH a menudo llega justo cuando se acaba el combustible para la cobertura.
¿Dónde crees que esto va una vez que termine el squeeze?
#Bitcoin #BTC #Crypto
Esto es lo que pasó cuando $BTC recuperó el mínimo de la semana pasada de $75.5K, superó $82K y marcó brevemente $87K.
La mayoría de las personas que se perdieron el rebote ahora están persiguiendo la fortaleza, mientras que cualquiera que se hubiera puesto corto en $82K simplemente fue arrollado. Ese es el bucle exacto en el que los traders pierden dinero por ambos lados de la misma vela.
El movimiento se aceleró en cuanto $BTC superó los $82K. Los cortos apalancados se vieron obligados a cubrir, y esa compra empujó el precio hasta $86K con casi ninguna pausa.
Los ETF spot de Bitcoin en EE. UU. captaron alrededor de $999M el lunes, la mayor entrada diaria desde $1.21B el 6 de octubre de 2025, después de otros $433M el viernes. $BTC también cerró por encima de su media móvil de 50 semanas.
Lo que la mayoría no vio es lo mecánico que fue. Un squeeze corto no es lo mismo que una demanda sostenida. Esos flujos de ETF pueden volverse negativos en una sola sesión, y un cierre semanal de la MA ha fallado como soporte antes. Cuando $BTC aprieta tan fuerte, el dinero tardío que rota hacia $ETH a menudo llega justo cuando se acaba el combustible para la cobertura.
¿Dónde crees que esto va una vez que termine el squeeze?
#Bitcoin #BTC #Crypto
La mayoría de las personas que se perdieron el rebote ahora están persiguiendo la fortaleza, mientras que cualquiera que se hubiera puesto corto en $82K simplemente fue arrollado. Ese es el bucle exacto en el que los traders pierden dinero por ambos lados de la misma vela.
El movimiento se aceleró en cuanto $BTC superó los $82K. Los cortos apalancados se vieron obligados a cubrir, y esa compra empujó el precio hasta $86K con casi ninguna pausa.
Los ETF spot de Bitcoin en EE. UU. captaron alrededor de $999M el lunes, la mayor entrada diaria desde $1.21B el 6 de octubre de 2025, después de otros $433M el viernes. $BTC también cerró por encima de su media móvil de 50 semanas.
Lo que la mayoría no vio es lo mecánico que fue. Un squeeze corto no es lo mismo que una demanda sostenida. Esos flujos de ETF pueden volverse negativos en una sola sesión, y un cierre semanal de la MA ha fallado como soporte antes. Cuando $BTC aprieta tan fuerte, el dinero tardío que rota hacia $ETH a menudo llega justo cuando se acaba el combustible para la cobertura.
¿Dónde crees que esto va una vez que termine el squeeze?
#Bitcoin #BTC #Crypto
14
·
--
Todo el mundo piensa que este breakout significa que el modo fácil volvió, pero en realidad perseguir velas verdes es como la mayoría de los degen se borra.
Todos conocemos la rutina. Tú te quedas quieto con las manos mientras $BTC bottoms en 75.5k, y luego entras en pánico y apes justo contra la resistencia local porque los números verdes disparan tu FOMO.
Echa un vistazo a lo que realmente impulsó esta subida hasta 87k. El squeeze se activó de verdad cuando superamos 82k, obligando a los shorts apalancados a comprar en el mercado para salir de su posición, mientras los ETF spot absorbían casi 999m solo el lunes. Eso ocurre justo después de que el viernes entraran 433m, convirtiéndolo en la mayor entrada neta de un solo día desde el récord de 1.21b de octubre de 2025. Además, cerrar por encima de la media móvil de 50 semanas le dio a los gráficos macro un respiro sólido de aire fresco.
Pero siendo realistas, entradas de liquidez institucional como esta normalmente destruyen tarde a los longers minoristas que buscan continuación inmediata. Cuando los flujos spot se enfrían incluso un poco, el alto apalancamiento se liquida rápido.
¿Estás pujando por el retroceso o crees que $ETH y el resto del mercado se hará cargo de aquí en adelante?
#Bitcoin #CryptoTrading #BinanceSquare
Todo el mundo piensa que este breakout significa que el modo fácil volvió, pero en realidad perseguir velas verdes es como la mayoría de los degen se borra.
Todos conocemos la rutina. Tú te quedas quieto con las manos mientras $BTC bottoms en 75.5k, y luego entras en pánico y apes justo contra la resistencia local porque los números verdes disparan tu FOMO.
Echa un vistazo a lo que realmente impulsó esta subida hasta 87k. El squeeze se activó de verdad cuando superamos 82k, obligando a los shorts apalancados a comprar en el mercado para salir de su posición, mientras los ETF spot absorbían casi 999m solo el lunes. Eso ocurre justo después de que el viernes entraran 433m, convirtiéndolo en la mayor entrada neta de un solo día desde el récord de 1.21b de octubre de 2025. Además, cerrar por encima de la media móvil de 50 semanas le dio a los gráficos macro un respiro sólido de aire fresco.
Pero siendo realistas, entradas de liquidez institucional como esta normalmente destruyen tarde a los longers minoristas que buscan continuación inmediata. Cuando los flujos spot se enfrían incluso un poco, el alto apalancamiento se liquida rápido.
¿Estás pujando por el retroceso o crees que $ETH y el resto del mercado se hará cargo de aquí en adelante?
#Bitcoin #CryptoTrading #BinanceSquare
Todos conocemos la rutina. Tú te quedas quieto con las manos mientras $BTC bottoms en 75.5k, y luego entras en pánico y apes justo contra la resistencia local porque los números verdes disparan tu FOMO.
Echa un vistazo a lo que realmente impulsó esta subida hasta 87k. El squeeze se activó de verdad cuando superamos 82k, obligando a los shorts apalancados a comprar en el mercado para salir de su posición, mientras los ETF spot absorbían casi 999m solo el lunes. Eso ocurre justo después de que el viernes entraran 433m, convirtiéndolo en la mayor entrada neta de un solo día desde el récord de 1.21b de octubre de 2025. Además, cerrar por encima de la media móvil de 50 semanas le dio a los gráficos macro un respiro sólido de aire fresco.
Pero siendo realistas, entradas de liquidez institucional como esta normalmente destruyen tarde a los longers minoristas que buscan continuación inmediata. Cuando los flujos spot se enfrían incluso un poco, el alto apalancamiento se liquida rápido.
¿Estás pujando por el retroceso o crees que $ETH y el resto del mercado se hará cargo de aquí en adelante?
#Bitcoin #CryptoTrading #BinanceSquare

41
·
--
¿Has notado cómo el sector minorista siempre se enfoca en el precio del titular mientras ignora por completo la mecánica real que impulsa el movimiento?
La mayoría de los traders siguen recibiendo cortes intentando anticipar máximos locales, vendiendo en pánico cerca de los mínimos solo para perseguir velas verdes justo hasta la resistencia. Es la forma más fácil de sangrar capital mientras el dinero inteligente prepara en silencio la siguiente etapa.
Toma el último $BTC run como un caso de estudio ideal. El precio no rebotó simplemente de forma casual desde el mínimo de 75,5K de la semana pasada para tocar 87K por una emoción aleatoria. La aceleración de verdad comenzó cuando superamos los 82K, lo que desencadenó una cascada de compras forzadas para cubrir cortos, proporcionando el combustible inmediato para empujar más allá de 86K.
Detrás de la acción del precio, la absorción institucional cuenta una historia aún más grande. Los ETFs de Bitcoin al contado atrajeron 433M en entradas netas el viernes antes de sumar 999M el lunes, el mayor volumen de entrada en un solo día desde octubre. Cuando combinas ese nivel de demanda sostenida en el contado con un cierre semanal por encima de la media móvil de 50 semanas, tratar esto como si fuera solo otro apretón temporal no capta la imagen completa.
¿Hacia dónde crees que va este impulso desde aquí?
#Bitcoin #BTC #Crypto
¿Has notado cómo el sector minorista siempre se enfoca en el precio del titular mientras ignora por completo la mecánica real que impulsa el movimiento?
La mayoría de los traders siguen recibiendo cortes intentando anticipar máximos locales, vendiendo en pánico cerca de los mínimos solo para perseguir velas verdes justo hasta la resistencia. Es la forma más fácil de sangrar capital mientras el dinero inteligente prepara en silencio la siguiente etapa.
Toma el último $BTC run como un caso de estudio ideal. El precio no rebotó simplemente de forma casual desde el mínimo de 75,5K de la semana pasada para tocar 87K por una emoción aleatoria. La aceleración de verdad comenzó cuando superamos los 82K, lo que desencadenó una cascada de compras forzadas para cubrir cortos, proporcionando el combustible inmediato para empujar más allá de 86K.
Detrás de la acción del precio, la absorción institucional cuenta una historia aún más grande. Los ETFs de Bitcoin al contado atrajeron 433M en entradas netas el viernes antes de sumar 999M el lunes, el mayor volumen de entrada en un solo día desde octubre. Cuando combinas ese nivel de demanda sostenida en el contado con un cierre semanal por encima de la media móvil de 50 semanas, tratar esto como si fuera solo otro apretón temporal no capta la imagen completa.
¿Hacia dónde crees que va este impulso desde aquí?
#Bitcoin #BTC #Crypto
La mayoría de los traders siguen recibiendo cortes intentando anticipar máximos locales, vendiendo en pánico cerca de los mínimos solo para perseguir velas verdes justo hasta la resistencia. Es la forma más fácil de sangrar capital mientras el dinero inteligente prepara en silencio la siguiente etapa.
Toma el último $BTC run como un caso de estudio ideal. El precio no rebotó simplemente de forma casual desde el mínimo de 75,5K de la semana pasada para tocar 87K por una emoción aleatoria. La aceleración de verdad comenzó cuando superamos los 82K, lo que desencadenó una cascada de compras forzadas para cubrir cortos, proporcionando el combustible inmediato para empujar más allá de 86K.
Detrás de la acción del precio, la absorción institucional cuenta una historia aún más grande. Los ETFs de Bitcoin al contado atrajeron 433M en entradas netas el viernes antes de sumar 999M el lunes, el mayor volumen de entrada en un solo día desde octubre. Cuando combinas ese nivel de demanda sostenida en el contado con un cierre semanal por encima de la media móvil de 50 semanas, tratar esto como si fuera solo otro apretón temporal no capta la imagen completa.
¿Hacia dónde crees que va este impulso desde aquí?
#Bitcoin #BTC #Crypto

13
·
--
La mayoría de los traders se enfocan por completo en los gráficos de precios durante las fases de alta codicia, pero en el fondo los cambios reales en la infraestructura ocurren de forma silenciosa, cuando nadie está mirando.
Todos hemos sentido el golpe de perseguir velas verdes en operaciones por impulso como $PEPE solo para descubrir que la liquidez y la adopción en el mundo real se estaban moviendo en otra dirección por completo. Quedarnos atrapados en el ruido especulativo a menudo nos hace pasar por alto la construcción lenta y deliberada que es la que realmente sobrevive a los mercados bajistas.
La reciente integración de Cardano en el kit X402 para $ADA pagos es un ejemplo clásico de utilidad que se expande en silencio detrás de escena. En ciclos anteriores, vimos hitos de infraestructura similares que se ignoraron por completo hasta que el mercado reajustó de golpe su utilidad cotidiana de pagos frente a activos de liquidación estables como $USDT. La adopción real rara vez se anuncia con pumps inmediatos; primero construye las vías y luego asienta el volumen.
¿Te estás posicionando para el hype inmediato ahora mismo, o estás acumulando con base en una infraestructura real de pagos?
#CardanoAddedToX402KitForADAPayments #CryptoMarketCapReclaims
La mayoría de los traders se enfocan por completo en los gráficos de precios durante las fases de alta codicia, pero en el fondo los cambios reales en la infraestructura ocurren de forma silenciosa, cuando nadie está mirando.
Todos hemos sentido el golpe de perseguir velas verdes en operaciones por impulso como $PEPE solo para descubrir que la liquidez y la adopción en el mundo real se estaban moviendo en otra dirección por completo. Quedarnos atrapados en el ruido especulativo a menudo nos hace pasar por alto la construcción lenta y deliberada que es la que realmente sobrevive a los mercados bajistas.
La reciente integración de Cardano en el kit X402 para $ADA pagos es un ejemplo clásico de utilidad que se expande en silencio detrás de escena. En ciclos anteriores, vimos hitos de infraestructura similares que se ignoraron por completo hasta que el mercado reajustó de golpe su utilidad cotidiana de pagos frente a activos de liquidación estables como $USDT. La adopción real rara vez se anuncia con pumps inmediatos; primero construye las vías y luego asienta el volumen.
¿Te estás posicionando para el hype inmediato ahora mismo, o estás acumulando con base en una infraestructura real de pagos?
#CardanoAddedToX402KitForADAPayments #CryptoMarketCapReclaims
Todos hemos sentido el golpe de perseguir velas verdes en operaciones por impulso como $PEPE solo para descubrir que la liquidez y la adopción en el mundo real se estaban moviendo en otra dirección por completo. Quedarnos atrapados en el ruido especulativo a menudo nos hace pasar por alto la construcción lenta y deliberada que es la que realmente sobrevive a los mercados bajistas.
La reciente integración de Cardano en el kit X402 para $ADA pagos es un ejemplo clásico de utilidad que se expande en silencio detrás de escena. En ciclos anteriores, vimos hitos de infraestructura similares que se ignoraron por completo hasta que el mercado reajustó de golpe su utilidad cotidiana de pagos frente a activos de liquidación estables como $USDT. La adopción real rara vez se anuncia con pumps inmediatos; primero construye las vías y luego asienta el volumen.
¿Te estás posicionando para el hype inmediato ahora mismo, o estás acumulando con base en una infraestructura real de pagos?
#CardanoAddedToX402KitForADAPayments #CryptoMarketCapReclaims
71
·
--
¿Has notado que todos siguen mirando titulares de los ETFs de Bitcoin mientras la presión real de compra viene de algún otro lugar?
La mayoría de los traders con los que hablo siguen esperando el próximo informe de entradas para actuar. Así es como se les escapa el movimiento real y terminan persiguiendo una confirmación que ya ocurrió.
$BTC está cotizando a 86,080 dólares, frente a una SMA de 50 semanas de 78,243 dólares. Esta semana aún en formación, que comenzó el 21 de septiembre, necesita cerrar por encima de 78.2k dólares para mantener la tendencia alcista; y hasta ahora, los alcistas están sosteniendo la línea. Lo que destaca es que los ETFs de Bitcoin solo negociaron 4 mil millones de dólares ayer. La mayor parte del volumen provino de actividad en la cadena (on-chain), lo que significa que la convicción está en los tenedores más que en las instituciones que la mayoría de la gente está mirando.
Trata el cierre semanal frente a esa SMA de 50 semanas como tu primer filtro. Luego compara el volumen on-chain con las cifras de los ETFs en lugar de reaccionar a cada titular. Cuando esos flujos de los ETFs finalmente se ponen al día con lo que ya hicieron los compradores on-chain en $BTC, $ETH normalmente empieza a seguir con un retraso.
¿Dónde crees que va esto cuando los ETFs por fin aparezcan?
#Bitcoin #OnChain #Crypto
¿Has notado que todos siguen mirando titulares de los ETFs de Bitcoin mientras la presión real de compra viene de algún otro lugar?
La mayoría de los traders con los que hablo siguen esperando el próximo informe de entradas para actuar. Así es como se les escapa el movimiento real y terminan persiguiendo una confirmación que ya ocurrió.
$BTC está cotizando a 86,080 dólares, frente a una SMA de 50 semanas de 78,243 dólares. Esta semana aún en formación, que comenzó el 21 de septiembre, necesita cerrar por encima de 78.2k dólares para mantener la tendencia alcista; y hasta ahora, los alcistas están sosteniendo la línea. Lo que destaca es que los ETFs de Bitcoin solo negociaron 4 mil millones de dólares ayer. La mayor parte del volumen provino de actividad en la cadena (on-chain), lo que significa que la convicción está en los tenedores más que en las instituciones que la mayoría de la gente está mirando.
Trata el cierre semanal frente a esa SMA de 50 semanas como tu primer filtro. Luego compara el volumen on-chain con las cifras de los ETFs en lugar de reaccionar a cada titular. Cuando esos flujos de los ETFs finalmente se ponen al día con lo que ya hicieron los compradores on-chain en $BTC , $ETH normalmente empieza a seguir con un retraso.
¿Dónde crees que va esto cuando los ETFs por fin aparezcan?
#Bitcoin #OnChain #Crypto
La mayoría de los traders con los que hablo siguen esperando el próximo informe de entradas para actuar. Así es como se les escapa el movimiento real y terminan persiguiendo una confirmación que ya ocurrió.
$BTC está cotizando a 86,080 dólares, frente a una SMA de 50 semanas de 78,243 dólares. Esta semana aún en formación, que comenzó el 21 de septiembre, necesita cerrar por encima de 78.2k dólares para mantener la tendencia alcista; y hasta ahora, los alcistas están sosteniendo la línea. Lo que destaca es que los ETFs de Bitcoin solo negociaron 4 mil millones de dólares ayer. La mayor parte del volumen provino de actividad en la cadena (on-chain), lo que significa que la convicción está en los tenedores más que en las instituciones que la mayoría de la gente está mirando.
Trata el cierre semanal frente a esa SMA de 50 semanas como tu primer filtro. Luego compara el volumen on-chain con las cifras de los ETFs en lugar de reaccionar a cada titular. Cuando esos flujos de los ETFs finalmente se ponen al día con lo que ya hicieron los compradores on-chain en $BTC , $ETH normalmente empieza a seguir con un retraso.
¿Dónde crees que va esto cuando los ETFs por fin aparezcan?
#Bitcoin #OnChain #Crypto
23
·
--
Esto es lo que pasó cuando Strategy añadió 950 Bitcoin la semana pasada, mientras la mayoría de los traders miraba hacia otro lado.
Cada vez que una empresa listada carga $BTC, aparece una molestia conocida. O entras en FOMO después de la noticia y te hacen picadillo, o dudas y sientes que te perdiste el único trade fácil de la semana.
Este es un estudio de caso de una consistencia aburrida. Strategy ha estado comprando desde 2020, convirtiendo una empresa de software en un balance de Bitcoin apalancado. 950 monedas no es su compra más grande, pero es la misma estrategia que ejecutaron en la caída y en el “melt-up”.
Tesla hizo lo contrario. Compró $BTC, acaparó los titulares y luego vendió la mayor parte del lote. Muchas otras firmas anunciaron planes de tesorería en 2021 y nunca volvieron a comprar.
La comparación es convicción versus un momento de marketing. El equipo de Saylor trata a Bitcoin como un activo central, no como un anuncio de una sola vez. La codicia ya está en 78, y $BTC ha estado presionando máximos antiguos, así que esta noticia atraerá dinero tardío. Lo que realmente importa es el patrón: agregan tanto si el índice tiene miedo como si tiene codicia. Las tesorerías corporativas $ETH no han mostrado ese tipo de cadencia.
¿Dónde crees que Strategy lleva esto si el avance constante continúa?
#StrategyAdds950Bitcoin #BitcoinBreaksAboveMayHighNears #CryptoMarketCapReclaims
Esto es lo que pasó cuando Strategy añadió 950 Bitcoin la semana pasada, mientras la mayoría de los traders miraba hacia otro lado.
Cada vez que una empresa listada carga $BTC , aparece una molestia conocida. O entras en FOMO después de la noticia y te hacen picadillo, o dudas y sientes que te perdiste el único trade fácil de la semana.
Este es un estudio de caso de una consistencia aburrida. Strategy ha estado comprando desde 2020, convirtiendo una empresa de software en un balance de Bitcoin apalancado. 950 monedas no es su compra más grande, pero es la misma estrategia que ejecutaron en la caída y en el “melt-up”.
Tesla hizo lo contrario. Compró $BTC , acaparó los titulares y luego vendió la mayor parte del lote. Muchas otras firmas anunciaron planes de tesorería en 2021 y nunca volvieron a comprar.
La comparación es convicción versus un momento de marketing. El equipo de Saylor trata a Bitcoin como un activo central, no como un anuncio de una sola vez. La codicia ya está en 78, y $BTC ha estado presionando máximos antiguos, así que esta noticia atraerá dinero tardío. Lo que realmente importa es el patrón: agregan tanto si el índice tiene miedo como si tiene codicia. Las tesorerías corporativas $ETH no han mostrado ese tipo de cadencia.
¿Dónde crees que Strategy lleva esto si el avance constante continúa?
#StrategyAdds950Bitcoin #BitcoinBreaksAboveMayHighNears #CryptoMarketCapReclaims
Cada vez que una empresa listada carga $BTC , aparece una molestia conocida. O entras en FOMO después de la noticia y te hacen picadillo, o dudas y sientes que te perdiste el único trade fácil de la semana.
Este es un estudio de caso de una consistencia aburrida. Strategy ha estado comprando desde 2020, convirtiendo una empresa de software en un balance de Bitcoin apalancado. 950 monedas no es su compra más grande, pero es la misma estrategia que ejecutaron en la caída y en el “melt-up”.
Tesla hizo lo contrario. Compró $BTC , acaparó los titulares y luego vendió la mayor parte del lote. Muchas otras firmas anunciaron planes de tesorería en 2021 y nunca volvieron a comprar.
La comparación es convicción versus un momento de marketing. El equipo de Saylor trata a Bitcoin como un activo central, no como un anuncio de una sola vez. La codicia ya está en 78, y $BTC ha estado presionando máximos antiguos, así que esta noticia atraerá dinero tardío. Lo que realmente importa es el patrón: agregan tanto si el índice tiene miedo como si tiene codicia. Las tesorerías corporativas $ETH no han mostrado ese tipo de cadencia.
¿Dónde crees que Strategy lleva esto si el avance constante continúa?
#StrategyAdds950Bitcoin #BitcoinBreaksAboveMayHighNears #CryptoMarketCapReclaims

15
·
--
Si todavía te lanzas a la moda del hype de acciones tokenizadas sin entender el modelo subyacente de custodia, detente ahora.
Demasiados traders perdieron capital serio durante el último ciclo persiguiendo acciones sintéticas que no tenían respaldo legal alguno y cuya liquidez se secó de la noche a la mañana. Quedarte con un envoltorio no redimible cuando la volatilidad del mercado golpea es una forma brutal de aprender sobre el riesgo de contraparte.
Volviendo a 2021, las plataformas intentaron ofrecer espejos descentralizados de acciones tecnológicas, y la mayoría colapsó en pueblos fantasmas ilíquidos en cuanto las condiciones del mercado cambiaron. Las plataformas que se preparan para lanzar acciones tokenizadas el próximo trimestre están tomando un enfoque muy distinto al integrarse directamente con custodios regulados y estructuras de reserva institucionales. En lugar de fijaciones algorítmicas de precios, vemos acciones subyacentes reales emparejadas con carriles de liquidez mediante protocolos como $SOLV y liquidadas directamente contra fondos profundos en $USDT.
El verdadero obstáculo no es acuñar acciones onchain, sino si los participantes del mercado obtendrán derechos de redención genuinos o solo otra capa más de derivado especulativo. Si las cámaras de compensación institucionales pueden conectar de forma fluida el trading tradicional de acciones con libros públicos sin un retraso de liquidación de varios días, toda la infraestructura cambia.
¿Crees que las plataformas de acciones tokenizadas finalmente captarán una cuota de mercado real esta vez, o estamos destinados a repetir el ciclo sintético de 2021?
#TokenizedStockPlatformsCouldLaunchNextQuarter #AIStocksWhatNext #CryptoMarketCapReclaims
Si todavía te lanzas a la moda del hype de acciones tokenizadas sin entender el modelo subyacente de custodia, detente ahora.
Demasiados traders perdieron capital serio durante el último ciclo persiguiendo acciones sintéticas que no tenían respaldo legal alguno y cuya liquidez se secó de la noche a la mañana. Quedarte con un envoltorio no redimible cuando la volatilidad del mercado golpea es una forma brutal de aprender sobre el riesgo de contraparte.
Volviendo a 2021, las plataformas intentaron ofrecer espejos descentralizados de acciones tecnológicas, y la mayoría colapsó en pueblos fantasmas ilíquidos en cuanto las condiciones del mercado cambiaron. Las plataformas que se preparan para lanzar acciones tokenizadas el próximo trimestre están tomando un enfoque muy distinto al integrarse directamente con custodios regulados y estructuras de reserva institucionales. En lugar de fijaciones algorítmicas de precios, vemos acciones subyacentes reales emparejadas con carriles de liquidez mediante protocolos como $SOLV y liquidadas directamente contra fondos profundos en $USDT.
El verdadero obstáculo no es acuñar acciones onchain, sino si los participantes del mercado obtendrán derechos de redención genuinos o solo otra capa más de derivado especulativo. Si las cámaras de compensación institucionales pueden conectar de forma fluida el trading tradicional de acciones con libros públicos sin un retraso de liquidación de varios días, toda la infraestructura cambia.
¿Crees que las plataformas de acciones tokenizadas finalmente captarán una cuota de mercado real esta vez, o estamos destinados a repetir el ciclo sintético de 2021?
#TokenizedStockPlatformsCouldLaunchNextQuarter #AIStocksWhatNext #CryptoMarketCapReclaims
Demasiados traders perdieron capital serio durante el último ciclo persiguiendo acciones sintéticas que no tenían respaldo legal alguno y cuya liquidez se secó de la noche a la mañana. Quedarte con un envoltorio no redimible cuando la volatilidad del mercado golpea es una forma brutal de aprender sobre el riesgo de contraparte.
Volviendo a 2021, las plataformas intentaron ofrecer espejos descentralizados de acciones tecnológicas, y la mayoría colapsó en pueblos fantasmas ilíquidos en cuanto las condiciones del mercado cambiaron. Las plataformas que se preparan para lanzar acciones tokenizadas el próximo trimestre están tomando un enfoque muy distinto al integrarse directamente con custodios regulados y estructuras de reserva institucionales. En lugar de fijaciones algorítmicas de precios, vemos acciones subyacentes reales emparejadas con carriles de liquidez mediante protocolos como $SOLV y liquidadas directamente contra fondos profundos en $USDT.
El verdadero obstáculo no es acuñar acciones onchain, sino si los participantes del mercado obtendrán derechos de redención genuinos o solo otra capa más de derivado especulativo. Si las cámaras de compensación institucionales pueden conectar de forma fluida el trading tradicional de acciones con libros públicos sin un retraso de liquidación de varios días, toda la infraestructura cambia.
¿Crees que las plataformas de acciones tokenizadas finalmente captarán una cuota de mercado real esta vez, o estamos destinados a repetir el ciclo sintético de 2021?
#TokenizedStockPlatformsCouldLaunchNextQuarter #AIStocksWhatNext #CryptoMarketCapReclaims

2
·
--
Todo el mundo piensa que que Muse desplace a ChatGPT como la mejor app gratuita de iOS significa que la IA solo cambió a un nuevo nivel y que cada token cripto relacionado está a punto de despegar. Pero en realidad este cambio de ranking es solo ruido superficial que tiene casi nula correlación con la utilidad real en blockchain.
Demasiados de nosotros hemos sentido esa punzada. Ves el titular, sueltas tus $USDT, persigues la narrativa y luego te toca aguantar un goteo lento mientras la tecnología real nunca entrega las ganancias prometidas.
Piensa en los gráficos de la tienda de apps como un patio de comidas abarrotado. Un puesto de pronto tiene la fila más larga porque un video viral se disparó. Eso no significa que los agricultores que cultivan los ingredientes se hayan hecho ricos. El valor sigue viviendo en la cadena de suministro, en las cocinas que realmente cocinan, y en la gente que sigue volviendo cuando se apaga el hype.
Estamos en una lectura de Miedo y Codicia de 78, bien metidos en la codicia. Los traders están tratando esta historia de Muse igual que como lo hicieron con cada $PEPE explosión del año pasado. Una app nueva puede trepar en las listas en una semana afortunada de descargas mientras ChatGPT sigue haciendo el trabajo pesado de fondo. El mismo desajuste ocurre en cripto cada vez que $TRUMP empieza a ser tendencia por razones que no tienen nada que ver con la actividad on-chain.
El movimiento paciente es ignorar los números de descargas y preguntarse qué es lo que realmente liquida, almacena o computa algo que la gente seguirá necesitando el próximo año.
¿Cuál es tu opinión sobre si este momento de Muse cambia algo para el cripto o si es solo otro objeto brillante?
#MuseOvertakesChatGPTAsTopFreeIOSApp #AIStocksWhatNext #CryptoMarketCapReclaims
Todo el mundo piensa que que Muse desplace a ChatGPT como la mejor app gratuita de iOS significa que la IA solo cambió a un nuevo nivel y que cada token cripto relacionado está a punto de despegar. Pero en realidad este cambio de ranking es solo ruido superficial que tiene casi nula correlación con la utilidad real en blockchain.
Demasiados de nosotros hemos sentido esa punzada. Ves el titular, sueltas tus $USDT, persigues la narrativa y luego te toca aguantar un goteo lento mientras la tecnología real nunca entrega las ganancias prometidas.
Piensa en los gráficos de la tienda de apps como un patio de comidas abarrotado. Un puesto de pronto tiene la fila más larga porque un video viral se disparó. Eso no significa que los agricultores que cultivan los ingredientes se hayan hecho ricos. El valor sigue viviendo en la cadena de suministro, en las cocinas que realmente cocinan, y en la gente que sigue volviendo cuando se apaga el hype.
Estamos en una lectura de Miedo y Codicia de 78, bien metidos en la codicia. Los traders están tratando esta historia de Muse igual que como lo hicieron con cada $PEPE explosión del año pasado. Una app nueva puede trepar en las listas en una semana afortunada de descargas mientras ChatGPT sigue haciendo el trabajo pesado de fondo. El mismo desajuste ocurre en cripto cada vez que $TRUMP empieza a ser tendencia por razones que no tienen nada que ver con la actividad on-chain.
El movimiento paciente es ignorar los números de descargas y preguntarse qué es lo que realmente liquida, almacena o computa algo que la gente seguirá necesitando el próximo año.
¿Cuál es tu opinión sobre si este momento de Muse cambia algo para el cripto o si es solo otro objeto brillante?
#MuseOvertakesChatGPTAsTopFreeIOSApp #AIStocksWhatNext #CryptoMarketCapReclaims
Demasiados de nosotros hemos sentido esa punzada. Ves el titular, sueltas tus $USDT, persigues la narrativa y luego te toca aguantar un goteo lento mientras la tecnología real nunca entrega las ganancias prometidas.
Piensa en los gráficos de la tienda de apps como un patio de comidas abarrotado. Un puesto de pronto tiene la fila más larga porque un video viral se disparó. Eso no significa que los agricultores que cultivan los ingredientes se hayan hecho ricos. El valor sigue viviendo en la cadena de suministro, en las cocinas que realmente cocinan, y en la gente que sigue volviendo cuando se apaga el hype.
Estamos en una lectura de Miedo y Codicia de 78, bien metidos en la codicia. Los traders están tratando esta historia de Muse igual que como lo hicieron con cada $PEPE explosión del año pasado. Una app nueva puede trepar en las listas en una semana afortunada de descargas mientras ChatGPT sigue haciendo el trabajo pesado de fondo. El mismo desajuste ocurre en cripto cada vez que $TRUMP empieza a ser tendencia por razones que no tienen nada que ver con la actividad on-chain.
El movimiento paciente es ignorar los números de descargas y preguntarse qué es lo que realmente liquida, almacena o computa algo que la gente seguirá necesitando el próximo año.
¿Cuál es tu opinión sobre si este momento de Muse cambia algo para el cripto o si es solo otro objeto brillante?
#MuseOvertakesChatGPTAsTopFreeIOSApp #AIStocksWhatNext #CryptoMarketCapReclaims

182
·
--
¿Has notado cómo los inversores minoristas siguen persiguiendo jugadas de infraestructura, mientras que las apps de IA orientadas al consumidor están robándose silenciosamente toda la atención real del mercado?
La mayoría de los traders quedan atrapados haciendo rotación entre tokens como $MINA o se quedan con $USDT inactivo esperando el siguiente avance técnico, solo para darse cuenta de que se perdieron por completo el ciclo de adopción real. Seguimos comprando las tuberías mientras la atención de los usuarios se desplaza hacia la utilidad viral para el consumidor.
Que Muse derroque a ChatGPT en la cima del ranking de iOS es un claro caso de estudio de cómo funciona la adopción minorista. Mientras las comunidades técnicas debaten la computación descentralizada y modelos de tokens complejos, la tracción general se gana ofreciendo un producto limpio que la gente común quiera usar de inmediato. El capital no espera un roadmap de varios años cuando una aplicación accesible para el consumidor captura millones de usuarios activos diarios de la noche a la mañana.
Este cambio demuestra que la distribución y la ejecución del producto importan mucho más que construir una narrativa especulativa. Si las aplicaciones descentralizadas no logran resolver la adquisición básica de usuarios, la mentalidad (mindshare) y la liquidez seguirán moviéndose hacia productos para consumidores que priorizan la usabilidad por encima de la complejidad.
¿Hacia dónde crees que fluirá el capital después de que las apps de IA para consumidores se desvinculen por completo del hype de la infraestructura?
#MuseOvertakesChatGPTAsTopFreeIOSApp #AIStocksWhatNext
¿Has notado cómo los inversores minoristas siguen persiguiendo jugadas de infraestructura, mientras que las apps de IA orientadas al consumidor están robándose silenciosamente toda la atención real del mercado?
La mayoría de los traders quedan atrapados haciendo rotación entre tokens como $MINA o se quedan con $USDT inactivo esperando el siguiente avance técnico, solo para darse cuenta de que se perdieron por completo el ciclo de adopción real. Seguimos comprando las tuberías mientras la atención de los usuarios se desplaza hacia la utilidad viral para el consumidor.
Que Muse derroque a ChatGPT en la cima del ranking de iOS es un claro caso de estudio de cómo funciona la adopción minorista. Mientras las comunidades técnicas debaten la computación descentralizada y modelos de tokens complejos, la tracción general se gana ofreciendo un producto limpio que la gente común quiera usar de inmediato. El capital no espera un roadmap de varios años cuando una aplicación accesible para el consumidor captura millones de usuarios activos diarios de la noche a la mañana.
Este cambio demuestra que la distribución y la ejecución del producto importan mucho más que construir una narrativa especulativa. Si las aplicaciones descentralizadas no logran resolver la adquisición básica de usuarios, la mentalidad (mindshare) y la liquidez seguirán moviéndose hacia productos para consumidores que priorizan la usabilidad por encima de la complejidad.
¿Hacia dónde crees que fluirá el capital después de que las apps de IA para consumidores se desvinculen por completo del hype de la infraestructura?
#MuseOvertakesChatGPTAsTopFreeIOSApp #AIStocksWhatNext
La mayoría de los traders quedan atrapados haciendo rotación entre tokens como $MINA o se quedan con $USDT inactivo esperando el siguiente avance técnico, solo para darse cuenta de que se perdieron por completo el ciclo de adopción real. Seguimos comprando las tuberías mientras la atención de los usuarios se desplaza hacia la utilidad viral para el consumidor.
Que Muse derroque a ChatGPT en la cima del ranking de iOS es un claro caso de estudio de cómo funciona la adopción minorista. Mientras las comunidades técnicas debaten la computación descentralizada y modelos de tokens complejos, la tracción general se gana ofreciendo un producto limpio que la gente común quiera usar de inmediato. El capital no espera un roadmap de varios años cuando una aplicación accesible para el consumidor captura millones de usuarios activos diarios de la noche a la mañana.
Este cambio demuestra que la distribución y la ejecución del producto importan mucho más que construir una narrativa especulativa. Si las aplicaciones descentralizadas no logran resolver la adquisición básica de usuarios, la mentalidad (mindshare) y la liquidez seguirán moviéndose hacia productos para consumidores que priorizan la usabilidad por encima de la complejidad.
¿Hacia dónde crees que fluirá el capital después de que las apps de IA para consumidores se desvinculen por completo del hype de la infraestructura?
#MuseOvertakesChatGPTAsTopFreeIOSApp #AIStocksWhatNext

27
·
--
El total de la capitalización del mercado cripto, al recuperar un máximo previo, parece el “todo despejado”, pero en cada ciclo en el que lo he operado estaba más cerca de una advertencia.
Esa tensión en el estómago no es irracional. O ya compraste y te da miedo tomar ganancias, o todavía estás en $USDT mirando $PEPE rip y convenciéndote de que esta vez es diferente.
He visto este mismo patrón dos veces antes. Cuando el número agregado marca una recuperación, casi siempre Bitcoin es el motor. $BTC strength arrastra a todo el mercado a través del nivel y luego el minorista trata el titular como una luz verde.
La codicia está en 78 ahora mismo. Eso no es casualidad. El dinero rota desde la seguridad hacia lo que se mueve más rápido mientras la gente olvida cómo se sintió la última vez que compró fuerza.
Esto es lo que la mayoría nunca estudia: una recuperación de la capitalización de mercado es una señal rezagada. Confirma que los compradores ya llegaron. No promete que sigan llegando a estos precios. En 2021, el mismo patrón produjo una racha de euforia y luego un retroceso que borró a cualquiera que trató el titular como una señal de compra. Los traders que resistieron lo vieron como una oportunidad para reequilibrar. La esperanza se siente bien. El tamaño de la posición es lo que te mantiene en el siguiente ciclo.
¿Hacia dónde crees que esto va desde aquí?
#CryptoMarketCapReclaims #BitcoinBreaksAboveMayHighNears #BNBMarketCapPassesBNYMellon
El total de la capitalización del mercado cripto, al recuperar un máximo previo, parece el “todo despejado”, pero en cada ciclo en el que lo he operado estaba más cerca de una advertencia.
Esa tensión en el estómago no es irracional. O ya compraste y te da miedo tomar ganancias, o todavía estás en $USDT mirando $PEPE rip y convenciéndote de que esta vez es diferente.
He visto este mismo patrón dos veces antes. Cuando el número agregado marca una recuperación, casi siempre Bitcoin es el motor. $BTC strength arrastra a todo el mercado a través del nivel y luego el minorista trata el titular como una luz verde.
La codicia está en 78 ahora mismo. Eso no es casualidad. El dinero rota desde la seguridad hacia lo que se mueve más rápido mientras la gente olvida cómo se sintió la última vez que compró fuerza.
Esto es lo que la mayoría nunca estudia: una recuperación de la capitalización de mercado es una señal rezagada. Confirma que los compradores ya llegaron. No promete que sigan llegando a estos precios. En 2021, el mismo patrón produjo una racha de euforia y luego un retroceso que borró a cualquiera que trató el titular como una señal de compra. Los traders que resistieron lo vieron como una oportunidad para reequilibrar. La esperanza se siente bien. El tamaño de la posición es lo que te mantiene en el siguiente ciclo.
¿Hacia dónde crees que esto va desde aquí?
#CryptoMarketCapReclaims #BitcoinBreaksAboveMayHighNears #BNBMarketCapPassesBNYMellon
Esa tensión en el estómago no es irracional. O ya compraste y te da miedo tomar ganancias, o todavía estás en $USDT mirando $PEPE rip y convenciéndote de que esta vez es diferente.
He visto este mismo patrón dos veces antes. Cuando el número agregado marca una recuperación, casi siempre Bitcoin es el motor. $BTC strength arrastra a todo el mercado a través del nivel y luego el minorista trata el titular como una luz verde.
La codicia está en 78 ahora mismo. Eso no es casualidad. El dinero rota desde la seguridad hacia lo que se mueve más rápido mientras la gente olvida cómo se sintió la última vez que compró fuerza.
Esto es lo que la mayoría nunca estudia: una recuperación de la capitalización de mercado es una señal rezagada. Confirma que los compradores ya llegaron. No promete que sigan llegando a estos precios. En 2021, el mismo patrón produjo una racha de euforia y luego un retroceso que borró a cualquiera que trató el titular como una señal de compra. Los traders que resistieron lo vieron como una oportunidad para reequilibrar. La esperanza se siente bien. El tamaño de la posición es lo que te mantiene en el siguiente ciclo.
¿Hacia dónde crees que esto va desde aquí?
#CryptoMarketCapReclaims #BitcoinBreaksAboveMayHighNears #BNBMarketCapPassesBNYMellon

16
·
--
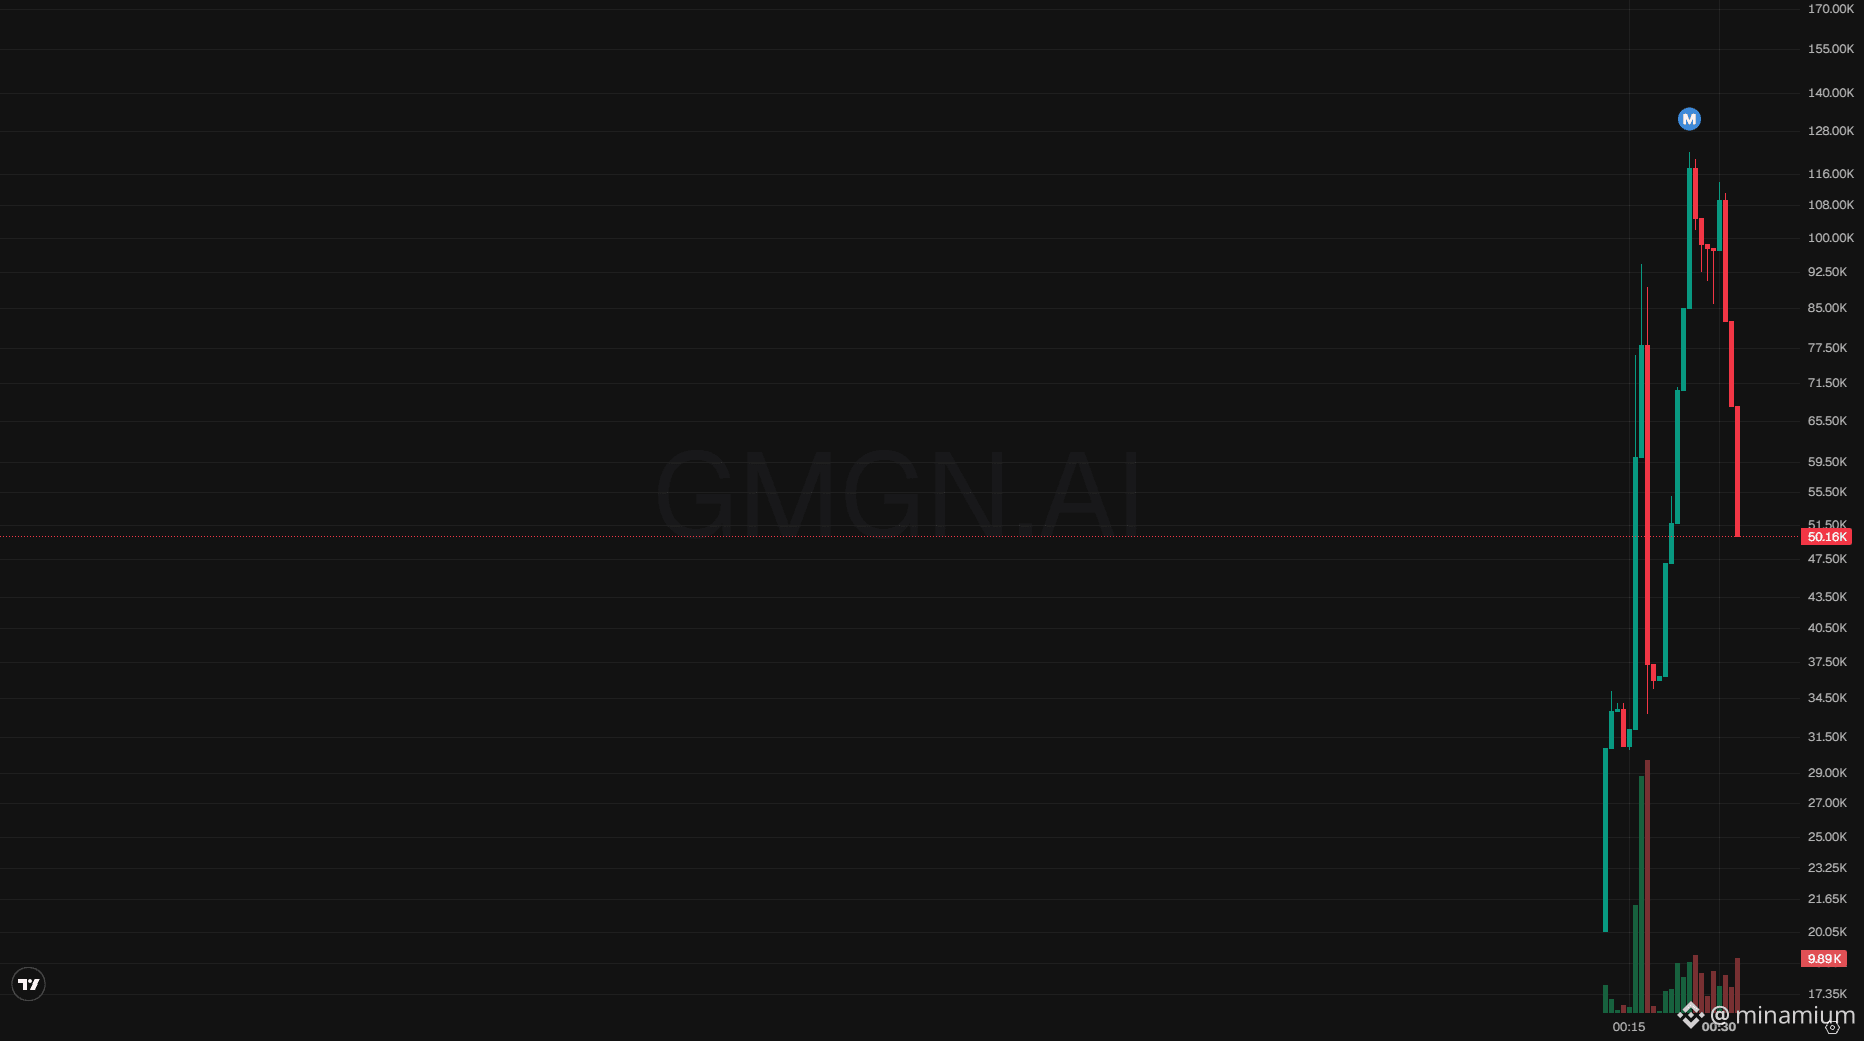
🟩 $KIBSHI - #ROBINHOOD play
0x544e12cc50428ddadfc1d40e5808f7d2d27d1e18
mcap: $49K
info es bastante escasa sobre los orígenes. kiboshib toma el clásico perro shiba inu japonés (la misma raza detrás del perro original doge y las monedas shib) y lo convierte en un token meme de ecosistema impulsado por kols conocidos con contenido creativo. investiga por tu cuenta.
https://gmgn.ai/robinhood/token/0x544e12cc50428ddadfc1d40e5808f7d2d27d1e18
https://t.me/based_eth_bot?start=0x544e12cc50428ddadfc1d40e5808f7d2d27d1e18
🟩 $KIBSHI - #ROBINHOOD play
0x544e12cc50428ddadfc1d40e5808f7d2d27d1e18
mcap: $49K
info es bastante escasa sobre los orígenes. kiboshib toma el clásico perro shiba inu japonés (la misma raza detrás del perro original doge y las monedas shib) y lo convierte en un token meme de ecosistema impulsado por kols conocidos con contenido creativo. investiga por tu cuenta.
https://gmgn.ai/robinhood/token/0x544e12cc50428ddadfc1d40e5808f7d2d27d1e18
https://t.me/based_eth_bot?start=0x544e12cc50428ddadfc1d40e5808f7d2d27d1e18
0x544e12cc50428ddadfc1d40e5808f7d2d27d1e18
mcap: $49K
info es bastante escasa sobre los orígenes. kiboshib toma el clásico perro shiba inu japonés (la misma raza detrás del perro original doge y las monedas shib) y lo convierte en un token meme de ecosistema impulsado por kols conocidos con contenido creativo. investiga por tu cuenta.
https://gmgn.ai/robinhood/token/0x544e12cc50428ddadfc1d40e5808f7d2d27d1e18
https://t.me/based_eth_bot?start=0x544e12cc50428ddadfc1d40e5808f7d2d27d1e18
1
·
--
¿Has notado que las $DOGE 15% bombas siempre se ven evidentes en retrospectiva y nunca en el momento en que realmente tienes que hacer clic en comprar?
Ese es el dolor. O te pierdes el movimiento por completo o lo persigues en la cima y ves cómo tu entrada se pone roja en cuestión de horas. La codicia al 78 hace que ambos errores parezcan racionales.
La multitud lo está tratando como una confirmación de que los memes han vuelto. Yo veo lo contrario. $DOGE spikes como este tienden a desvanecerse una vez que la línea de tiempo se llena con vueltas de victoria. El capital rota rápido hacia $PEPE y el resto de la manada.
$BTC mantener cerca de sus máximos de mayo puede mantener la oferta activa. Eso no es una razón para comprar fortaleza después de una vela del 15%.
Aquí está el único proceso en el que confío en estos movimientos. Ignora la ruptura y marca el rango que existía antes del pico. Espera un retesteo y, si los compradores lo defienden con un volumen real, toma una posición inicial. Vende un tercio en el primer rebote y deja que el resto corra con un stop dinámico.
¿A dónde crees que esto va desde aquí?
#DogecoinRises15 #BitcoinBreaksAboveMayHighNears #CryptoMarketCapReclaims
¿Has notado que las $DOGE 15% bombas siempre se ven evidentes en retrospectiva y nunca en el momento en que realmente tienes que hacer clic en comprar?
Ese es el dolor. O te pierdes el movimiento por completo o lo persigues en la cima y ves cómo tu entrada se pone roja en cuestión de horas. La codicia al 78 hace que ambos errores parezcan racionales.
La multitud lo está tratando como una confirmación de que los memes han vuelto. Yo veo lo contrario. $DOGE spikes como este tienden a desvanecerse una vez que la línea de tiempo se llena con vueltas de victoria. El capital rota rápido hacia $PEPE y el resto de la manada.
$BTC mantener cerca de sus máximos de mayo puede mantener la oferta activa. Eso no es una razón para comprar fortaleza después de una vela del 15%.
Aquí está el único proceso en el que confío en estos movimientos. Ignora la ruptura y marca el rango que existía antes del pico. Espera un retesteo y, si los compradores lo defienden con un volumen real, toma una posición inicial. Vende un tercio en el primer rebote y deja que el resto corra con un stop dinámico.
¿A dónde crees que esto va desde aquí?
#DogecoinRises15 #BitcoinBreaksAboveMayHighNears #CryptoMarketCapReclaims
Ese es el dolor. O te pierdes el movimiento por completo o lo persigues en la cima y ves cómo tu entrada se pone roja en cuestión de horas. La codicia al 78 hace que ambos errores parezcan racionales.
La multitud lo está tratando como una confirmación de que los memes han vuelto. Yo veo lo contrario. $DOGE spikes como este tienden a desvanecerse una vez que la línea de tiempo se llena con vueltas de victoria. El capital rota rápido hacia $PEPE y el resto de la manada.
$BTC mantener cerca de sus máximos de mayo puede mantener la oferta activa. Eso no es una razón para comprar fortaleza después de una vela del 15%.
Aquí está el único proceso en el que confío en estos movimientos. Ignora la ruptura y marca el rango que existía antes del pico. Espera un retesteo y, si los compradores lo defienden con un volumen real, toma una posición inicial. Vende un tercio en el primer rebote y deja que el resto corra con un stop dinámico.
¿A dónde crees que esto va desde aquí?
#DogecoinRises15 #BitcoinBreaksAboveMayHighNears #CryptoMarketCapReclaims

49
·
--
Si todavía estás ignorando los flujos institucionales de altcoins, detente ahora.
La mayoría de los traders minoristas se quedan atrapados persiguiendo velas verdes después de que la ruptura ya ha ocurrido, perdiéndose por completo dónde realmente está asignando el dinero inteligente antes del movimiento.
Más de $20M entraron en un solo día en los ETFs spot de EE. UU. $XRP , y casi todo ese capital fue directo a Bitwise. Aunque los críticos sostienen que la liquidez de los ETF de altcoins nunca igualará $BTC ni a $ETH, este tipo de volumen concentrado en un solo día muestra una necesidad clara de exposición regulada.
La concentración de capital como esta suele señalar convicción institucional más que especulación minorista a corto plazo. Cuando un emisor capta casi toda la entrada diaria, crea una base de acumulación estructurada que podría cambiar la forma en que el mercado valora los activos de gran capitalización de cara al futuro.
¿Crees que estas entradas institucionales desencadenarán una altseason más amplia, o es esta demanda estrictamente aislada a unos pocos fondos?
#XRP #CryptoETF #Altcoins
Si todavía estás ignorando los flujos institucionales de altcoins, detente ahora.
La mayoría de los traders minoristas se quedan atrapados persiguiendo velas verdes después de que la ruptura ya ha ocurrido, perdiéndose por completo dónde realmente está asignando el dinero inteligente antes del movimiento.
Más de $20M entraron en un solo día en los ETFs spot de EE. UU. $XRP , y casi todo ese capital fue directo a Bitwise. Aunque los críticos sostienen que la liquidez de los ETF de altcoins nunca igualará $BTC ni a $ETH , este tipo de volumen concentrado en un solo día muestra una necesidad clara de exposición regulada.
La concentración de capital como esta suele señalar convicción institucional más que especulación minorista a corto plazo. Cuando un emisor capta casi toda la entrada diaria, crea una base de acumulación estructurada que podría cambiar la forma en que el mercado valora los activos de gran capitalización de cara al futuro.
¿Crees que estas entradas institucionales desencadenarán una altseason más amplia, o es esta demanda estrictamente aislada a unos pocos fondos?
#XRP #CryptoETF #Altcoins
La mayoría de los traders minoristas se quedan atrapados persiguiendo velas verdes después de que la ruptura ya ha ocurrido, perdiéndose por completo dónde realmente está asignando el dinero inteligente antes del movimiento.
Más de $20M entraron en un solo día en los ETFs spot de EE. UU. $XRP , y casi todo ese capital fue directo a Bitwise. Aunque los críticos sostienen que la liquidez de los ETF de altcoins nunca igualará $BTC ni a $ETH , este tipo de volumen concentrado en un solo día muestra una necesidad clara de exposición regulada.
La concentración de capital como esta suele señalar convicción institucional más que especulación minorista a corto plazo. Cuando un emisor capta casi toda la entrada diaria, crea una base de acumulación estructurada que podría cambiar la forma en que el mercado valora los activos de gran capitalización de cara al futuro.
¿Crees que estas entradas institucionales desencadenarán una altseason más amplia, o es esta demanda estrictamente aislada a unos pocos fondos?
#XRP #CryptoETF #Altcoins
58
·
--
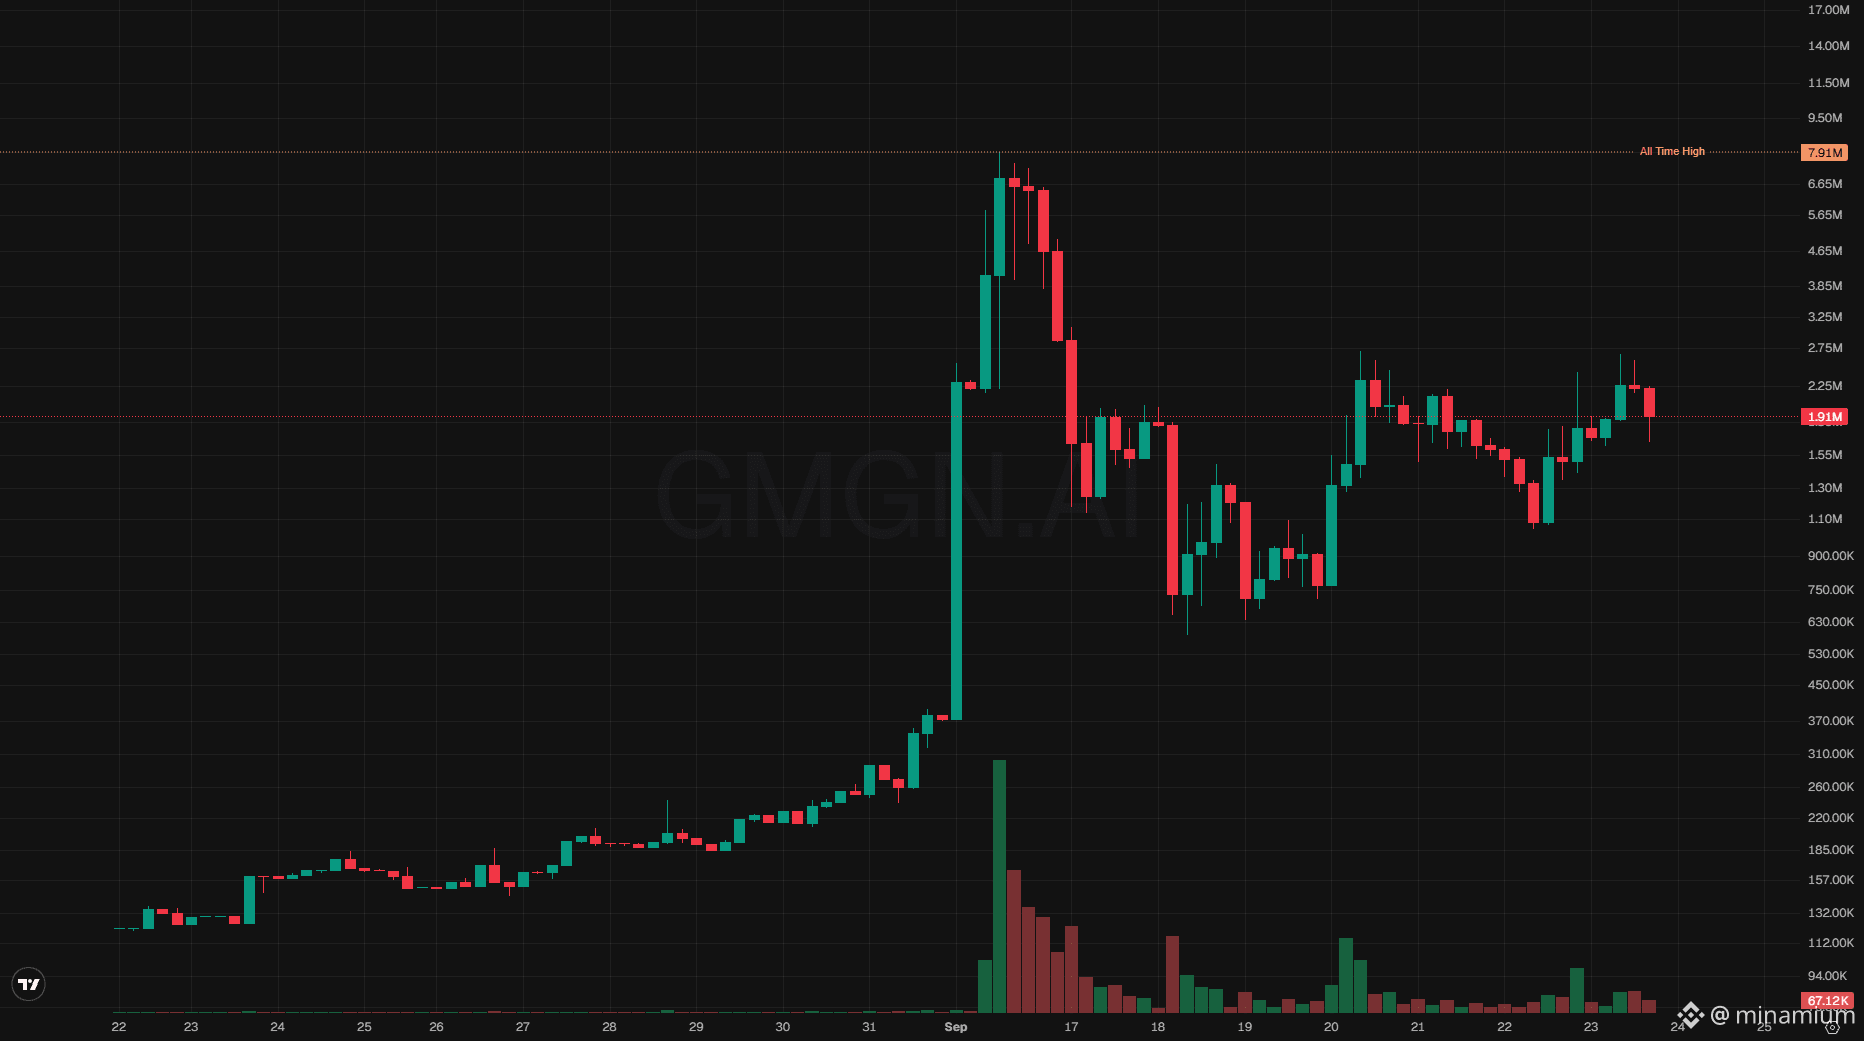
🟦 $COOL - #ARC play
0xeb64987643db71c76b2a2be7e723decc995e5b37
mcap: $1.91M
https://gmgn.ai/arc/token/0xeb64987643db71c76b2a2be7e723decc995e5b37
https://t.me/based_eth_bot?start=0xeb64987643db71c76b2a2be7e723decc995e5b37
🟦 $COOL - #ARC play
0xeb64987643db71c76b2a2be7e723decc995e5b37
mcap: $1.91M
https://gmgn.ai/arc/token/0xeb64987643db71c76b2a2be7e723decc995e5b37
https://t.me/based_eth_bot?start=0xeb64987643db71c76b2a2be7e723decc995e5b37
0xeb64987643db71c76b2a2be7e723decc995e5b37
mcap: $1.91M
https://gmgn.ai/arc/token/0xeb64987643db71c76b2a2be7e723decc995e5b37
https://t.me/based_eth_bot?start=0xeb64987643db71c76b2a2be7e723decc995e5b37
·
--
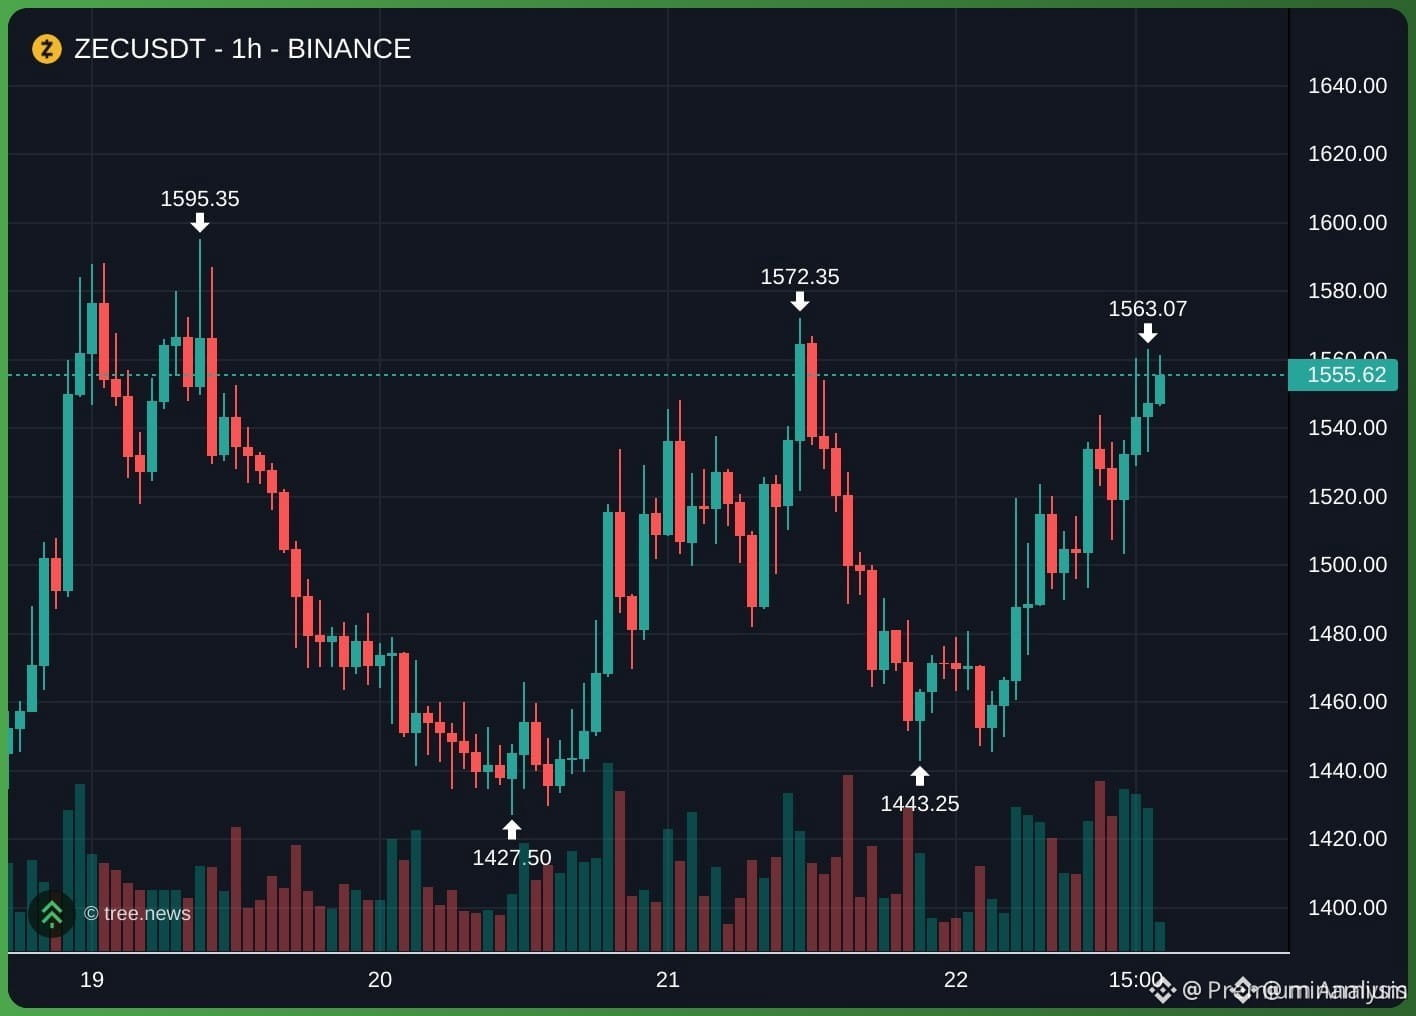
todo el mundo piensa que las monedas de privacidad son dinero muerto que solo sube por copium, pero en realidad $ZEC acaban de imprimir aproximadamente un 7% en 24 horas con una historia de acceso institucional real.
el dolor es verte desvanecerlo, luego entrar por fomo en la mecha y después entrar en pánico cuando el primer impulso se enfría. ese bucle ha destrozado más libros que el fud alguna vez.
ngl este $ZEC movimiento es un caso de estudio. productos respaldados físicamente llegaron a bolsas europeas importantes para que las instituciones finalmente tengan un acceso más limpio.
la demanda de privacidad, el acceso de mercado más profundo y la mejora de la liquidez se están reforzando entre sí, no compitiendo. por eso $ZEC puede seguir visible incluso después de que se enfríe el primer estallido de momentum.
la mayoría tratará el 7% como si fuera la operación completa. la $BTC rotación y la $XMR filtración de la multitud hacia privacidad es lo que hace que estas cosas realmente se queden.
¿alguien más ve esto como un pump de un día o el inicio de una operación de acceso más larga?
#privacy #ZEC #altcoins
todo el mundo piensa que las monedas de privacidad son dinero muerto que solo sube por copium, pero en realidad $ZEC acaban de imprimir aproximadamente un 7% en 24 horas con una historia de acceso institucional real.
el dolor es verte desvanecerlo, luego entrar por fomo en la mecha y después entrar en pánico cuando el primer impulso se enfría. ese bucle ha destrozado más libros que el fud alguna vez.
ngl este $ZEC movimiento es un caso de estudio. productos respaldados físicamente llegaron a bolsas europeas importantes para que las instituciones finalmente tengan un acceso más limpio.
la demanda de privacidad, el acceso de mercado más profundo y la mejora de la liquidez se están reforzando entre sí, no compitiendo. por eso $ZEC puede seguir visible incluso después de que se enfríe el primer estallido de momentum.
la mayoría tratará el 7% como si fuera la operación completa. la $BTC rotación y la $XMR filtración de la multitud hacia privacidad es lo que hace que estas cosas realmente se queden.
¿alguien más ve esto como un pump de un día o el inicio de una operación de acceso más larga?
#privacy #ZEC #altcoins
el dolor es verte desvanecerlo, luego entrar por fomo en la mecha y después entrar en pánico cuando el primer impulso se enfría. ese bucle ha destrozado más libros que el fud alguna vez.
ngl este $ZEC movimiento es un caso de estudio. productos respaldados físicamente llegaron a bolsas europeas importantes para que las instituciones finalmente tengan un acceso más limpio.
la demanda de privacidad, el acceso de mercado más profundo y la mejora de la liquidez se están reforzando entre sí, no compitiendo. por eso $ZEC puede seguir visible incluso después de que se enfríe el primer estallido de momentum.
la mayoría tratará el 7% como si fuera la operación completa. la $BTC rotación y la $XMR filtración de la multitud hacia privacidad es lo que hace que estas cosas realmente se queden.
¿alguien más ve esto como un pump de un día o el inicio de una operación de acceso más larga?
#privacy #ZEC #altcoins
88
·
--
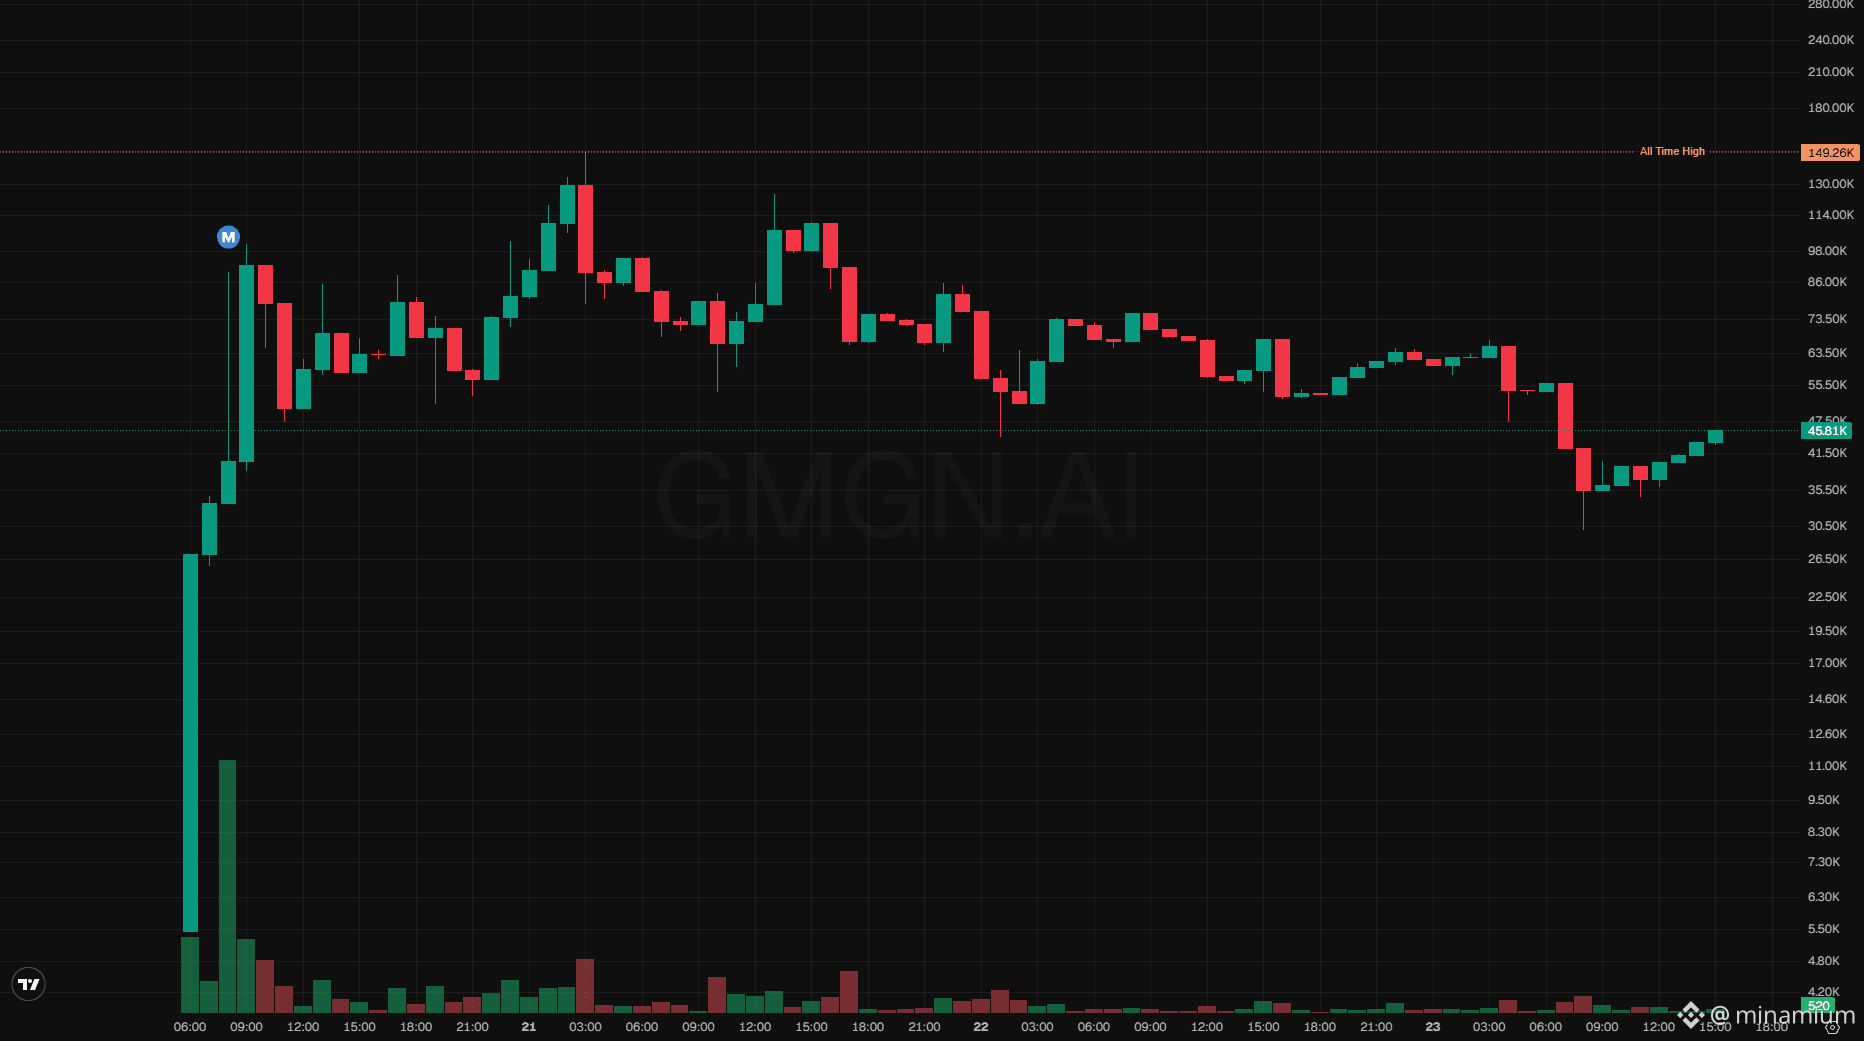
🟩 $SURFR - #ROBINHOOD play
0xc4086d9ce6abf5f22499a5c2d7f411e53b8839eb
mcap: $46K
silver surfer se refiere al legendario heraldo cósmico de cromo de Marvel que se juró a Galactus y ahora surfea las estrellas en una tabla reluciente. combinaron a ese jinete espacial legendario con energía de la commodity slv tokenizada en la cadena de Robinhood después de un relanzamiento completo. dyor
Web : https://silversurferrh.com/
TG : https://t.me/thesilversurferrh
https://gmgn.ai/robinhood/token/0xc4086d9ce6abf5f22499a5c2d7f411e53b8839eb
https://t.me/based_eth_bot?start=0xc4086d9ce6abf5f22499a5c2d7f411e53b8839eb
🟩 $SURFR - #ROBINHOOD play
0xc4086d9ce6abf5f22499a5c2d7f411e53b8839eb
mcap: $46K
silver surfer se refiere al legendario heraldo cósmico de cromo de Marvel que se juró a Galactus y ahora surfea las estrellas en una tabla reluciente. combinaron a ese jinete espacial legendario con energía de la commodity slv tokenizada en la cadena de Robinhood después de un relanzamiento completo. dyor
Web : https://silversurferrh.com/
TG : https://t.me/thesilversurferrh
https://gmgn.ai/robinhood/token/0xc4086d9ce6abf5f22499a5c2d7f411e53b8839eb
https://t.me/based_eth_bot?start=0xc4086d9ce6abf5f22499a5c2d7f411e53b8839eb
0xc4086d9ce6abf5f22499a5c2d7f411e53b8839eb
mcap: $46K
silver surfer se refiere al legendario heraldo cósmico de cromo de Marvel que se juró a Galactus y ahora surfea las estrellas en una tabla reluciente. combinaron a ese jinete espacial legendario con energía de la commodity slv tokenizada en la cadena de Robinhood después de un relanzamiento completo. dyor
Web : https://silversurferrh.com/
TG : https://t.me/thesilversurferrh
https://gmgn.ai/robinhood/token/0xc4086d9ce6abf5f22499a5c2d7f411e53b8839eb
https://t.me/based_eth_bot?start=0xc4086d9ce6abf5f22499a5c2d7f411e53b8839eb
24
·
--
todo el mundo piensa que la custodia de TradFi es alcista para las bolsas de los minoristas, pero en realidad podrías estar preparándote para que te liquiden en la salida el dinero realmente inteligente.
la mayoría de los traders mantiene posiciones largas de forma ciega siguiendo este tipo de noticias, solo para terminar con bolsas pesadas cuando las instituciones los adelantan (front-run) y tiran todo en la euforia.
mira cómo Deutsche Bank está desplegando su configuración de custodia institucional en toda Europa este año. se están preparando para custodiar y gestionar claves privadas para clientes masivos en $BTC, $ETH y stablecoins como usdc, eurc y eurau. sinceramente, ser, mientras todos celebran la adopción generalizada, la realidad es que las instituciones no están comprando para “agarrar la mano” del minorista. quieren control total de la infraestructura para ejecutar enormes flujos OTC y cubrirse ante los vaivenes del mercado sin tocar los libros de órdenes públicos.
cuando gigantes bancarios de billones de dólares entran a gestionar carteras institucionales, la ventaja del minorista se reduce muy rápido.
¿dónde crees que deja este cambio institucional a los traders minoristas a largo plazo?
#CryptoCustody #Bitcoin #InstitutionalAdoption
todo el mundo piensa que la custodia de TradFi es alcista para las bolsas de los minoristas, pero en realidad podrías estar preparándote para que te liquiden en la salida el dinero realmente inteligente.
la mayoría de los traders mantiene posiciones largas de forma ciega siguiendo este tipo de noticias, solo para terminar con bolsas pesadas cuando las instituciones los adelantan (front-run) y tiran todo en la euforia.
mira cómo Deutsche Bank está desplegando su configuración de custodia institucional en toda Europa este año. se están preparando para custodiar y gestionar claves privadas para clientes masivos en $BTC , $ETH y stablecoins como usdc, eurc y eurau. sinceramente, ser, mientras todos celebran la adopción generalizada, la realidad es que las instituciones no están comprando para “agarrar la mano” del minorista. quieren control total de la infraestructura para ejecutar enormes flujos OTC y cubrirse ante los vaivenes del mercado sin tocar los libros de órdenes públicos.
cuando gigantes bancarios de billones de dólares entran a gestionar carteras institucionales, la ventaja del minorista se reduce muy rápido.
¿dónde crees que deja este cambio institucional a los traders minoristas a largo plazo?
#CryptoCustody #Bitcoin #InstitutionalAdoption
la mayoría de los traders mantiene posiciones largas de forma ciega siguiendo este tipo de noticias, solo para terminar con bolsas pesadas cuando las instituciones los adelantan (front-run) y tiran todo en la euforia.
mira cómo Deutsche Bank está desplegando su configuración de custodia institucional en toda Europa este año. se están preparando para custodiar y gestionar claves privadas para clientes masivos en $BTC , $ETH y stablecoins como usdc, eurc y eurau. sinceramente, ser, mientras todos celebran la adopción generalizada, la realidad es que las instituciones no están comprando para “agarrar la mano” del minorista. quieren control total de la infraestructura para ejecutar enormes flujos OTC y cubrirse ante los vaivenes del mercado sin tocar los libros de órdenes públicos.
cuando gigantes bancarios de billones de dólares entran a gestionar carteras institucionales, la ventaja del minorista se reduce muy rápido.
¿dónde crees que deja este cambio institucional a los traders minoristas a largo plazo?
#CryptoCustody #Bitcoin #InstitutionalAdoption

42
·
--
Si aún estás perdiendo Bitcoin porque CoinShares dijo que no llegaría a $80K, detente ahora.
Los traders que escucharon y se quedaron al margen o se pusieron cortos están viendo cómo sus cuentas se pierden un movimiento limpio del 3% en horas. Ese pinchazo de FOMO después de una llamada como esta es real.
CoinShares emitió una nota en la que $BTC no alcanzaría los $80,000. El precio tenía otras ideas. Bitcoin acaba de imprimir una vela de 4 horas que cerró por encima de $80K con más de un 3% de ganancia.
Las instituciones tienen modelos, visiones macro y razones para ser cautelosas. La otra cara es simple. Bitcoin ha ignorado muchas llamadas de expertos antes y sigue marcando máximos cuando menos se espera. Me pongo del lado del gráfico. Cuando una vela de 4H salta así, no es ruido.
$ETH y $SOL están siguiendo a $BTC . Las predicciones van y vienen, pero el precio se mantiene.
¿Hacia dónde crees que va desde aquí?
#Bitcoin #BTC #Cripto
Si aún estás perdiendo Bitcoin porque CoinShares dijo que no llegaría a $80K, detente ahora.
Los traders que escucharon y se quedaron al margen o se pusieron cortos están viendo cómo sus cuentas se pierden un movimiento limpio del 3% en horas. Ese pinchazo de FOMO después de una llamada como esta es real.
CoinShares emitió una nota en la que $BTC no alcanzaría los $80,000. El precio tenía otras ideas. Bitcoin acaba de imprimir una vela de 4 horas que cerró por encima de $80K con más de un 3% de ganancia.
Las instituciones tienen modelos, visiones macro y razones para ser cautelosas. La otra cara es simple. Bitcoin ha ignorado muchas llamadas de expertos antes y sigue marcando máximos cuando menos se espera. Me pongo del lado del gráfico. Cuando una vela de 4H salta así, no es ruido.
$ETH y $SOL están siguiendo a $BTC . Las predicciones van y vienen, pero el precio se mantiene.
¿Hacia dónde crees que va desde aquí?
#Bitcoin #BTC #Cripto
Los traders que escucharon y se quedaron al margen o se pusieron cortos están viendo cómo sus cuentas se pierden un movimiento limpio del 3% en horas. Ese pinchazo de FOMO después de una llamada como esta es real.
CoinShares emitió una nota en la que $BTC no alcanzaría los $80,000. El precio tenía otras ideas. Bitcoin acaba de imprimir una vela de 4 horas que cerró por encima de $80K con más de un 3% de ganancia.
Las instituciones tienen modelos, visiones macro y razones para ser cautelosas. La otra cara es simple. Bitcoin ha ignorado muchas llamadas de expertos antes y sigue marcando máximos cuando menos se espera. Me pongo del lado del gráfico. Cuando una vela de 4H salta así, no es ruido.
$ETH y $SOL están siguiendo a $BTC . Las predicciones van y vienen, pero el precio se mantiene.
¿Hacia dónde crees que va desde aquí?
#Bitcoin #BTC #Cripto
53
Inicia sesión para explorar más contenidos
Únete a usuarios globales de criptomonedas en Binance Square
⚡️ Obtén información útil y actualizada sobre criptos.
💬 Avalado por el mayor exchange de criptomonedas en el mundo.
👍 Descubre perspectivas reales de creadores verificados.
Email/número de teléfono
Temas populares
AIStocksWhatNext
979,199 vistas
6,937 están debatiendo
Comparte y gana recompensas de tráfico en nuestra campaña de hashtag en tendencia
✨Tema: ¿Qué otras oportunidades de inversión siguen vigentes mientras las acciones de IA continúan subiendo?
👉Cómo unirte:
Publica una publicación breve o un artículo con el hashtag #AIStocksWhatNext
Comparte si eres alcista o bajista, y publica tus participaciones en acciones de IA o tu operación — usar el widget de operaciones puede mejorar tu elegibilidad.
También puedes fortalecer tu publicación compartiendo datos o gráficos, y evitando imágenes generadas por IA.
✍️Crea contenido basado en los ángulos siguientes:
- Nvidia dice que las ventas de chips se duplicarán el próximo año, y las principales empresas de IA siguen registrando ingresos récord; el gasto en cómputo que hay detrás es igualmente asombroso. ¿La demanda de IA realmente está despegando? ¿Y cuánto tiempo puede durar? Las acciones de IA suben en general. ¿Se trata de una ruptura real o solo de un rebote a corto plazo?
- Líderes de la industria piden frenar el desarrollo de la IA, mientras Trump planea construir una “AI Force”, afirmando que la IA podría representar el 25% del PIB de EE. UU. en el futuro. ¿De qué lado estás? ¿El respaldo a nivel estatal será una victoria a largo plazo para las acciones de IA?
- ¿Estás comprando acciones de IA? Comparte tu operación/tenencias relacionadas con IA con nuestro widget de compartición de operaciones.
⏰Periodo de la campaña:
- 2026-09-22 7:00 - 2026-09-24 4:00 UTC
🎁Recompensa:
- Las publicaciones que cumplan con las pautas anteriores y contengan más de 100 palabras serán revisadas y podrían recibir un impulso aleatorio de tráfico de 500 a 3,000 vistas. Recibirás una notificación de tu secretario/a de feed si tu publicación es seleccionada.
- Obtén la oportunidad de que tu artículo se destaque en Binance Square Official
¿Necesitas ideas para tu publicación? Visita la página del tema #AIStocksWhatNext o la Square Guide on How to Post for Better Reach.
Binance Square Official
·605 me gusta
·1.8M vistas
BitcoinRejectedAt$87,300Twice
0 vistas
0 están debatiendo
BCHJumps28%OnCMEFuturesListing
20,544 vistas
641 están debatiendo