
ZANE ROOK
8.7k Posts

ZANE ROOK
 Square Verified+
Report
Block User
Focused mind. Fearless heart. Future Billionaire...
Open Trade
Frequent Trader
11 Months
385 Following
32.9K+ Followers
4.7K+ Liked
Posts
Portfolio
All
Quotes
Live
·
--
FOMC September: What Could the Fed’s Next Move Mean for Markets?
The September FOMC meeting is putting the Federal Reserve’s next rate decision firmly in focus. With August core CPI rising 0.3% month over month and the odds of a 25-basis-point rate hike this week described as close to 90%, the key question is no longer just whether the Fed moves, but what could come after it.
Would a 25bp hike be a one-off adjustment, or could it mark the beginning of a longer rate-hiking cycle? The answer could have important implications across financial markets.
If the hike happens, investors will also be watching how different assets respond. BTC, technology stocks, and gold could each react differently to changes in interest-rate expectations, liquidity, and investor positioning. The market reaction may depend not only on the rate decision itself, but also on the Fed’s guidance about future policy.
For traders, this makes the September meeting an important event to prepare for. Rather than focusing only on the headline decision, it is worth considering how your BTC, stock, or gold positions could fit into different rate scenarios.
What is your expectation for the next Fed move, and how are you positioning for it?
#FedRateWatch
FOMC September: What Could the Fed’s Next Move Mean for Markets?
The September FOMC meeting is putting the Federal Reserve’s next rate decision firmly in focus. With August core CPI rising 0.3% month over month and the odds of a 25-basis-point rate hike this week described as close to 90%, the key question is no longer just whether the Fed moves, but what could come after it.
Would a 25bp hike be a one-off adjustment, or could it mark the beginning of a longer rate-hiking cycle? The answer could have important implications across financial markets.
If the hike happens, investors will also be watching how different assets respond. BTC, technology stocks, and gold could each react differently to changes in interest-rate expectations, liquidity, and investor positioning. The market reaction may depend not only on the rate decision itself, but also on the Fed’s guidance about future policy.
For traders, this makes the September meeting an important event to prepare for. Rather than focusing only on the headline decision, it is worth considering how your BTC, stock, or gold positions could fit into different rate scenarios.
What is your expectation for the next Fed move, and how are you positioning for it?
#FedRateWatch
The September FOMC meeting is putting the Federal Reserve’s next rate decision firmly in focus. With August core CPI rising 0.3% month over month and the odds of a 25-basis-point rate hike this week described as close to 90%, the key question is no longer just whether the Fed moves, but what could come after it.
Would a 25bp hike be a one-off adjustment, or could it mark the beginning of a longer rate-hiking cycle? The answer could have important implications across financial markets.
If the hike happens, investors will also be watching how different assets respond. BTC, technology stocks, and gold could each react differently to changes in interest-rate expectations, liquidity, and investor positioning. The market reaction may depend not only on the rate decision itself, but also on the Fed’s guidance about future policy.
For traders, this makes the September meeting an important event to prepare for. Rather than focusing only on the headline decision, it is worth considering how your BTC, stock, or gold positions could fit into different rate scenarios.
What is your expectation for the next Fed move, and how are you positioning for it?
#FedRateWatch

89
·
--
#TermMax @termmax
spent a bit of time digging into TermMax because the V2 launch made me curious about what’s actually happening underneath the clean interface.
TermMax is basically trying to make fixed-rate borrowing and lending feel less fragmented, while also bringing options trading into the same system.
that sounds good on paper.
but the more i looked at it, the more one thing stood out to me.
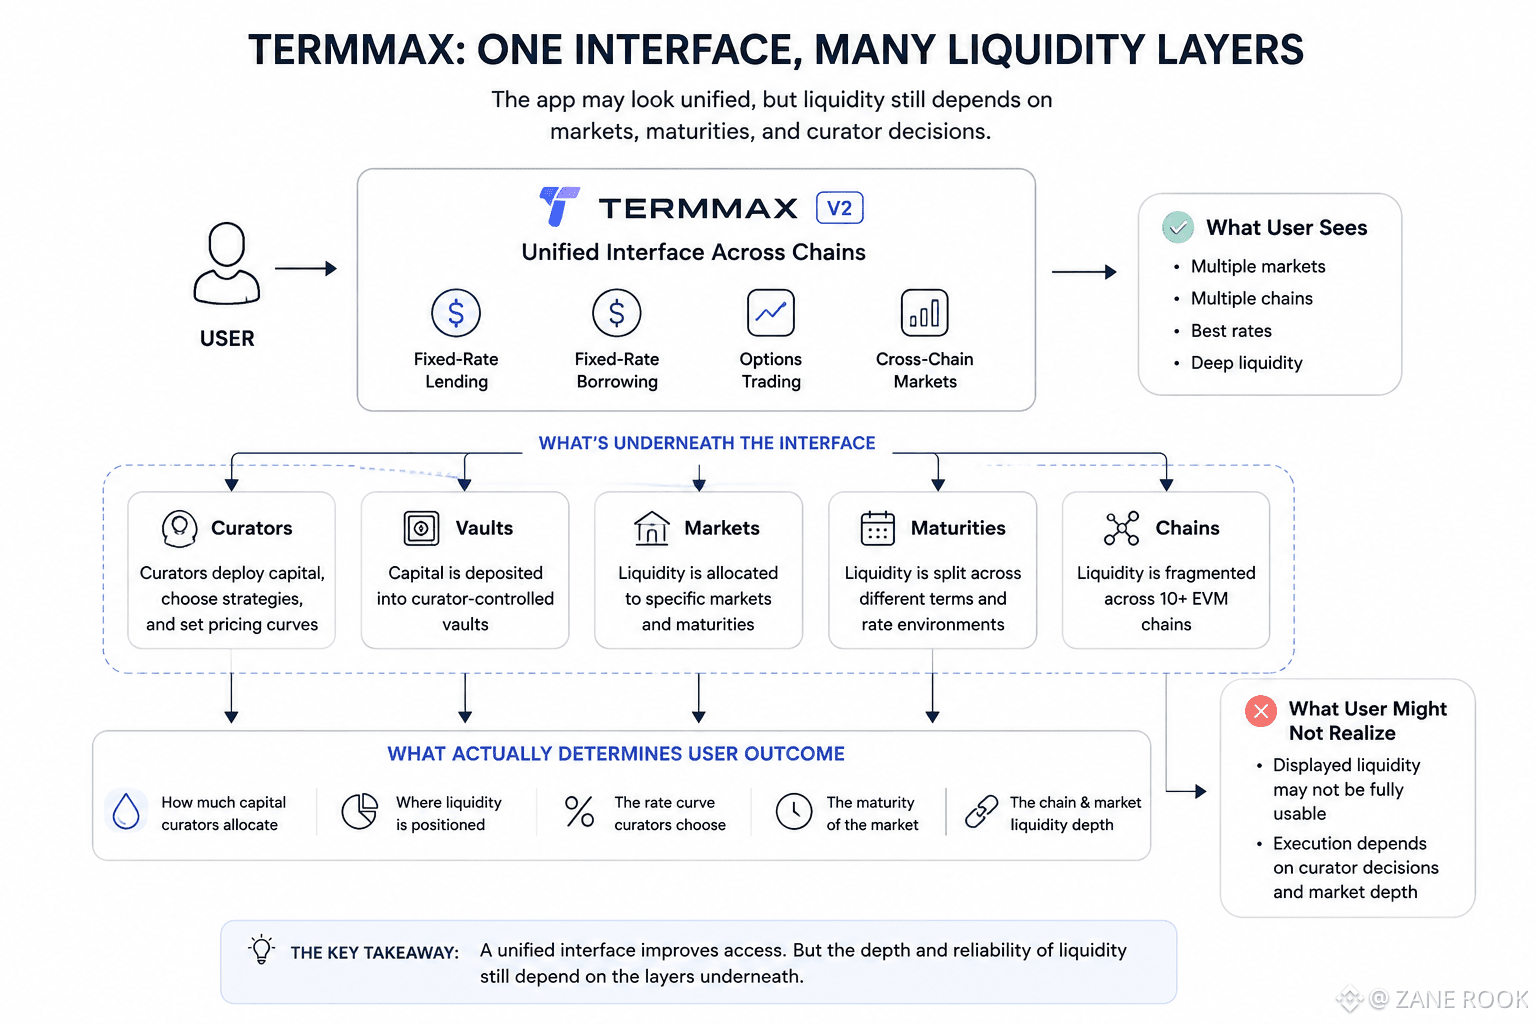
the app can look unified without the liquidity actually being unified.
TermMax can show different markets and opportunities in one place, but underneath that, liquidity is still tied to specific markets, maturities and curator decisions.
and that matters.
because as a user, i don't really care how clean the dashboard looks if the liquidity i see isn't there when i actually want to borrow, lend or trade.
that's the part i'm still not completely convinced about.
maybe V2 handles this better than i think. but i'd rather judge it from actual execution than from TVL or the number of chains supported.
how much of the displayed liquidity can users really access at meaningful size?
that's the number i'd want to see.
has anyone actually tested TermMax that way?
#TermMax @TermMax
spent a bit of time digging into TermMax because the V2 launch made me curious about what’s actually happening underneath the clean interface.
TermMax is basically trying to make fixed-rate borrowing and lending feel less fragmented, while also bringing options trading into the same system.
that sounds good on paper.
but the more i looked at it, the more one thing stood out to me.
the app can look unified without the liquidity actually being unified.
TermMax can show different markets and opportunities in one place, but underneath that, liquidity is still tied to specific markets, maturities and curator decisions.
and that matters.
because as a user, i don't really care how clean the dashboard looks if the liquidity i see isn't there when i actually want to borrow, lend or trade.
that's the part i'm still not completely convinced about.
maybe V2 handles this better than i think. but i'd rather judge it from actual execution than from TVL or the number of chains supported.
how much of the displayed liquidity can users really access at meaningful size?
that's the number i'd want to see.
has anyone actually tested TermMax that way?
spent a bit of time digging into TermMax because the V2 launch made me curious about what’s actually happening underneath the clean interface.
TermMax is basically trying to make fixed-rate borrowing and lending feel less fragmented, while also bringing options trading into the same system.
that sounds good on paper.
but the more i looked at it, the more one thing stood out to me.
the app can look unified without the liquidity actually being unified.
TermMax can show different markets and opportunities in one place, but underneath that, liquidity is still tied to specific markets, maturities and curator decisions.
and that matters.
because as a user, i don't really care how clean the dashboard looks if the liquidity i see isn't there when i actually want to borrow, lend or trade.
that's the part i'm still not completely convinced about.
maybe V2 handles this better than i think. but i'd rather judge it from actual execution than from TVL or the number of chains supported.
how much of the displayed liquidity can users really access at meaningful size?
that's the number i'd want to see.
has anyone actually tested TermMax that way?
263
·
--
i spent some time digging into TermMax because the fixed-rate lending pitch caught my attention.
at first, it feels pretty simple.
you lock in a rate, someone else borrows at that rate, and both sides know what they're getting.
but the more i looked at it, the fixed rate itself started to feel like the less interesting part.
what actually matters is the liquidity sitting underneath it.
a protocol can show you a nice rate on the screen. that doesn't automatically mean the same rate is easy to use when you actually bring size to the market.
and that's where TermMax gets interesting to me.
the protocol is trying to combine fixed-rate lending and borrowing with options, but the user's experience still depends on the depth and behavior of the individual markets behind that interface.
so the headline is “fixed rates.”
the thing i'm watching is how usable those rates really are.
because if the quote looks great but execution gets worse as size increases, the displayed rate isn't telling the whole story.
i don't think that makes TermMax good or bad by itself.
it just changes what i'd want to see before forming a strong opinion.
actual fills. actual slippage. actual borrowing demand.
has anyone here tested TermMax with meaningful size and compared the quoted rate with the rate they actually got?
@termmax #TermMax
i spent some time digging into TermMax because the fixed-rate lending pitch caught my attention.
at first, it feels pretty simple.
you lock in a rate, someone else borrows at that rate, and both sides know what they're getting.
but the more i looked at it, the fixed rate itself started to feel like the less interesting part.
what actually matters is the liquidity sitting underneath it.
a protocol can show you a nice rate on the screen. that doesn't automatically mean the same rate is easy to use when you actually bring size to the market.
and that's where TermMax gets interesting to me.
the protocol is trying to combine fixed-rate lending and borrowing with options, but the user's experience still depends on the depth and behavior of the individual markets behind that interface.
so the headline is “fixed rates.”
the thing i'm watching is how usable those rates really are.
because if the quote looks great but execution gets worse as size increases, the displayed rate isn't telling the whole story.
i don't think that makes TermMax good or bad by itself.
it just changes what i'd want to see before forming a strong opinion.
actual fills. actual slippage. actual borrowing demand.
has anyone here tested TermMax with meaningful size and compared the quoted rate with the rate they actually got?
@TermMax #TermMax
at first, it feels pretty simple.
you lock in a rate, someone else borrows at that rate, and both sides know what they're getting.
but the more i looked at it, the fixed rate itself started to feel like the less interesting part.
what actually matters is the liquidity sitting underneath it.
a protocol can show you a nice rate on the screen. that doesn't automatically mean the same rate is easy to use when you actually bring size to the market.
and that's where TermMax gets interesting to me.
the protocol is trying to combine fixed-rate lending and borrowing with options, but the user's experience still depends on the depth and behavior of the individual markets behind that interface.
so the headline is “fixed rates.”
the thing i'm watching is how usable those rates really are.
because if the quote looks great but execution gets worse as size increases, the displayed rate isn't telling the whole story.
i don't think that makes TermMax good or bad by itself.
it just changes what i'd want to see before forming a strong opinion.
actual fills. actual slippage. actual borrowing demand.
has anyone here tested TermMax with meaningful size and compared the quoted rate with the rate they actually got?
@TermMax #TermMax
245
·
--
@termmax #TermMax
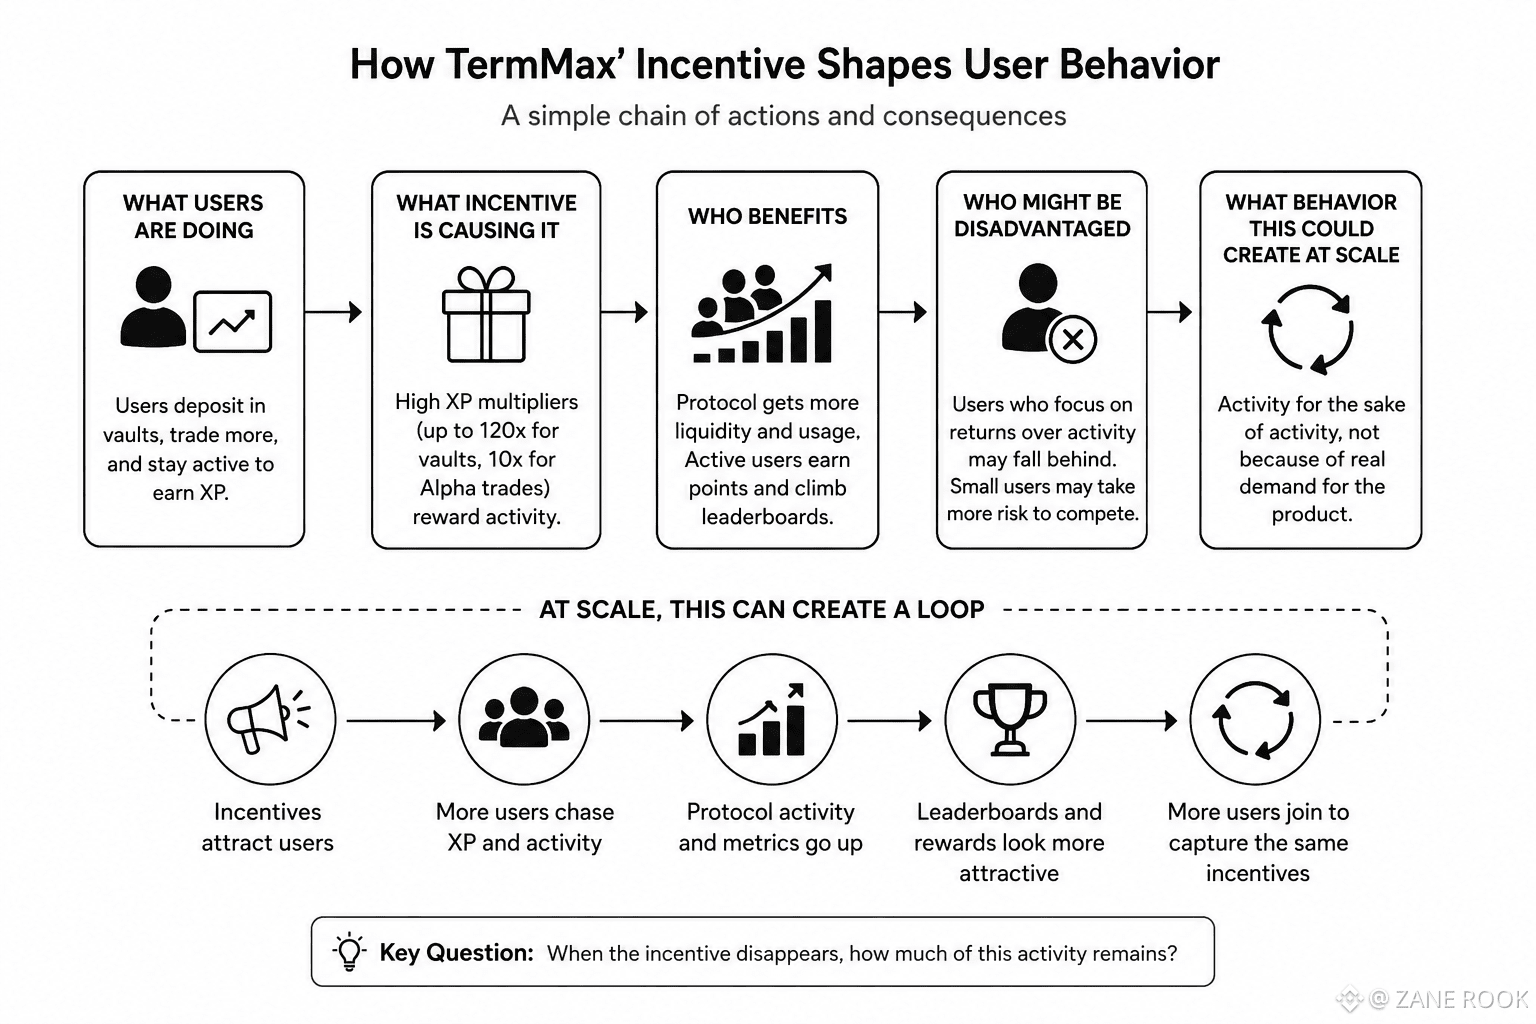
I noticed something interesting when looking at TermMax: the incentive around XP can quietly change why people move their capital in the first place.
If one vault or market offers a much stronger XP multiplier, it’s easy to imagine users chasing that opportunity instead of simply asking where their money is most useful or productive.
From the user’s perspective, that’s rational. If the protocol is rewarding activity, people will naturally optimize around the reward.
TermMax benefits too. More deposits mean deeper liquidity and more activity around its markets. That’s probably the point of the incentive.
But there’s another side to it.
Smaller users may move whatever capital they have toward the highest incentive. Larger players can do the same thing on a much bigger scale. If the rewards change, the liquidity can potentially change with them.
That creates an interesting distinction between genuine demand and incentive-driven activity.
When a few users do it, nobody really notices. But if thousands of users start making the same decision, liquidity could become increasingly sensitive to rewards rather than the actual usefulness of the market.
That doesn’t make the incentive good or bad. It just makes the human response worth watching.
At some point, does an incentive attract users who want to use the protocol, or users who simply want to maximize the incentive?
@TermMax #TermMax
I noticed something interesting when looking at TermMax: the incentive around XP can quietly change why people move their capital in the first place.
If one vault or market offers a much stronger XP multiplier, it’s easy to imagine users chasing that opportunity instead of simply asking where their money is most useful or productive.
From the user’s perspective, that’s rational. If the protocol is rewarding activity, people will naturally optimize around the reward.
TermMax benefits too. More deposits mean deeper liquidity and more activity around its markets. That’s probably the point of the incentive.
But there’s another side to it.
Smaller users may move whatever capital they have toward the highest incentive. Larger players can do the same thing on a much bigger scale. If the rewards change, the liquidity can potentially change with them.
That creates an interesting distinction between genuine demand and incentive-driven activity.
When a few users do it, nobody really notices. But if thousands of users start making the same decision, liquidity could become increasingly sensitive to rewards rather than the actual usefulness of the market.
That doesn’t make the incentive good or bad. It just makes the human response worth watching.
At some point, does an incentive attract users who want to use the protocol, or users who simply want to maximize the incentive?
I noticed something interesting when looking at TermMax: the incentive around XP can quietly change why people move their capital in the first place.
If one vault or market offers a much stronger XP multiplier, it’s easy to imagine users chasing that opportunity instead of simply asking where their money is most useful or productive.
From the user’s perspective, that’s rational. If the protocol is rewarding activity, people will naturally optimize around the reward.
TermMax benefits too. More deposits mean deeper liquidity and more activity around its markets. That’s probably the point of the incentive.
But there’s another side to it.
Smaller users may move whatever capital they have toward the highest incentive. Larger players can do the same thing on a much bigger scale. If the rewards change, the liquidity can potentially change with them.
That creates an interesting distinction between genuine demand and incentive-driven activity.
When a few users do it, nobody really notices. But if thousands of users start making the same decision, liquidity could become increasingly sensitive to rewards rather than the actual usefulness of the market.
That doesn’t make the incentive good or bad. It just makes the human response worth watching.
At some point, does an incentive attract users who want to use the protocol, or users who simply want to maximize the incentive?

279
·
--
#TermMax @termmax
I noticed something interesting when looking at TermMax: the incentive can quietly change what users consider a “good” move.
If users can earn more XP by putting capital into certain vaults or staying active through trades, the natural reaction is to start thinking beyond the trade itself.
“Would I make this move anyway?” becomes “Is this move worth doing because it gives me more points?”
That distinction matters.
TermMax gets more activity, more liquidity, and more people interacting with the protocol. Users get a reason to participate even when the underlying opportunity isn't especially exciting. But the same incentive can also push smaller users into chasing activity, while larger players can potentially extract more value simply because they have more capital to deploy.
And that's where it gets interesting.
If enough people behave this way, the protocol can become very active without every transaction representing genuine demand. People aren't necessarily using the product because they need fixed-rate borrowing, lending, or options. They may be using it because the incentive makes sitting on the sidelines feel expensive.
Maybe that's exactly what TermMax wants during an early growth phase.
But eventually, the important question becomes harder to avoid: when the incentive disappears, how much of that activity remains?
Is the protocol creating users who actually want the product, or users who simply learned how to optimize the reward system?
#TermMax @TermMax
I noticed something interesting when looking at TermMax: the incentive can quietly change what users consider a “good” move.
If users can earn more XP by putting capital into certain vaults or staying active through trades, the natural reaction is to start thinking beyond the trade itself.
“Would I make this move anyway?” becomes “Is this move worth doing because it gives me more points?”
That distinction matters.
TermMax gets more activity, more liquidity, and more people interacting with the protocol. Users get a reason to participate even when the underlying opportunity isn't especially exciting. But the same incentive can also push smaller users into chasing activity, while larger players can potentially extract more value simply because they have more capital to deploy.
And that's where it gets interesting.
If enough people behave this way, the protocol can become very active without every transaction representing genuine demand. People aren't necessarily using the product because they need fixed-rate borrowing, lending, or options. They may be using it because the incentive makes sitting on the sidelines feel expensive.
Maybe that's exactly what TermMax wants during an early growth phase.
But eventually, the important question becomes harder to avoid: when the incentive disappears, how much of that activity remains?
Is the protocol creating users who actually want the product, or users who simply learned how to optimize the reward system?
I noticed something interesting when looking at TermMax: the incentive can quietly change what users consider a “good” move.
If users can earn more XP by putting capital into certain vaults or staying active through trades, the natural reaction is to start thinking beyond the trade itself.
“Would I make this move anyway?” becomes “Is this move worth doing because it gives me more points?”
That distinction matters.
TermMax gets more activity, more liquidity, and more people interacting with the protocol. Users get a reason to participate even when the underlying opportunity isn't especially exciting. But the same incentive can also push smaller users into chasing activity, while larger players can potentially extract more value simply because they have more capital to deploy.
And that's where it gets interesting.
If enough people behave this way, the protocol can become very active without every transaction representing genuine demand. People aren't necessarily using the product because they need fixed-rate borrowing, lending, or options. They may be using it because the incentive makes sitting on the sidelines feel expensive.
Maybe that's exactly what TermMax wants during an early growth phase.
But eventually, the important question becomes harder to avoid: when the incentive disappears, how much of that activity remains?
Is the protocol creating users who actually want the product, or users who simply learned how to optimize the reward system?
153
·
--
Bullish
$DEXE /USDT — Bulls Are Holding the Higher-Ground Structure
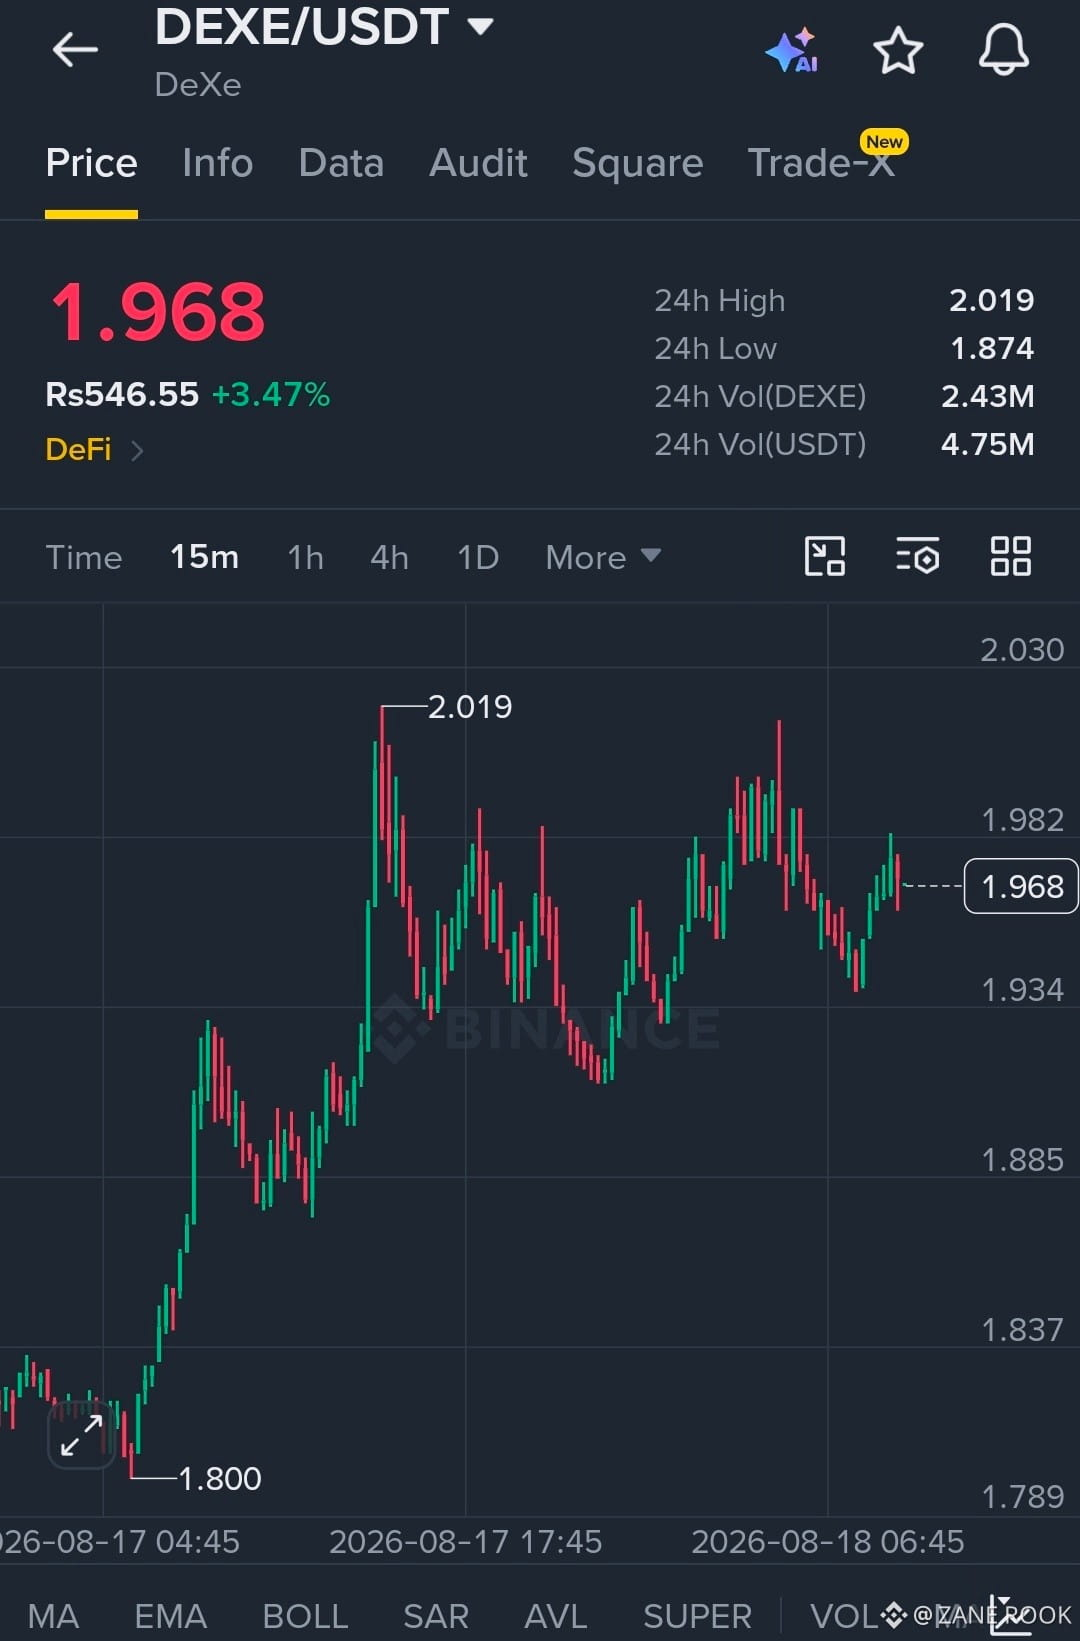
DEXE/USDT is showing a relatively strong structure on the 15-minute chart. Price is currently around 1.968, up 3.47%, after recovering strongly from the 1.800 area and reaching a recent high of 2.019.
The chart is now consolidating between roughly 1.934 and 1.982. Buyers have repeatedly stepped in around the 1.934 area, while sellers are defending the 1.982–2.019 resistance zone.
The key level now is 1.982.
If DEXE breaks above 1.982 and holds it on a 15-minute candle close, the market could retest 2.019. A clean breakout above 2.019 would strengthen the bullish setup and could open the way toward 2.050–2.080.
For the downside, 1.934 is the important support. Holding above this level keeps the short-term bullish structure alive.
TRADE IDEA — LONG
Entry Zone: 1.950–1.970
Stop Loss: 1.920
Target 1: 1.982
Target 2: 2.019
Target 3: 2.050
Target 4: 2.080
Trade Management:
The safer confirmation is a 15-minute candle closing above 1.982.
At Target 1, consider taking partial profit and protecting the remaining position.
If DEXE breaks 2.019 with strong buying pressure, the next upside targets are 2.050 and 2.080.
If price loses 1.934, the bullish structure becomes weaker. A break below the 1.920 stop-loss area invalidates this long setup.
Key levels:
Support: 1.934
Entry: 1.950–1.970
Breakout: 1.982
Major Resistance: 2.019
Stop Loss: 1.920
The setup is simple: buyers need to defend 1.934 and reclaim 1.982. Above 1.982, DEXE has a clear path toward the previous high at 2.019.
Let's trade the levels, not the emotions.
This is a chart-based setup from the provided 15-minute chart, not a guaranteed trade. Use proper position sizing and strict risk management.
$DEXE /USDT — Bulls Are Holding the Higher-Ground Structure
DEXE/USDT is showing a relatively strong structure on the 15-minute chart. Price is currently around 1.968, up 3.47%, after recovering strongly from the 1.800 area and reaching a recent high of 2.019.
The chart is now consolidating between roughly 1.934 and 1.982. Buyers have repeatedly stepped in around the 1.934 area, while sellers are defending the 1.982–2.019 resistance zone.
The key level now is 1.982.
If DEXE breaks above 1.982 and holds it on a 15-minute candle close, the market could retest 2.019. A clean breakout above 2.019 would strengthen the bullish setup and could open the way toward 2.050–2.080.
For the downside, 1.934 is the important support. Holding above this level keeps the short-term bullish structure alive.
TRADE IDEA — LONG
Entry Zone: 1.950–1.970
Stop Loss: 1.920
Target 1: 1.982
Target 2: 2.019
Target 3: 2.050
Target 4: 2.080
Trade Management:
The safer confirmation is a 15-minute candle closing above 1.982.
At Target 1, consider taking partial profit and protecting the remaining position.
If DEXE breaks 2.019 with strong buying pressure, the next upside targets are 2.050 and 2.080.
If price loses 1.934, the bullish structure becomes weaker. A break below the 1.920 stop-loss area invalidates this long setup.
Key levels:
Support: 1.934
Entry: 1.950–1.970
Breakout: 1.982
Major Resistance: 2.019
Stop Loss: 1.920
The setup is simple: buyers need to defend 1.934 and reclaim 1.982. Above 1.982, DEXE has a clear path toward the previous high at 2.019.
Let's trade the levels, not the emotions.
This is a chart-based setup from the provided 15-minute chart, not a guaranteed trade. Use proper position sizing and strict risk management.
DEXE/USDT is showing a relatively strong structure on the 15-minute chart. Price is currently around 1.968, up 3.47%, after recovering strongly from the 1.800 area and reaching a recent high of 2.019.
The chart is now consolidating between roughly 1.934 and 1.982. Buyers have repeatedly stepped in around the 1.934 area, while sellers are defending the 1.982–2.019 resistance zone.
The key level now is 1.982.
If DEXE breaks above 1.982 and holds it on a 15-minute candle close, the market could retest 2.019. A clean breakout above 2.019 would strengthen the bullish setup and could open the way toward 2.050–2.080.
For the downside, 1.934 is the important support. Holding above this level keeps the short-term bullish structure alive.
TRADE IDEA — LONG
Entry Zone: 1.950–1.970
Stop Loss: 1.920
Target 1: 1.982
Target 2: 2.019
Target 3: 2.050
Target 4: 2.080
Trade Management:
The safer confirmation is a 15-minute candle closing above 1.982.
At Target 1, consider taking partial profit and protecting the remaining position.
If DEXE breaks 2.019 with strong buying pressure, the next upside targets are 2.050 and 2.080.
If price loses 1.934, the bullish structure becomes weaker. A break below the 1.920 stop-loss area invalidates this long setup.
Key levels:
Support: 1.934
Entry: 1.950–1.970
Breakout: 1.982
Major Resistance: 2.019
Stop Loss: 1.920
The setup is simple: buyers need to defend 1.934 and reclaim 1.982. Above 1.982, DEXE has a clear path toward the previous high at 2.019.
Let's trade the levels, not the emotions.
This is a chart-based setup from the provided 15-minute chart, not a guaranteed trade. Use proper position sizing and strict risk management.
193
·
--
Bullish
$UNI I/USDT — Bulls Are Fighting Back From Strong Support
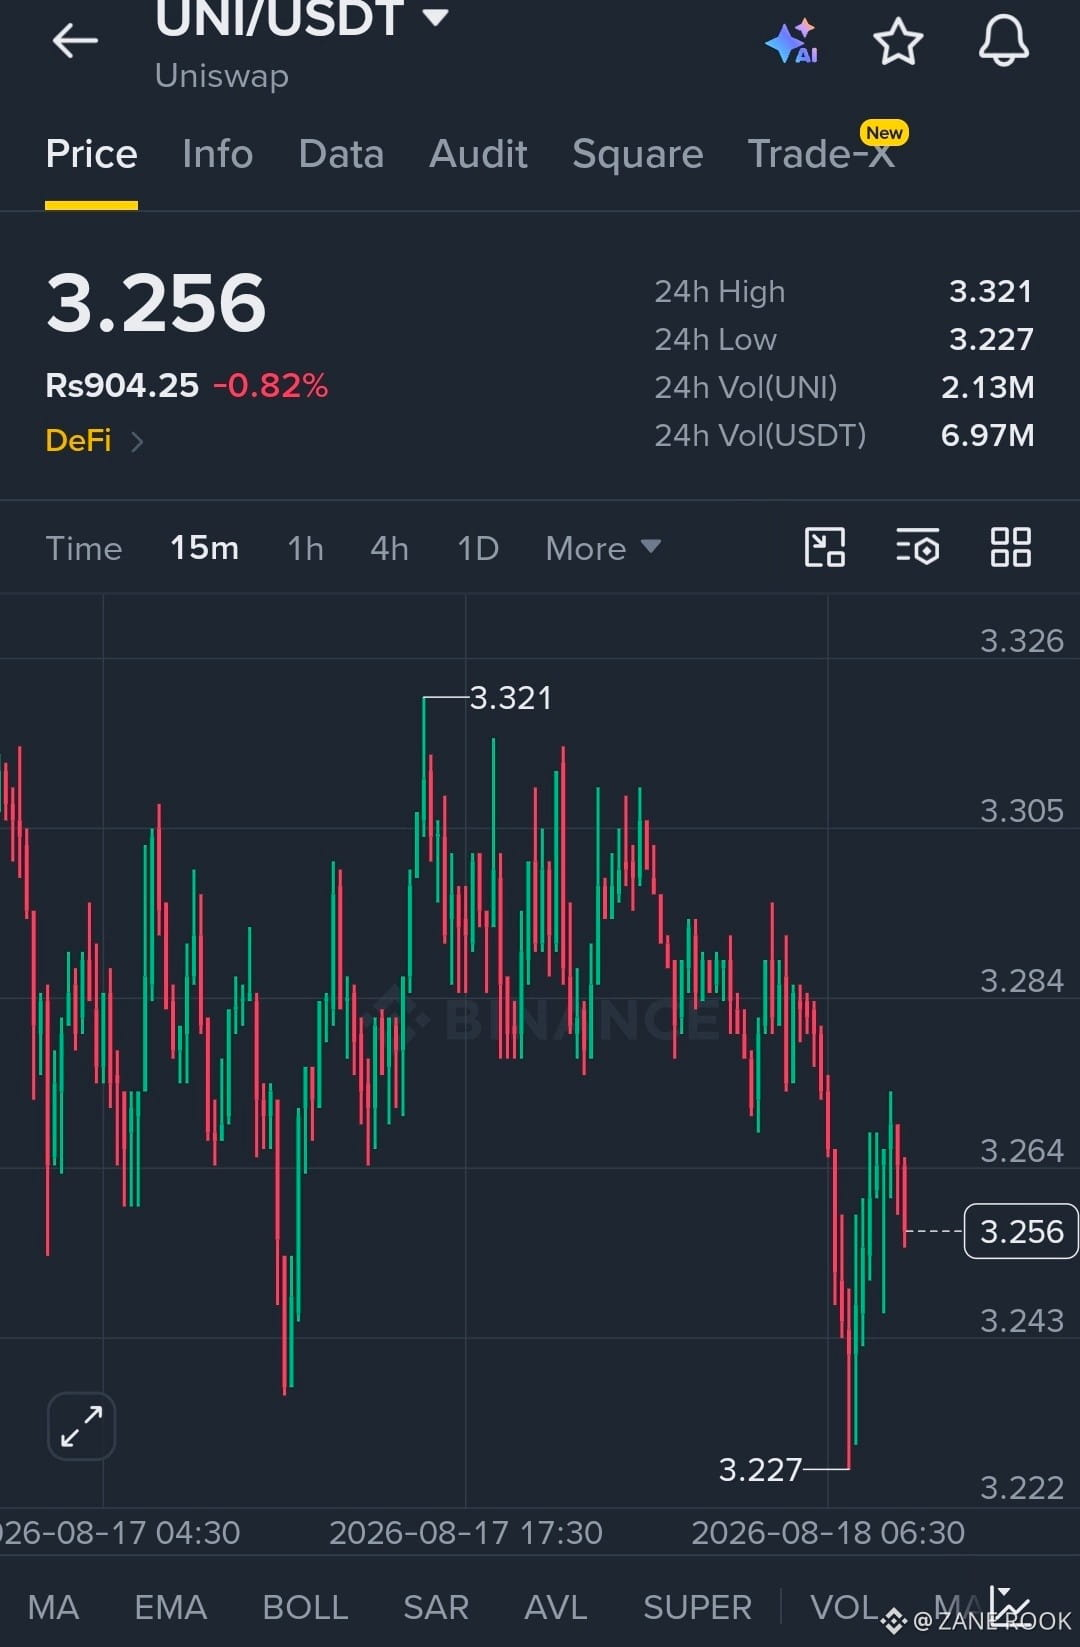
UNI/USDT is showing a potential short-term recovery setup on the 15-minute chart. Price is currently around 3.256 after a sharp drop that pushed the market down to the 24-hour low of 3.227.
The important reaction came from 3.227. Buyers stepped in aggressively from this level, pushing price back toward 3.264. That suggests the support zone is being defended for now.
The first resistance to watch is 3.264. A clean 15-minute close above this level could give UNI room to recover toward 3.284.
If buyers reclaim 3.284 with strong momentum, the next resistance levels are 3.305 and the previous high around 3.321.
Key support remains 3.227–3.243. If this zone continues to hold, the short-term recovery setup remains valid.
TRADE IDEA — LONG
Entry Zone: 3.245–3.260
Stop Loss: 3.220
Target 1: 3.264
Target 2: 3.284
Target 3: 3.305
Target 4: 3.320–3.321
Trade Management:
The safer confirmation is a 15-minute candle closing above 3.264.
At Target 1, consider taking partial profit and protecting the remaining position.
If UNI breaks above 3.284 with strong buying pressure, the next upside targets are 3.305 and 3.321.
If price falls below 3.227 and fails to reclaim it, the bullish setup is invalid. Avoid forcing the long trade below this support.
The setup is simple: 3.227 is the key defense zone, while 3.264 is the first level buyers need to reclaim. Above 3.284, the recovery structure becomes stronger.
Let's trade the levels, not the emotions.
This setup is based on the provided 15-minute chart and is not a guaranteed result. UNI can move quickly during volatility, so use proper position sizing and strict risk management.
$UNI I/USDT — Bulls Are Fighting Back From Strong Support
UNI/USDT is showing a potential short-term recovery setup on the 15-minute chart. Price is currently around 3.256 after a sharp drop that pushed the market down to the 24-hour low of 3.227.
The important reaction came from 3.227. Buyers stepped in aggressively from this level, pushing price back toward 3.264. That suggests the support zone is being defended for now.
The first resistance to watch is 3.264. A clean 15-minute close above this level could give UNI room to recover toward 3.284.
If buyers reclaim 3.284 with strong momentum, the next resistance levels are 3.305 and the previous high around 3.321.
Key support remains 3.227–3.243. If this zone continues to hold, the short-term recovery setup remains valid.
TRADE IDEA — LONG
Entry Zone: 3.245–3.260
Stop Loss: 3.220
Target 1: 3.264
Target 2: 3.284
Target 3: 3.305
Target 4: 3.320–3.321
Trade Management:
The safer confirmation is a 15-minute candle closing above 3.264.
At Target 1, consider taking partial profit and protecting the remaining position.
If UNI breaks above 3.284 with strong buying pressure, the next upside targets are 3.305 and 3.321.
If price falls below 3.227 and fails to reclaim it, the bullish setup is invalid. Avoid forcing the long trade below this support.
The setup is simple: 3.227 is the key defense zone, while 3.264 is the first level buyers need to reclaim. Above 3.284, the recovery structure becomes stronger.
Let's trade the levels, not the emotions.
This setup is based on the provided 15-minute chart and is not a guaranteed result. UNI can move quickly during volatility, so use proper position sizing and strict risk management.
UNI/USDT is showing a potential short-term recovery setup on the 15-minute chart. Price is currently around 3.256 after a sharp drop that pushed the market down to the 24-hour low of 3.227.
The important reaction came from 3.227. Buyers stepped in aggressively from this level, pushing price back toward 3.264. That suggests the support zone is being defended for now.
The first resistance to watch is 3.264. A clean 15-minute close above this level could give UNI room to recover toward 3.284.
If buyers reclaim 3.284 with strong momentum, the next resistance levels are 3.305 and the previous high around 3.321.
Key support remains 3.227–3.243. If this zone continues to hold, the short-term recovery setup remains valid.
TRADE IDEA — LONG
Entry Zone: 3.245–3.260
Stop Loss: 3.220
Target 1: 3.264
Target 2: 3.284
Target 3: 3.305
Target 4: 3.320–3.321
Trade Management:
The safer confirmation is a 15-minute candle closing above 3.264.
At Target 1, consider taking partial profit and protecting the remaining position.
If UNI breaks above 3.284 with strong buying pressure, the next upside targets are 3.305 and 3.321.
If price falls below 3.227 and fails to reclaim it, the bullish setup is invalid. Avoid forcing the long trade below this support.
The setup is simple: 3.227 is the key defense zone, while 3.264 is the first level buyers need to reclaim. Above 3.284, the recovery structure becomes stronger.
Let's trade the levels, not the emotions.
This setup is based on the provided 15-minute chart and is not a guaranteed result. UNI can move quickly during volatility, so use proper position sizing and strict risk management.
38
·
--
Bullish
$PEPE /USDT — Bulls Are Defending the Key Support
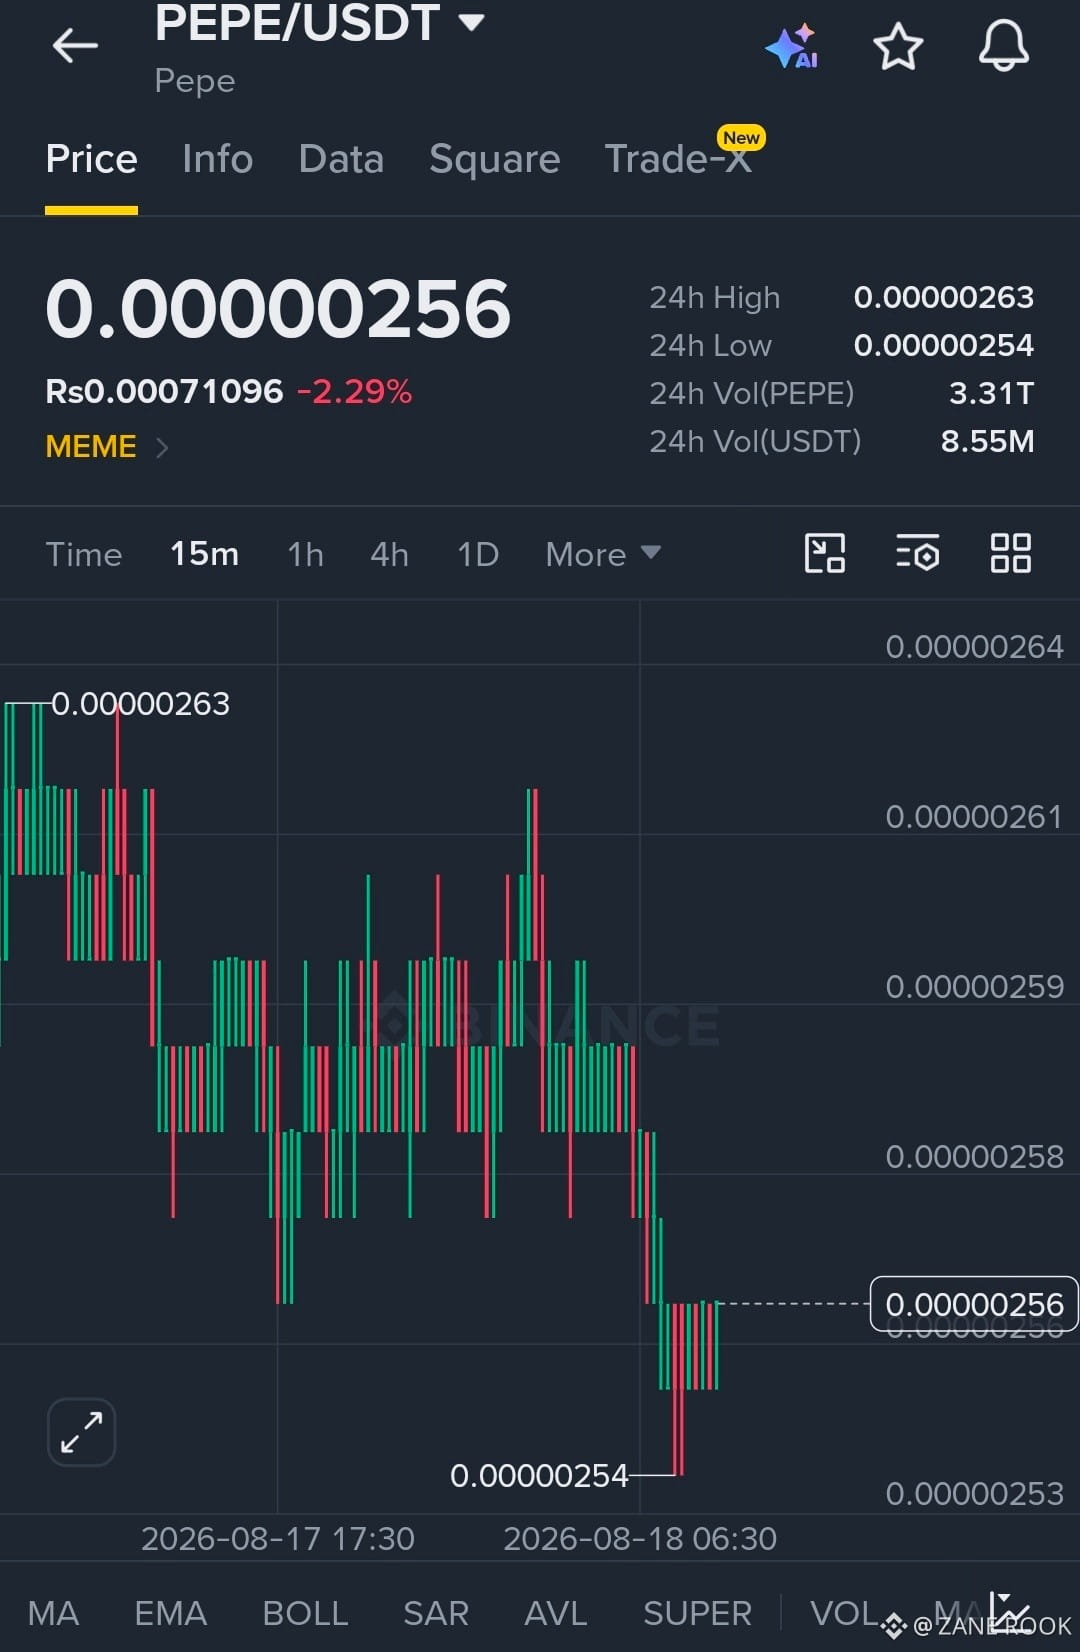
PEPE/USDT is trading around 0.00000256 on the 15-minute chart after a sharp drop toward the 24-hour low at 0.00000254.
The important part is the reaction from 0.00000254. Price bounced back and is now holding around 0.00000256, suggesting buyers are attempting to build a short-term base.
The immediate resistance is around 0.00000258–0.00000259. If PEPE reclaims this zone and holds above it, the recovery could extend toward 0.00000261 and then the recent high around 0.00000263.
Key support is 0.00000254. This level needs to hold for the bullish setup to remain valid.
TRADE IDEA — LONG
Entry Zone: 0.00000255–0.00000257
Stop Loss: 0.00000253
Target 1: 0.00000259
Target 2: 0.00000261
Target 3: 0.00000263
Trade Management:
The safer confirmation is a 15-minute candle closing above 0.00000258.
At Target 1, consider taking partial profit and moving the stop closer to breakeven.
A clean breakout above 0.00000261 could bring the 0.00000263 resistance back into focus.
If PEPE breaks below 0.00000254 and fails to recover, the long setup is invalid. Do not force the trade if support gives way.
The setup is simple: 0.00000254 is the defense zone, while 0.00000258–0.00000259 is the first breakout area. Reclaiming that resistance would give buyers a better chance of pushing higher.
Let's trade the levels, not the emotions.
This setup is based on the provided 15-minute chart and is not a guaranteed result. PEPE can be highly volatile, so use proper position sizing and strict risk management.
$PEPE /USDT — Bulls Are Defending the Key Support
PEPE/USDT is trading around 0.00000256 on the 15-minute chart after a sharp drop toward the 24-hour low at 0.00000254.
The important part is the reaction from 0.00000254. Price bounced back and is now holding around 0.00000256, suggesting buyers are attempting to build a short-term base.
The immediate resistance is around 0.00000258–0.00000259. If PEPE reclaims this zone and holds above it, the recovery could extend toward 0.00000261 and then the recent high around 0.00000263.
Key support is 0.00000254. This level needs to hold for the bullish setup to remain valid.
TRADE IDEA — LONG
Entry Zone: 0.00000255–0.00000257
Stop Loss: 0.00000253
Target 1: 0.00000259
Target 2: 0.00000261
Target 3: 0.00000263
Trade Management:
The safer confirmation is a 15-minute candle closing above 0.00000258.
At Target 1, consider taking partial profit and moving the stop closer to breakeven.
A clean breakout above 0.00000261 could bring the 0.00000263 resistance back into focus.
If PEPE breaks below 0.00000254 and fails to recover, the long setup is invalid. Do not force the trade if support gives way.
The setup is simple: 0.00000254 is the defense zone, while 0.00000258–0.00000259 is the first breakout area. Reclaiming that resistance would give buyers a better chance of pushing higher.
Let's trade the levels, not the emotions.
This setup is based on the provided 15-minute chart and is not a guaranteed result. PEPE can be highly volatile, so use proper position sizing and strict risk management.
PEPE/USDT is trading around 0.00000256 on the 15-minute chart after a sharp drop toward the 24-hour low at 0.00000254.
The important part is the reaction from 0.00000254. Price bounced back and is now holding around 0.00000256, suggesting buyers are attempting to build a short-term base.
The immediate resistance is around 0.00000258–0.00000259. If PEPE reclaims this zone and holds above it, the recovery could extend toward 0.00000261 and then the recent high around 0.00000263.
Key support is 0.00000254. This level needs to hold for the bullish setup to remain valid.
TRADE IDEA — LONG
Entry Zone: 0.00000255–0.00000257
Stop Loss: 0.00000253
Target 1: 0.00000259
Target 2: 0.00000261
Target 3: 0.00000263
Trade Management:
The safer confirmation is a 15-minute candle closing above 0.00000258.
At Target 1, consider taking partial profit and moving the stop closer to breakeven.
A clean breakout above 0.00000261 could bring the 0.00000263 resistance back into focus.
If PEPE breaks below 0.00000254 and fails to recover, the long setup is invalid. Do not force the trade if support gives way.
The setup is simple: 0.00000254 is the defense zone, while 0.00000258–0.00000259 is the first breakout area. Reclaiming that resistance would give buyers a better chance of pushing higher.
Let's trade the levels, not the emotions.
This setup is based on the provided 15-minute chart and is not a guaranteed result. PEPE can be highly volatile, so use proper position sizing and strict risk management.
1
143
·
--
Bullish
$FDUSD D/USDT — Buyers Are Holding the Support Strong
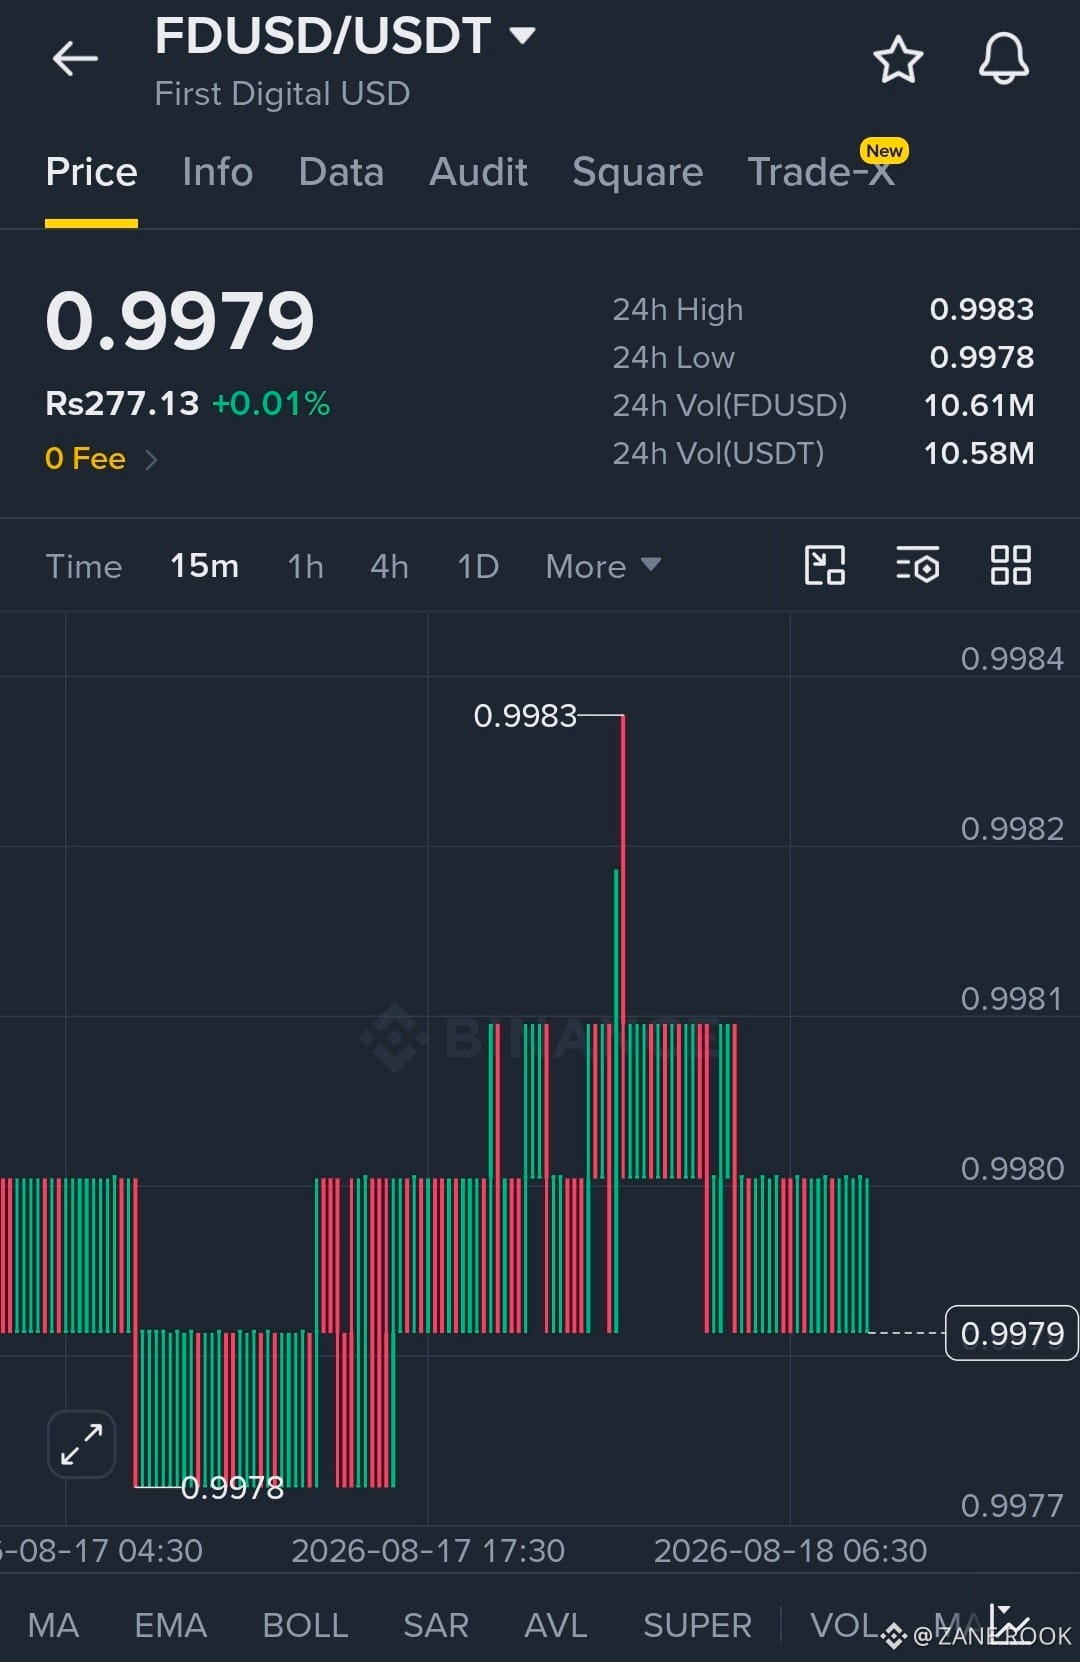
FDUSD/USDT is showing a very tight consolidation on the 15-minute chart, with price currently around 0.9979.
The chart is clearly range-bound. Price has repeatedly defended the 0.9978 area while buyers have been pushing back toward 0.9980–0.9981. The recent spike to 0.9983 shows that upside liquidity is present, but the market is still moving inside a very narrow range.
For this setup, the key level is 0.9981.
If FDUSD reclaims 0.9981 and holds above it, the next upside level is 0.9983. A clean break above 0.9983 would signal stronger bullish momentum.
On the downside, 0.9978 is the main support. A break below this level would weaken the setup.
TRADE IDEA — LONG
Entry Zone: 0.9979–0.9980
Stop Loss: 0.9977
Target 1: 0.9981
Target 2: 0.9983
Target 3: 0.9984
Trade Management:
The safer approach is to wait for price to hold above 0.9980 and then confirm a breakout through 0.9981.
At 0.9981, partial profit can be secured.
If price breaks 0.9983 with strong momentum, the remaining position can be held toward 0.9984.
If FDUSD falls below 0.9978, the long setup is invalid and it is better to stay out rather than force the trade.
This is a very tight-range setup, so the profit potential is limited compared with more volatile coins. The trade only makes sense with controlled position sizing and low execution costs.
Key levels:
Support: 0.9978
Entry: 0.9979–0.9980
Breakout: 0.9981
Resistance: 0.9983
Stop Loss: 0.9977
Let's trade the levels, not the emotions.
This setup is based on the provided 15-minute chart and is not a guaranteed result. Use proper risk management.
$FDUSD D/USDT — Buyers Are Holding the Support Strong
FDUSD/USDT is showing a very tight consolidation on the 15-minute chart, with price currently around 0.9979.
The chart is clearly range-bound. Price has repeatedly defended the 0.9978 area while buyers have been pushing back toward 0.9980–0.9981. The recent spike to 0.9983 shows that upside liquidity is present, but the market is still moving inside a very narrow range.
For this setup, the key level is 0.9981.
If FDUSD reclaims 0.9981 and holds above it, the next upside level is 0.9983. A clean break above 0.9983 would signal stronger bullish momentum.
On the downside, 0.9978 is the main support. A break below this level would weaken the setup.
TRADE IDEA — LONG
Entry Zone: 0.9979–0.9980
Stop Loss: 0.9977
Target 1: 0.9981
Target 2: 0.9983
Target 3: 0.9984
Trade Management:
The safer approach is to wait for price to hold above 0.9980 and then confirm a breakout through 0.9981.
At 0.9981, partial profit can be secured.
If price breaks 0.9983 with strong momentum, the remaining position can be held toward 0.9984.
If FDUSD falls below 0.9978, the long setup is invalid and it is better to stay out rather than force the trade.
This is a very tight-range setup, so the profit potential is limited compared with more volatile coins. The trade only makes sense with controlled position sizing and low execution costs.
Key levels:
Support: 0.9978
Entry: 0.9979–0.9980
Breakout: 0.9981
Resistance: 0.9983
Stop Loss: 0.9977
Let's trade the levels, not the emotions.
This setup is based on the provided 15-minute chart and is not a guaranteed result. Use proper risk management.
FDUSD/USDT is showing a very tight consolidation on the 15-minute chart, with price currently around 0.9979.
The chart is clearly range-bound. Price has repeatedly defended the 0.9978 area while buyers have been pushing back toward 0.9980–0.9981. The recent spike to 0.9983 shows that upside liquidity is present, but the market is still moving inside a very narrow range.
For this setup, the key level is 0.9981.
If FDUSD reclaims 0.9981 and holds above it, the next upside level is 0.9983. A clean break above 0.9983 would signal stronger bullish momentum.
On the downside, 0.9978 is the main support. A break below this level would weaken the setup.
TRADE IDEA — LONG
Entry Zone: 0.9979–0.9980
Stop Loss: 0.9977
Target 1: 0.9981
Target 2: 0.9983
Target 3: 0.9984
Trade Management:
The safer approach is to wait for price to hold above 0.9980 and then confirm a breakout through 0.9981.
At 0.9981, partial profit can be secured.
If price breaks 0.9983 with strong momentum, the remaining position can be held toward 0.9984.
If FDUSD falls below 0.9978, the long setup is invalid and it is better to stay out rather than force the trade.
This is a very tight-range setup, so the profit potential is limited compared with more volatile coins. The trade only makes sense with controlled position sizing and low execution costs.
Key levels:
Support: 0.9978
Entry: 0.9979–0.9980
Breakout: 0.9981
Resistance: 0.9983
Stop Loss: 0.9977
Let's trade the levels, not the emotions.
This setup is based on the provided 15-minute chart and is not a guaranteed result. Use proper risk management.
48
·
--
Bullish
$PUMP P/USDT — Bulls Are Building a Base
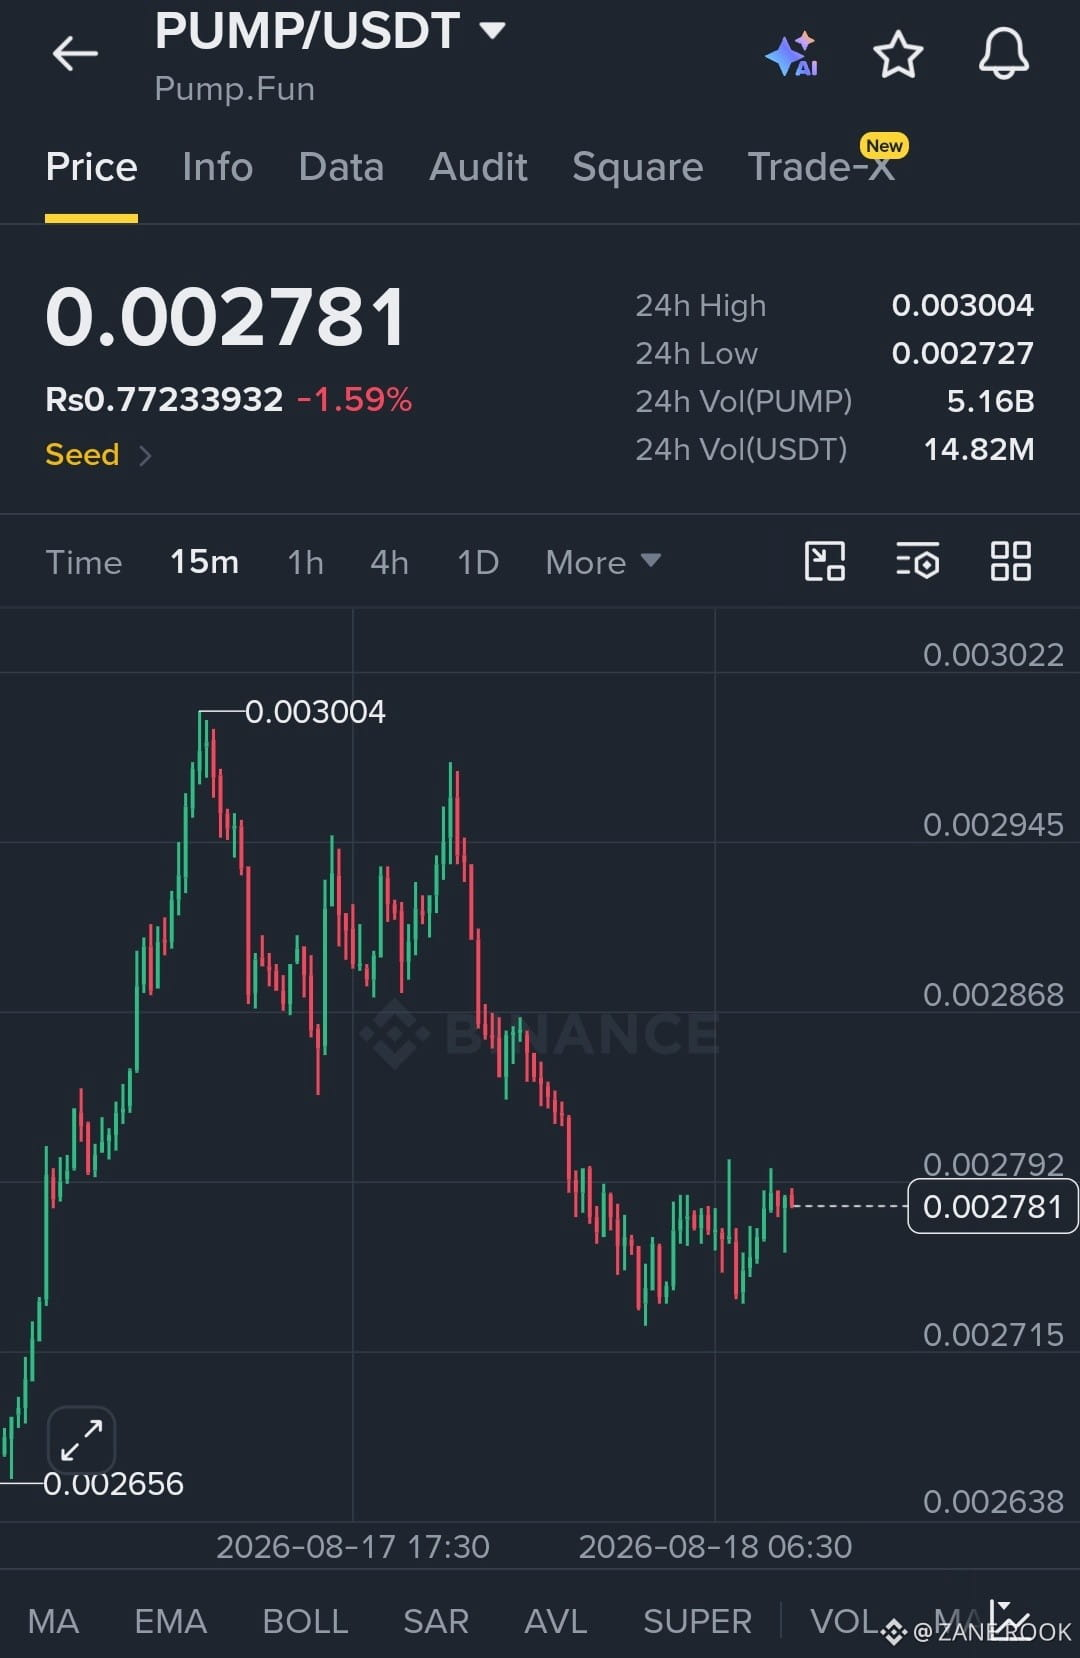
PUMP/USDT is showing signs of stabilization after a sharp decline from the 0.003004 high. Price is currently around 0.002781, with buyers repeatedly defending the 0.00272–0.00273 area.
On the 15-minute chart, the selling pressure has started to slow down and price is moving sideways near support. This could create a short-term rebound opportunity if buyers reclaim the nearby resistance.
The first level to watch is 0.002792. A clean breakout above this level could give PUMP room to move toward 0.002868.
If 0.002868 is reclaimed with strong momentum, the next resistance zones are around 0.002945 and 0.003004.
Key support remains around 0.002727. If this level holds, the bullish recovery setup remains valid.
TRADE IDEA — LONG
Entry Zone: 0.002750–0.002790
Stop Loss: 0.002705
Target 1: 0.002868
Target 2: 0.002945
Target 3: 0.003004
Trade Management:
The safer confirmation is a 15-minute candle closing above 0.002792.
At Target 1, consider securing partial profit and protecting the remaining position.
If price breaks 0.002868 with strong buying pressure, the next targets are 0.002945 and 0.003004.
If PUMP loses 0.002727 and fails to recover, the long setup is invalid. Avoid forcing the trade below this support.
The setup is straightforward: buyers need to defend 0.002727 and reclaim 0.002792. Above that level, the short-term recovery can gain momentum.
Let's trade the levels, not the emotions.
This setup is based on the provided 15-minute chart and is not a guaranteed result. PUMP can move quickly, so use proper position sizing and strict risk management.
$PUMP P/USDT — Bulls Are Building a Base
PUMP/USDT is showing signs of stabilization after a sharp decline from the 0.003004 high. Price is currently around 0.002781, with buyers repeatedly defending the 0.00272–0.00273 area.
On the 15-minute chart, the selling pressure has started to slow down and price is moving sideways near support. This could create a short-term rebound opportunity if buyers reclaim the nearby resistance.
The first level to watch is 0.002792. A clean breakout above this level could give PUMP room to move toward 0.002868.
If 0.002868 is reclaimed with strong momentum, the next resistance zones are around 0.002945 and 0.003004.
Key support remains around 0.002727. If this level holds, the bullish recovery setup remains valid.
TRADE IDEA — LONG
Entry Zone: 0.002750–0.002790
Stop Loss: 0.002705
Target 1: 0.002868
Target 2: 0.002945
Target 3: 0.003004
Trade Management:
The safer confirmation is a 15-minute candle closing above 0.002792.
At Target 1, consider securing partial profit and protecting the remaining position.
If price breaks 0.002868 with strong buying pressure, the next targets are 0.002945 and 0.003004.
If PUMP loses 0.002727 and fails to recover, the long setup is invalid. Avoid forcing the trade below this support.
The setup is straightforward: buyers need to defend 0.002727 and reclaim 0.002792. Above that level, the short-term recovery can gain momentum.
Let's trade the levels, not the emotions.
This setup is based on the provided 15-minute chart and is not a guaranteed result. PUMP can move quickly, so use proper position sizing and strict risk management.
PUMP/USDT is showing signs of stabilization after a sharp decline from the 0.003004 high. Price is currently around 0.002781, with buyers repeatedly defending the 0.00272–0.00273 area.
On the 15-minute chart, the selling pressure has started to slow down and price is moving sideways near support. This could create a short-term rebound opportunity if buyers reclaim the nearby resistance.
The first level to watch is 0.002792. A clean breakout above this level could give PUMP room to move toward 0.002868.
If 0.002868 is reclaimed with strong momentum, the next resistance zones are around 0.002945 and 0.003004.
Key support remains around 0.002727. If this level holds, the bullish recovery setup remains valid.
TRADE IDEA — LONG
Entry Zone: 0.002750–0.002790
Stop Loss: 0.002705
Target 1: 0.002868
Target 2: 0.002945
Target 3: 0.003004
Trade Management:
The safer confirmation is a 15-minute candle closing above 0.002792.
At Target 1, consider securing partial profit and protecting the remaining position.
If price breaks 0.002868 with strong buying pressure, the next targets are 0.002945 and 0.003004.
If PUMP loses 0.002727 and fails to recover, the long setup is invalid. Avoid forcing the trade below this support.
The setup is straightforward: buyers need to defend 0.002727 and reclaim 0.002792. Above that level, the short-term recovery can gain momentum.
Let's trade the levels, not the emotions.
This setup is based on the provided 15-minute chart and is not a guaranteed result. PUMP can move quickly, so use proper position sizing and strict risk management.
68
·
--
Bullish
$PORTAL TAL/USDT — Bulls Are Looking for a Rebound
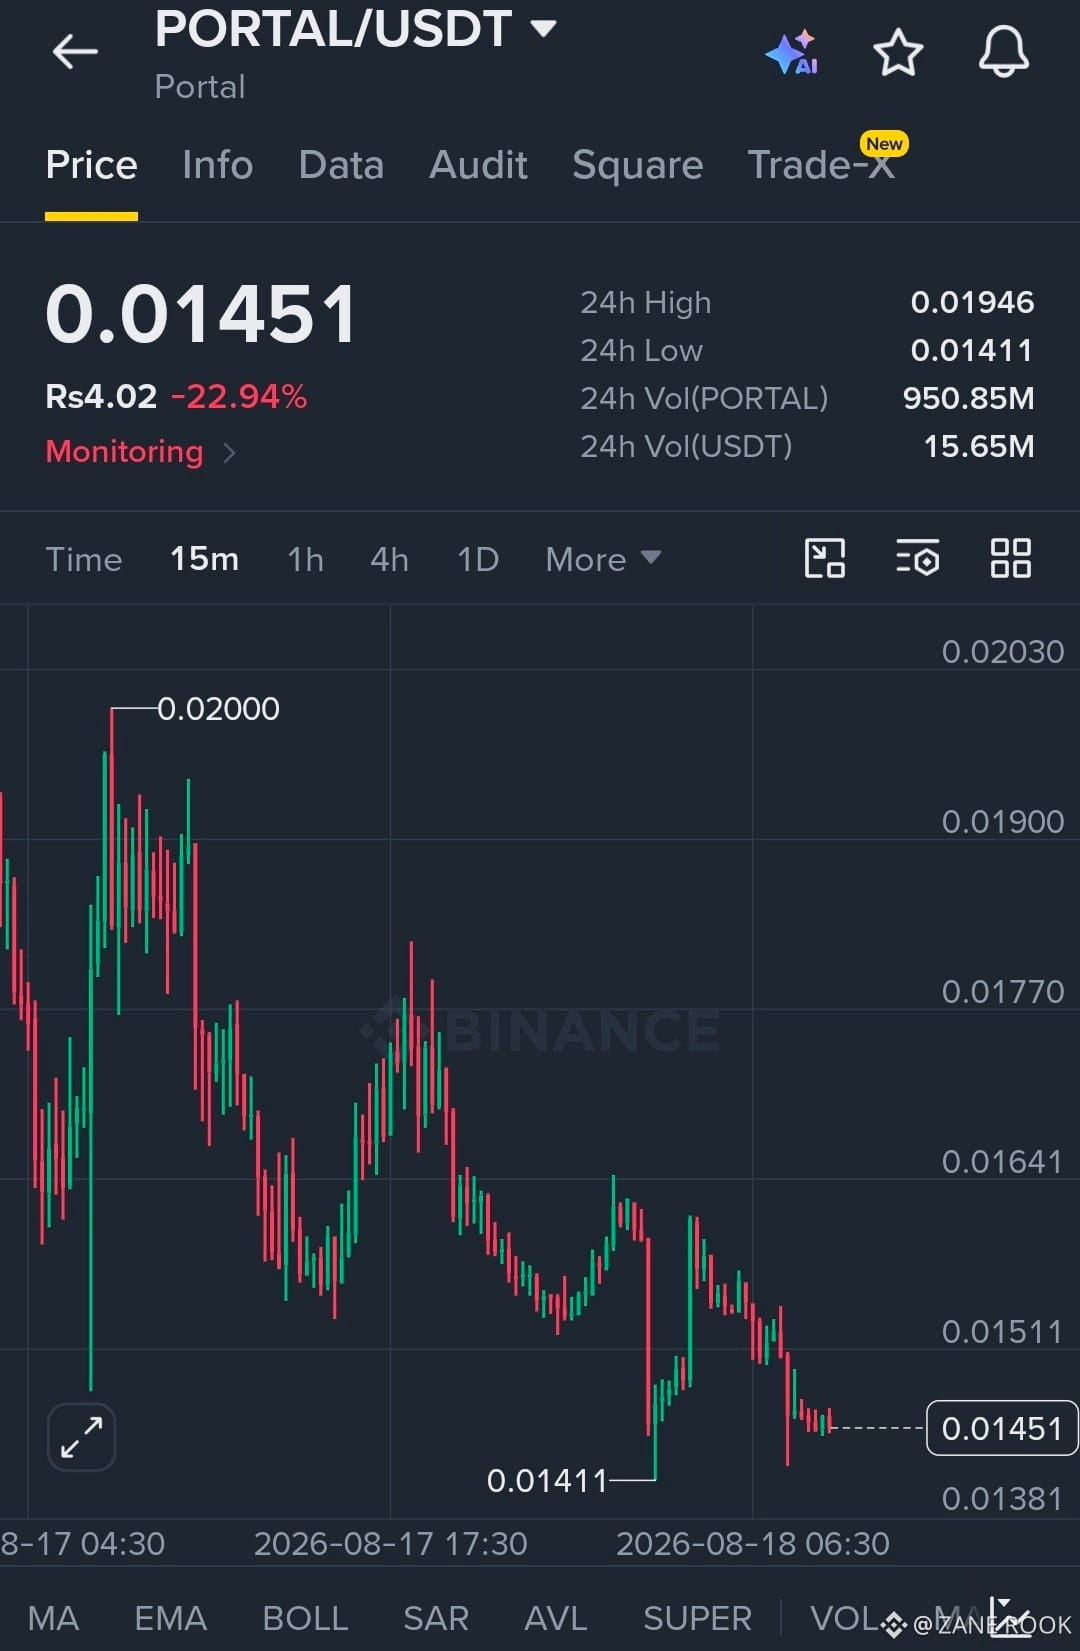
PORTAL/USDT is sitting near 0.01451 after a major sell-off, with the price currently close to the 24-hour low of 0.01411. The market is heavily oversold on this short-term chart, but the trend is still under pressure.
The key opportunity here is a potential bounce from the 0.01411 support area.
Buyers need to defend 0.01411 and push price back above 0.01511. If that happens, PORTAL could start recovering toward the higher resistance zones.
The important levels are clear:
Support: 0.01411
First resistance: 0.01511
Second resistance: 0.01641
Major resistance: 0.01770
Previous major high: 0.02000
TRADE IDEA — LONG
Entry Zone: 0.01415–0.01445
Stop Loss: 0.01375
Target 1: 0.01510
Target 2: 0.01640
Target 3: 0.01770
Target 4: 0.01900–0.02000
Trade Management:
The first confirmation is a recovery above 0.01450 followed by a 15-minute close above 0.01511.
At Target 1, consider taking partial profit and protecting the remaining position.
If 0.01641 breaks with strong buying pressure, the recovery could extend toward 0.01770 and potentially higher.
However, 0.01411 is the critical defense level. If price breaks below 0.01411 and remains there, the long setup is invalid. Do not keep averaging into a falling market.
The bullish case is based on a support reaction, not on the current trend being fully reversed. PORTAL needs to reclaim 0.01511 first, then 0.01641, to prove that buyers are actually returning.
Let's trade the levels, not the emotions.
This is a chart-based setup from the provided 15-minute chart and is not a guaranteed trade. PORTAL is highly volatile, so use controlled position sizing and strict risk management.
$PORTAL TAL/USDT — Bulls Are Looking for a Rebound
PORTAL/USDT is sitting near 0.01451 after a major sell-off, with the price currently close to the 24-hour low of 0.01411. The market is heavily oversold on this short-term chart, but the trend is still under pressure.
The key opportunity here is a potential bounce from the 0.01411 support area.
Buyers need to defend 0.01411 and push price back above 0.01511. If that happens, PORTAL could start recovering toward the higher resistance zones.
The important levels are clear:
Support: 0.01411
First resistance: 0.01511
Second resistance: 0.01641
Major resistance: 0.01770
Previous major high: 0.02000
TRADE IDEA — LONG
Entry Zone: 0.01415–0.01445
Stop Loss: 0.01375
Target 1: 0.01510
Target 2: 0.01640
Target 3: 0.01770
Target 4: 0.01900–0.02000
Trade Management:
The first confirmation is a recovery above 0.01450 followed by a 15-minute close above 0.01511.
At Target 1, consider taking partial profit and protecting the remaining position.
If 0.01641 breaks with strong buying pressure, the recovery could extend toward 0.01770 and potentially higher.
However, 0.01411 is the critical defense level. If price breaks below 0.01411 and remains there, the long setup is invalid. Do not keep averaging into a falling market.
The bullish case is based on a support reaction, not on the current trend being fully reversed. PORTAL needs to reclaim 0.01511 first, then 0.01641, to prove that buyers are actually returning.
Let's trade the levels, not the emotions.
This is a chart-based setup from the provided 15-minute chart and is not a guaranteed trade. PORTAL is highly volatile, so use controlled position sizing and strict risk management.
PORTAL/USDT is sitting near 0.01451 after a major sell-off, with the price currently close to the 24-hour low of 0.01411. The market is heavily oversold on this short-term chart, but the trend is still under pressure.
The key opportunity here is a potential bounce from the 0.01411 support area.
Buyers need to defend 0.01411 and push price back above 0.01511. If that happens, PORTAL could start recovering toward the higher resistance zones.
The important levels are clear:
Support: 0.01411
First resistance: 0.01511
Second resistance: 0.01641
Major resistance: 0.01770
Previous major high: 0.02000
TRADE IDEA — LONG
Entry Zone: 0.01415–0.01445
Stop Loss: 0.01375
Target 1: 0.01510
Target 2: 0.01640
Target 3: 0.01770
Target 4: 0.01900–0.02000
Trade Management:
The first confirmation is a recovery above 0.01450 followed by a 15-minute close above 0.01511.
At Target 1, consider taking partial profit and protecting the remaining position.
If 0.01641 breaks with strong buying pressure, the recovery could extend toward 0.01770 and potentially higher.
However, 0.01411 is the critical defense level. If price breaks below 0.01411 and remains there, the long setup is invalid. Do not keep averaging into a falling market.
The bullish case is based on a support reaction, not on the current trend being fully reversed. PORTAL needs to reclaim 0.01511 first, then 0.01641, to prove that buyers are actually returning.
Let's trade the levels, not the emotions.
This is a chart-based setup from the provided 15-minute chart and is not a guaranteed trade. PORTAL is highly volatile, so use controlled position sizing and strict risk management.
118
·
--
Bullish
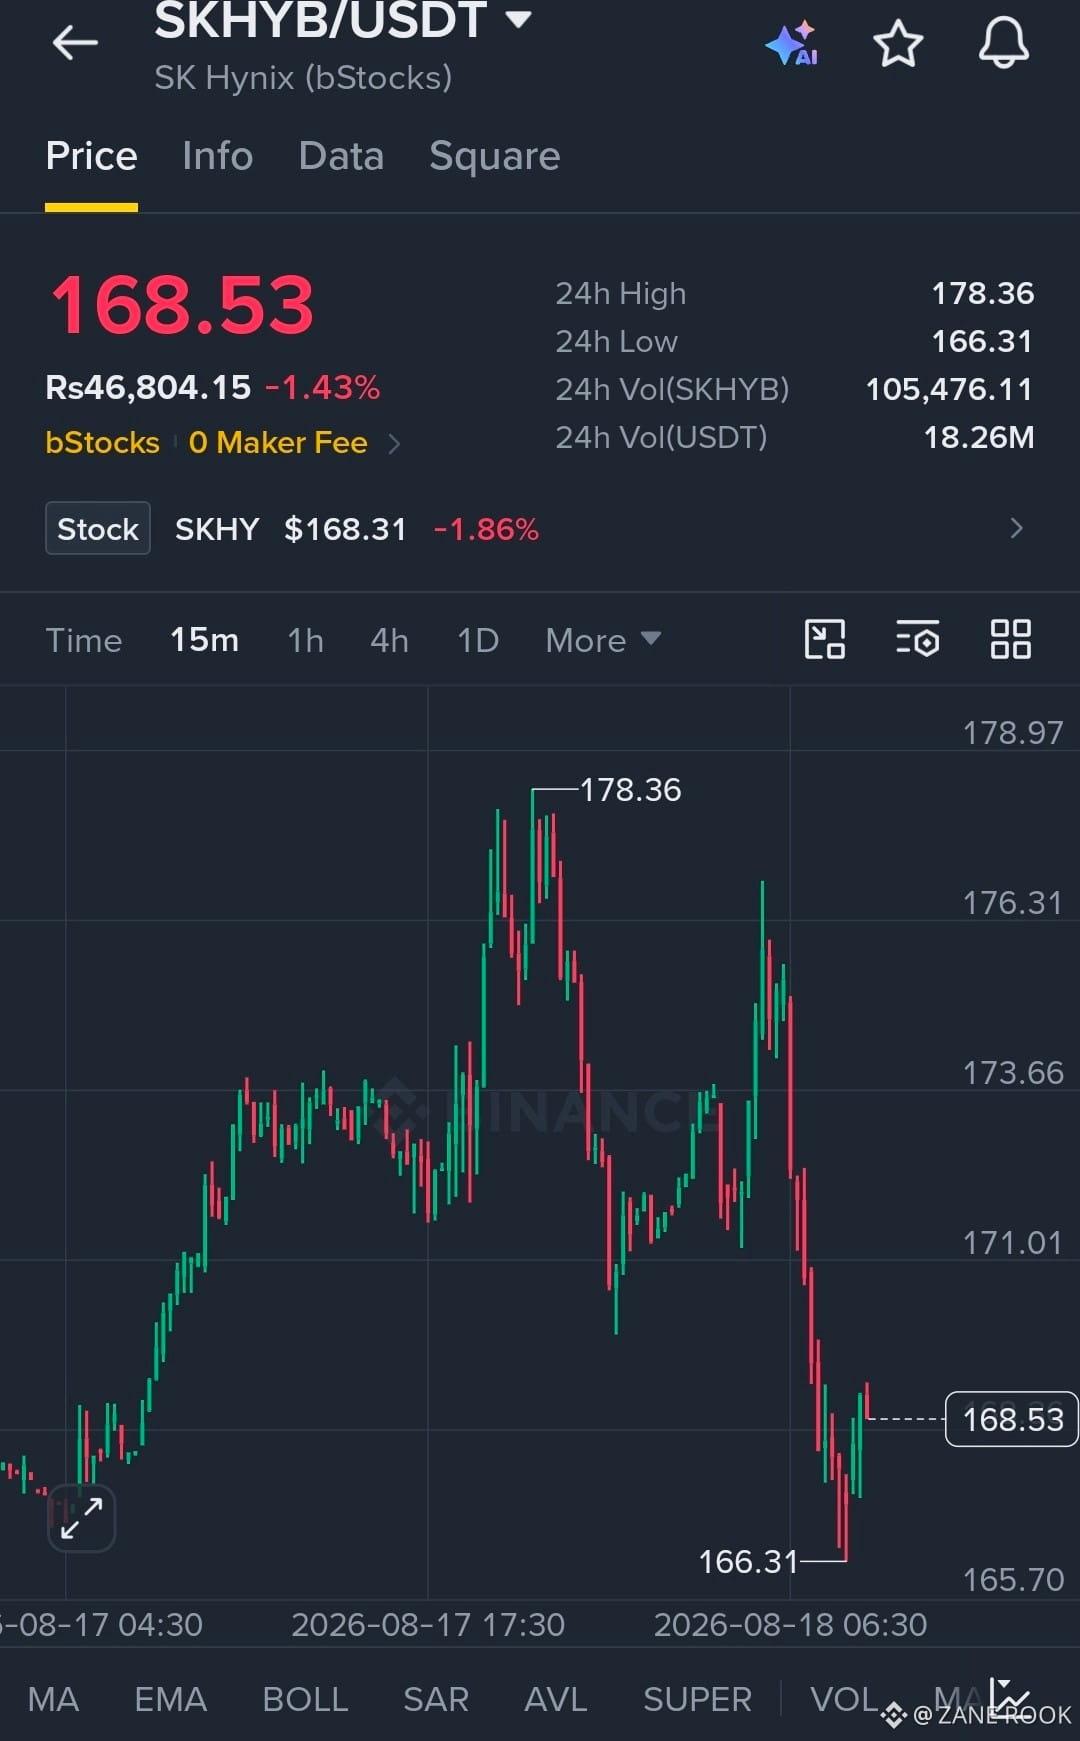
$SKHYB YB/USDT — Bulls Are Trying to Reclaim Control
SKHYB/USDT is showing a possible bullish recovery setup after a sharp sell-off on the 15-minute chart.
Price is currently around 168.53 after falling from the 176–178 area and touching the 24-hour low at 166.31. The important part is that buyers reacted from 166.31 and price has started bouncing back toward 168.50.
The 166.31 level is the key support to watch. If buyers continue defending this area, SKHYB could attempt a recovery toward the resistance levels above.
The first important resistance is 171.01.
A breakout above 171.01 could push price toward 173.66. If that level is reclaimed with strong momentum, the next zones are 176.31 and 178.36.
TRADE IDEA — LONG
Entry Zone: 167.50–169.00
Stop Loss: 165.70
Target 1: 171.00
Target 2: 173.65
Target 3: 176.30
Target 4: 178.30–178.36
Trade Management:
The main confirmation is a sustained move back above 169.00–171.00.
If price reaches 171.00, consider taking partial profit and protecting the remaining position.
A clean break above 173.66 would strengthen the recovery setup and bring 176.31–178.36 into focus.
The bullish setup becomes invalid if price breaks below 166.31 and fails to recover. In that situation, avoid forcing the long trade.
The setup is based on a simple idea: 166.31 is the defense zone, while 171.01 is the first major level buyers need to reclaim.
Let's trade the levels, not the emotions.
This is a chart-based trade idea, not a guaranteed outcome. SKHYB is volatile, so use proper position sizing and controlled risk.
$SKHYB YB/USDT — Bulls Are Trying to Reclaim Control
SKHYB/USDT is showing a possible bullish recovery setup after a sharp sell-off on the 15-minute chart.
Price is currently around 168.53 after falling from the 176–178 area and touching the 24-hour low at 166.31. The important part is that buyers reacted from 166.31 and price has started bouncing back toward 168.50.
The 166.31 level is the key support to watch. If buyers continue defending this area, SKHYB could attempt a recovery toward the resistance levels above.
The first important resistance is 171.01.
A breakout above 171.01 could push price toward 173.66. If that level is reclaimed with strong momentum, the next zones are 176.31 and 178.36.
TRADE IDEA — LONG
Entry Zone: 167.50–169.00
Stop Loss: 165.70
Target 1: 171.00
Target 2: 173.65
Target 3: 176.30
Target 4: 178.30–178.36
Trade Management:
The main confirmation is a sustained move back above 169.00–171.00.
If price reaches 171.00, consider taking partial profit and protecting the remaining position.
A clean break above 173.66 would strengthen the recovery setup and bring 176.31–178.36 into focus.
The bullish setup becomes invalid if price breaks below 166.31 and fails to recover. In that situation, avoid forcing the long trade.
The setup is based on a simple idea: 166.31 is the defense zone, while 171.01 is the first major level buyers need to reclaim.
Let's trade the levels, not the emotions.
This is a chart-based trade idea, not a guaranteed outcome. SKHYB is volatile, so use proper position sizing and controlled risk.
SKHYB/USDT is showing a possible bullish recovery setup after a sharp sell-off on the 15-minute chart.
Price is currently around 168.53 after falling from the 176–178 area and touching the 24-hour low at 166.31. The important part is that buyers reacted from 166.31 and price has started bouncing back toward 168.50.
The 166.31 level is the key support to watch. If buyers continue defending this area, SKHYB could attempt a recovery toward the resistance levels above.
The first important resistance is 171.01.
A breakout above 171.01 could push price toward 173.66. If that level is reclaimed with strong momentum, the next zones are 176.31 and 178.36.
TRADE IDEA — LONG
Entry Zone: 167.50–169.00
Stop Loss: 165.70
Target 1: 171.00
Target 2: 173.65
Target 3: 176.30
Target 4: 178.30–178.36
Trade Management:
The main confirmation is a sustained move back above 169.00–171.00.
If price reaches 171.00, consider taking partial profit and protecting the remaining position.
A clean break above 173.66 would strengthen the recovery setup and bring 176.31–178.36 into focus.
The bullish setup becomes invalid if price breaks below 166.31 and fails to recover. In that situation, avoid forcing the long trade.
The setup is based on a simple idea: 166.31 is the defense zone, while 171.01 is the first major level buyers need to reclaim.
Let's trade the levels, not the emotions.
This is a chart-based trade idea, not a guaranteed outcome. SKHYB is volatile, so use proper position sizing and controlled risk.
56
·
--
Bullish
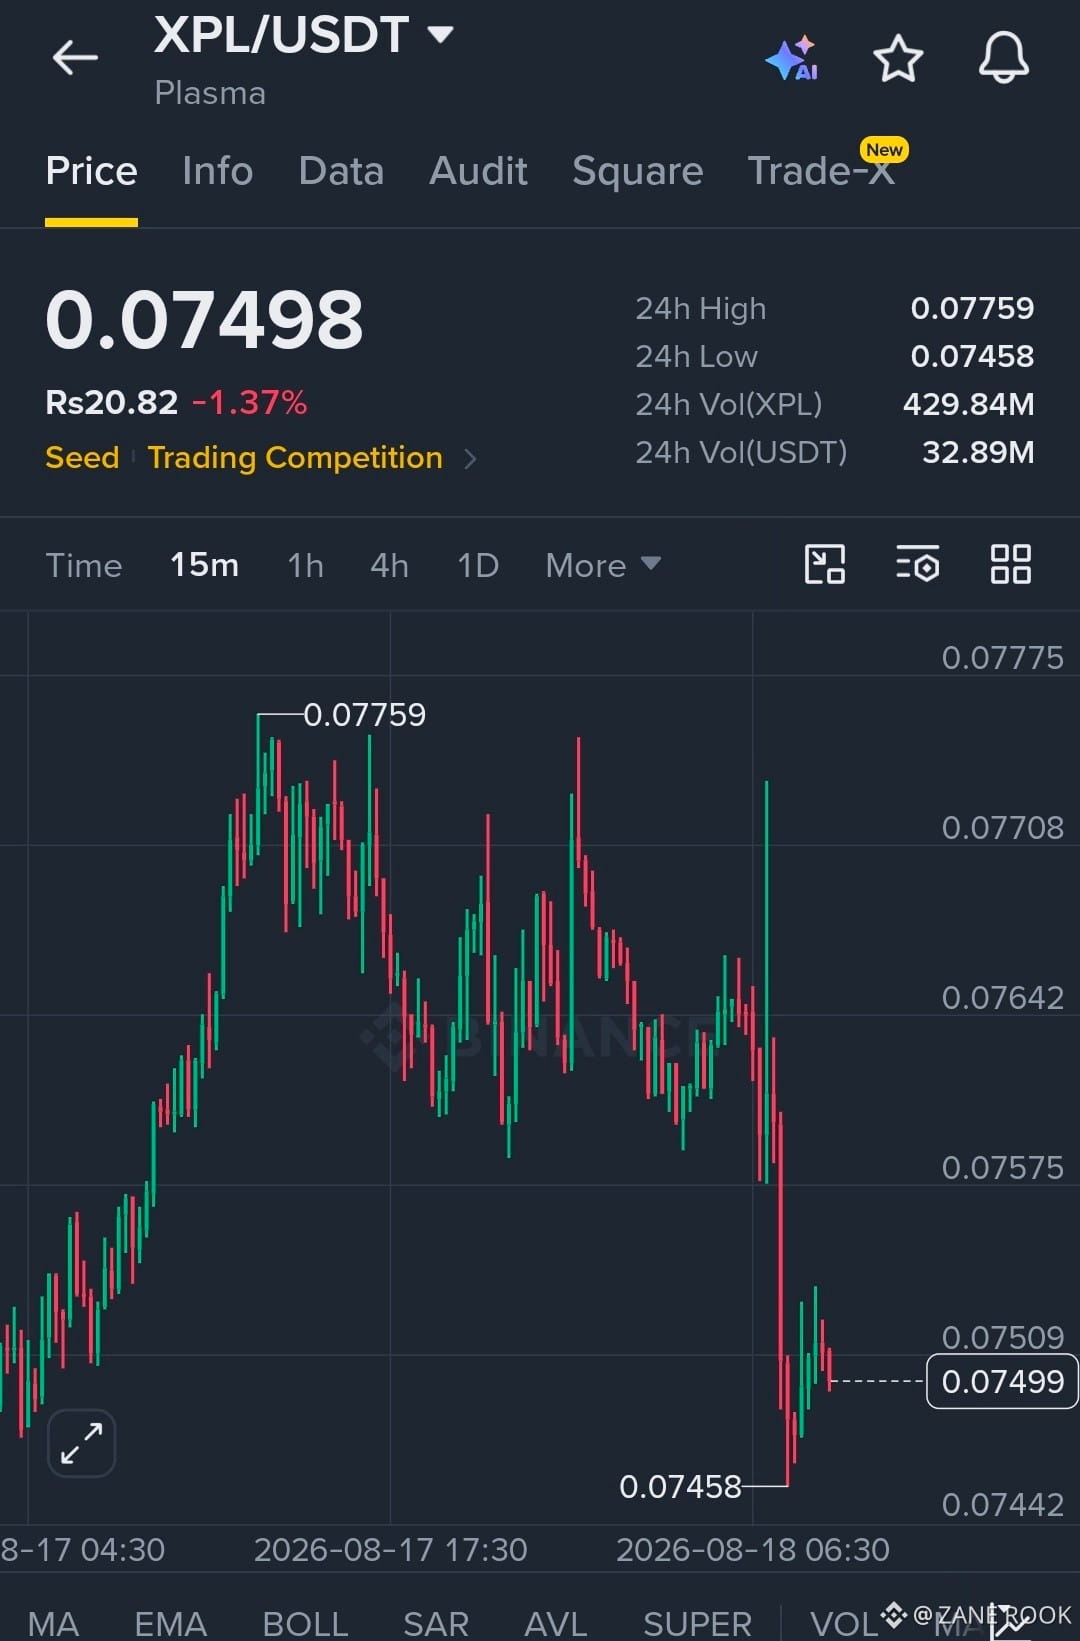
$XPL L/USDT — Buyers Are Defending the Dip
XPL/USDT is showing an interesting recovery setup on the 15-minute chart. Price is currently around 0.07498 after a sharp sell-off that pushed the market down to the 24-hour low at 0.07458.
The important point is that buyers reacted quickly from 0.07458, and price is now trying to stabilize around 0.07500.
This is a high-volatility setup, so confirmation matters.
The immediate resistance is around 0.07509. If XPL can reclaim this level and hold above it, the recovery could continue toward 0.07575 and then 0.07642.
A stronger breakout above 0.07642 would improve the bullish structure and could bring 0.07708 and the previous high around 0.07759 back into focus.
TRADE IDEA — LONG
Entry Zone: 0.07475–0.07505
Stop Loss: 0.07435
Target 1: 0.07575
Target 2: 0.07642
Target 3: 0.07708
Target 4: 0.07755–0.07759
Trade Management:
The first confirmation to watch is a 15-minute candle closing back above 0.07509.
If price reaches 0.07575, partial profit can be secured and the stop loss can be moved closer to breakeven.
A clean break above 0.07642 would strengthen the bullish recovery and make 0.07708–0.07759 the next important upside zone.
However, if XPL breaks below 0.07458 and fails to recover, the bullish setup is invalid. Do not force the long trade below that support.
The setup is simple: buyers need to defend 0.07458 and reclaim 0.07509. Above those levels, the recovery has room to develop.
Let's trade the levels, not the emotions.
This trade idea is based only on the chart provided. Crypto markets are volatile, so use controlled position sizing and never risk more than you can afford to lose.
$XPL L/USDT — Buyers Are Defending the Dip
XPL/USDT is showing an interesting recovery setup on the 15-minute chart. Price is currently around 0.07498 after a sharp sell-off that pushed the market down to the 24-hour low at 0.07458.
The important point is that buyers reacted quickly from 0.07458, and price is now trying to stabilize around 0.07500.
This is a high-volatility setup, so confirmation matters.
The immediate resistance is around 0.07509. If XPL can reclaim this level and hold above it, the recovery could continue toward 0.07575 and then 0.07642.
A stronger breakout above 0.07642 would improve the bullish structure and could bring 0.07708 and the previous high around 0.07759 back into focus.
TRADE IDEA — LONG
Entry Zone: 0.07475–0.07505
Stop Loss: 0.07435
Target 1: 0.07575
Target 2: 0.07642
Target 3: 0.07708
Target 4: 0.07755–0.07759
Trade Management:
The first confirmation to watch is a 15-minute candle closing back above 0.07509.
If price reaches 0.07575, partial profit can be secured and the stop loss can be moved closer to breakeven.
A clean break above 0.07642 would strengthen the bullish recovery and make 0.07708–0.07759 the next important upside zone.
However, if XPL breaks below 0.07458 and fails to recover, the bullish setup is invalid. Do not force the long trade below that support.
The setup is simple: buyers need to defend 0.07458 and reclaim 0.07509. Above those levels, the recovery has room to develop.
Let's trade the levels, not the emotions.
This trade idea is based only on the chart provided. Crypto markets are volatile, so use controlled position sizing and never risk more than you can afford to lose.
XPL/USDT is showing an interesting recovery setup on the 15-minute chart. Price is currently around 0.07498 after a sharp sell-off that pushed the market down to the 24-hour low at 0.07458.
The important point is that buyers reacted quickly from 0.07458, and price is now trying to stabilize around 0.07500.
This is a high-volatility setup, so confirmation matters.
The immediate resistance is around 0.07509. If XPL can reclaim this level and hold above it, the recovery could continue toward 0.07575 and then 0.07642.
A stronger breakout above 0.07642 would improve the bullish structure and could bring 0.07708 and the previous high around 0.07759 back into focus.
TRADE IDEA — LONG
Entry Zone: 0.07475–0.07505
Stop Loss: 0.07435
Target 1: 0.07575
Target 2: 0.07642
Target 3: 0.07708
Target 4: 0.07755–0.07759
Trade Management:
The first confirmation to watch is a 15-minute candle closing back above 0.07509.
If price reaches 0.07575, partial profit can be secured and the stop loss can be moved closer to breakeven.
A clean break above 0.07642 would strengthen the bullish recovery and make 0.07708–0.07759 the next important upside zone.
However, if XPL breaks below 0.07458 and fails to recover, the bullish setup is invalid. Do not force the long trade below that support.
The setup is simple: buyers need to defend 0.07458 and reclaim 0.07509. Above those levels, the recovery has room to develop.
Let's trade the levels, not the emotions.
This trade idea is based only on the chart provided. Crypto markets are volatile, so use controlled position sizing and never risk more than you can afford to lose.
100
·
--
Bullish
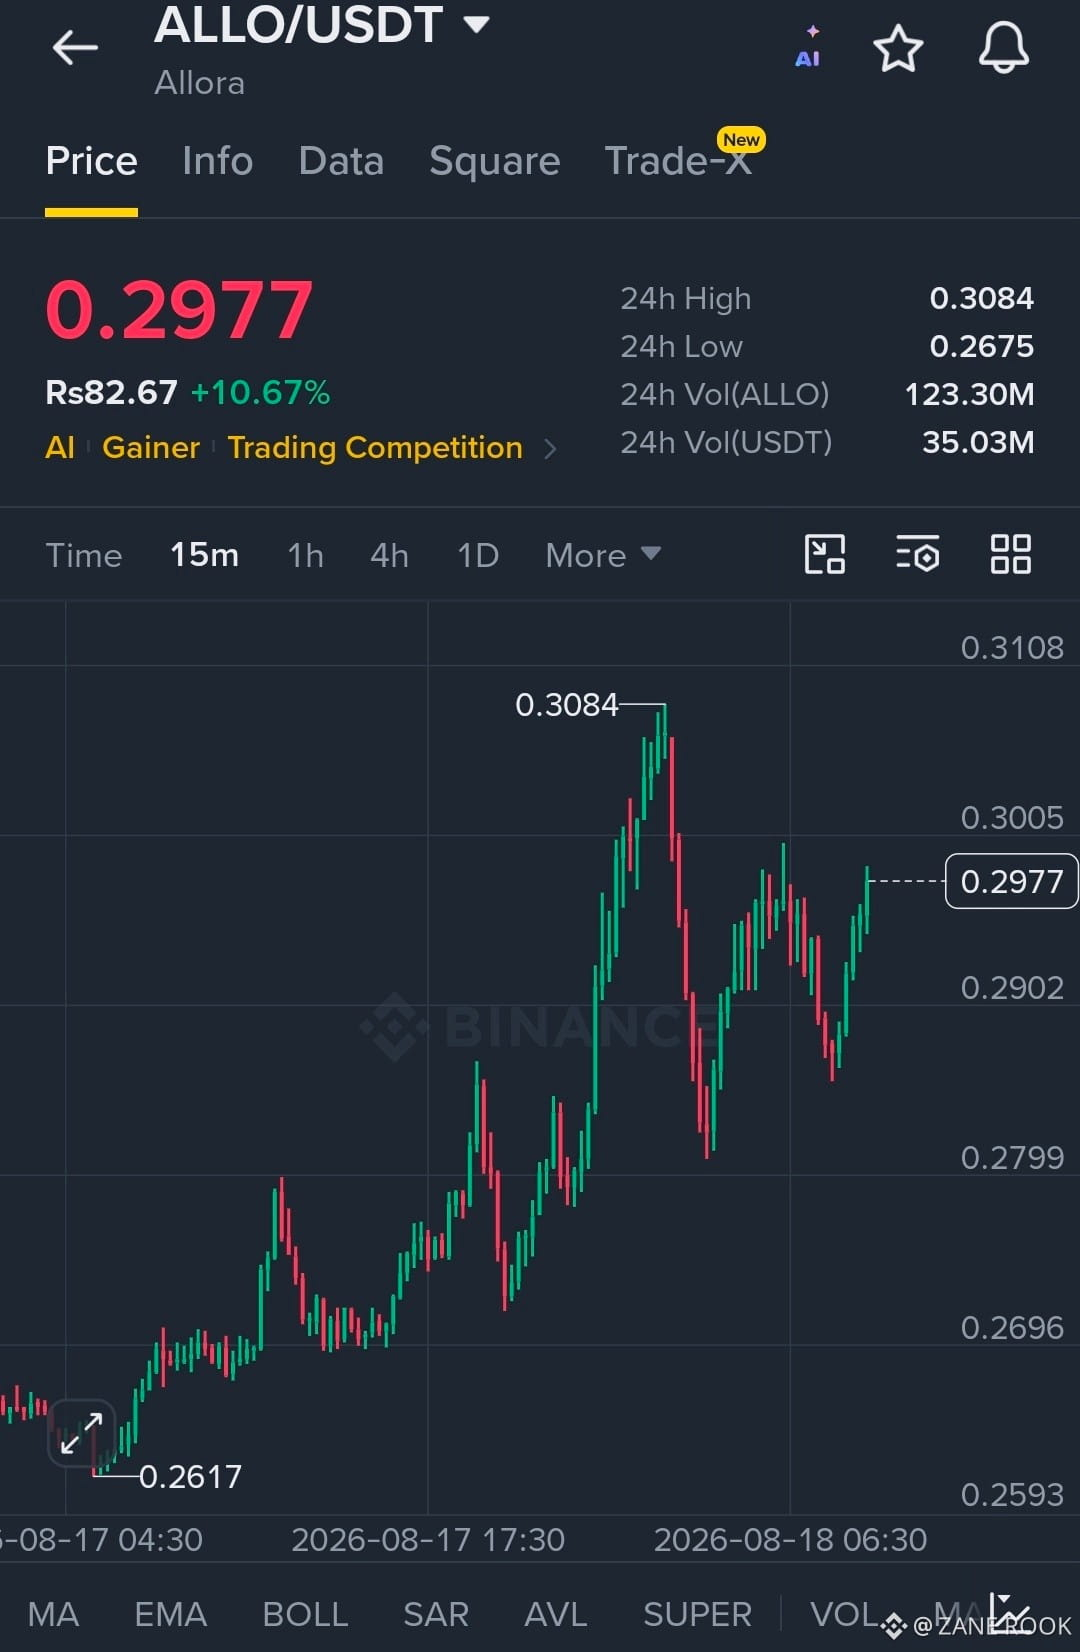
$ALLO O/USDT — Bullish Momentum Is Building
ALLO/USDT is showing strong bullish momentum on the 15-minute chart. Price is currently around 0.2977, up more than 10% over the last 24 hours, while trading volume remains strong.
The chart shows a clear recovery from the 0.2617 area, followed by a strong move toward the 24-hour high at 0.3084. After that rejection, price pulled back toward the 0.28 area and buyers stepped in again.
Now price is pushing back toward 0.3000, which is the key level to watch.
If ALLO breaks and holds above 0.3005 with strong buying pressure, the next major resistance is around 0.3084. A clean breakout of 0.3084 could open the door toward the 0.3150–0.3200 zone.
Key support levels are around 0.2902 and 0.2799. As long as price holds above the nearby support zone, the short-term bullish structure remains intact.
TRADE IDEA — LONG
Preferred Entry: 0.2920–0.2960
Alternative Breakout Entry: Above 0.3010 after a confirmed 15-minute candle close
Stop Loss: 0.2860
Target 1: 0.3005
Target 2: 0.3084
Target 3: 0.3150
Target 4: 0.3200
Trade Management:
If price reaches 0.3005, consider securing partial profit.
Above 0.3084, momentum could accelerate, so the remaining position can be managed toward 0.3150 and 0.3200.
If ALLO loses 0.2860 with strong selling pressure, the long setup is invalid and it is better to exit rather than force the trade.
The setup is bullish, but buying directly after a strong move can carry higher risk. The cleaner approach is to wait for either a pullback into the entry zone or a confirmed breakout above 0.3005.
Let's trade the levels, not the hype.
This is a technical setup based on the chart provided, not a guaranteed result. Use appropriate position sizing and risk management.
$ALLO O/USDT — Bullish Momentum Is Building
ALLO/USDT is showing strong bullish momentum on the 15-minute chart. Price is currently around 0.2977, up more than 10% over the last 24 hours, while trading volume remains strong.
The chart shows a clear recovery from the 0.2617 area, followed by a strong move toward the 24-hour high at 0.3084. After that rejection, price pulled back toward the 0.28 area and buyers stepped in again.
Now price is pushing back toward 0.3000, which is the key level to watch.
If ALLO breaks and holds above 0.3005 with strong buying pressure, the next major resistance is around 0.3084. A clean breakout of 0.3084 could open the door toward the 0.3150–0.3200 zone.
Key support levels are around 0.2902 and 0.2799. As long as price holds above the nearby support zone, the short-term bullish structure remains intact.
TRADE IDEA — LONG
Preferred Entry: 0.2920–0.2960
Alternative Breakout Entry: Above 0.3010 after a confirmed 15-minute candle close
Stop Loss: 0.2860
Target 1: 0.3005
Target 2: 0.3084
Target 3: 0.3150
Target 4: 0.3200
Trade Management:
If price reaches 0.3005, consider securing partial profit.
Above 0.3084, momentum could accelerate, so the remaining position can be managed toward 0.3150 and 0.3200.
If ALLO loses 0.2860 with strong selling pressure, the long setup is invalid and it is better to exit rather than force the trade.
The setup is bullish, but buying directly after a strong move can carry higher risk. The cleaner approach is to wait for either a pullback into the entry zone or a confirmed breakout above 0.3005.
Let's trade the levels, not the hype.
This is a technical setup based on the chart provided, not a guaranteed result. Use appropriate position sizing and risk management.
ALLO/USDT is showing strong bullish momentum on the 15-minute chart. Price is currently around 0.2977, up more than 10% over the last 24 hours, while trading volume remains strong.
The chart shows a clear recovery from the 0.2617 area, followed by a strong move toward the 24-hour high at 0.3084. After that rejection, price pulled back toward the 0.28 area and buyers stepped in again.
Now price is pushing back toward 0.3000, which is the key level to watch.
If ALLO breaks and holds above 0.3005 with strong buying pressure, the next major resistance is around 0.3084. A clean breakout of 0.3084 could open the door toward the 0.3150–0.3200 zone.
Key support levels are around 0.2902 and 0.2799. As long as price holds above the nearby support zone, the short-term bullish structure remains intact.
TRADE IDEA — LONG
Preferred Entry: 0.2920–0.2960
Alternative Breakout Entry: Above 0.3010 after a confirmed 15-minute candle close
Stop Loss: 0.2860
Target 1: 0.3005
Target 2: 0.3084
Target 3: 0.3150
Target 4: 0.3200
Trade Management:
If price reaches 0.3005, consider securing partial profit.
Above 0.3084, momentum could accelerate, so the remaining position can be managed toward 0.3150 and 0.3200.
If ALLO loses 0.2860 with strong selling pressure, the long setup is invalid and it is better to exit rather than force the trade.
The setup is bullish, but buying directly after a strong move can carry higher risk. The cleaner approach is to wait for either a pullback into the entry zone or a confirmed breakout above 0.3005.
Let's trade the levels, not the hype.
This is a technical setup based on the chart provided, not a guaranteed result. Use appropriate position sizing and risk management.
120
·
--
Bullish
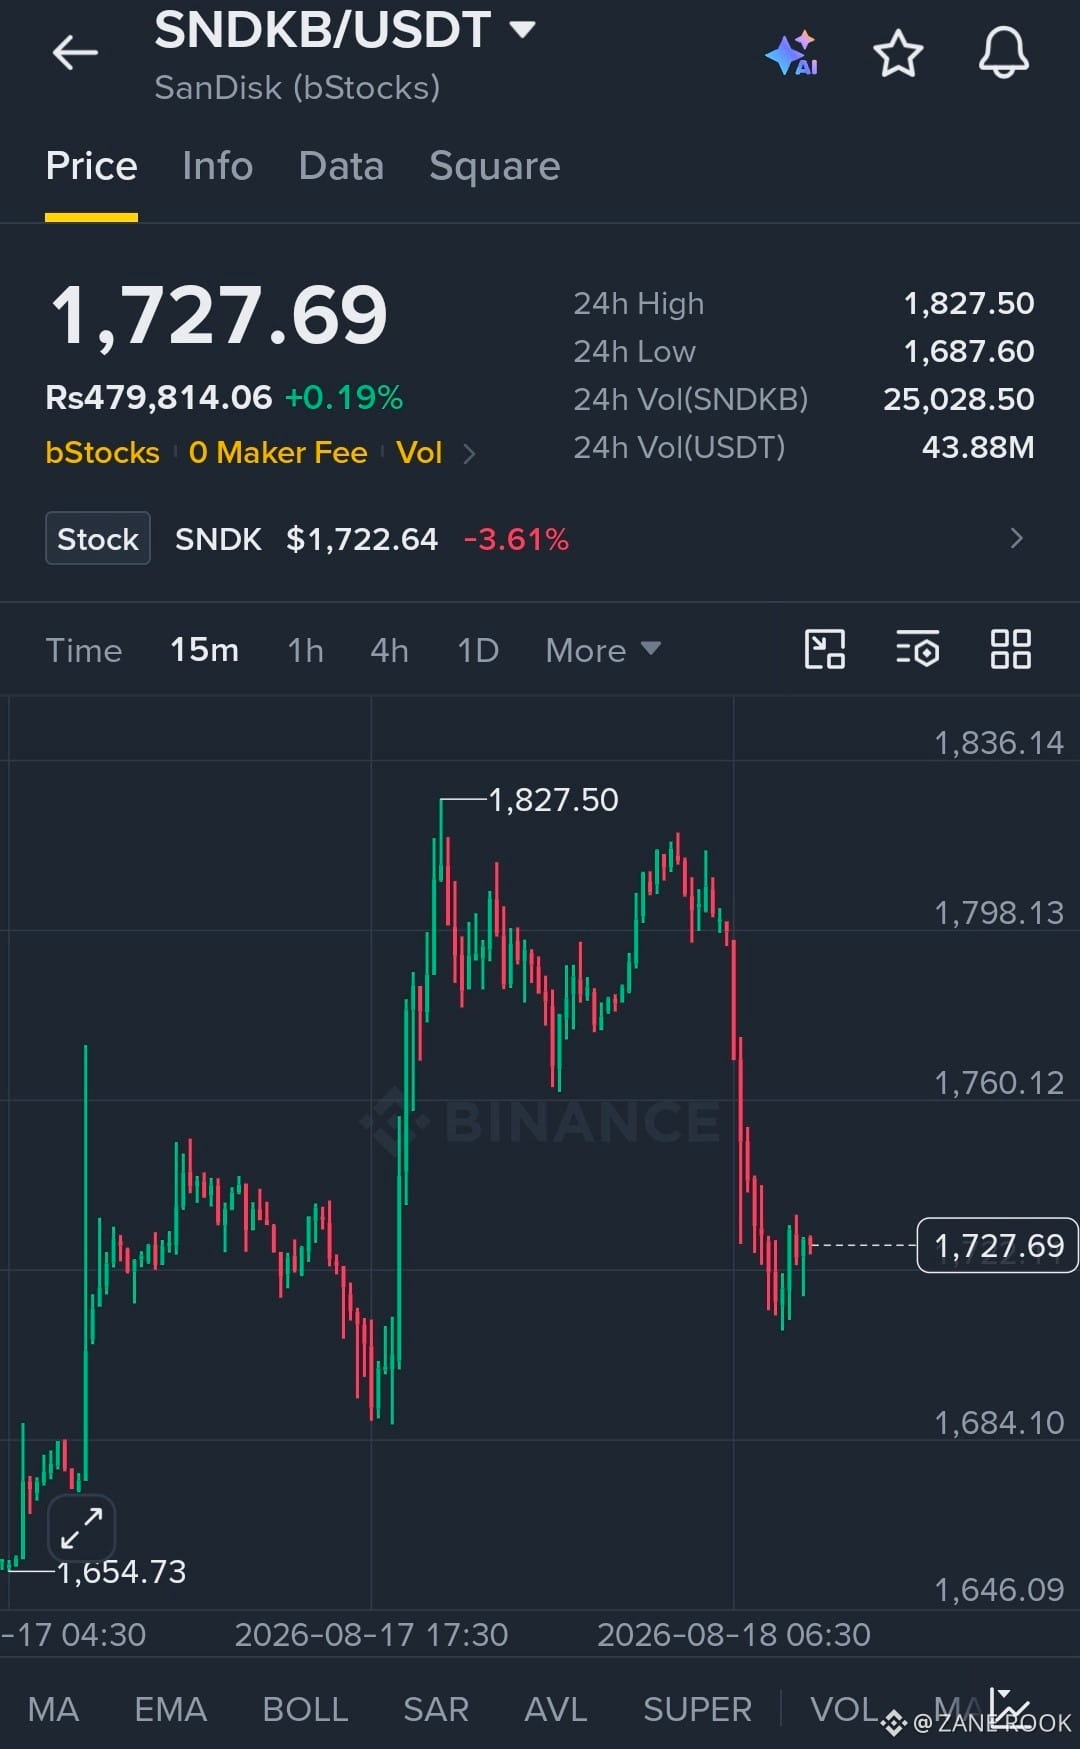
$SNDKB KB/USDT — SanDisk bStocks: Bulls Are Still Fighting Back
SNDKB/USDT is currently trading around 1,727.69 on the 15-minute chart. After a sharp move from the 1,684 area toward 1,827.50, price faced strong selling pressure and pulled back hard.
Now the interesting part is the reaction around 1,700–1,720. Buyers are attempting to stabilize the price, which keeps a short-term bullish recovery setup alive.
The key resistance levels are clear:
1,760.12 is the first major hurdle.
Above that, 1,798.13 becomes the next important resistance.
A clean breakout above 1,798 could open the way toward the recent high near 1,827.50.
For support, 1,700–1,710 is the first area to watch, while 1,684.10 is the major support visible on this chart.
Trade Idea — Long
Entry: 1,715–1,730
Stop Loss: 1,680
Target 1: 1,760
Target 2: 1,798
Target 3: 1,825–1,828
Trade management:
If price reaches 1,760, consider securing some profit and moving the stop toward breakeven.
If 1,798 breaks with strong 15-minute candles and volume, the next upside zone is around 1,825–1,828.
If price loses 1,680, the bullish setup is invalid and I would avoid holding the long position.
The main idea is simple: buyers need to defend the 1,700–1,720 region and reclaim 1,760. Until that happens, this remains a recovery attempt rather than a confirmed uptrend.
Let's trade the levels, not the emotions.
This setup is based only on the chart shown and is not a guaranteed trade. Manage position size and risk carefully.
$SNDKB KB/USDT — SanDisk bStocks: Bulls Are Still Fighting Back
SNDKB/USDT is currently trading around 1,727.69 on the 15-minute chart. After a sharp move from the 1,684 area toward 1,827.50, price faced strong selling pressure and pulled back hard.
Now the interesting part is the reaction around 1,700–1,720. Buyers are attempting to stabilize the price, which keeps a short-term bullish recovery setup alive.
The key resistance levels are clear:
1,760.12 is the first major hurdle.
Above that, 1,798.13 becomes the next important resistance.
A clean breakout above 1,798 could open the way toward the recent high near 1,827.50.
For support, 1,700–1,710 is the first area to watch, while 1,684.10 is the major support visible on this chart.
Trade Idea — Long
Entry: 1,715–1,730
Stop Loss: 1,680
Target 1: 1,760
Target 2: 1,798
Target 3: 1,825–1,828
Trade management:
If price reaches 1,760, consider securing some profit and moving the stop toward breakeven.
If 1,798 breaks with strong 15-minute candles and volume, the next upside zone is around 1,825–1,828.
If price loses 1,680, the bullish setup is invalid and I would avoid holding the long position.
The main idea is simple: buyers need to defend the 1,700–1,720 region and reclaim 1,760. Until that happens, this remains a recovery attempt rather than a confirmed uptrend.
Let's trade the levels, not the emotions.
This setup is based only on the chart shown and is not a guaranteed trade. Manage position size and risk carefully.
SNDKB/USDT is currently trading around 1,727.69 on the 15-minute chart. After a sharp move from the 1,684 area toward 1,827.50, price faced strong selling pressure and pulled back hard.
Now the interesting part is the reaction around 1,700–1,720. Buyers are attempting to stabilize the price, which keeps a short-term bullish recovery setup alive.
The key resistance levels are clear:
1,760.12 is the first major hurdle.
Above that, 1,798.13 becomes the next important resistance.
A clean breakout above 1,798 could open the way toward the recent high near 1,827.50.
For support, 1,700–1,710 is the first area to watch, while 1,684.10 is the major support visible on this chart.
Trade Idea — Long
Entry: 1,715–1,730
Stop Loss: 1,680
Target 1: 1,760
Target 2: 1,798
Target 3: 1,825–1,828
Trade management:
If price reaches 1,760, consider securing some profit and moving the stop toward breakeven.
If 1,798 breaks with strong 15-minute candles and volume, the next upside zone is around 1,825–1,828.
If price loses 1,680, the bullish setup is invalid and I would avoid holding the long position.
The main idea is simple: buyers need to defend the 1,700–1,720 region and reclaim 1,760. Until that happens, this remains a recovery attempt rather than a confirmed uptrend.
Let's trade the levels, not the emotions.
This setup is based only on the chart shown and is not a guaranteed trade. Manage position size and risk carefully.
150
·
--
Bullish
$NVDAB BOME/USDC — Bullish Recovery Setup
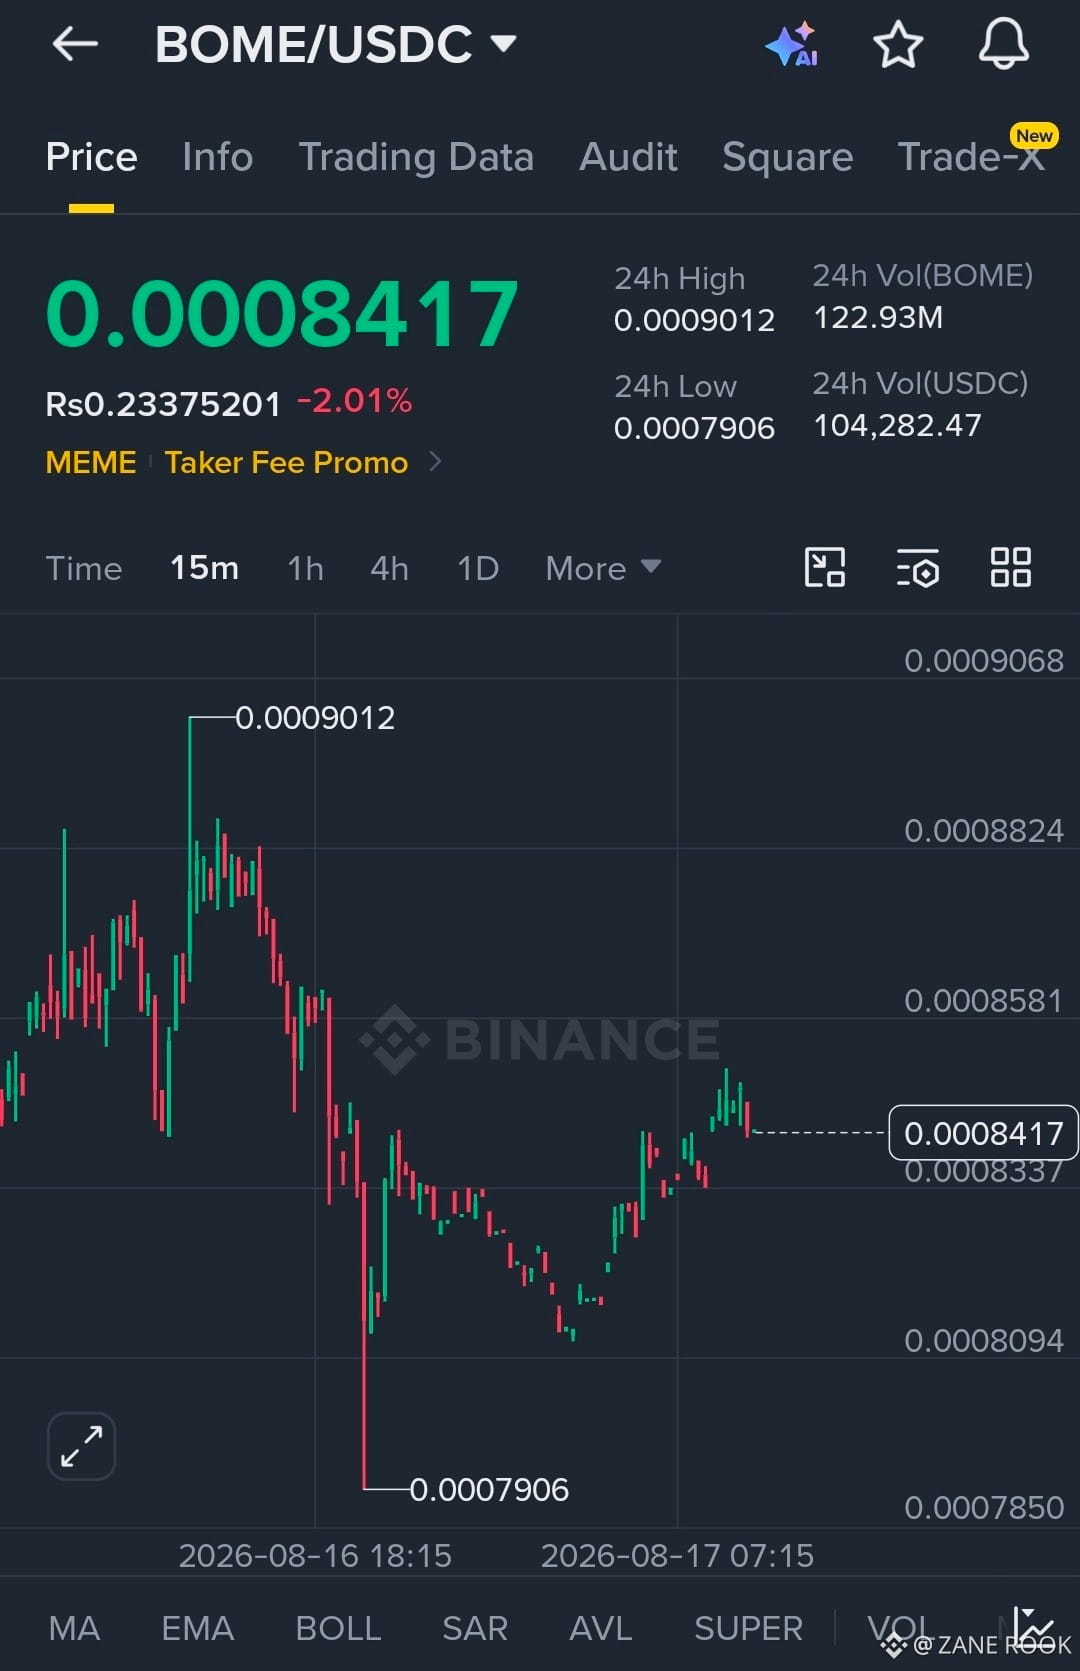
BOME is showing signs of a short-term recovery on the 15-minute chart after a sharp sell-off from 0.0009012 to 0.0007906.
Current price: 0.0008417
The important thing here is that price has started making higher lows from the 0.00081 area and is now trading above the nearby 0.0008337 support zone. That gives the bulls a chance to push toward the next resistance levels.
Key Levels
Support:
0.0008337
0.0008094
0.0007906
Resistance:
0.0008581
0.0008824
0.0009012
Trade Idea — LONG
Entry: 0.0008380 – 0.0008450
Target 1: 0.0008580
Target 2: 0.0008820
Target 3: 0.0009010
Stop Loss: 0.0008230
Trade Logic
The idea is to enter near the current support/recovery area rather than chase a sudden green candle.
If BOME holds 0.0008337 and breaks above 0.0008581 with strength, the next upside levels are around 0.0008824 and potentially the previous high near 0.0009012.
If price loses 0.0008337 and especially breaks 0.0008230, the bullish setup becomes weak and the trade should be exited.
Risk Management
Do not use your entire capital on this setup. Meme coins can move very quickly, so keep the position size small and risk only what you can afford to lose.
This setup is based only on the chart shown and is not a guarantee of profit.
BOME is at a decision zone now.
Let's see if the bulls can reclaim 0.0008581.
$NVDAB BOME/USDC — Bullish Recovery Setup
BOME is showing signs of a short-term recovery on the 15-minute chart after a sharp sell-off from 0.0009012 to 0.0007906.
Current price: 0.0008417
The important thing here is that price has started making higher lows from the 0.00081 area and is now trading above the nearby 0.0008337 support zone. That gives the bulls a chance to push toward the next resistance levels.
Key Levels
Support:
0.0008337
0.0008094
0.0007906
Resistance:
0.0008581
0.0008824
0.0009012
Trade Idea — LONG
Entry: 0.0008380 – 0.0008450
Target 1: 0.0008580
Target 2: 0.0008820
Target 3: 0.0009010
Stop Loss: 0.0008230
Trade Logic
The idea is to enter near the current support/recovery area rather than chase a sudden green candle.
If BOME holds 0.0008337 and breaks above 0.0008581 with strength, the next upside levels are around 0.0008824 and potentially the previous high near 0.0009012.
If price loses 0.0008337 and especially breaks 0.0008230, the bullish setup becomes weak and the trade should be exited.
Risk Management
Do not use your entire capital on this setup. Meme coins can move very quickly, so keep the position size small and risk only what you can afford to lose.
This setup is based only on the chart shown and is not a guarantee of profit.
BOME is at a decision zone now.
Let's see if the bulls can reclaim 0.0008581.
BOME is showing signs of a short-term recovery on the 15-minute chart after a sharp sell-off from 0.0009012 to 0.0007906.
Current price: 0.0008417
The important thing here is that price has started making higher lows from the 0.00081 area and is now trading above the nearby 0.0008337 support zone. That gives the bulls a chance to push toward the next resistance levels.
Key Levels
Support:
0.0008337
0.0008094
0.0007906
Resistance:
0.0008581
0.0008824
0.0009012
Trade Idea — LONG
Entry: 0.0008380 – 0.0008450
Target 1: 0.0008580
Target 2: 0.0008820
Target 3: 0.0009010
Stop Loss: 0.0008230
Trade Logic
The idea is to enter near the current support/recovery area rather than chase a sudden green candle.
If BOME holds 0.0008337 and breaks above 0.0008581 with strength, the next upside levels are around 0.0008824 and potentially the previous high near 0.0009012.
If price loses 0.0008337 and especially breaks 0.0008230, the bullish setup becomes weak and the trade should be exited.
Risk Management
Do not use your entire capital on this setup. Meme coins can move very quickly, so keep the position size small and risk only what you can afford to lose.
This setup is based only on the chart shown and is not a guarantee of profit.
BOME is at a decision zone now.
Let's see if the bulls can reclaim 0.0008581.
1
223


·
--
Bullish
$SEI /USDC — Buyers Are Fighting Back After a Sharp Dip
SEI is showing a potential short-term recovery setup on the 15-minute chart.
Price dropped sharply to the 0.03916 low, but buyers stepped in and pushed the price back toward 0.03974. The current recovery is important because SEI is now approaching the 0.03988–0.04000 resistance zone.
The 24H high is 0.03999, making this a key breakout area.
TRADE IDEA: LONG
Entry: 0.03975 – 0.03990
Target 1: 0.04000
Target 2: 0.04020
Target 3: 0.04050
Stop Loss: 0.03950
WHY THIS SETUP?
SEI rejected the 0.03916 area and has since produced a strong recovery. Buyers have reclaimed the 0.03950 zone, which is now an important short-term support level.
The main obstacle is 0.03988–0.04000.
If buyers break and hold above 0.04000, the recovery could extend toward 0.04020 and potentially 0.04050.
If SEI loses 0.03950, the bullish setup becomes weak. A move back toward 0.03916 would invalidate this long idea.
TRADE PLAN
Entry: 0.03975–0.03990
TP1: 0.04000
TP2: 0.04020
TP3: 0.04050
SL: 0.03950
The safer approach is to wait for a confirmed breakout above 0.04000 rather than chasing the current recovery candle.
SEI has bounced strongly from the daily low. Now the key question is whether buyers can reclaim 0.04000 and turn resistance into support.
Let's go trade now — 0.04000 is the level to watch.
This is a chart-based setup from the provided 15-minute chart, not a guaranteed result. Keep position size controlled and respect the stop loss.
$SEI /USDC — Buyers Are Fighting Back After a Sharp Dip
SEI is showing a potential short-term recovery setup on the 15-minute chart.
Price dropped sharply to the 0.03916 low, but buyers stepped in and pushed the price back toward 0.03974. The current recovery is important because SEI is now approaching the 0.03988–0.04000 resistance zone.
The 24H high is 0.03999, making this a key breakout area.
TRADE IDEA: LONG
Entry: 0.03975 – 0.03990
Target 1: 0.04000
Target 2: 0.04020
Target 3: 0.04050
Stop Loss: 0.03950
WHY THIS SETUP?
SEI rejected the 0.03916 area and has since produced a strong recovery. Buyers have reclaimed the 0.03950 zone, which is now an important short-term support level.
The main obstacle is 0.03988–0.04000.
If buyers break and hold above 0.04000, the recovery could extend toward 0.04020 and potentially 0.04050.
If SEI loses 0.03950, the bullish setup becomes weak. A move back toward 0.03916 would invalidate this long idea.
TRADE PLAN
Entry: 0.03975–0.03990
TP1: 0.04000
TP2: 0.04020
TP3: 0.04050
SL: 0.03950
The safer approach is to wait for a confirmed breakout above 0.04000 rather than chasing the current recovery candle.
SEI has bounced strongly from the daily low. Now the key question is whether buyers can reclaim 0.04000 and turn resistance into support.
Let's go trade now — 0.04000 is the level to watch.
This is a chart-based setup from the provided 15-minute chart, not a guaranteed result. Keep position size controlled and respect the stop loss.
SEI is showing a potential short-term recovery setup on the 15-minute chart.
Price dropped sharply to the 0.03916 low, but buyers stepped in and pushed the price back toward 0.03974. The current recovery is important because SEI is now approaching the 0.03988–0.04000 resistance zone.
The 24H high is 0.03999, making this a key breakout area.
TRADE IDEA: LONG
Entry: 0.03975 – 0.03990
Target 1: 0.04000
Target 2: 0.04020
Target 3: 0.04050
Stop Loss: 0.03950
WHY THIS SETUP?
SEI rejected the 0.03916 area and has since produced a strong recovery. Buyers have reclaimed the 0.03950 zone, which is now an important short-term support level.
The main obstacle is 0.03988–0.04000.
If buyers break and hold above 0.04000, the recovery could extend toward 0.04020 and potentially 0.04050.
If SEI loses 0.03950, the bullish setup becomes weak. A move back toward 0.03916 would invalidate this long idea.
TRADE PLAN
Entry: 0.03975–0.03990
TP1: 0.04000
TP2: 0.04020
TP3: 0.04050
SL: 0.03950
The safer approach is to wait for a confirmed breakout above 0.04000 rather than chasing the current recovery candle.
SEI has bounced strongly from the daily low. Now the key question is whether buyers can reclaim 0.04000 and turn resistance into support.
Let's go trade now — 0.04000 is the level to watch.
This is a chart-based setup from the provided 15-minute chart, not a guaranteed result. Keep position size controlled and respect the stop loss.
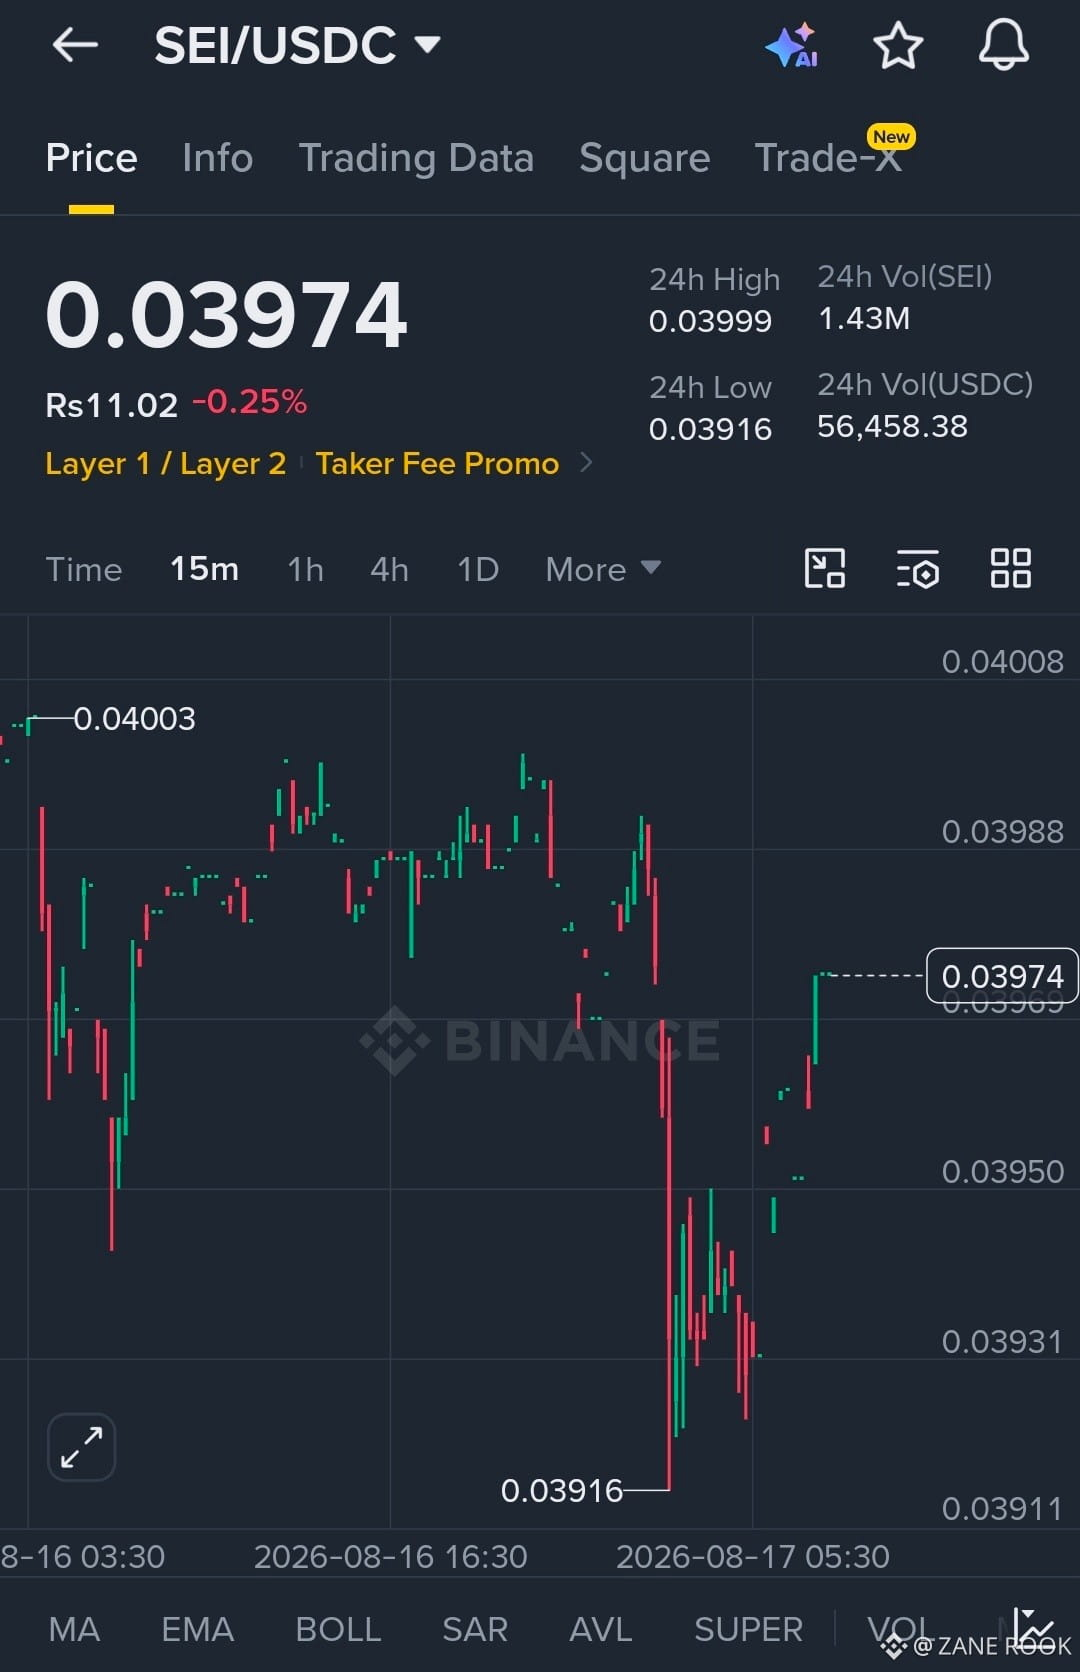
1
161
·
--
Bullish
$MUBARAK RAK/USDC — Strong Bullish Momentum, Buyers Are Knocking on the High
MUBARAK is showing one of the stronger short-term bullish structures on the 15-minute chart.
Price has climbed from the 0.01517 low to 0.01780, with the current price around 0.01760 and a 24H gain of approximately 13.62%.
The important part is that price is holding close to the 24H high instead of giving back the entire move. This shows buyers are still active.
Now the key level is 0.01780.
A clean breakout above this resistance could open the door for another bullish leg.
TRADE IDEA: LONG
Entry: 0.01778 – 0.01785
Target 1: 0.01820
Target 2: 0.01860
Target 3: 0.01900
Stop Loss: 0.01735
WHY THIS SETUP?
MUBARAK has built a clear recovery structure from 0.01517, followed by higher highs and higher lows.
The recent move pushed price into the 0.01780 resistance area. After the rejection, buyers quickly recovered toward 0.01760, which keeps the short-term bullish structure intact.
The breakout trigger is 0.01780.
If MUBARAK breaks and holds above 0.01780, the next upside levels to watch are:
0.01820 → 0.01860 → 0.01900
The 0.01735 area is the important short-term support. A sustained move below it would weaken the bullish setup and invalidate this trade idea.
TRADE PLAN
Entry: 0.01778–0.01785
TP1: 0.01820
TP2: 0.01860
TP3: 0.01900
SL: 0.01735
Because MUBARAK has already moved strongly, do not blindly chase a large green candle. The cleaner setup is a confirmed breakout above 0.01780 or a retest of that level after the breakout.
Let's go trade now — 0.01780 is the level to watch. If buyers break it with strength, MUBARAK could make another move higher.
This setup is based on the chart provided and is not a guaranteed result. Keep position size controlled and respect the stop loss.
$MUBARAK RAK/USDC — Strong Bullish Momentum, Buyers Are Knocking on the High
MUBARAK is showing one of the stronger short-term bullish structures on the 15-minute chart.
Price has climbed from the 0.01517 low to 0.01780, with the current price around 0.01760 and a 24H gain of approximately 13.62%.
The important part is that price is holding close to the 24H high instead of giving back the entire move. This shows buyers are still active.
Now the key level is 0.01780.
A clean breakout above this resistance could open the door for another bullish leg.
TRADE IDEA: LONG
Entry: 0.01778 – 0.01785
Target 1: 0.01820
Target 2: 0.01860
Target 3: 0.01900
Stop Loss: 0.01735
WHY THIS SETUP?
MUBARAK has built a clear recovery structure from 0.01517, followed by higher highs and higher lows.
The recent move pushed price into the 0.01780 resistance area. After the rejection, buyers quickly recovered toward 0.01760, which keeps the short-term bullish structure intact.
The breakout trigger is 0.01780.
If MUBARAK breaks and holds above 0.01780, the next upside levels to watch are:
0.01820 → 0.01860 → 0.01900
The 0.01735 area is the important short-term support. A sustained move below it would weaken the bullish setup and invalidate this trade idea.
TRADE PLAN
Entry: 0.01778–0.01785
TP1: 0.01820
TP2: 0.01860
TP3: 0.01900
SL: 0.01735
Because MUBARAK has already moved strongly, do not blindly chase a large green candle. The cleaner setup is a confirmed breakout above 0.01780 or a retest of that level after the breakout.
Let's go trade now — 0.01780 is the level to watch. If buyers break it with strength, MUBARAK could make another move higher.
This setup is based on the chart provided and is not a guaranteed result. Keep position size controlled and respect the stop loss.
MUBARAK is showing one of the stronger short-term bullish structures on the 15-minute chart.
Price has climbed from the 0.01517 low to 0.01780, with the current price around 0.01760 and a 24H gain of approximately 13.62%.
The important part is that price is holding close to the 24H high instead of giving back the entire move. This shows buyers are still active.
Now the key level is 0.01780.
A clean breakout above this resistance could open the door for another bullish leg.
TRADE IDEA: LONG
Entry: 0.01778 – 0.01785
Target 1: 0.01820
Target 2: 0.01860
Target 3: 0.01900
Stop Loss: 0.01735
WHY THIS SETUP?
MUBARAK has built a clear recovery structure from 0.01517, followed by higher highs and higher lows.
The recent move pushed price into the 0.01780 resistance area. After the rejection, buyers quickly recovered toward 0.01760, which keeps the short-term bullish structure intact.
The breakout trigger is 0.01780.
If MUBARAK breaks and holds above 0.01780, the next upside levels to watch are:
0.01820 → 0.01860 → 0.01900
The 0.01735 area is the important short-term support. A sustained move below it would weaken the bullish setup and invalidate this trade idea.
TRADE PLAN
Entry: 0.01778–0.01785
TP1: 0.01820
TP2: 0.01860
TP3: 0.01900
SL: 0.01735
Because MUBARAK has already moved strongly, do not blindly chase a large green candle. The cleaner setup is a confirmed breakout above 0.01780 or a retest of that level after the breakout.
Let's go trade now — 0.01780 is the level to watch. If buyers break it with strength, MUBARAK could make another move higher.
This setup is based on the chart provided and is not a guaranteed result. Keep position size controlled and respect the stop loss.
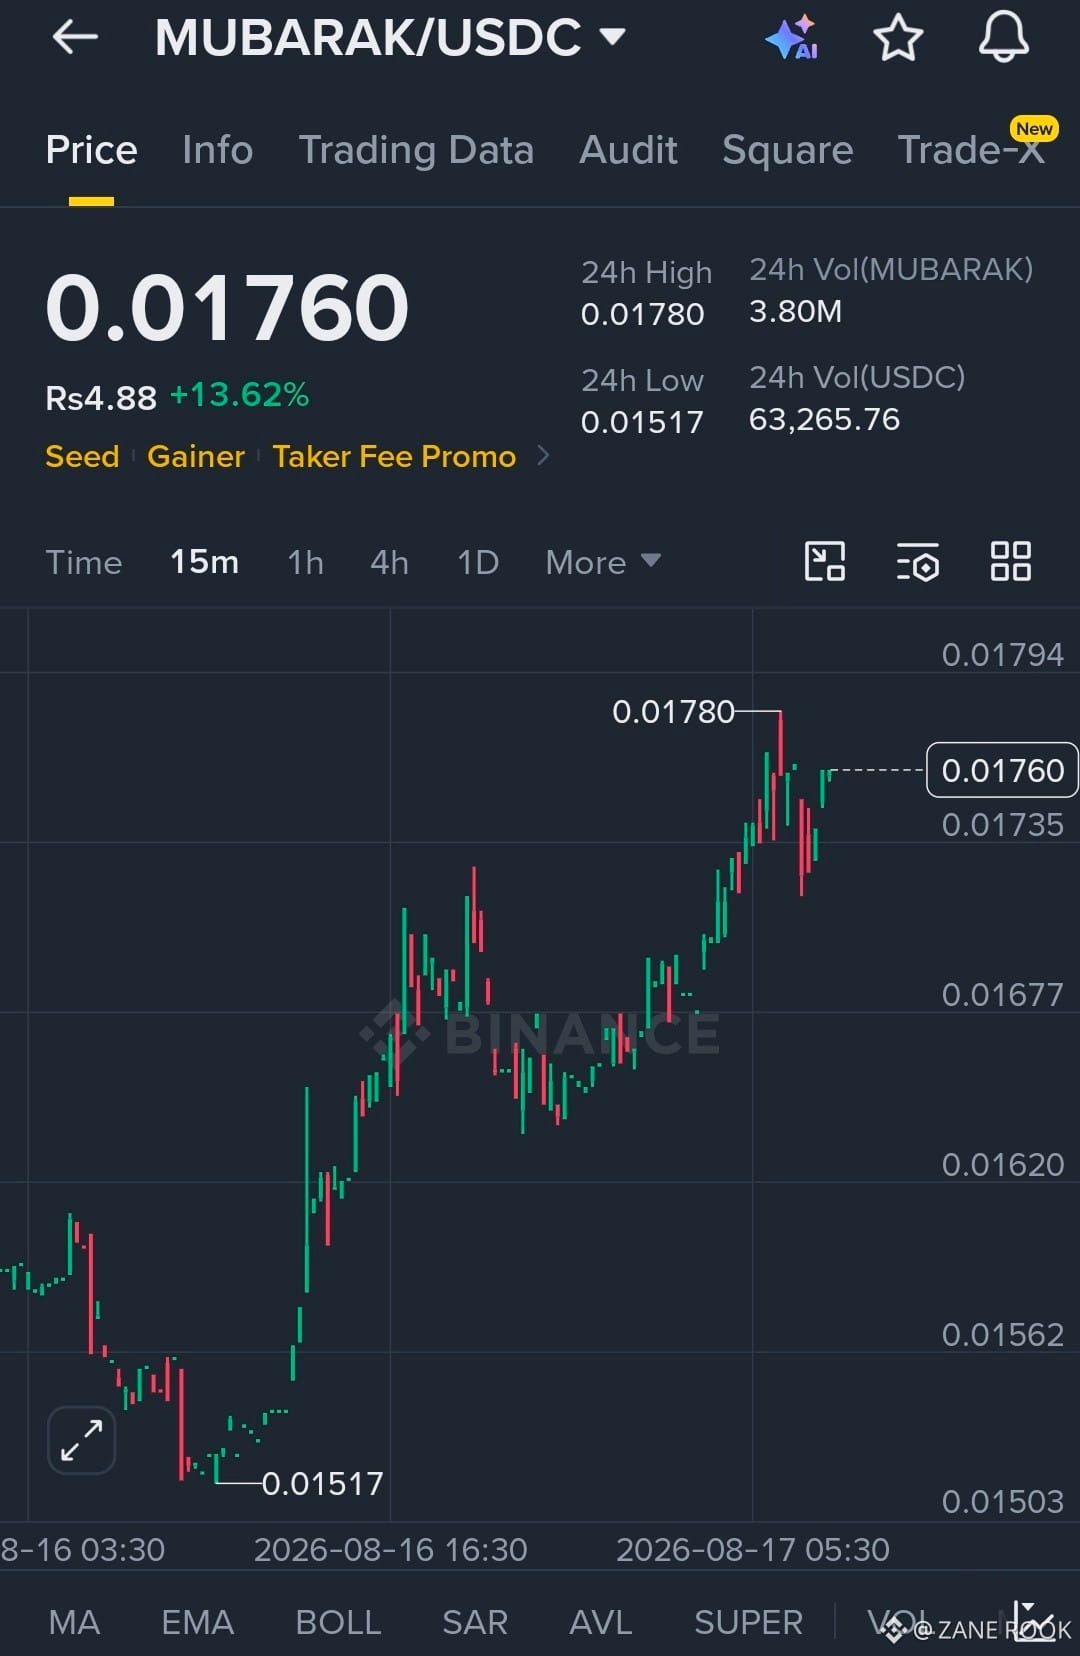
1
93
Log in to explore more content
Join global crypto users on Binance Square
⚡️ Get latest and useful information about crypto.
💬 Trusted by the world’s largest crypto exchange.
👍 Discover real insights from verified creators.
Email / Phone number
Trending Topics
BOJRaisesRatesTo31YearHigh
155,638 views
2,400 Discussing
#BOJRaisesRatesTo31YearHigh
#BOJRaisesRatesTo31YearHigh 🇯🇵📈
The Bank of Japan has taken another major step by raising interest rates to their highest level in 31 years, putting global markets on alert. The move signals a continued shift away from Japan’s long-standing ultra-loose monetary policy. Higher Japanese rates could strengthen the yen, influence global bond yields, and potentially impact capital flows across financial markets. Crypto and risk assets may also react as investors reassess liquidity and risk exposure. Traders are now watching the BOJ’s next statements closely for clues about future rate decisions. Volatility could increase as markets digest the policy change and its potential global impact. #BOJ #Japan #Crypto #Markets #InterestRates $NVDAB
maqsoodahmed1
·1 Likes
·276 views
BuffettStepsDownAsBerkshireChairman
74,448 views
1,228 Discussing
XRPExchangeReservesHitSevenYearLow
81,571 views
1,108 Discussing