


CHART KING 亗
The market is a book and I read its pages Technical analysis is my craft and the decision is yours I set the targets and the stoploss the rest is God's guidance
20 Following
2.6K+ Followers
3.2K+ Liked
Posts
All
Quotes
Videos
PINNED
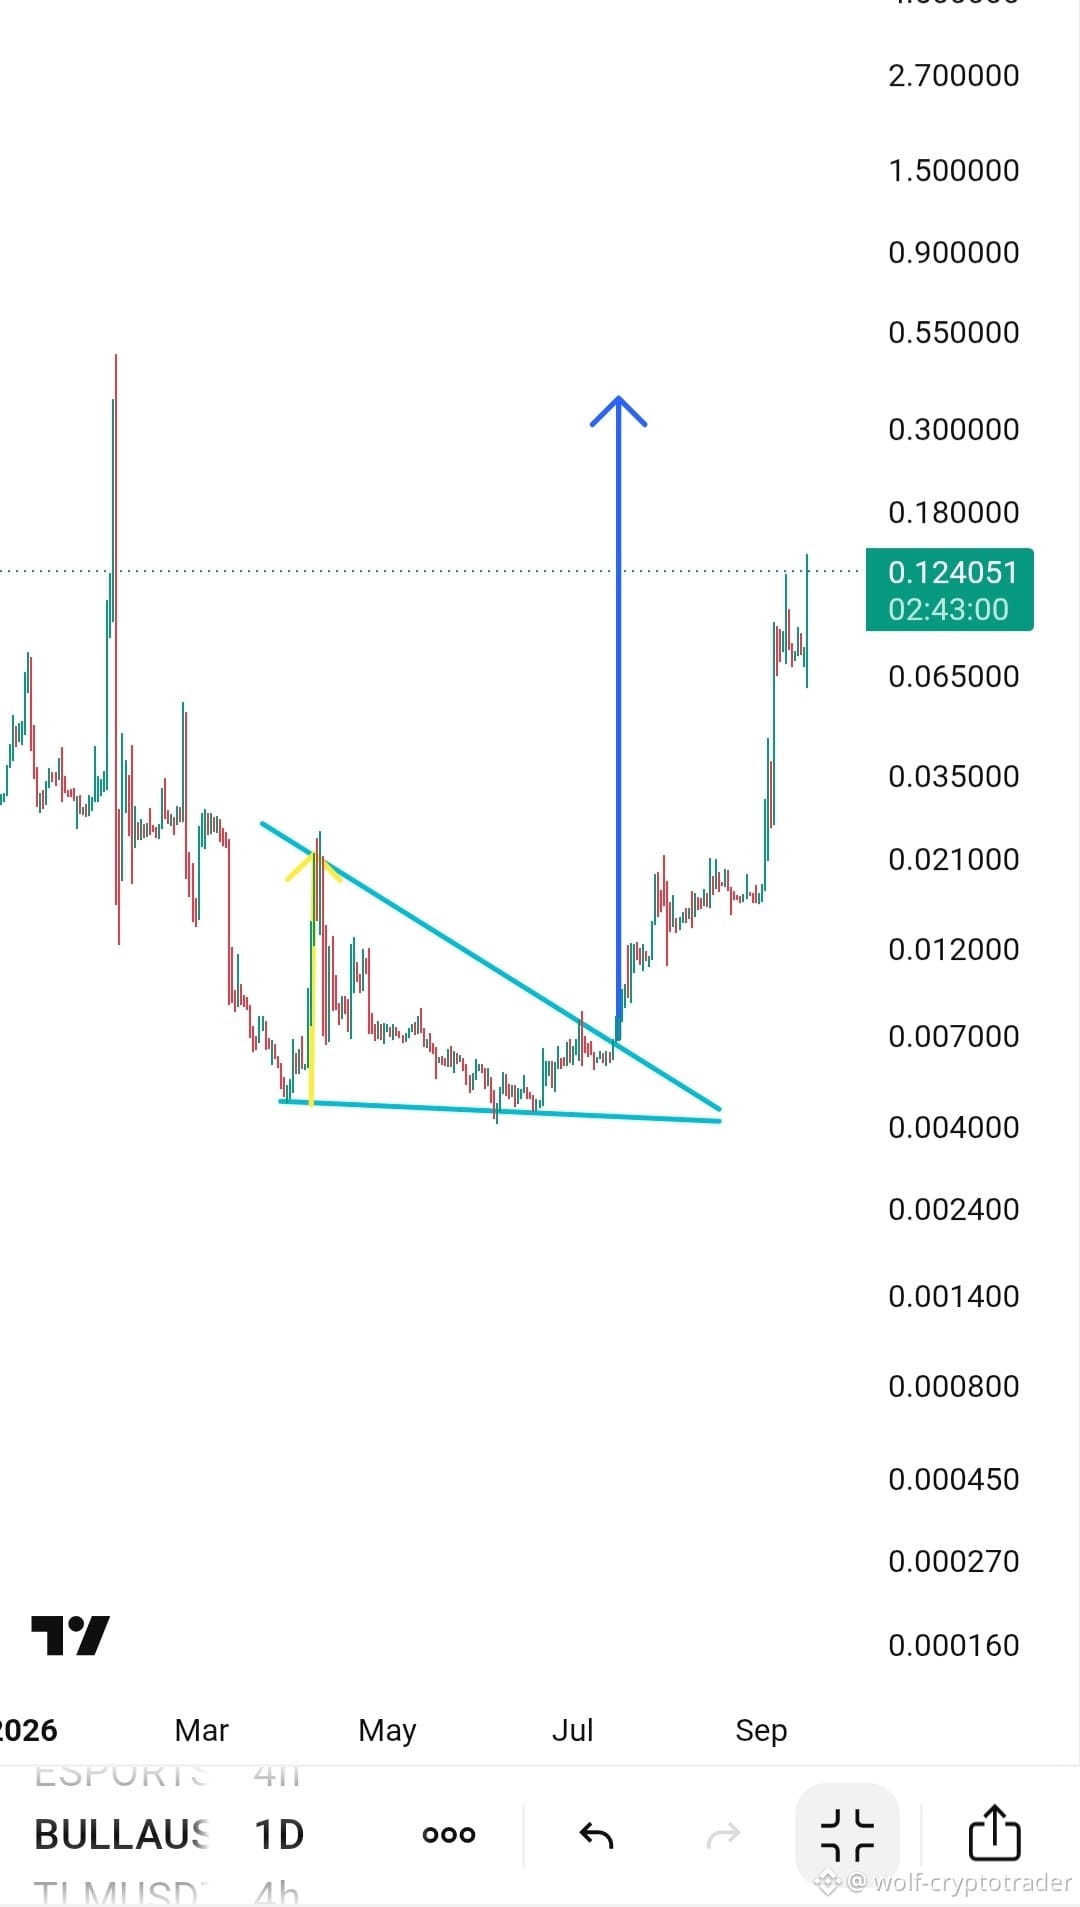
CHART KING 亗
·
--
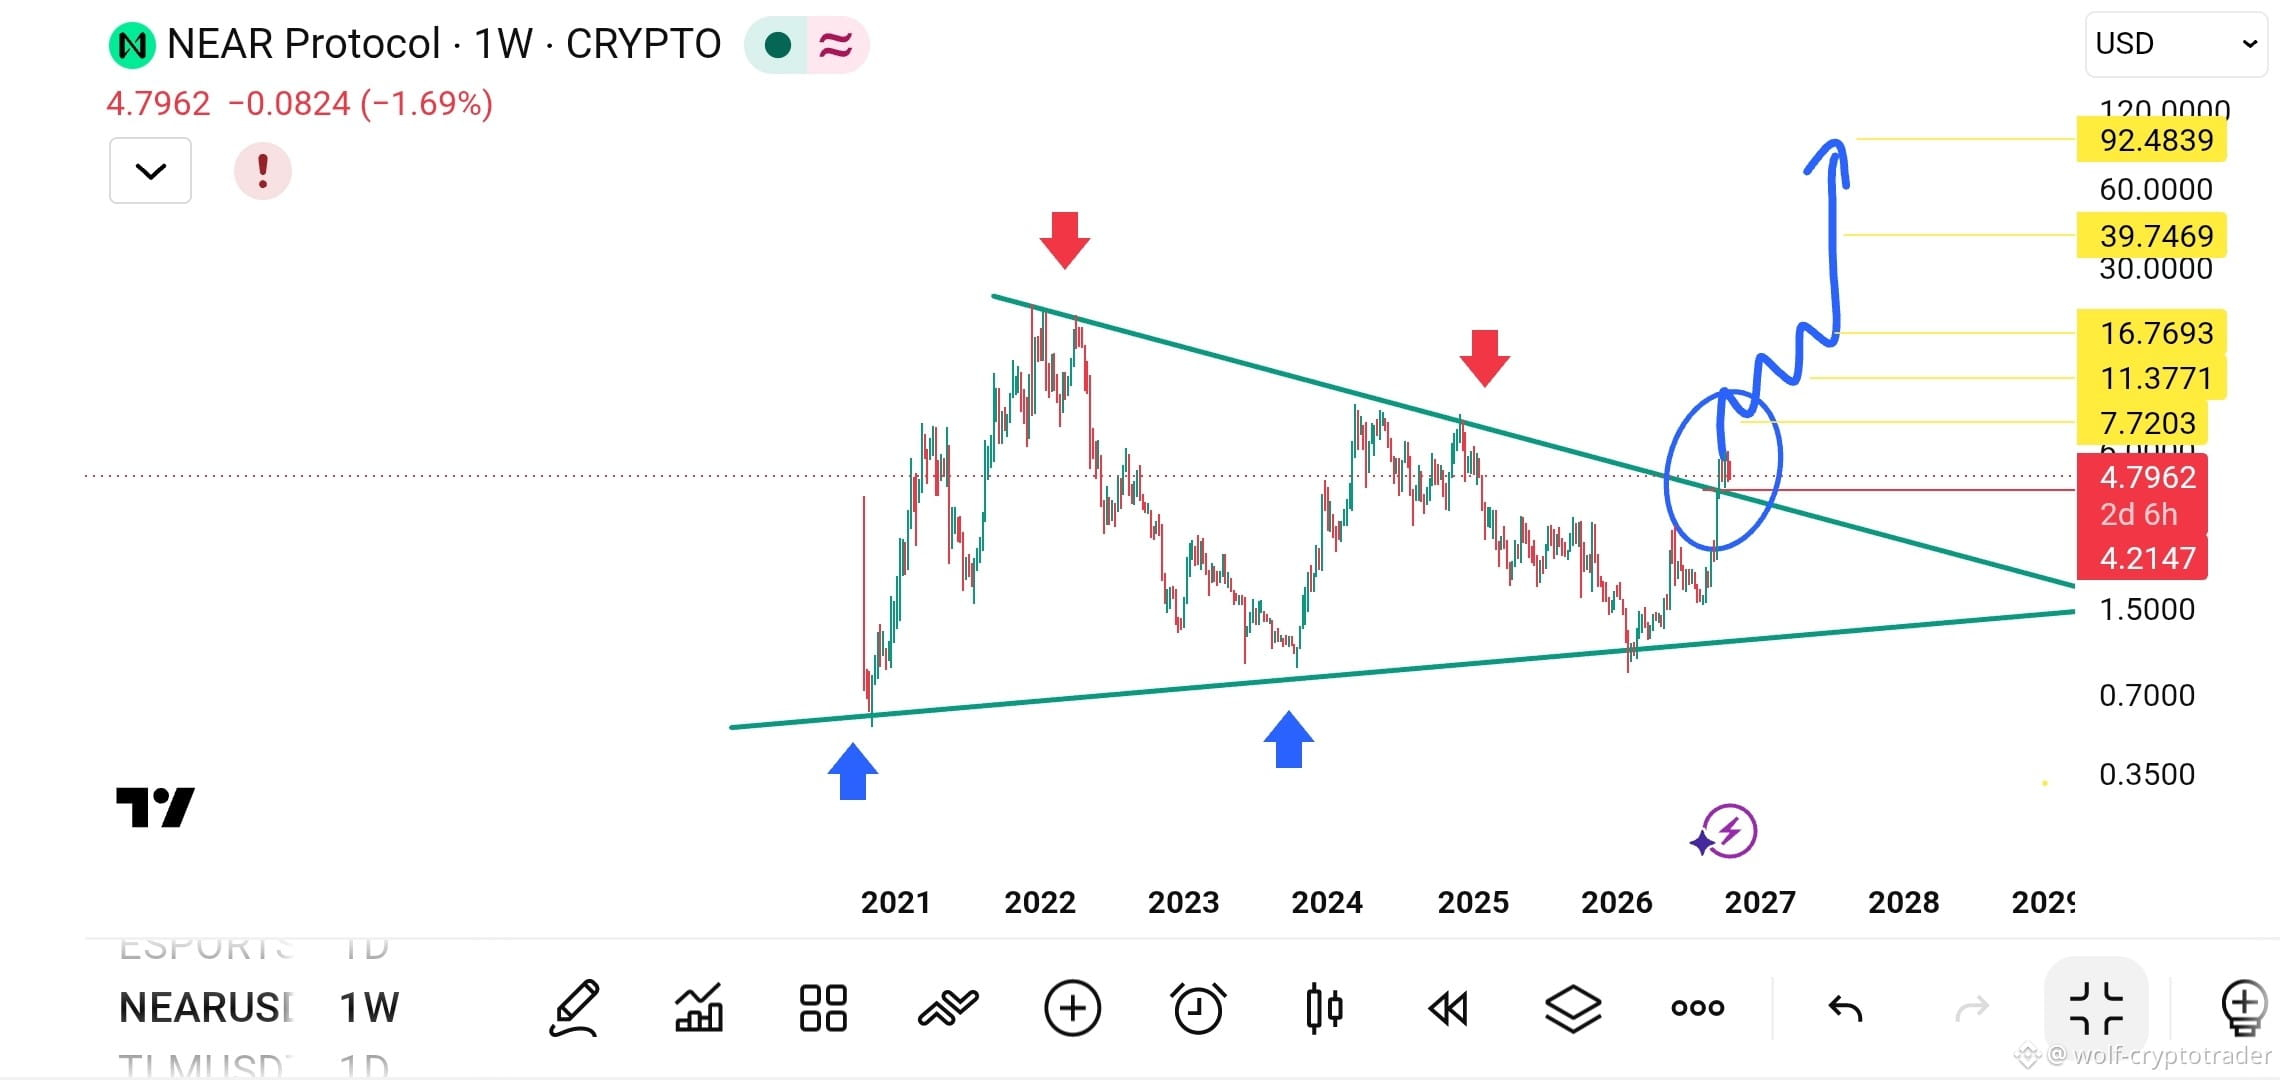
🚀🔥 Buy long now — the descending triangle has been breached. Get ready for takeoff 💎
👀 Keep an eye on it — the price managed to break the descending triangle that had trapped the movement for weeks, confirming the start of a new uptrend wave
👀 Keep an eye on it — the price managed to break the descending triangle that had trapped the movement for weeks, confirming the start of a new uptrend wave
PINNED
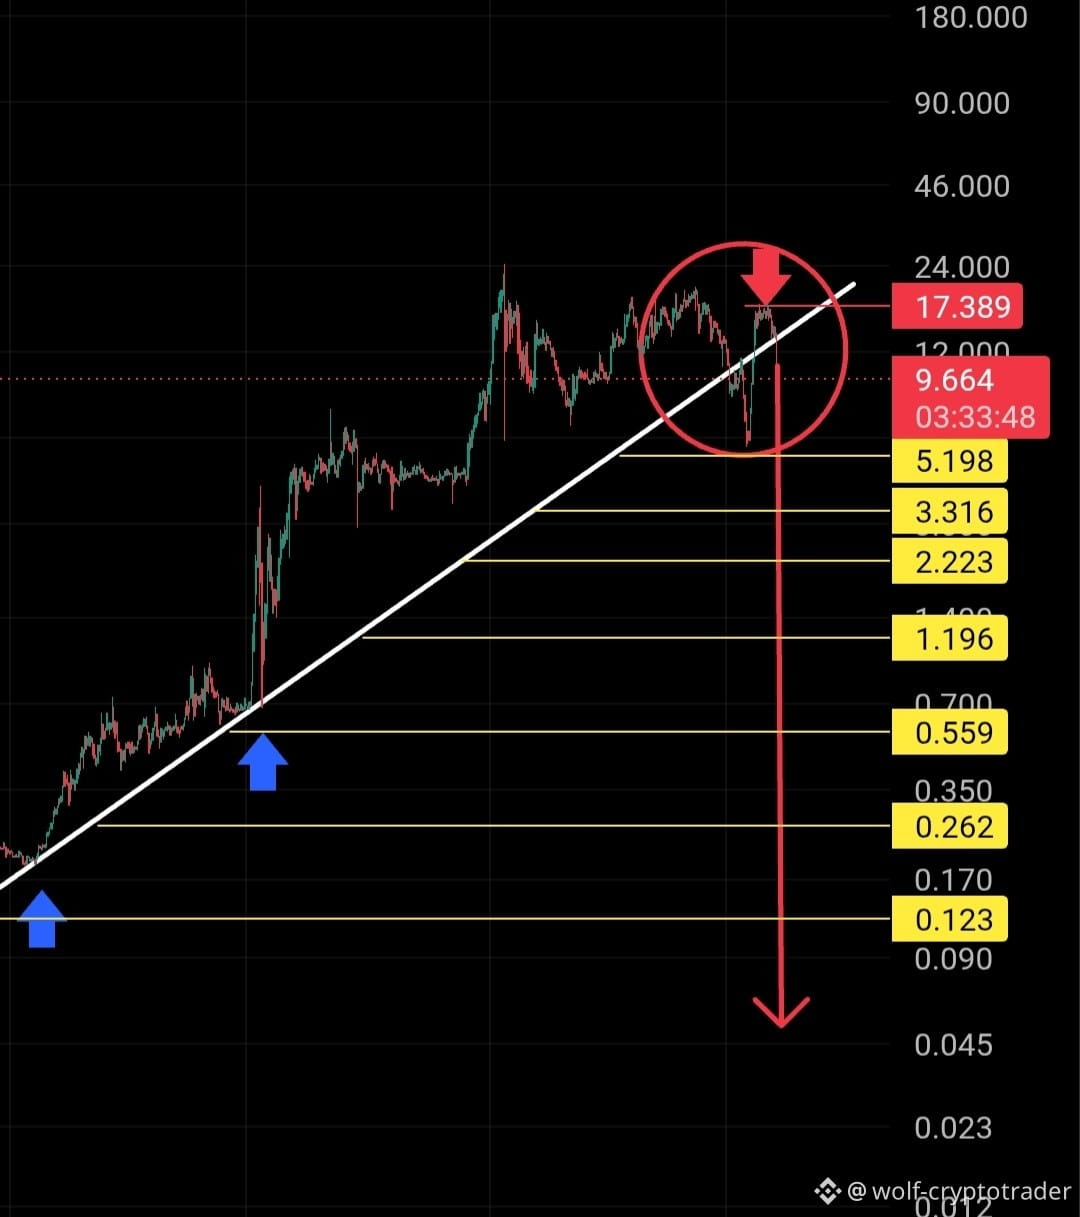
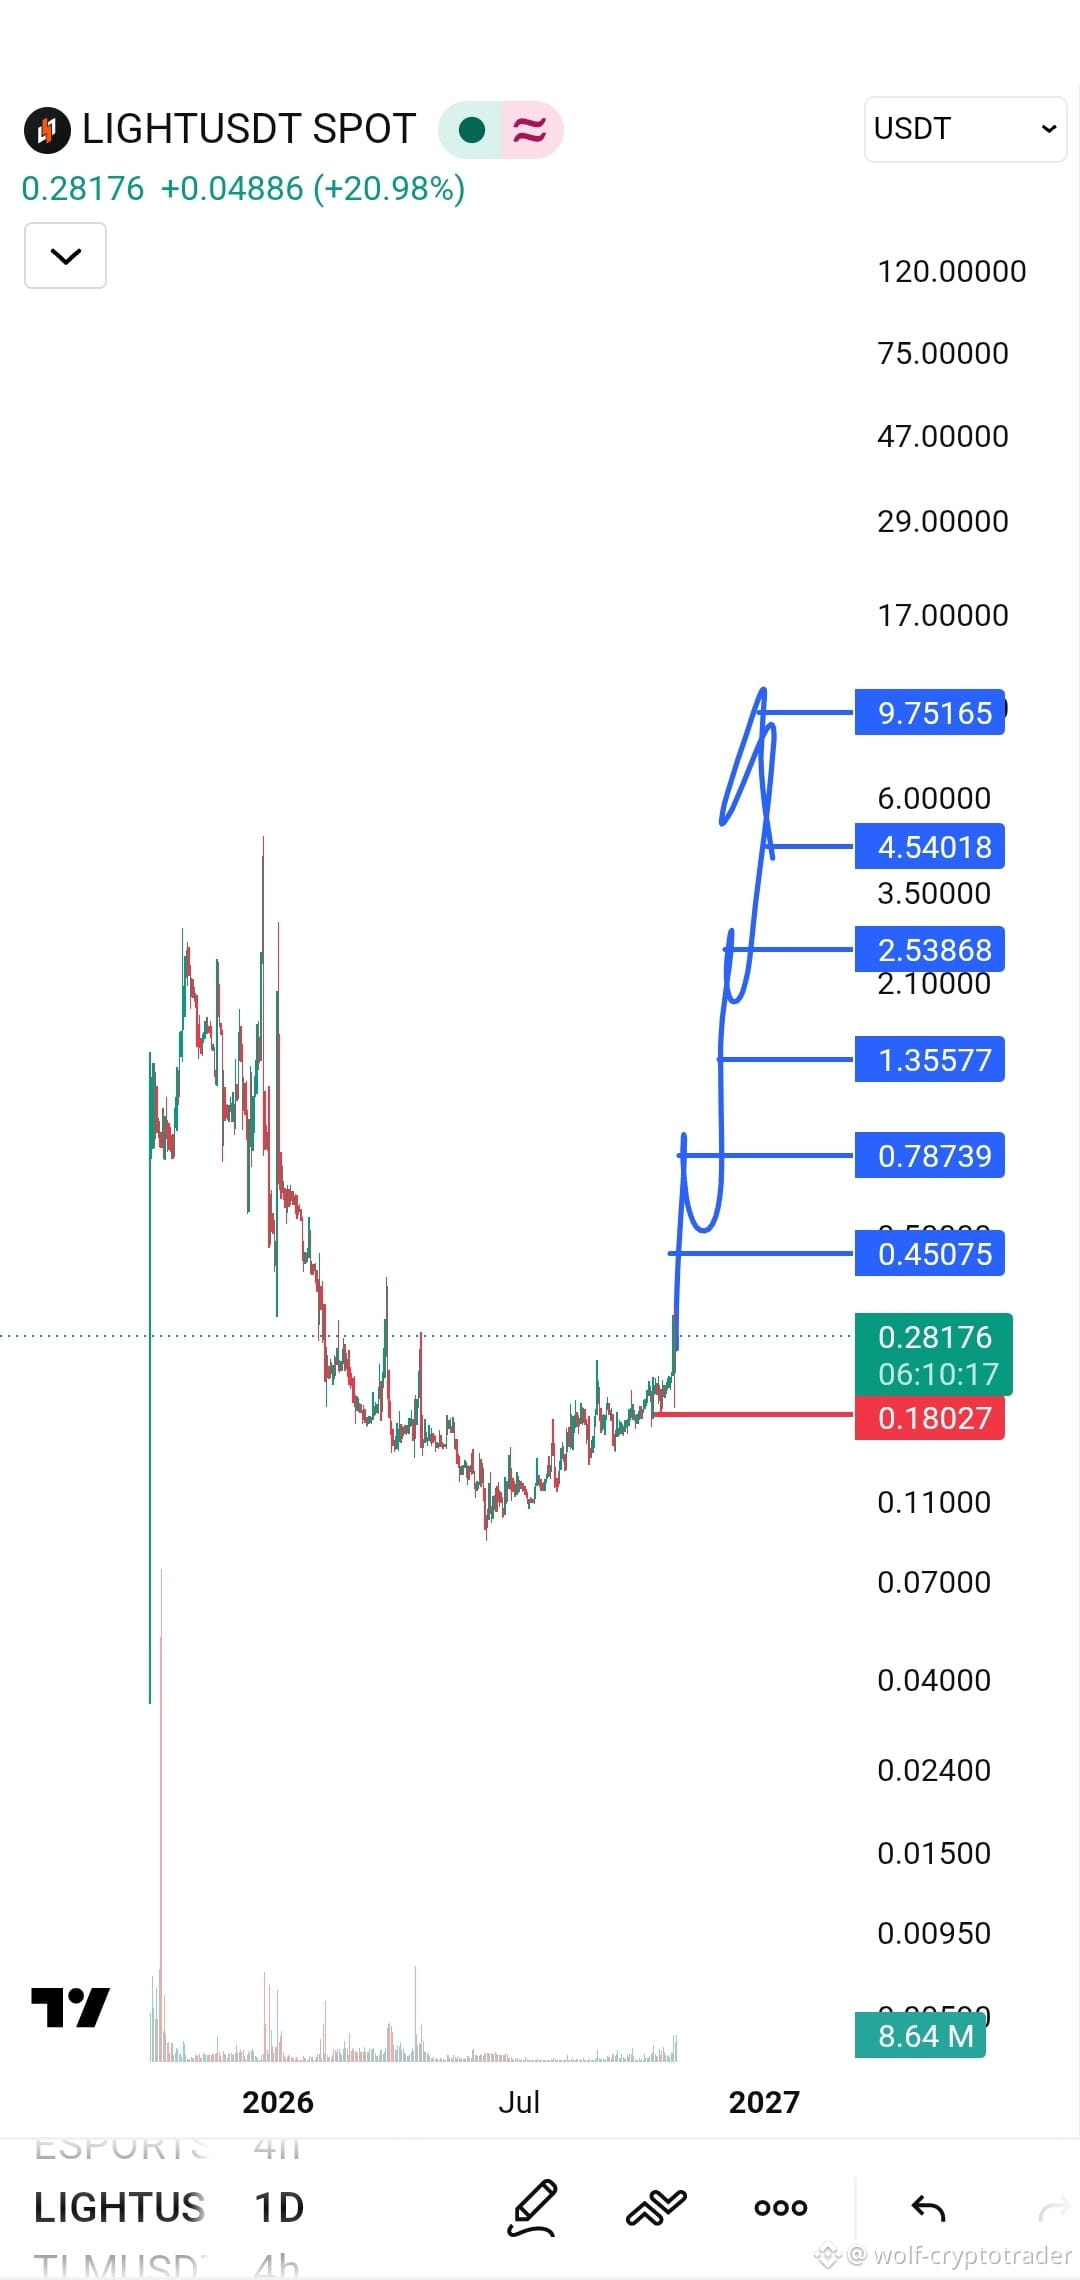
CHART KING 亗
·
--
🔥 Are you ready for the next wave? 🚀
The coin that had been in a very long accumulation phase since the beginning of 2026 has finally started showing strong breakout signals.
It has swept the market recently, but as they say, great opportunities are born from the depths of the lows. Now, we're seeing a clear break above the downtrend lines, and the coin's current price of 0.21 is just the beginning.
🟢 Long position available
👀 Keep your eyes on it—it's getting ready to fly to the moon 💎
Your targets and stop-loss are on the chart
$LIGHT
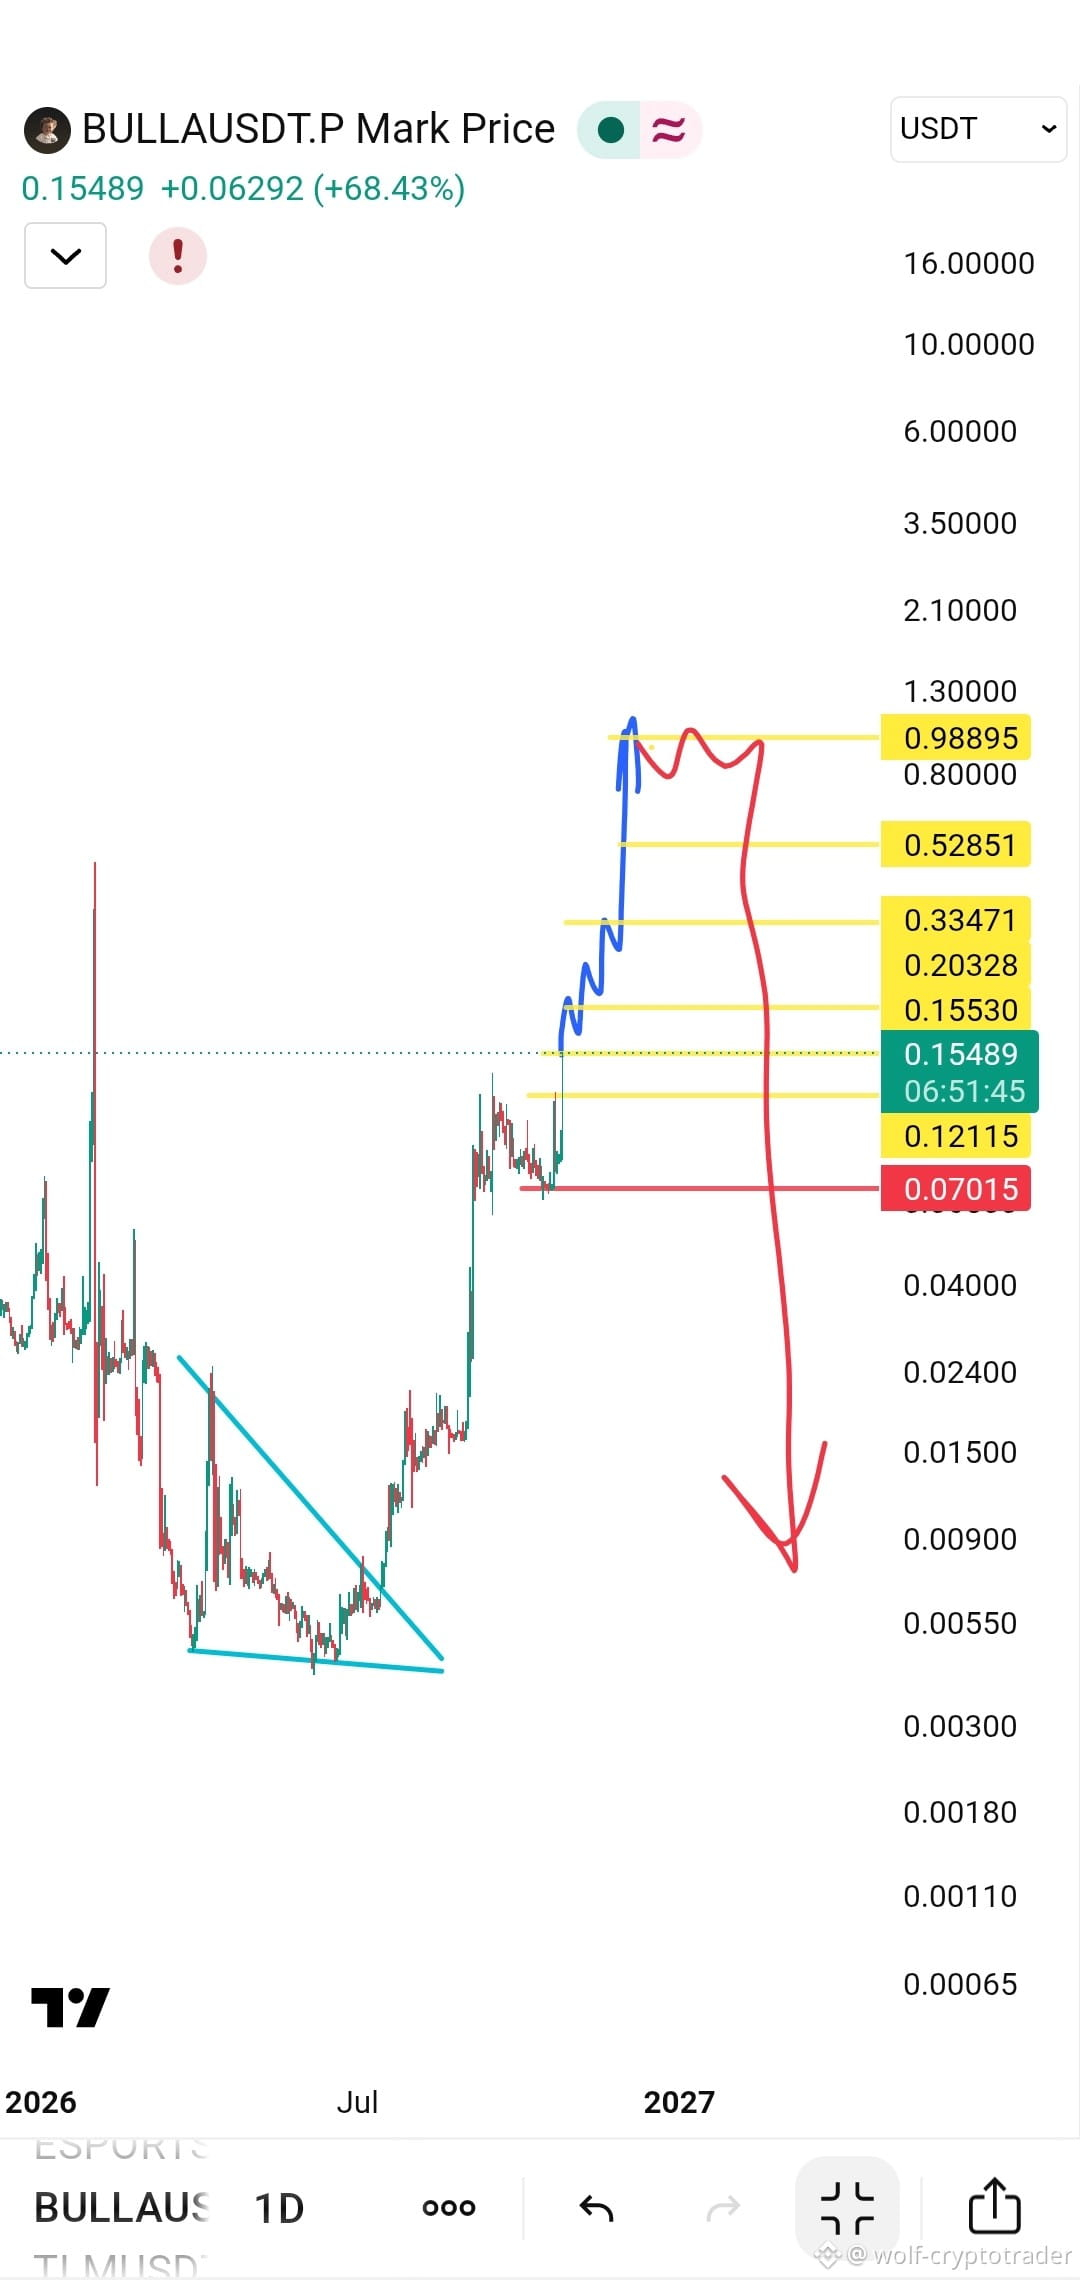
CHART KING 亗
·
--
🚀🔥 Buy long now — the descending triangle has been breached. Get ready for takeoff 💎
👀 Keep an eye on it — the price managed to break the descending triangle that had trapped the movement for weeks, confirming the start of a new uptrend wave
👀 Keep an eye on it — the price managed to break the descending triangle that had trapped the movement for weeks, confirming the start of a new uptrend wave
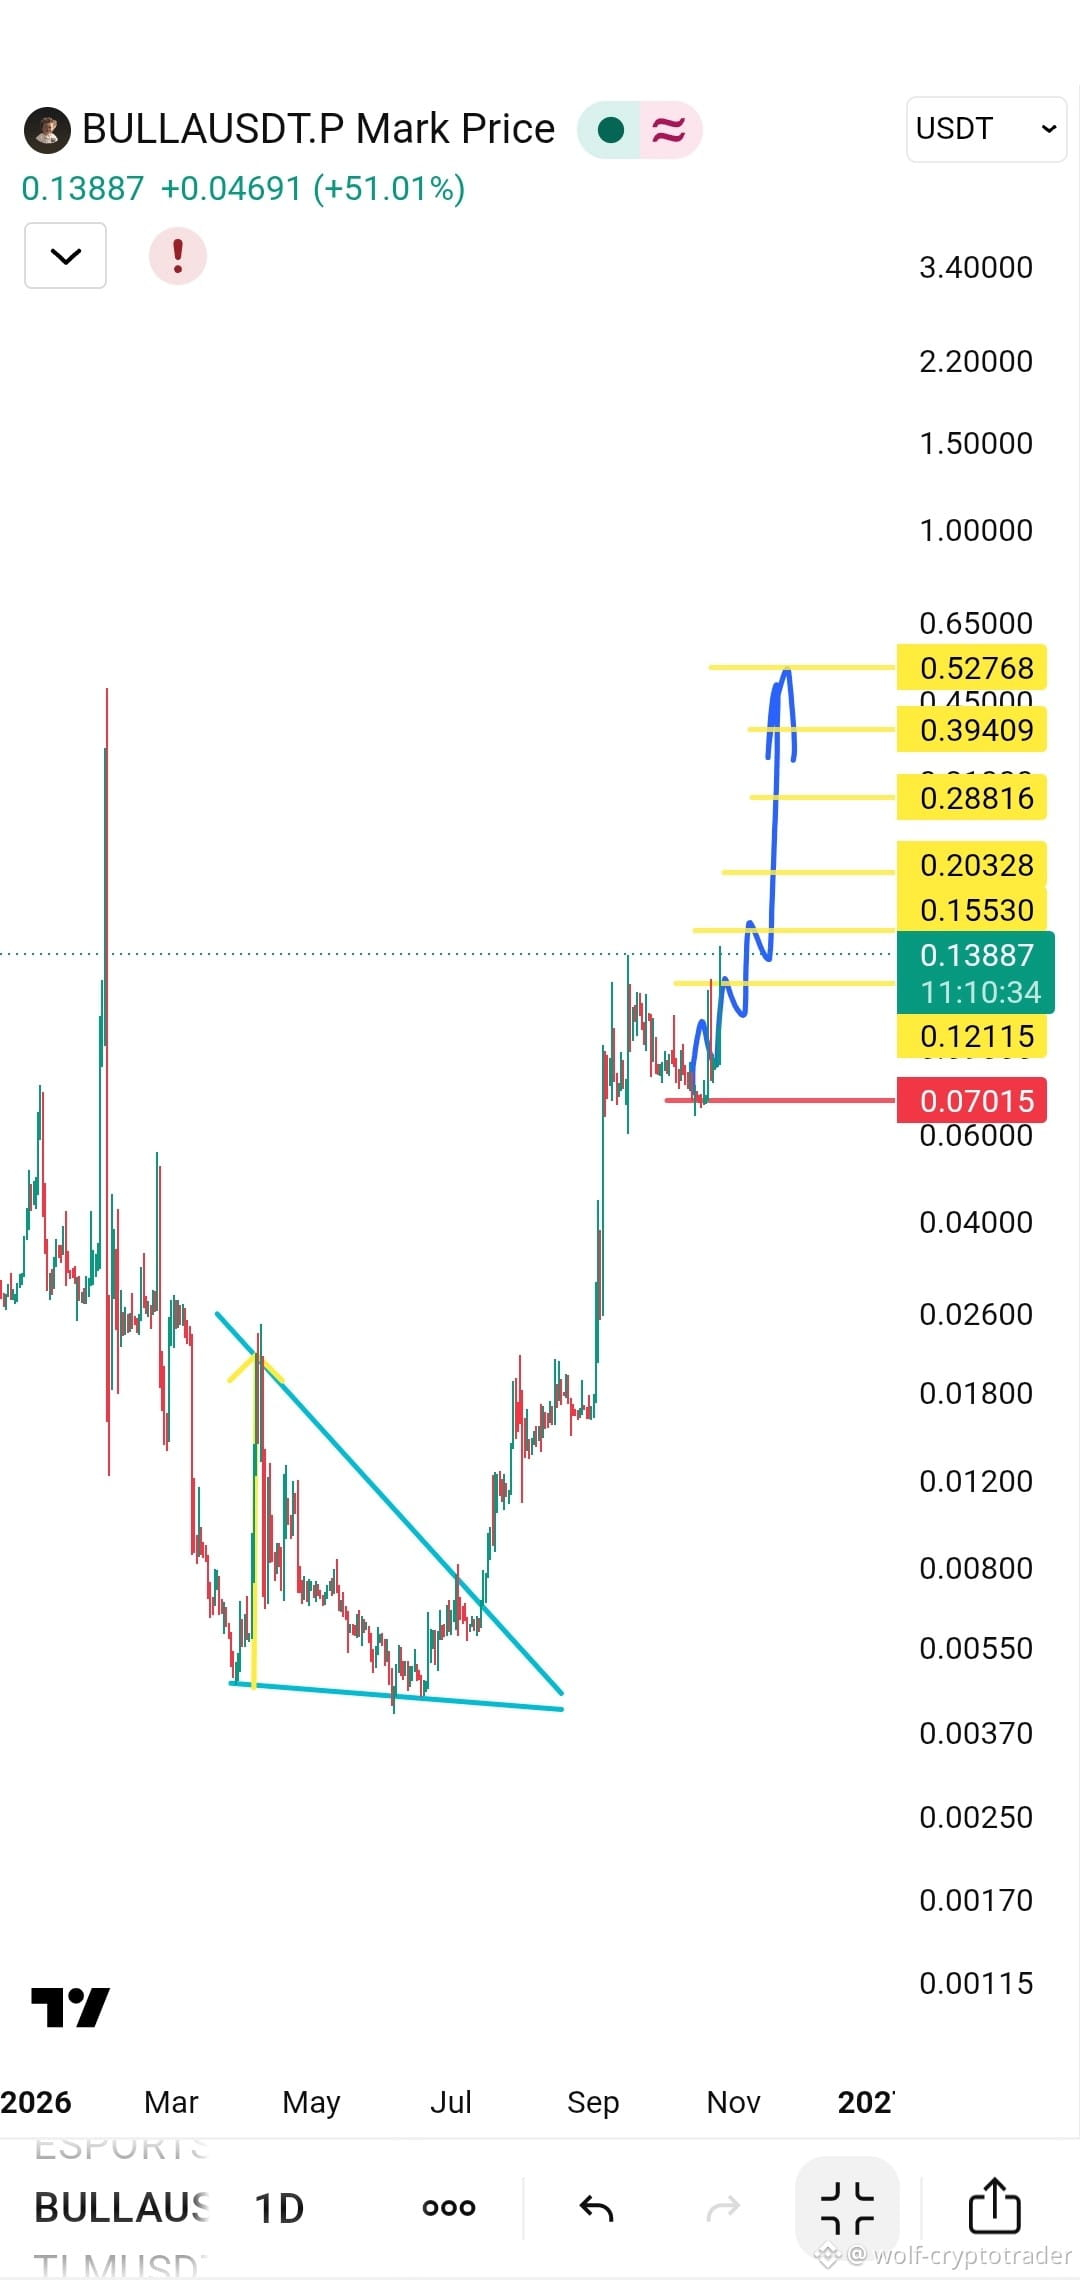
CHART KING 亗
·
--
🚀🔥 Buy long now — the descending triangle has been breached. Get ready for takeoff 💎
👀 Keep an eye on it — the price managed to break the descending triangle that had trapped the movement for weeks, confirming the start of a new uptrend wave
👀 Keep an eye on it — the price managed to break the descending triangle that had trapped the movement for weeks, confirming the start of a new uptrend wave
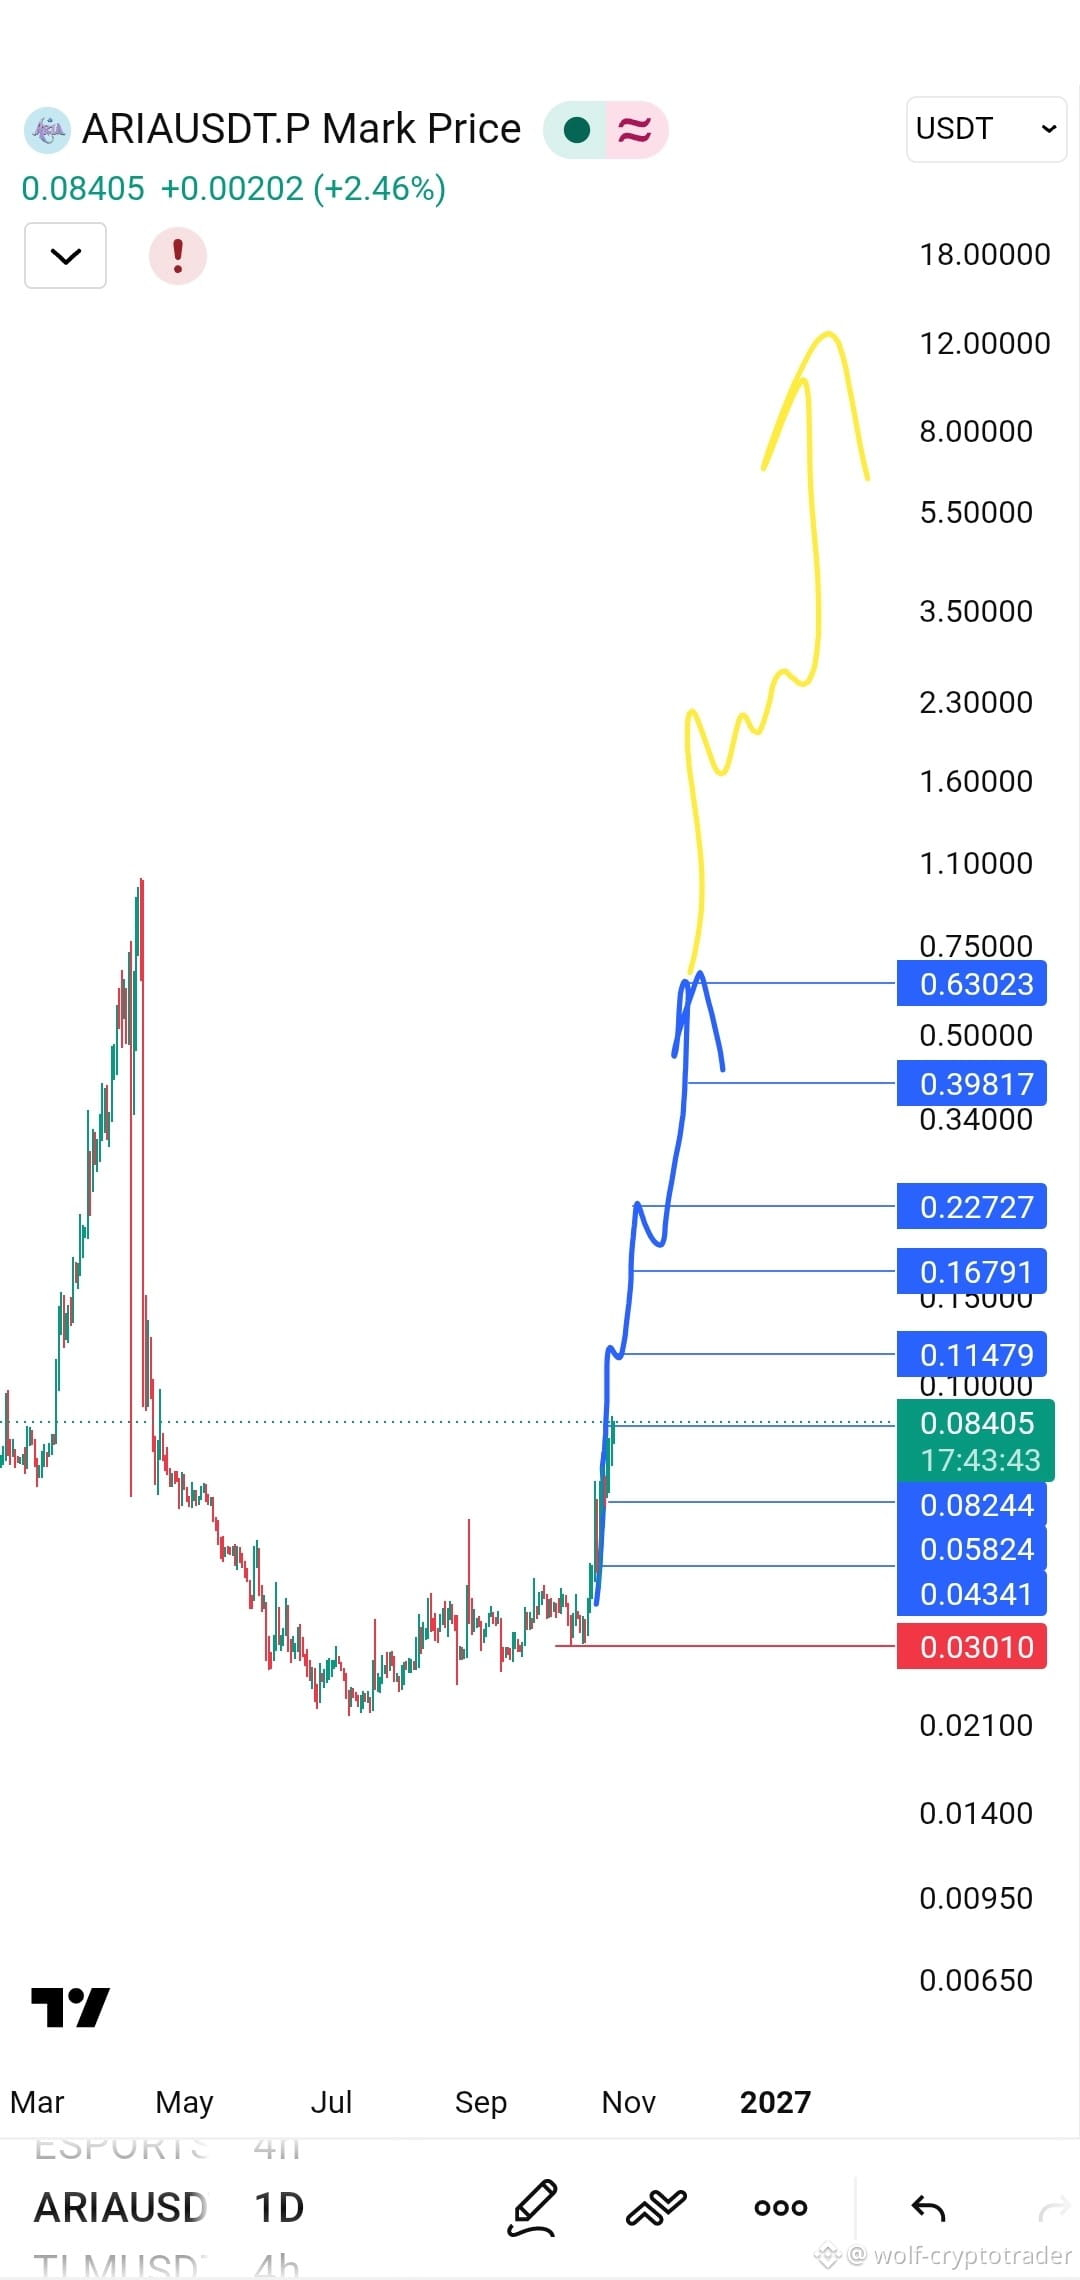
CHART KING 亗
·
--
📊 Between Silent Accumulation and an Upward Roadmap
Looking at the daily chart, we can see that ARIA went through a severe, deep correction, followed by a long and tedious accumulation phase at the bottom (the 0.0200 to 0.0300 range).
But the calm before the storm is beginning to shift.
📈 Today, we’re seeing a +10.69% rebound, with the price settling at 0.03623. What really stands out is the projected path (in blue) that analysts have drawn on the chart.
🔹 The Target Ladder
The technical outlook looks like a clearly defined roadmap. The path doesn’t stop at 0.04; it extends like a series of ascending steps:
🔸 0.05824
🔸 0.08244
🔸 0.11479
🔸 0.16791
🔸 0.22727
🔸 0.39817
🔸 Reaching 0.63023
$ARIA
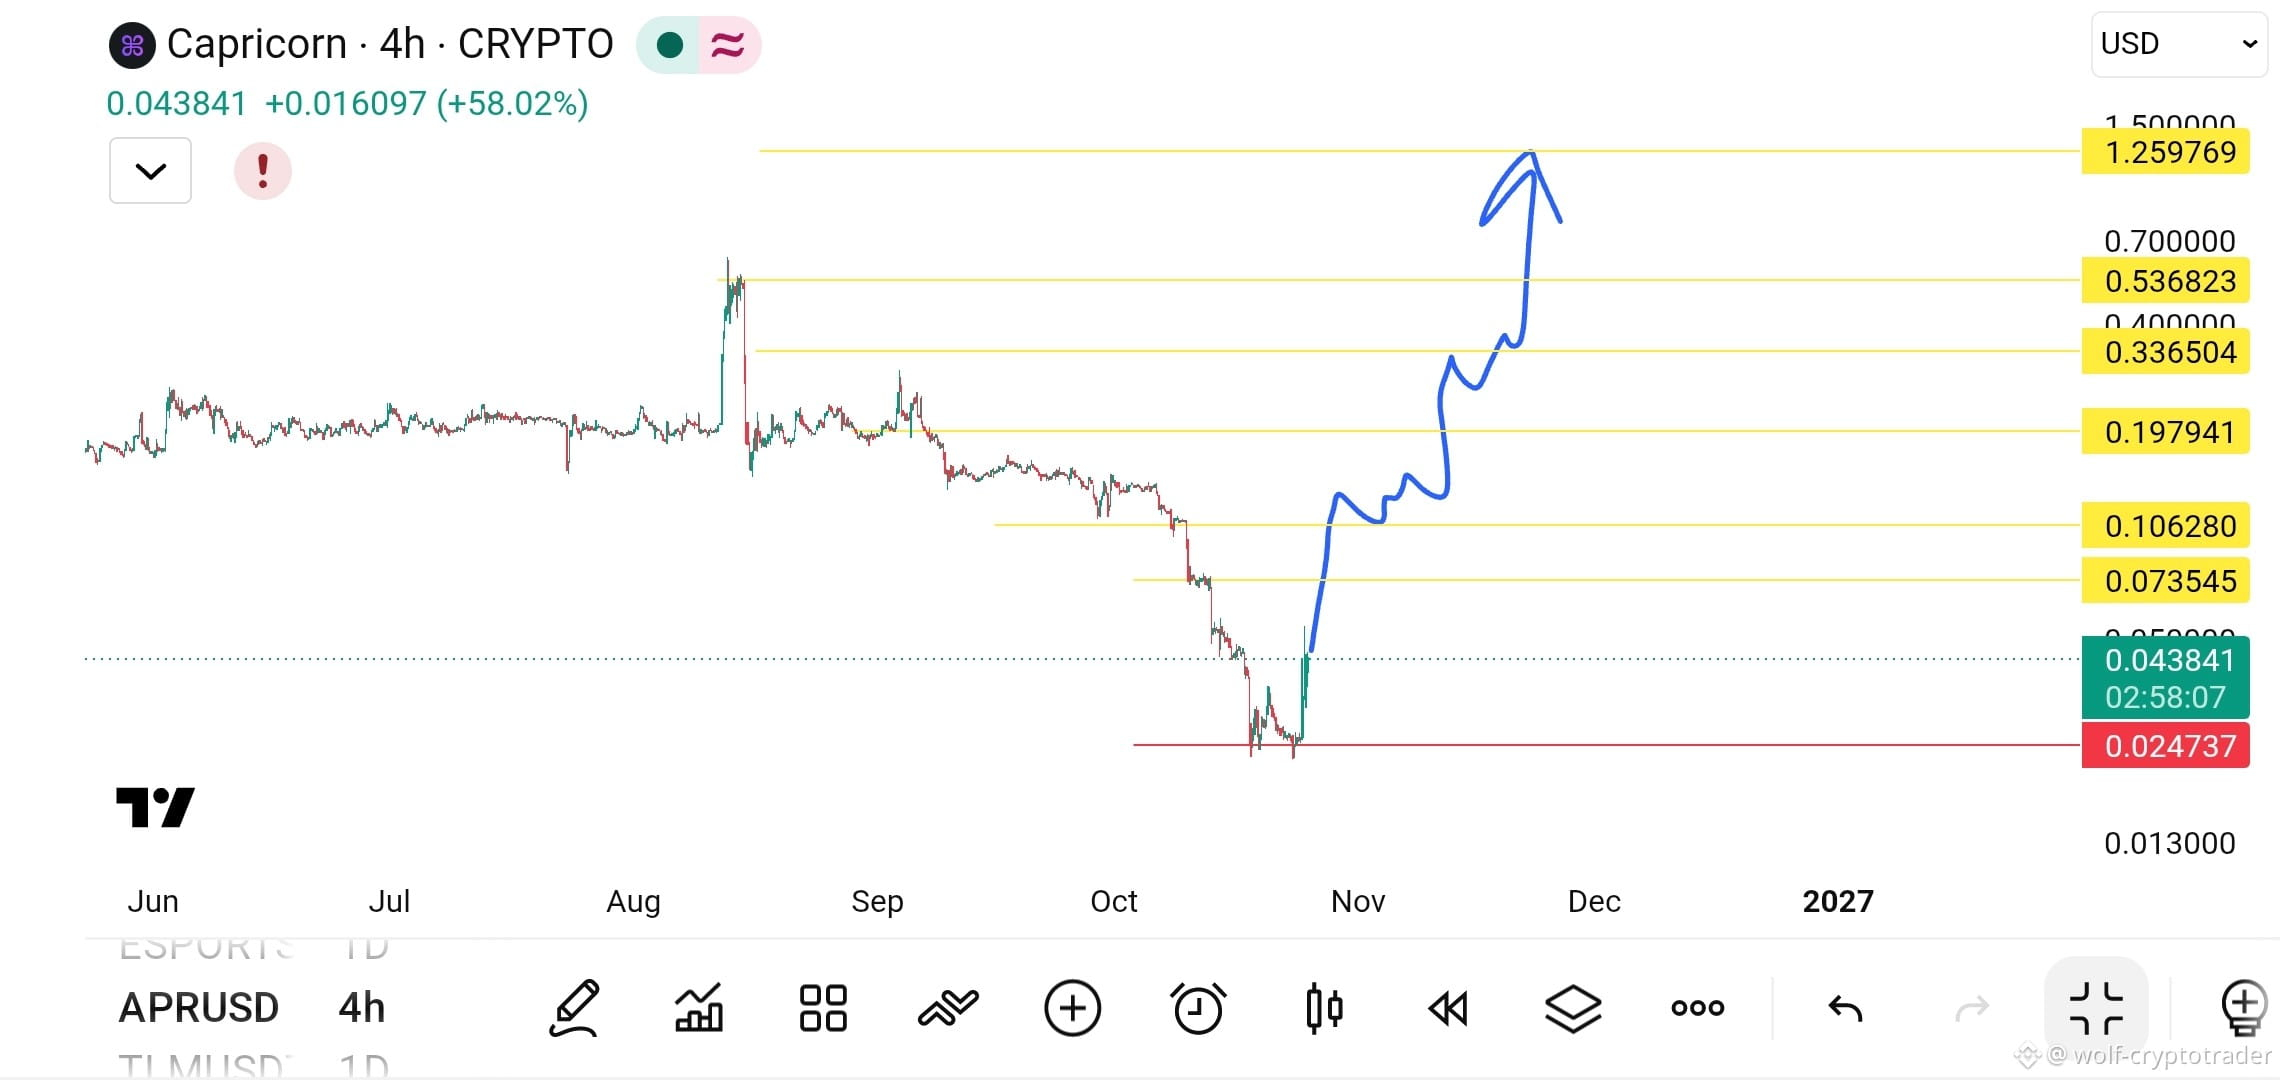
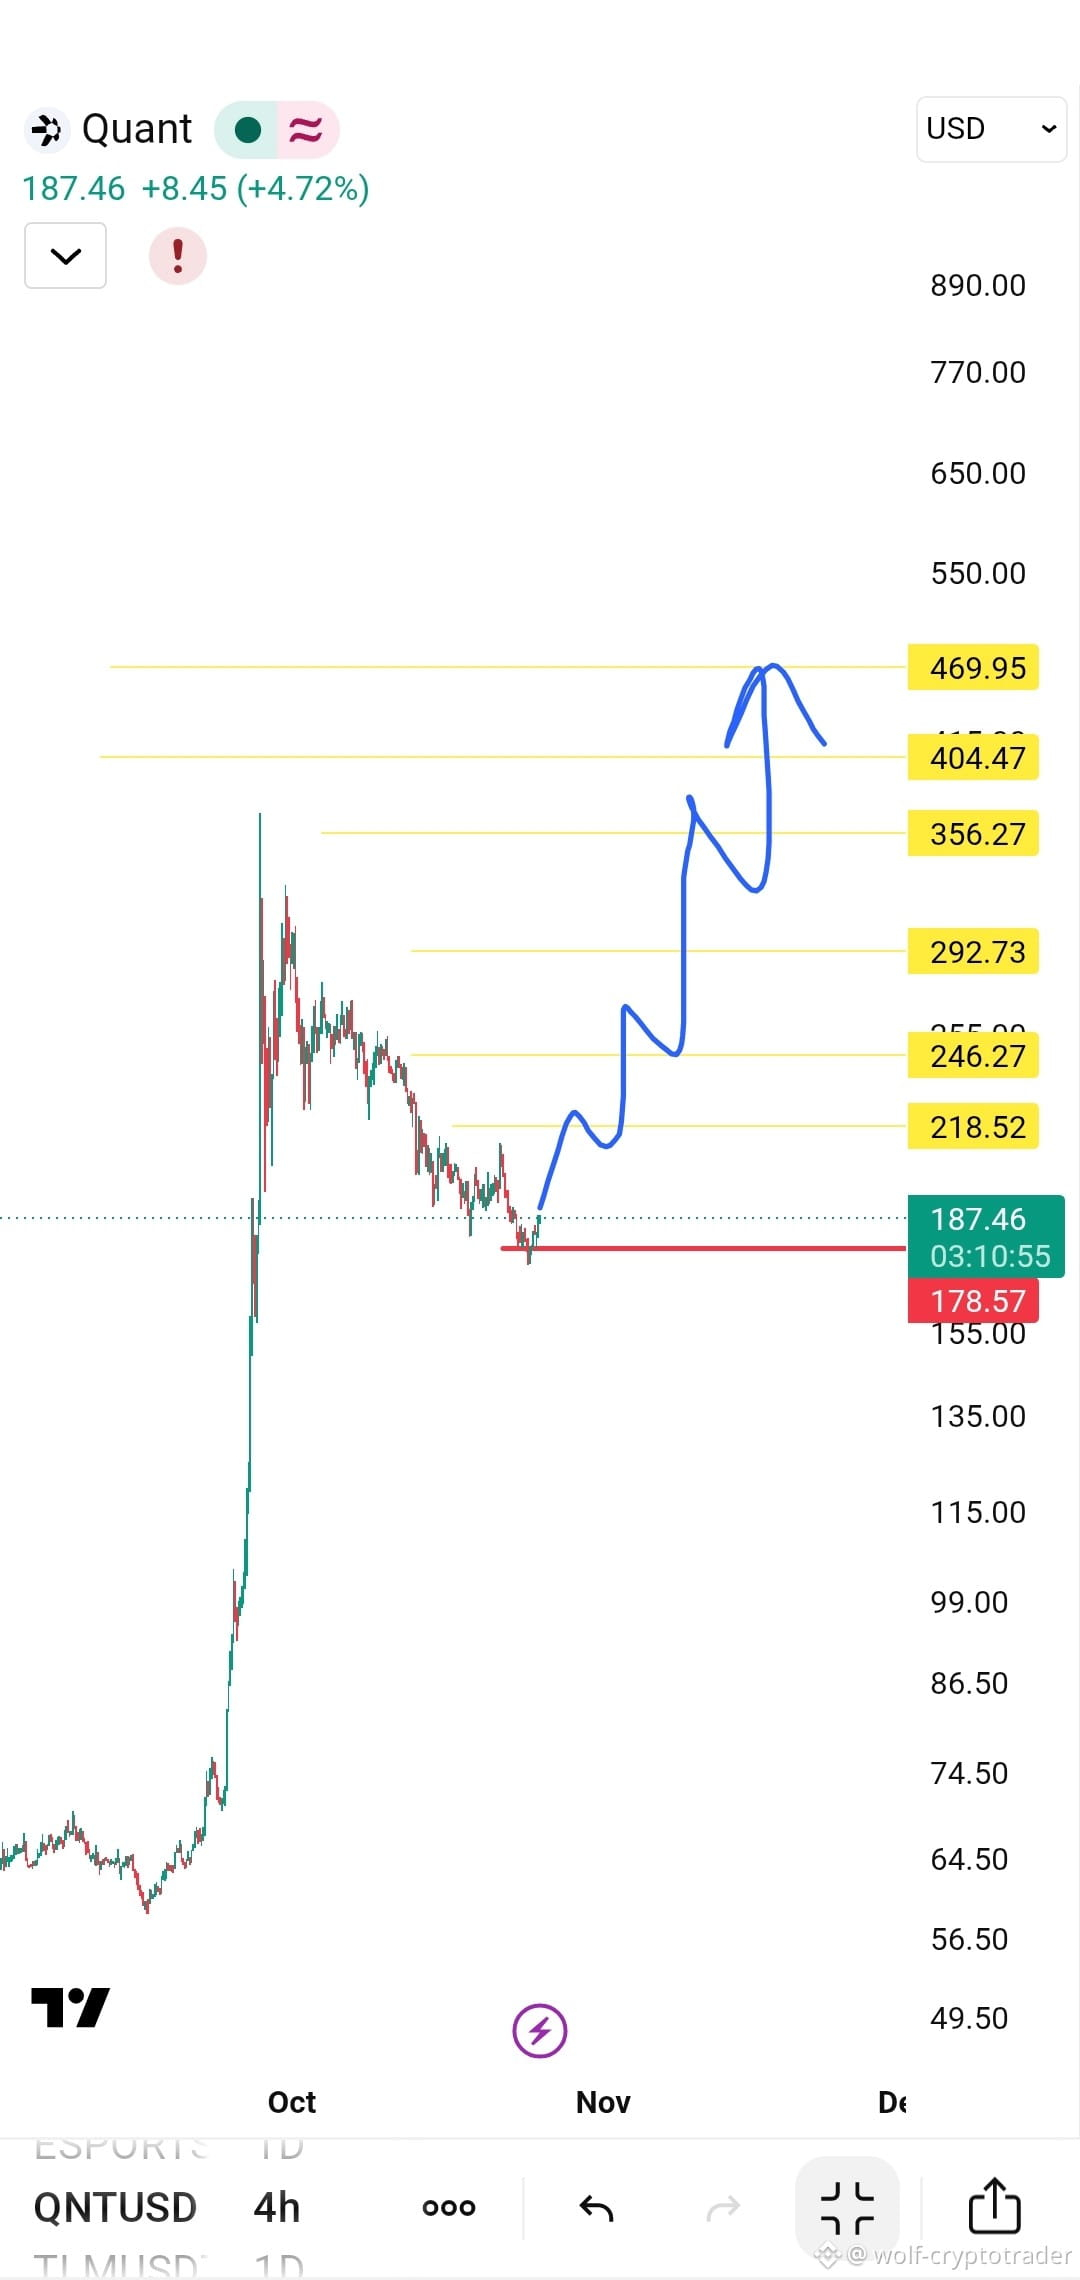
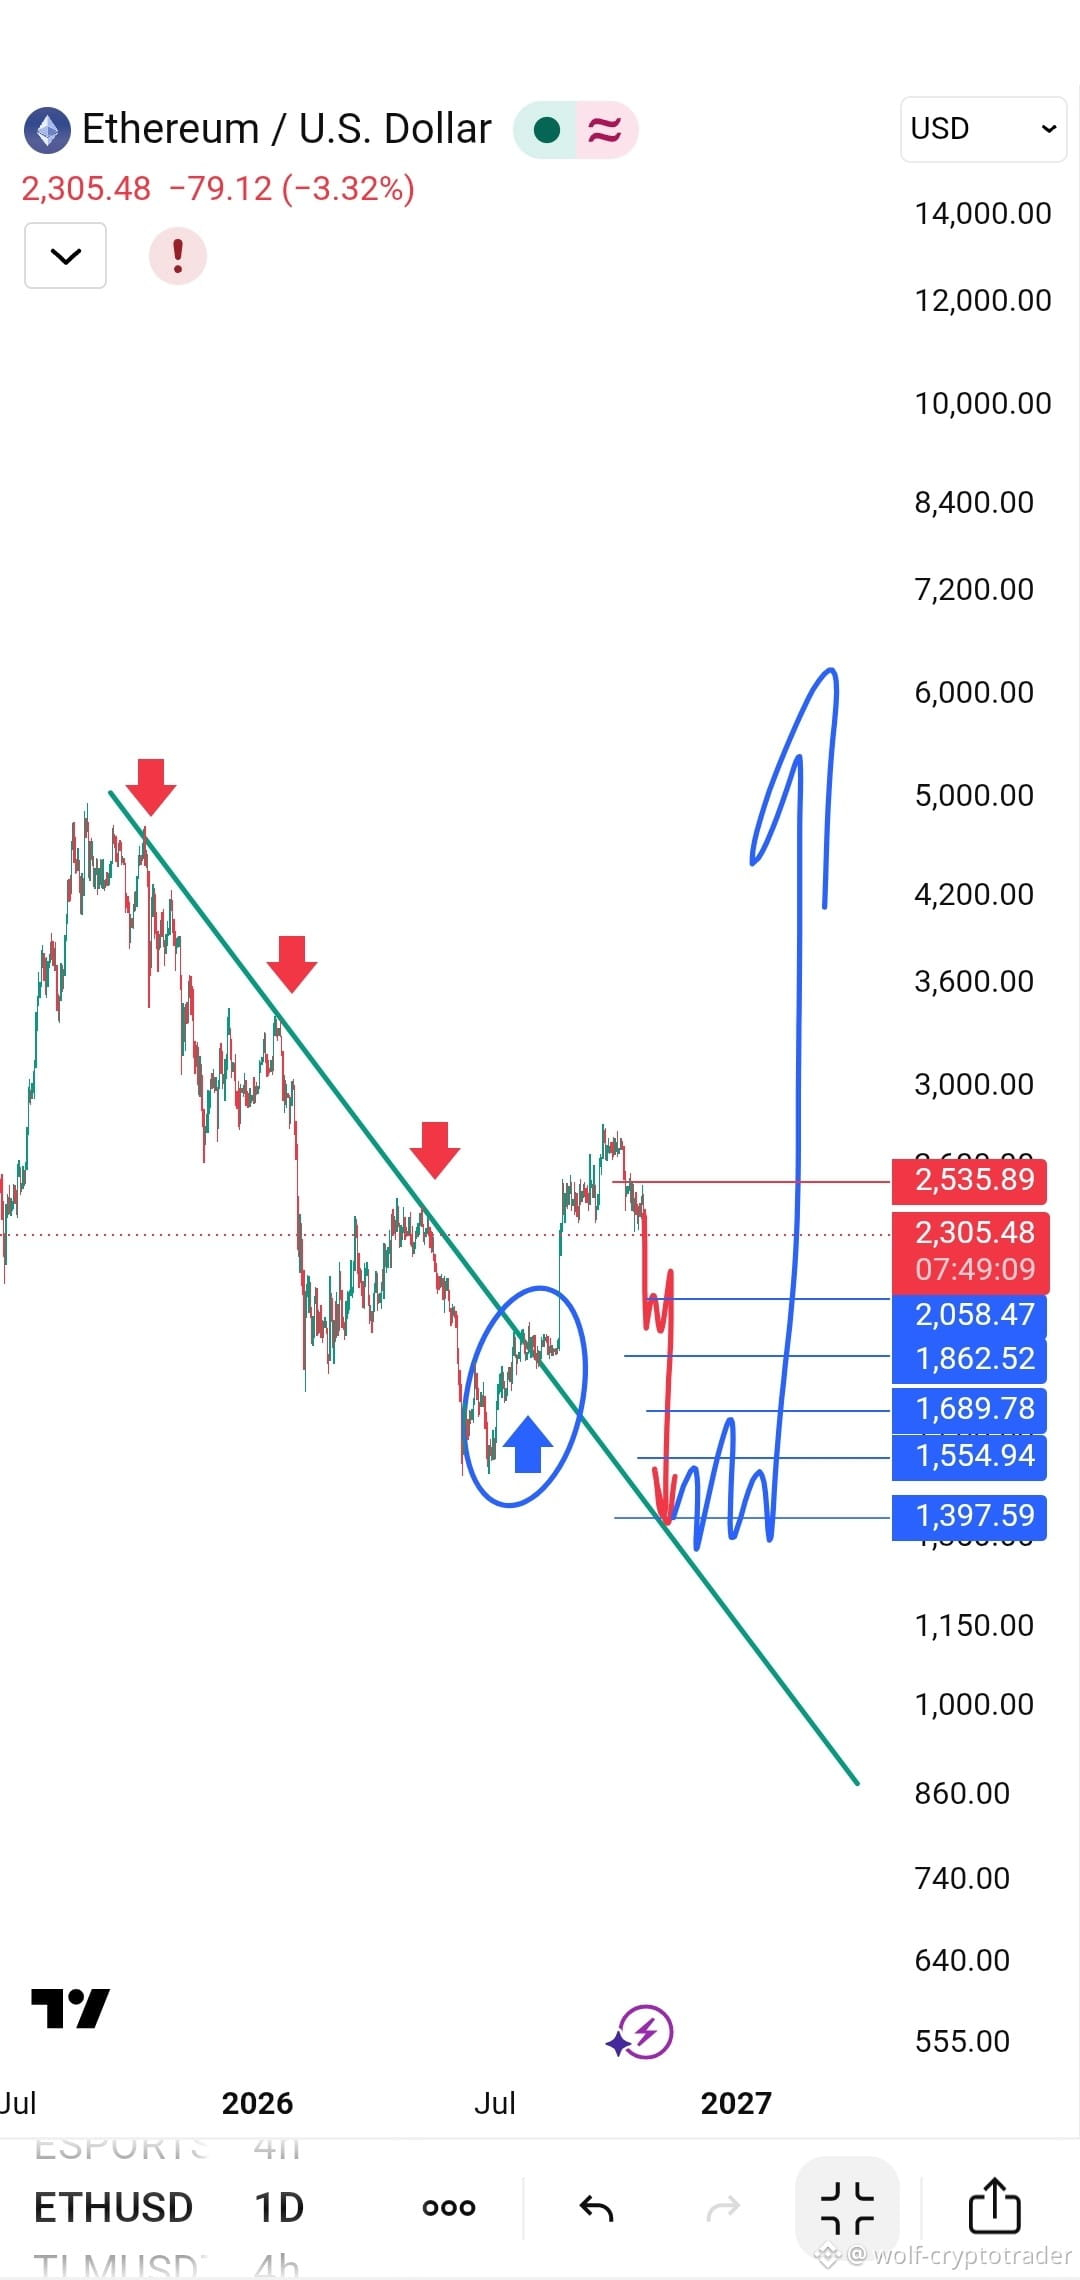
CHART KING 亗
·
--
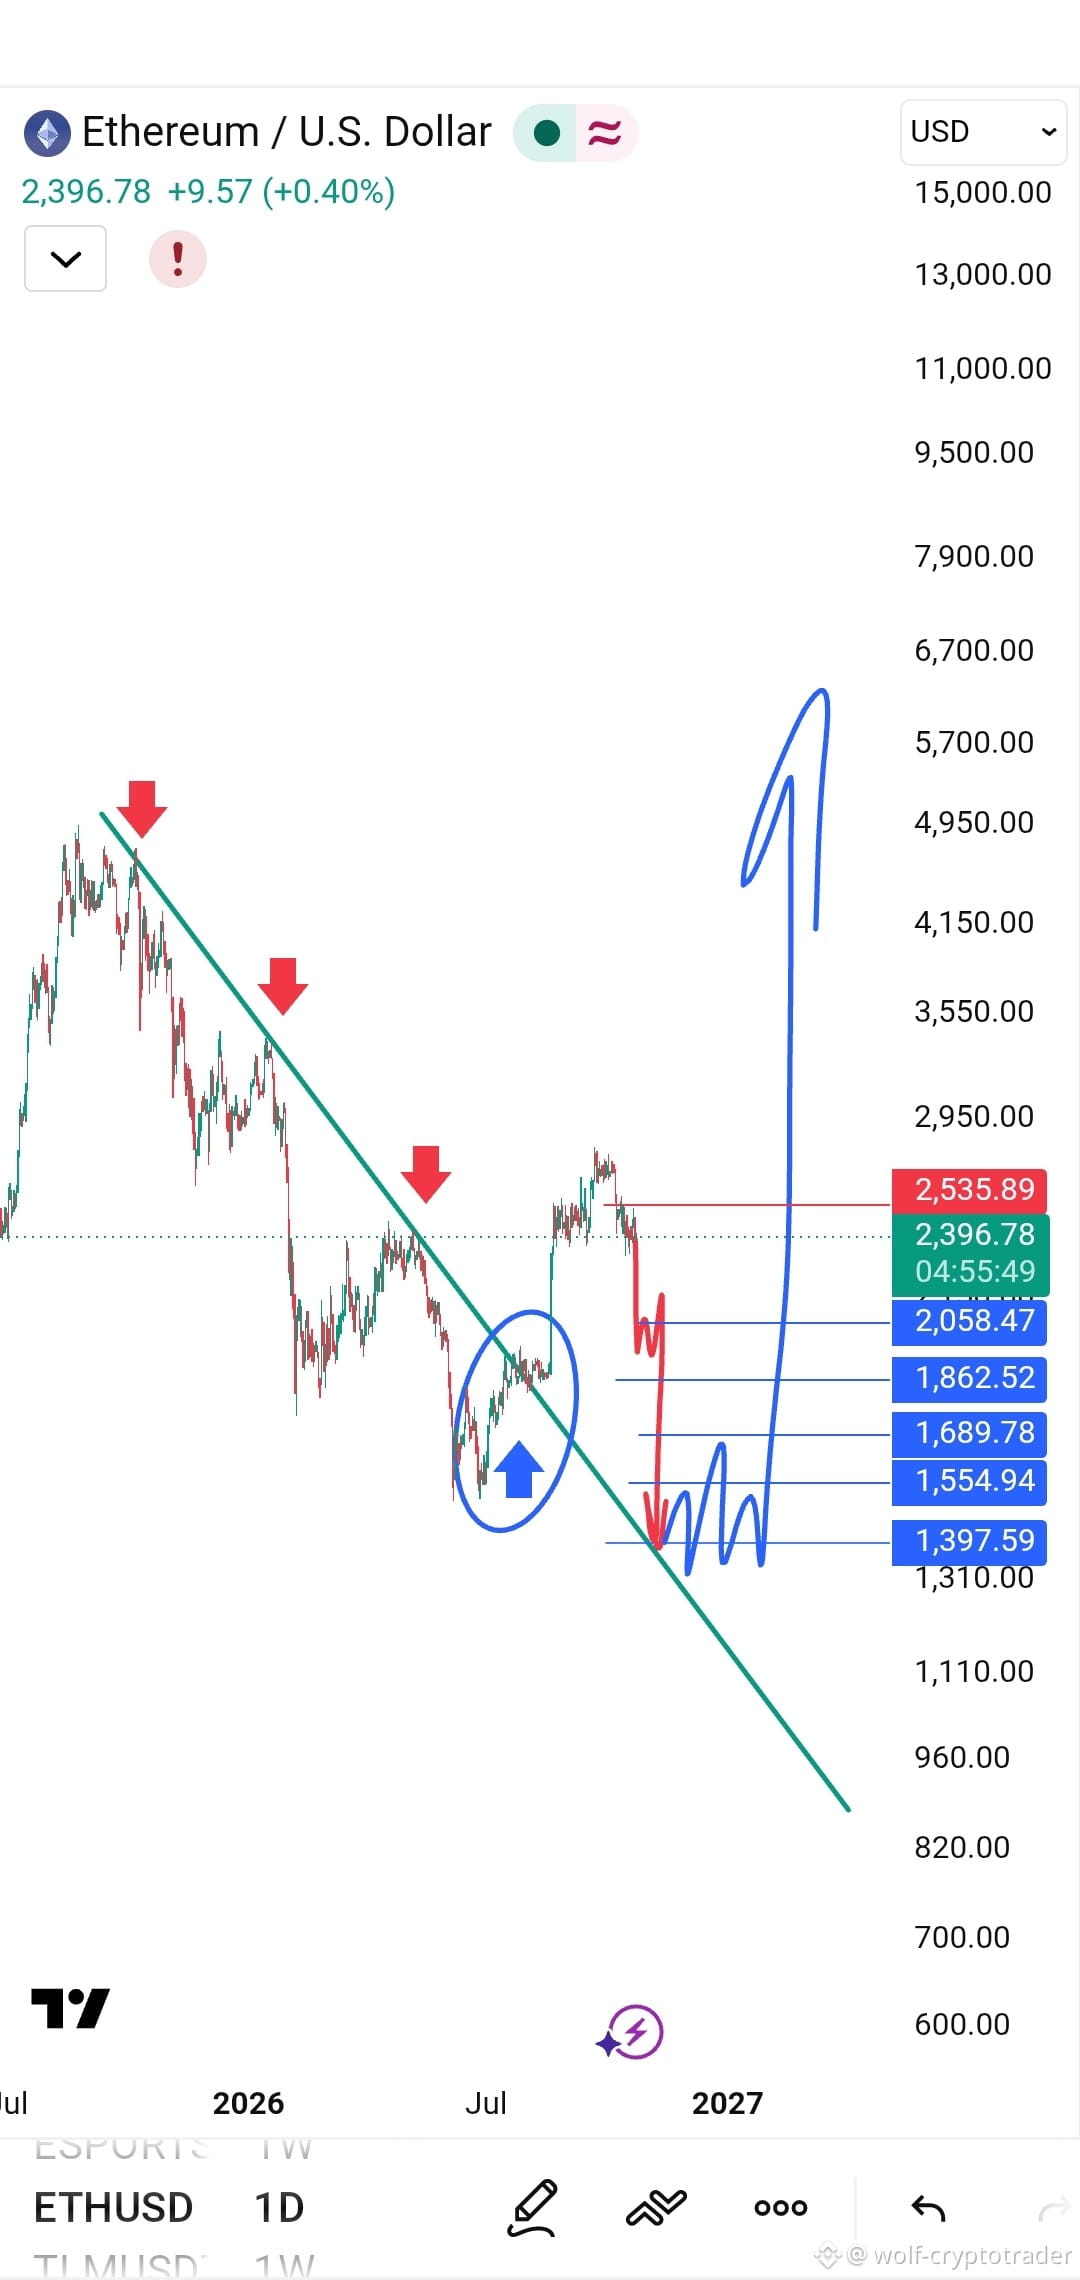
🚨 Bull Trap or Major Bear Opportunity? A Critical Retest for Ethereum
In technical analysis, nothing is more dangerous than a false breakout. Look at the Ethereum (ETH) chart on the daily timeframe (1D). The current price structure tells a precise technical story and puts traders at a decisive moment of truth.
📊 Why does this chart look so dangerous for buyers?
🔹 Breakout Trap (Bull Trap): Remember the breakout inside the blue circle? Many thought the downtrend was over, and the price rose to $2,600. But it failed to hold that level and began to fall again.
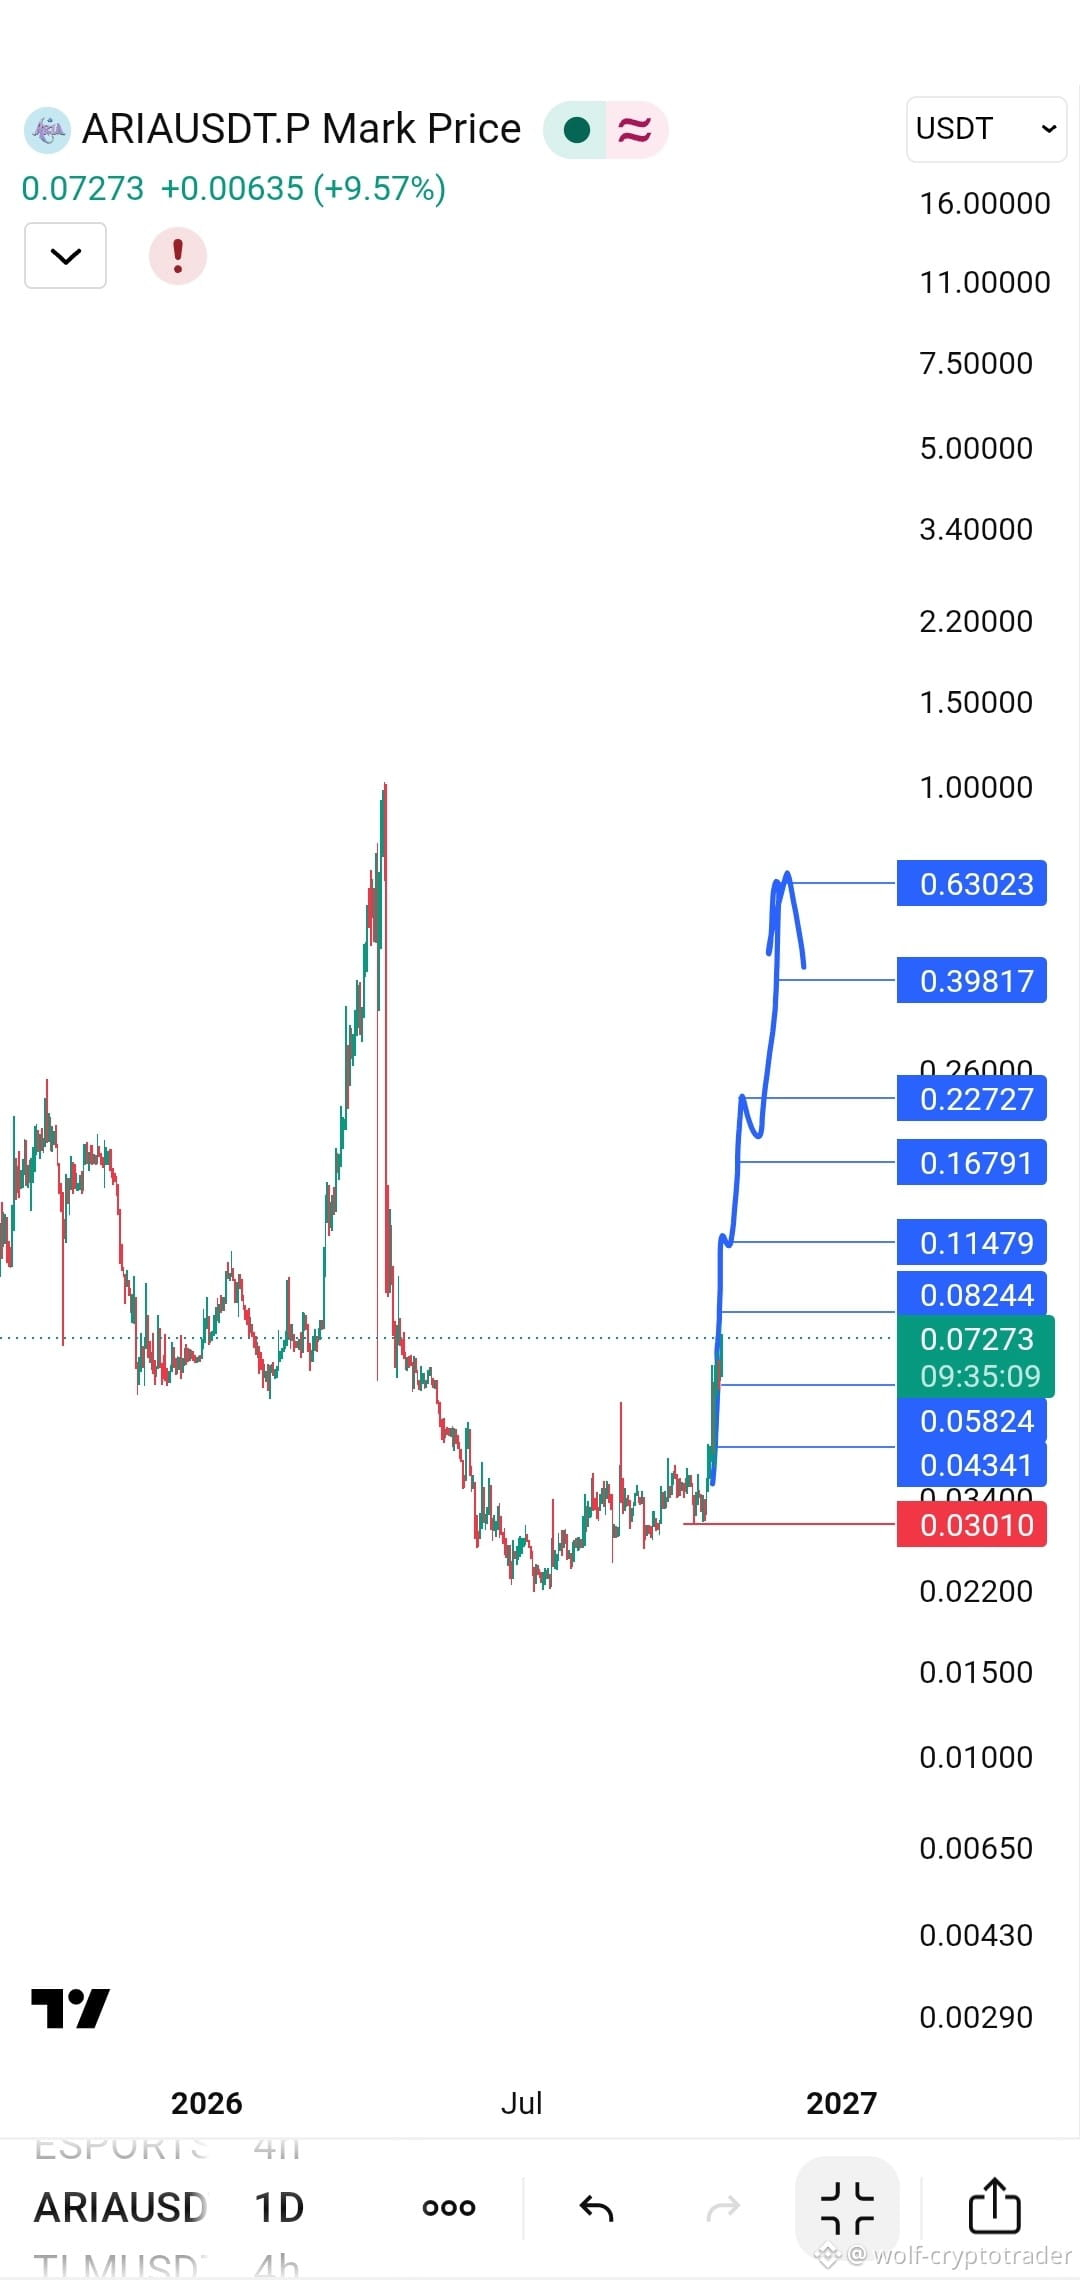
CHART KING 亗
·
--
📊 Between Silent Accumulation and an Upward Roadmap
Looking at the daily chart, we can see that ARIA went through a severe, deep correction, followed by a long and tedious accumulation phase at the bottom (the 0.0200 to 0.0300 range).
But the calm before the storm is beginning to shift.
📈 Today, we’re seeing a +10.69% rebound, with the price settling at 0.03623. What really stands out is the projected path (in blue) that analysts have drawn on the chart.
🔹 The Target Ladder
The technical outlook looks like a clearly defined roadmap. The path doesn’t stop at 0.04; it extends like a series of ascending steps:
🔸 0.05824
🔸 0.08244
🔸 0.11479
🔸 0.16791
🔸 0.22727
🔸 0.39817
🔸 Reaching 0.63023
$ARIA
Looking at the daily chart, we can see that ARIA went through a severe, deep correction, followed by a long and tedious accumulation phase at the bottom (the 0.0200 to 0.0300 range).
But the calm before the storm is beginning to shift.
📈 Today, we’re seeing a +10.69% rebound, with the price settling at 0.03623. What really stands out is the projected path (in blue) that analysts have drawn on the chart.
🔹 The Target Ladder
The technical outlook looks like a clearly defined roadmap. The path doesn’t stop at 0.04; it extends like a series of ascending steps:
🔸 0.05824
🔸 0.08244
🔸 0.11479
🔸 0.16791
🔸 0.22727
🔸 0.39817
🔸 Reaching 0.63023
$ARIA
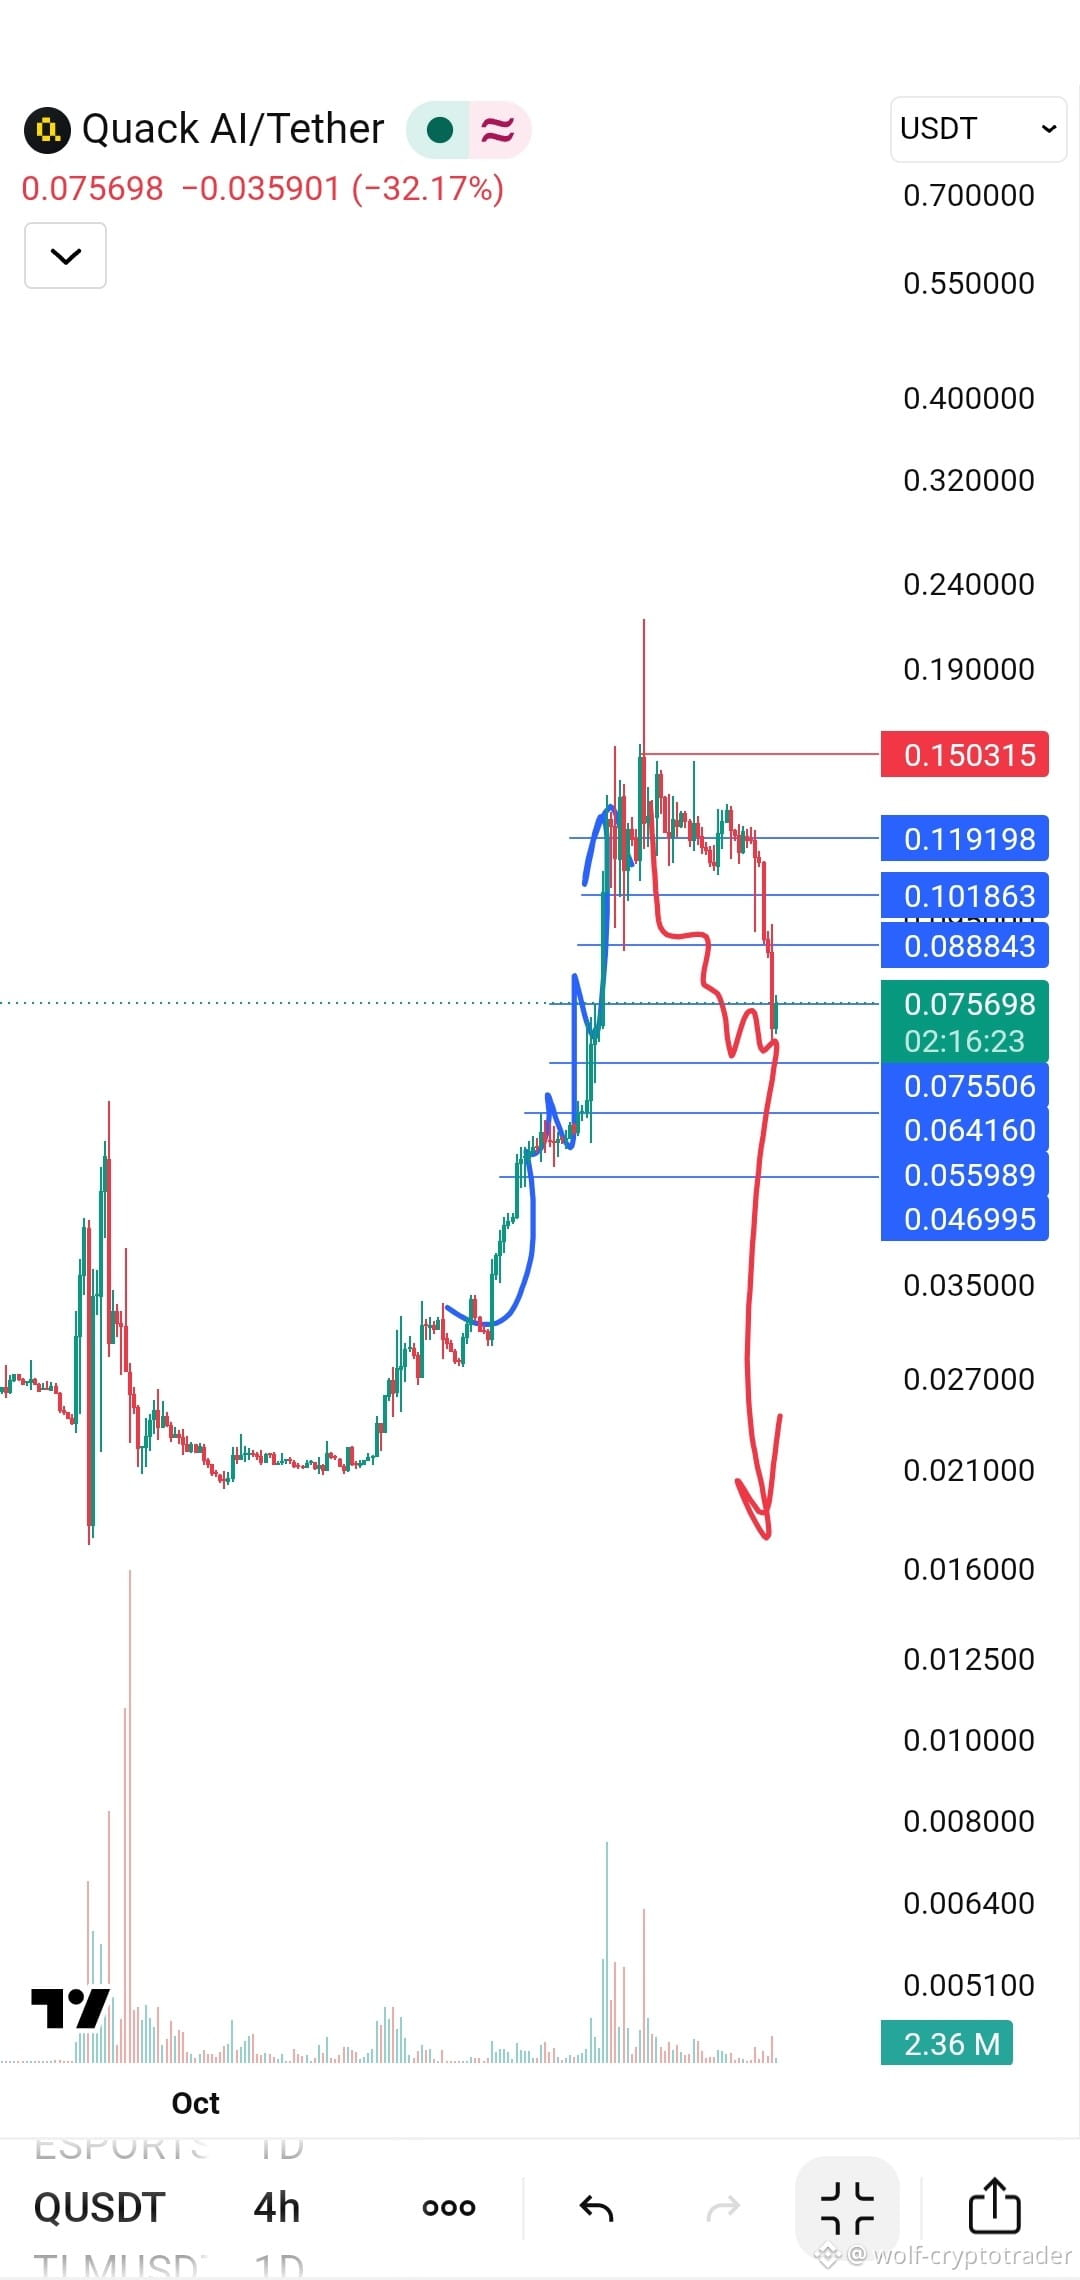
CHART KING 亗
·
--
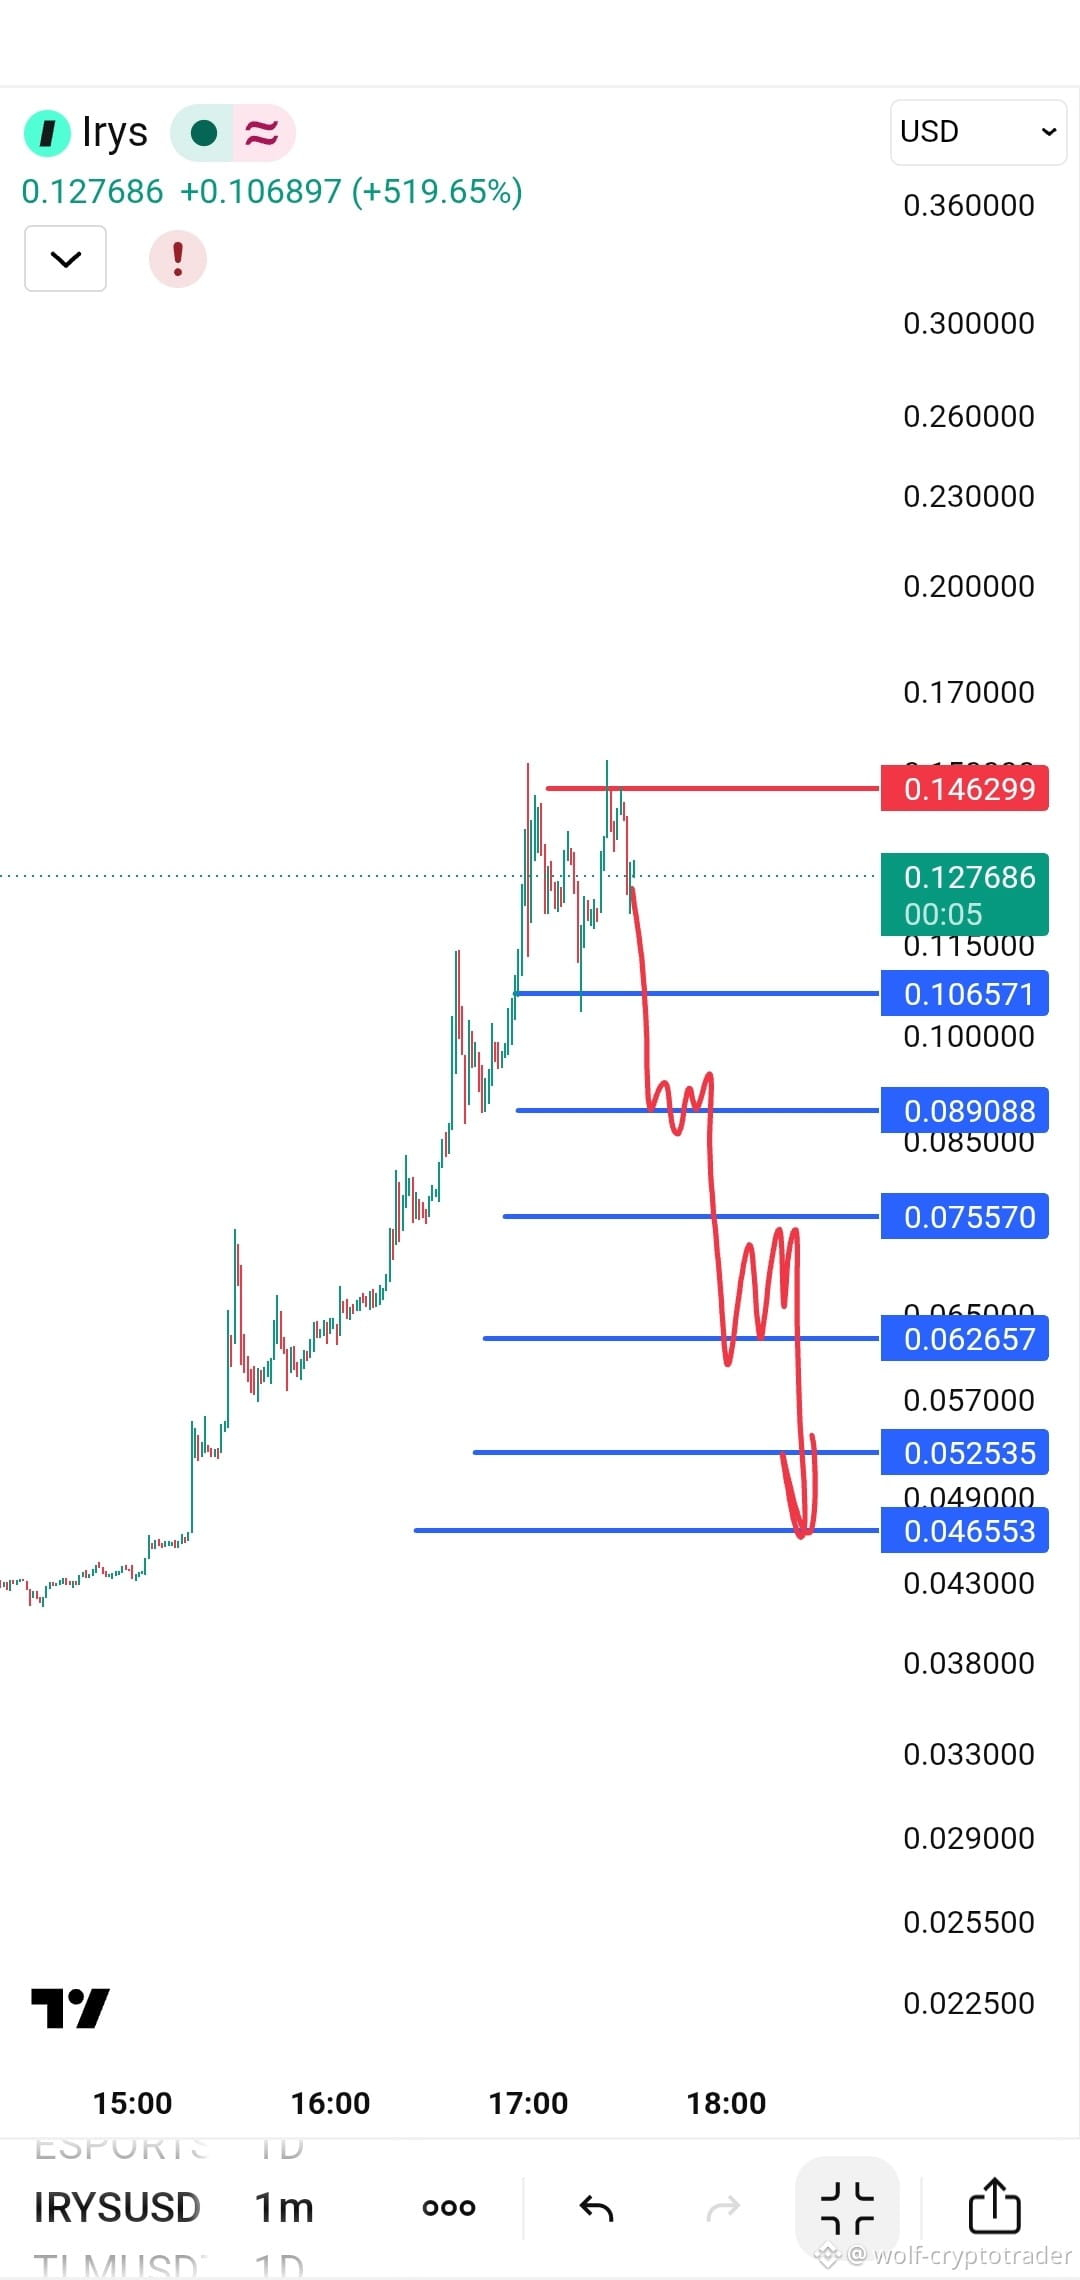
The end of FOMO euphoria and the start of the journey back to the bottom (Short Trade Analysis)
After an exaggerated vertical rise (Parabolic Move) took the coin to an all-time high above 0.21$ , the indicators for coin Q appear to have reached a stage of buying exhaustion. The attached chart (4-hour timeframe) outlines a clear roadmap for a trend reversal from bullish to bearish, creating an ideal opportunity for short trades.
This analysis is for educational purposes and is based on technical data. It is not financial advice.
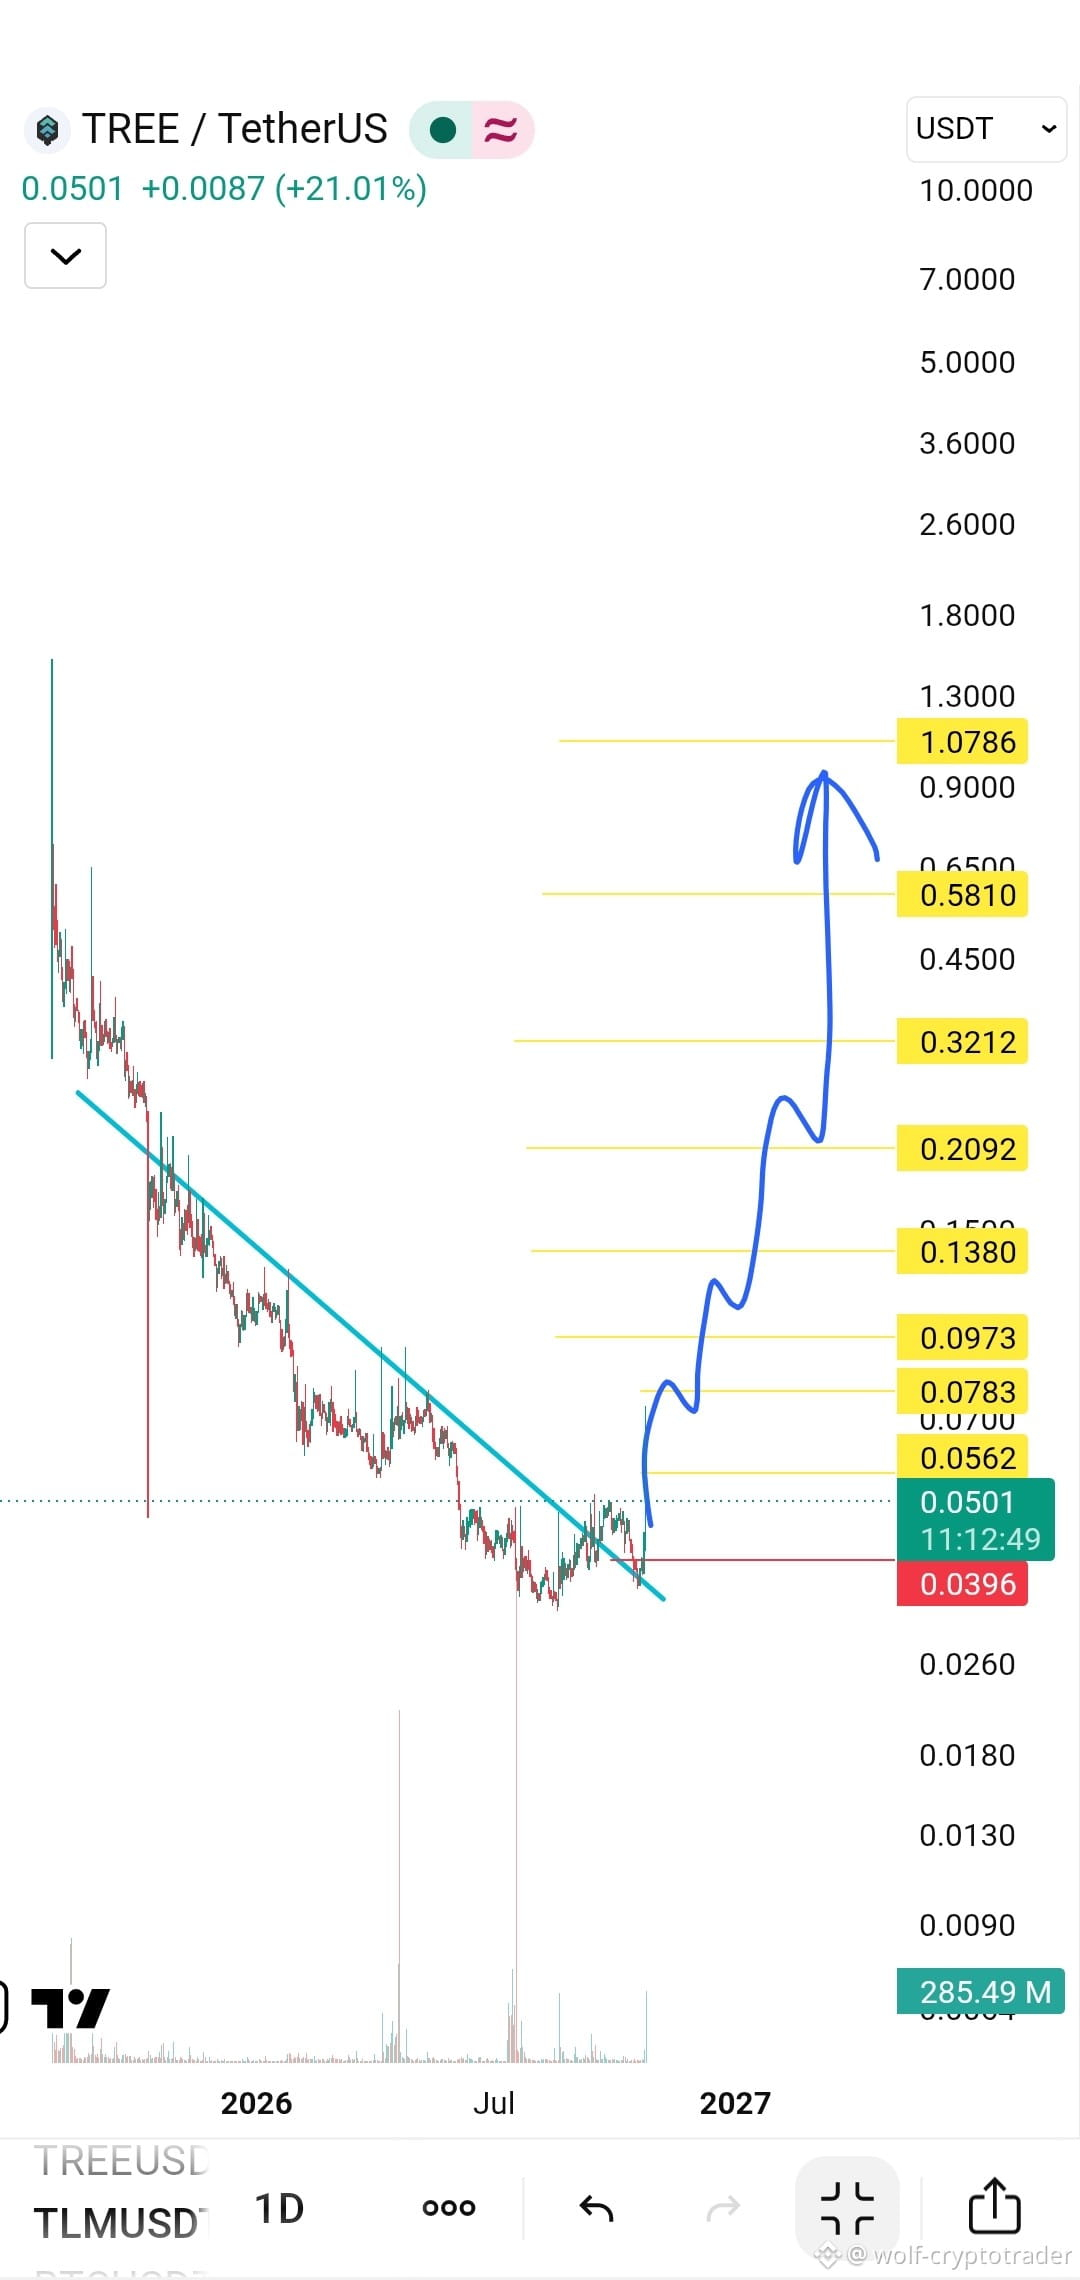
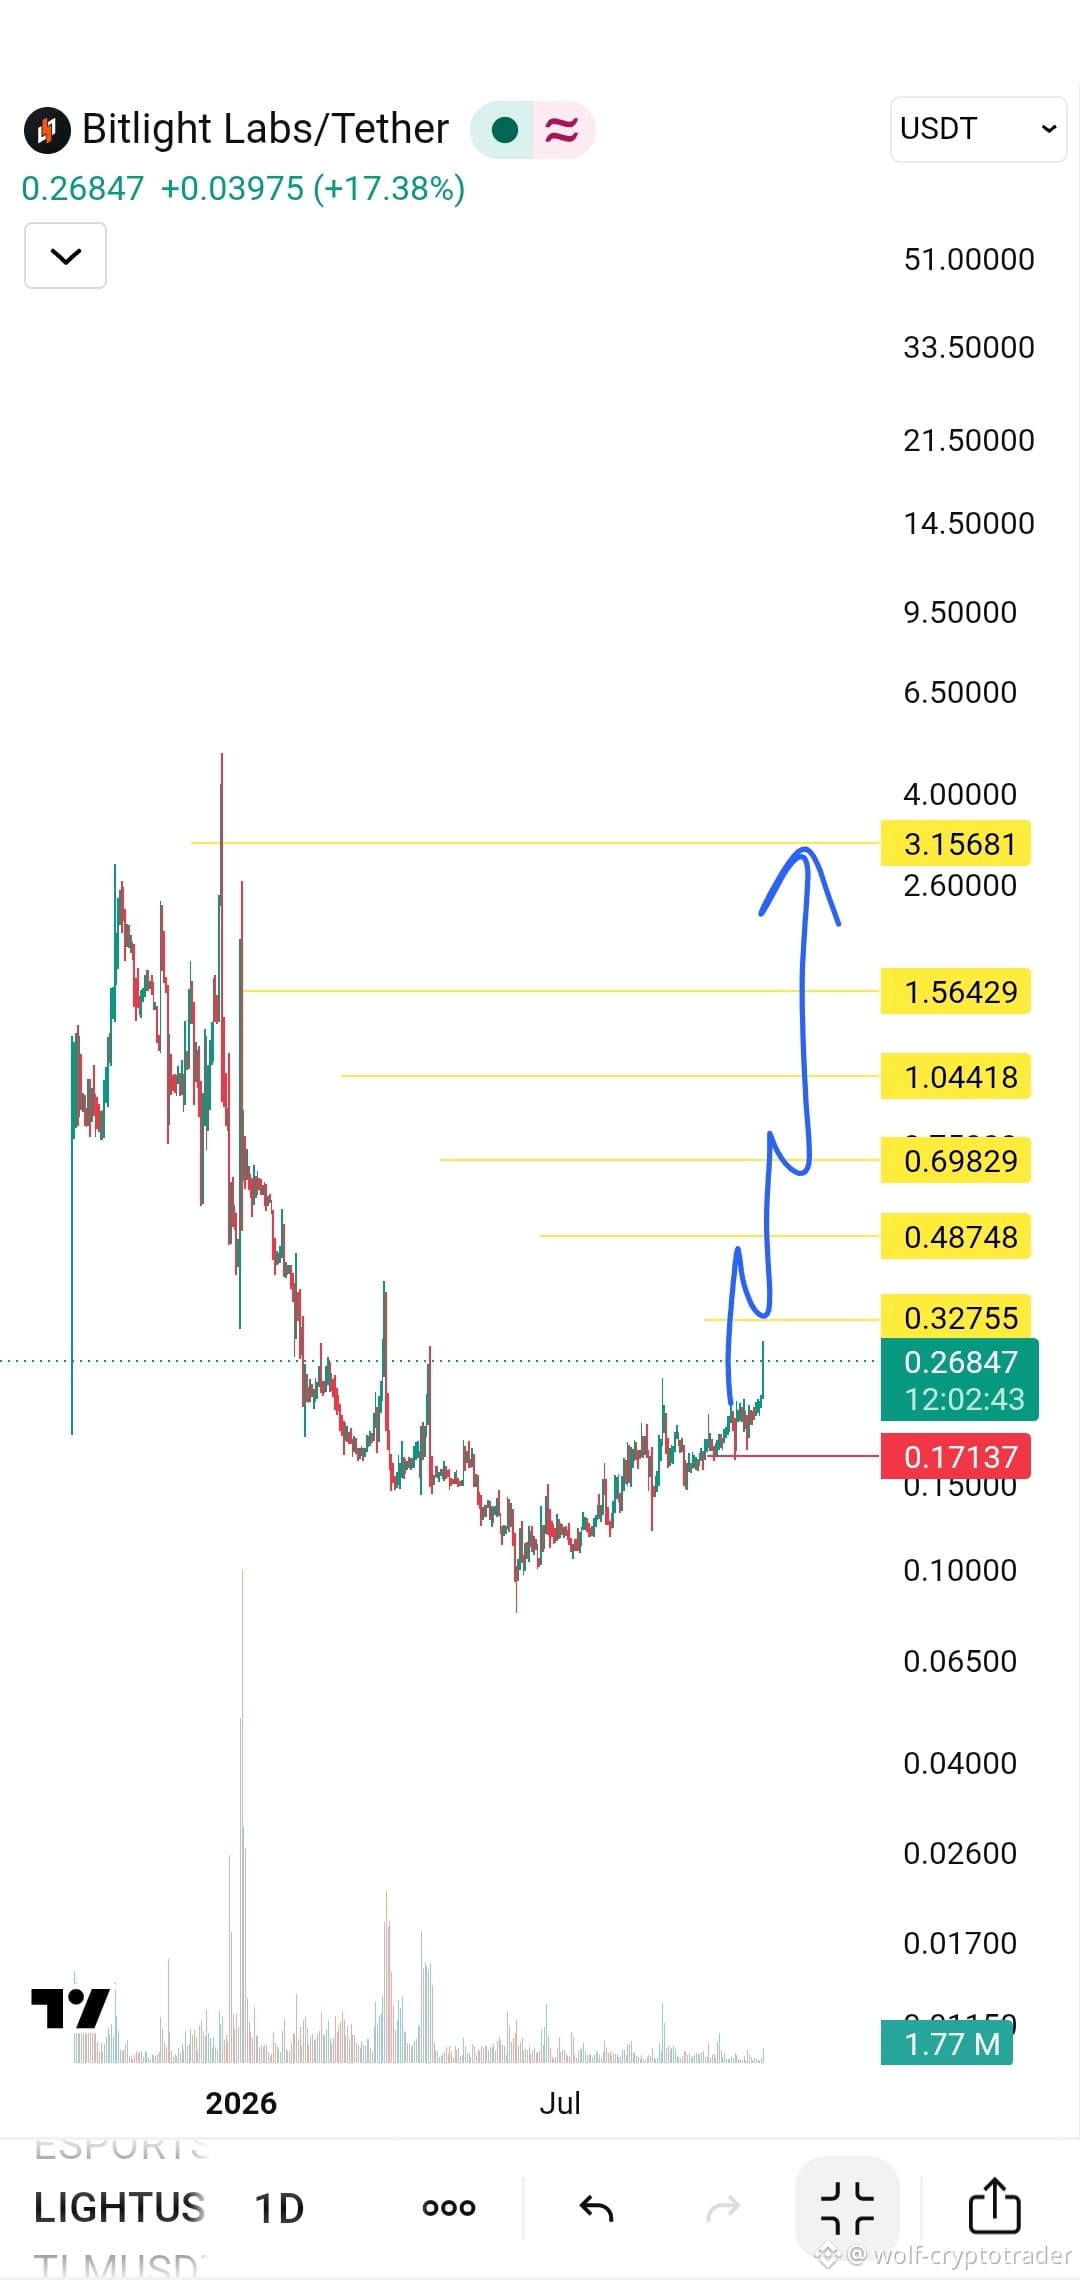
CHART KING 亗
·
--
🔥 Are you ready for the next wave? 🚀
The coin that had been in a very long accumulation phase since the beginning of 2026 has finally started showing strong breakout signals.
It has swept the market recently, but as they say, great opportunities are born from the depths of the lows. Now, we're seeing a clear break above the downtrend lines, and the coin's current price of 0.21 is just the beginning.
🟢 Long position available
👀 Keep your eyes on it—it's getting ready to fly to the moon 💎
Your targets and stop-loss are on the chart
$LIGHT
The coin that had been in a very long accumulation phase since the beginning of 2026 has finally started showing strong breakout signals.
It has swept the market recently, but as they say, great opportunities are born from the depths of the lows. Now, we're seeing a clear break above the downtrend lines, and the coin's current price of 0.21 is just the beginning.
🟢 Long position available
👀 Keep your eyes on it—it's getting ready to fly to the moon 💎
Your targets and stop-loss are on the chart
$LIGHT
Log in to explore more content