

TuanHaris
64 Posts

TuanHaris
Report
Block User
Tuan Haris | Ruang kolaborasi trader cerdas. Tinggalkan bias, mari saling berbagi wawasan & menangkap probabilitas nyata di pasar kripto bersama-sama.
High-Frequency Trader
1.1 Years
87 Following
85 Followers
53 Liked
Posts
·
--
$DOOD Monitor this coin..wait for a reversal signal on the 15m timeframe
{future}(DOODUSDT)
$DOOD Monitor this coin..wait for a reversal signal on the 15m timeframe
1
1
396
·
--
Bullish
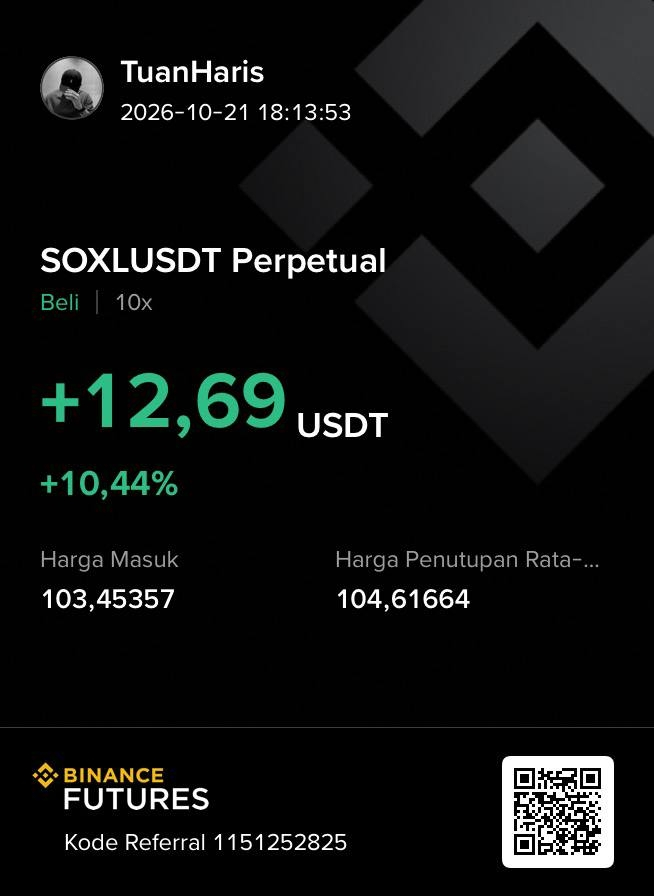
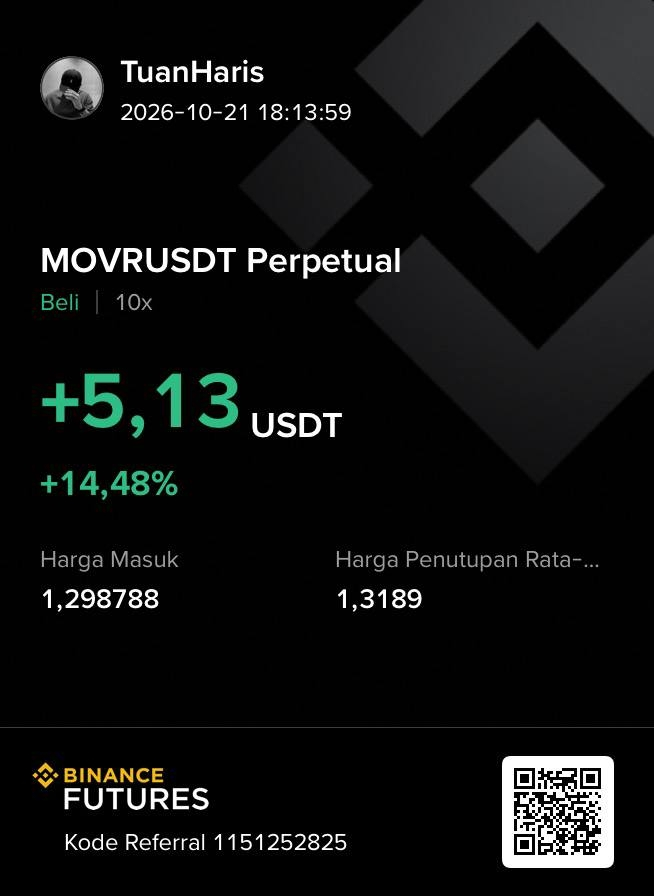
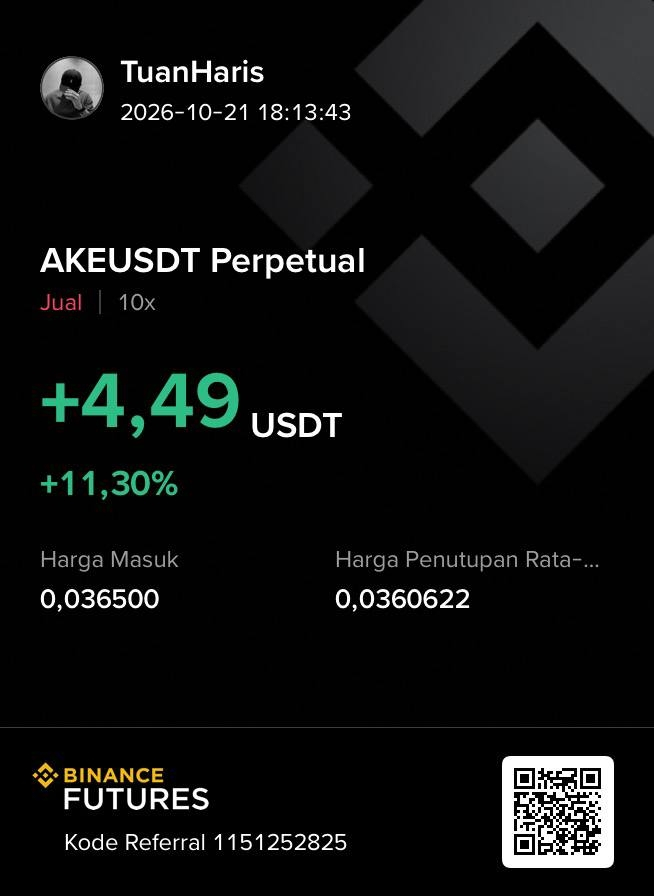
Reading the market’s direction, locking in results. Consistency is key. It’s not about luck, but the reward for patiently reading market structure. A well-crafted plan, calm execution. Results follow.
#TuanHaris #BinanceFutures #CryptoTrading #TradingLife #PriceAction #CryptoAnalysis #TradingMindset #ConsistenTrader #CryptoProfit
#TuanHaris #BinanceFutures #CryptoTrading #TradingLife #PriceAction #CryptoAnalysis #TradingMindset #ConsistenTrader #CryptoProfit
1
294
·
--
Bullish
BULLISH STRUCTURE ANALYSIS & MARKET RECOVERY (TUAN HARIS WAR ROOM)
Based on multi-timeframe technical data monitored on VIP Radar Nova, the majority of the market is currently in a consolidation and trend adjustment phase. However, several assets are showing structural resilience and positive volume-flow anomalies worth noting for educational purposes.
🔹 Strengthening Structure Watch (Bullish Resilience):
KORUUSDT & SOXLUSDT: Showing solid technical structures on the medium-term timeframes (4H & 1H) through to the short-term timeframe (15M). Positive CVD delta flow support is evident, along with momentum holding above the moving average area.
DOTUSDT & BNBUSDT: Showing a micro-recovery response on the 1H timeframe, with relative volume (RVOL) beginning to increase around the price equilibrium area (POC/Fair Value).
⏳ Momentum Observation (Squeeze & Wait and See):
BTCUSDT & LTCUSDT: On the 4H and 1H timeframes, indicators have detected volatility compression (Squeeze) around the discount area. This phase indicates that the market is gathering liquidity before determining the direction of its next major trend.
💡 Educational Note: In transitioning market conditions, waiting for confirmation of a structural breakout or monitoring price reactions at support areas is key to maintaining objective analysis.
Disclaimer: This publication is solely a record of technical indicator data observations from Tuan Haris War Room for educational purposes, and is not financial advice or a solicitation (NFA & DYOR).
#BitcoinSurpasses83K #FranceNationalAssemblyPassesCryptoToStablecoinTaxAmendment #DeepSeekReleasesUpdatedAIModel #CelestiaRises16%To2026High #NasdaqDowWeeklyGapWidestSinceJuly2002 #Nasdaq100Falls5.5%InWorstWeekin18Months #StrategySharesFall9%OnFriday #USPPIRises6.3%YearOverYear #CelestiaLaunchesEdenToTestAIagentTrading #ETHDropsBelow2400USDT #MFA #WarRoomHaris #NFA #DYOR*
5
·
--
Bearish
By mapping VIP Radar Nova data from the 4-hour to the 15-minute timeframe, the indicator detects that overall macro sentiment remains dominated by distribution pressure (14 of the 20 monitored assets show weakening structures).
🔹 Distribution Pressure Watch (Bearish Structure):
ETHUSDT, SOLUSDT, & NEARUSDT: On the 15M and 1H timeframes, these three assets remain under pressure from a weakening macro trend, accompanied by signs of volatility compression that could point to a further correction phase.
LINKUSDT, ADAUSDT, & FILUSDT: The macro and micro structures on the 4H and 15M timeframes show persistent selling pressure, consistent with daily CVD values that remain in negative territory.
⏳ Oversold Zone (Oversold Observation):
ARBUSDT & OPUSDT: Although they remain in weakening structures, the Z-Score indicator detects that prices are beginning to touch the statistical lower bound (the Base Area). This condition often triggers a slowdown in downward momentum or a sideways consolidation phase.
💡 Educational Note: Understanding the difference between a continuing downtrend and the potential for a technical bounce in an oversold zone is essential to ensure we remain objective when interpreting market dynamics.
Disclaimer: This publication is solely an observation of technical indicator data from War Room Tuan Haris for educational purposes, not financial advice or an invitation to trade (NFA & DYOR).
#BitcoinSurpasses$83,000 #FranceNationalAssemblyPassesCryptoToStablecoinTaxAmendment #DeepSeekReleasesUpdatedAIModel #CelestiaRises16%To2026High #NasdaqDowWeeklyGapWidestSinceJuly2002 #Nasdaq100Falls5.5%InWorstWeekin18Months #StrategySharesFall9%OnFriday #USPPIRises6.3%YearOverYear #CelestiaLaunchesEdenToTestAIagentTrading #ETHDropsBelow2400USDT #MFA #WarRoomHaris #NFA✅ #DYOR🟢.
10
·
--
Bullish
Based on multi-timeframe technical data monitoring on VIP Radar Nova, most of the market is currently in a consolidation and trend-adjustment phase. However, several assets are showing structural resilience and positive volume-flow anomalies worth examining for educational purposes.
🔹 Strengthening Structure Watch (Bullish Resilience):
KORUUSDT & SOXLUSDT: Showing solid technical structures on the medium-term timeframes (4H & 1H) through to the short-term timeframe (15M). Positive CVD delta flow support has been observed, along with momentum holding above the moving-average area.
DOTUSDT & BNBUSDT: Showing signs of a micro-recovery on the 1H timeframe, with relative volume (RVOL) beginning to increase around the price-balance area (POC/Fair Value).
⏳ Momentum Watch (Squeeze & Wait and See):
BTCUSDT & LTCUSDT: On the 4H and 1H timeframes, indicators have detected a narrowing of volatility (Squeeze) around the discount area. This phase suggests the market is gathering liquidity before determining the direction of its next major trend.
💡 Educational Note: In transitioning market conditions, waiting for confirmation of a structural breakout or monitoring price action around support levels is key to maintaining objective analysis.
Disclaimer: This publication is solely an observation of technical indicator data from War Room Tuan Haris for educational purposes,
not financial advice or an invitation to invest (NFA & DYOR).
#BitcoinSurpasses$83,000 #FranceNationalAssemblyPassesCryptoToStablecoinTaxAmendment #DeepSeekReleasesUpdatedAIModel #CelestiaRises16%To2026High #NasdaqDowWeeklyGapWidestSinceJuly2002 #Nasdaq100Falls5.5%InWorstWeekin18Months #StrategySharesFall9%OnFriday #USPPIRises6.3%YearOverYear #CelestiaLaunchesEdenToTestAIagentTrading #ETHDropsBelow2400USDT #MFA #WarRoomHaris #NFA✅ #DYOR🟢
11
·
--
Bearish
Beware of Selling Pressure, Watch These Coins with Short Potential! 📉
Amid a neutral, consolidating market, War Room has detected dump pressure and seller dominance in several assets vulnerable to further correction.
Coins with Short Potential: LSKUSDT (65%), MOVRUSDT (80%), USUSDT (70%)
Action: Watch resistance areas for measured Short opportunities.
#WarRoomHaris#FSBWarns300BStablecoinCouldFaceRuns #RBNZPausesDigitalCashDevelopment
NFA & DYOR! Manage risk with discipline.
1.9k
·
--
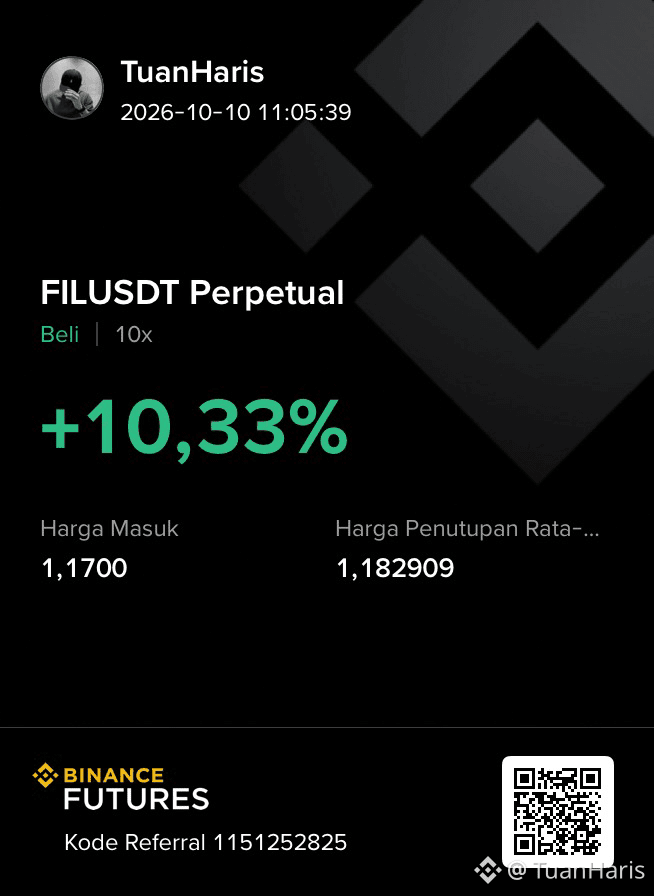
$FIL is excellent for scalping
Praise be to God
Reset the modified indicator
Works with 90% accuracy
Stay disciplined with the data
Don't #FOMOFactor
Be more grateful
Every day brings new experiences in trading
Keep securing profits every day
No need to open positions in many coins
Just 1–3 coins
But make a profit
Praise be to God
Reset the modified indicator
Works with 90% accuracy
Stay disciplined with the data
Don't #FOMOFactor
Be more grateful
Every day brings new experiences in trading
Keep securing profits every day
No need to open positions in many coins
Just 1–3 coins
But make a profit
2
964
·
--
🚨 WAR ROOM RADAR UPDATE: Beware Overbought Traps & Massive Dumps! 🚨
Hi everyone! Today's market radar monitoring shows some pretty tricky movements. Macro and micro trends are moving in opposite directions in many cases, so scalpers need to be extra cautious!
Here's the summary:
⚠️ Beware of Corrections / Tops:
$MRNA: Be careful! Although the macro trend is bullish, the micro trend has started turning bearish, and indicators show SMI OVERBOUGHT conditions alongside gradual selling. Don't blindly FOMO at the top!
$USUS: RED FLAG! 🚩 A MASSIVE DUMP in volume has been detected! Although the macro picture looks bullish, heavy selling is underway on the micro level.
📊 Worth Watching (Gradual Pump & Dump):
$SOXL: An interesting little anomaly. The macro trend is bearish, but the micro trend is bullish, with a gradual PUMP detected. There's a slow upward push on smaller timeframes.
$SOXS, $SNXX, & $HYPE: On average, these show a tug-of-war between macro and micro trends, with gradual selling dominating. Keep it quick (scalping)—hit and run!
Conclusion: Don't fight the volume trend! If overbought conditions or a massive dump are detected, secure your profits or set your Stop Loss as tight as possible. Don't get caught holding the bag!
What do you think about these coins? Let us know in the comments! 👇
#CryptoTrading #Scalping #MRNA #USUS #SOXL #BinanceSquare Disclaimer: Always remember, NFA & DYOR! This post is a data analysis from the radar, not a recommendation to buy or sell. Always manage your risk wisely! 🛡️
276
·
--
Bullish
SCALPING ALERT & MARKET UPDATE! 🔥
Although the 1-hour timeframe indicators are screaming "PEAK" and are severely overbought (SMI/MV/RV at extreme levels), our macro and micro trends are still strongly BULLISH! Remember, high volatility = golden opportunities for scalpers. Today's strategy: Get in fast, get out fast! Don't hold for too long.
📊 Coins to Focus on Today: 1️⃣ $FIL
{future}(FILUSDT)
& $MAGIC : At an extreme PEAK status (99.9% & 92.8%).
Momentum is exploding. Perfect for a hit-and-run approach. Don't forget to set a tight SL, and don't get greedy! 2️⃣ $NEAR: Trending hot thanks to new fundamentals
$NEAR
{future}(NEARUSDT)
(#NEARAccountsSupportPostQuantumMLDSA). Volume and social sentiment are rising, with plenty of potential for a bullish push.
Stay disciplined and stick to your own trading plan!
#Scalping #CryptoTrading #BullMarket #FIL #MAGIC #NEAR #NEARAccountsSupportPostQuantumMLDSA Disclaimer: NFA & DYOR! (Not Financial Advice, Do Your Own Research). Buy and sell decisions are entirely in your hands.
SCALPING ALERT & MARKET UPDATE! 🔥
Although the 1-hour timeframe indicators are screaming "PEAK" and are severely overbought (SMI/MV/RV at extreme levels), our macro and micro trends are still strongly BULLISH! Remember, high volatility = golden opportunities for scalpers. Today's strategy: Get in fast, get out fast! Don't hold for too long.
📊 Coins to Focus on Today: 1️⃣ $FIL
& $MAGIC : At an extreme PEAK status (99.9% & 92.8%).
Momentum is exploding. Perfect for a hit-and-run approach. Don't forget to set a tight SL, and don't get greedy! 2️⃣ $NEAR: Trending hot thanks to new fundamentals
$NEAR
(#NEARAccountsSupportPostQuantumMLDSA). Volume and social sentiment are rising, with plenty of potential for a bullish push.
Stay disciplined and stick to your own trading plan!
#Scalping #CryptoTrading #BullMarket #FIL #MAGIC #NEAR #NEARAccountsSupportPostQuantumMLDSA Disclaimer: NFA & DYOR! (Not Financial Advice, Do Your Own Research). Buy and sell decisions are entirely in your hands.
531
·
--
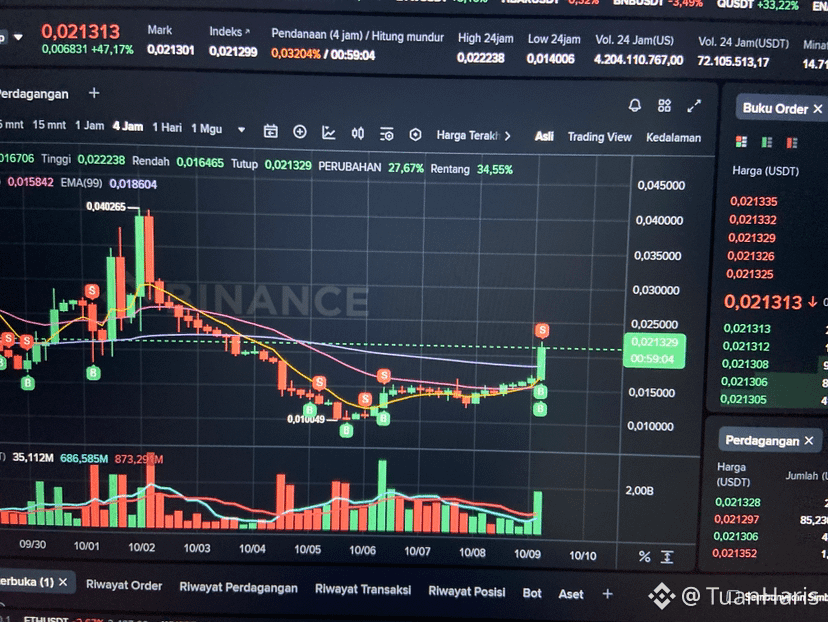
Looking for a short scalping opportunity
Short at 0.0237–0.024
$US is already very exhausted from rising
#DYOR🟢
#NFA✅
Looking for a short scalping opportunity
Short at 0.0237–0.024
$US is already very exhausted from rising
#DYOR🟢
#NFA✅
Short at 0.0237–0.024
$US is already very exhausted from rising
#DYOR🟢
#NFA✅
229
·
--
$BTC and $SOL are still strong for a drop..wait for the reflection
Btc scalping long
But you have to enter quickly and exit quickly
#DYOR🟢
$BTC and $SOL are still strong for a drop..wait for the reflection
Btc scalping long
But you have to enter quickly and exit quickly
#DYOR🟢
Btc scalping long
But you have to enter quickly and exit quickly
#DYOR🟢
152
·
--
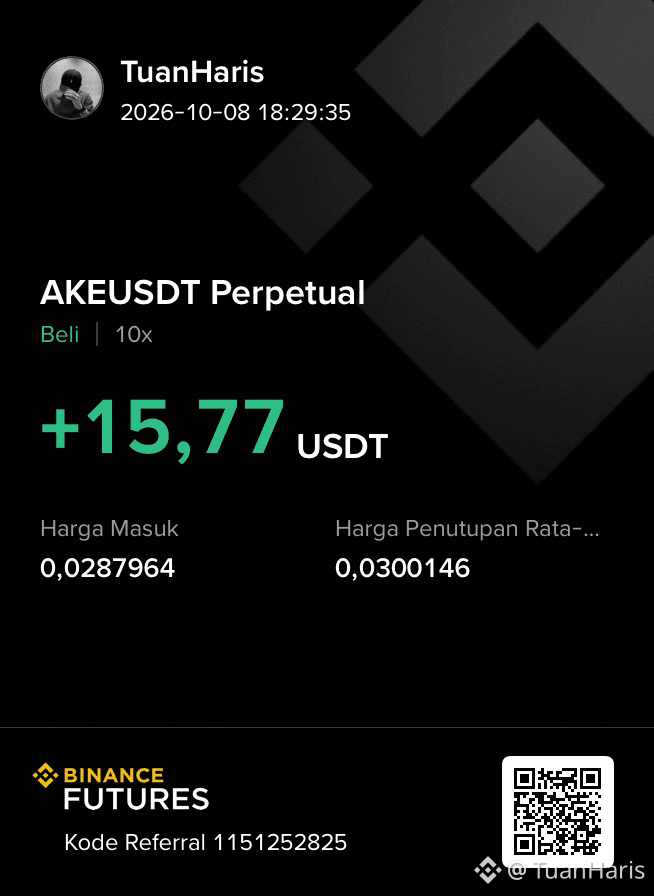
$AKE to hold daily is still strong to rise.
Wait for a correction
Limit entry at 0.027 -0.028
#DYOR🟢 #NFA✅
$AKE to hold daily is still strong to rise.
Wait for a correction
Limit entry at 0.027 -0.028
#DYOR🟢 #NFA✅
Wait for a correction
Limit entry at 0.027 -0.028
#DYOR🟢 #NFA✅
683
Log in to explore more content
Join global crypto users on Binance Square
⚡️ Get latest and useful information about crypto.
💬 Trusted by the world’s largest crypto exchange.
👍 Discover real insights from verified creators.
Email / Phone number