
FLEX-Trade
81 Posts

FLEX-Trade
Report
Block User
Я торгую с 2017 года.
Волатильность - лучший друг трейдера, не важно, в какую сторону она идет!
Без автоматизации никуда - поэтому использую ботов.

BTC Holder
High-Frequency Trader
8.8 Years
5 Following
60 Followers
164 Liked
Posts
All
Quotes
Videos
·
--
TRUMP|USDT
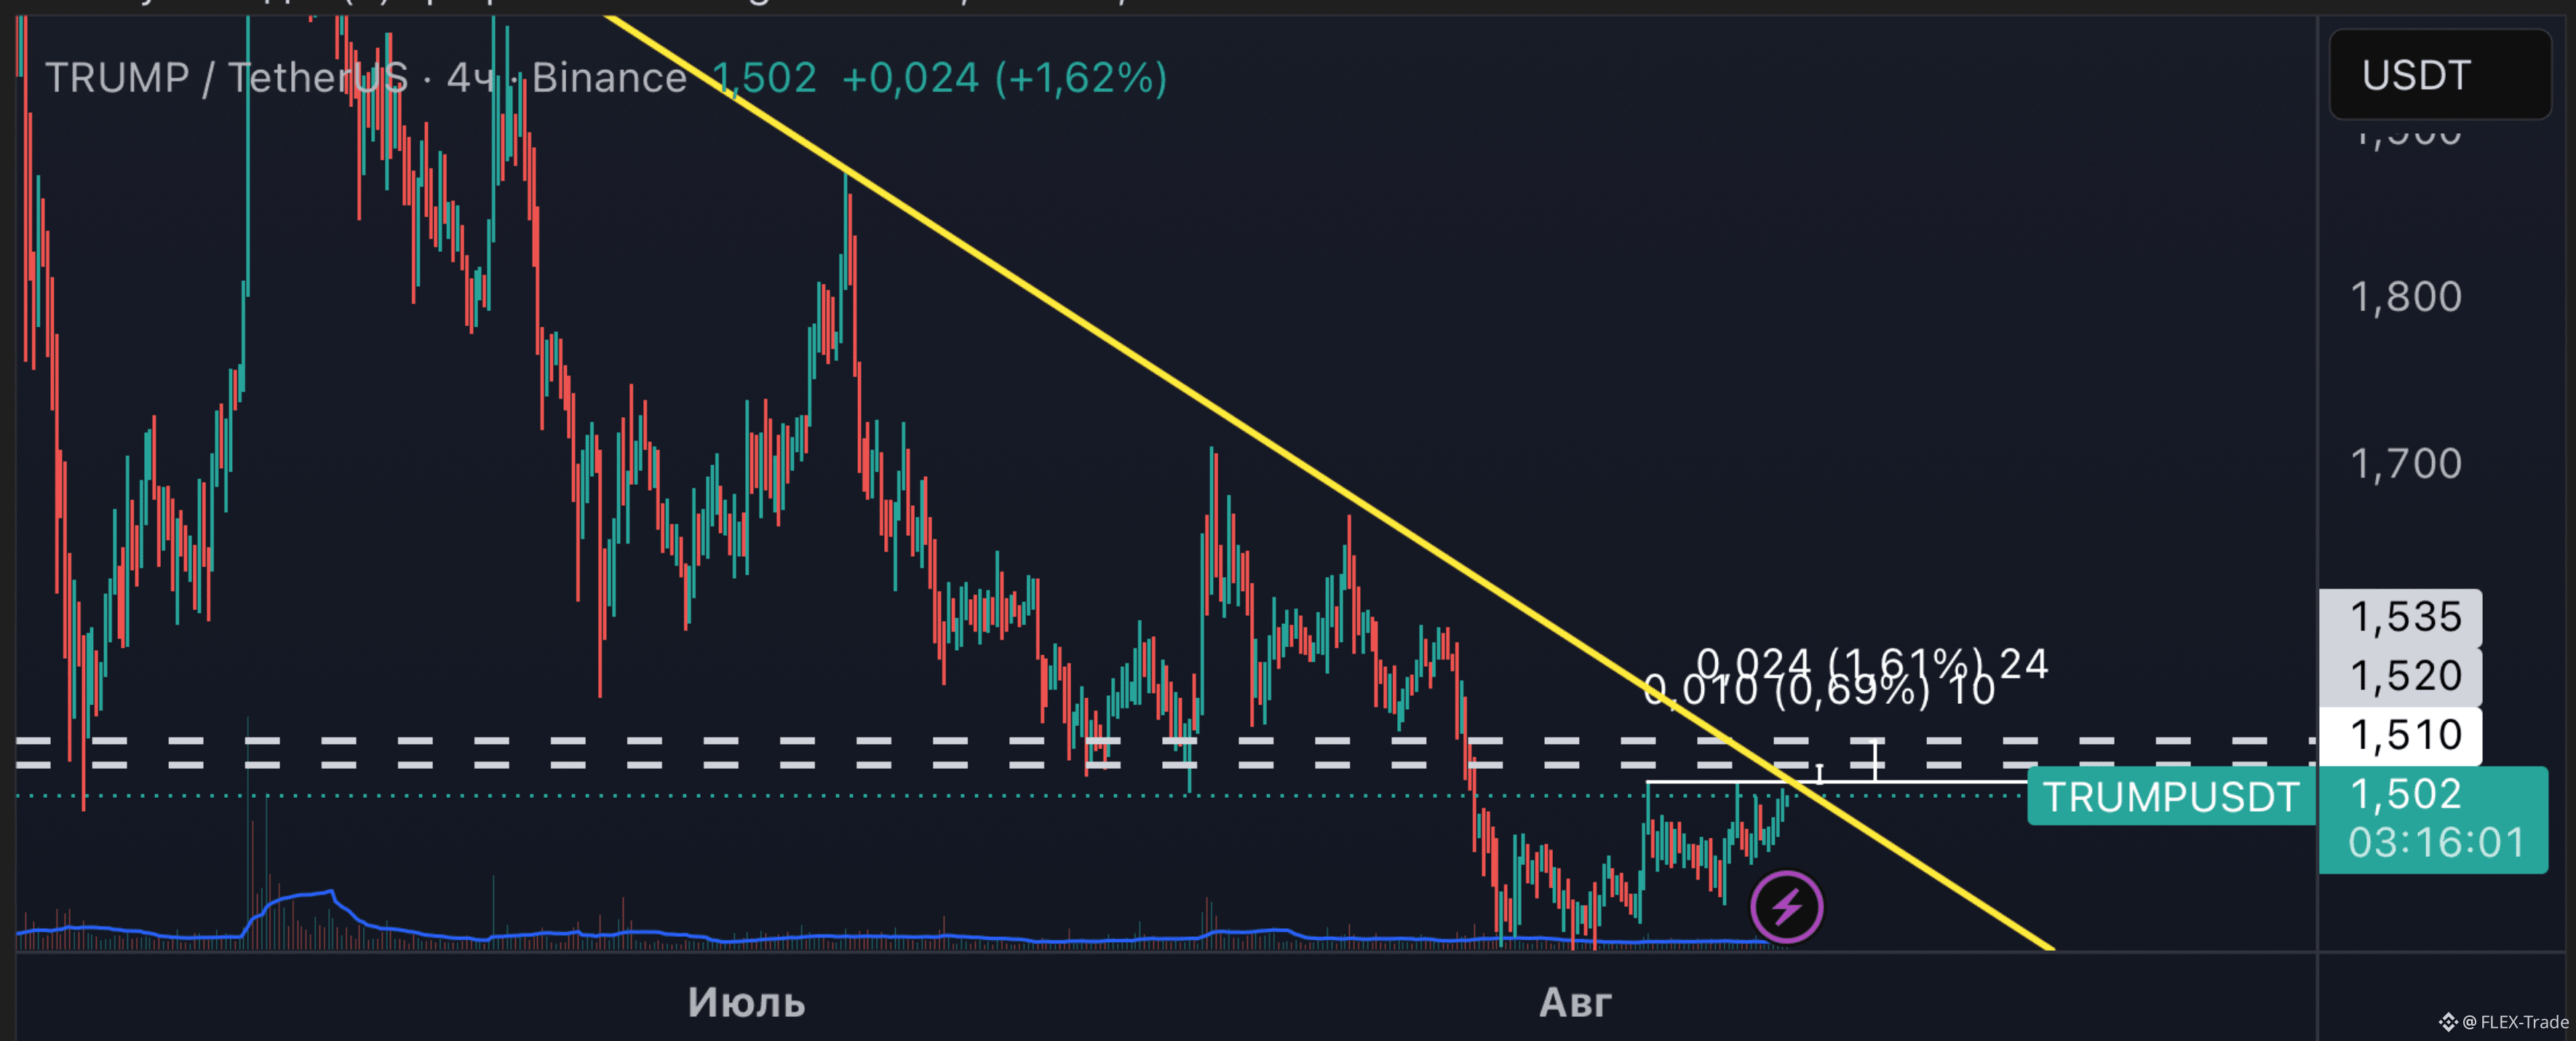
Forgot about him already?
а chart hints at something )
It’s interesting that the price is getting squeezed toward the downward dynamic and a mountain/peak is being drawn as a breakout
Volta is somewhere with us in the room )
$TRUMP
{future}(TRUMPUSDT)
TRUMP|USDT
Forgot about him already?
а chart hints at something )
It’s interesting that the price is getting squeezed toward the downward dynamic and a mountain/peak is being drawn as a breakout
Volta is somewhere with us in the room )
$TRUMP
Forgot about him already?
а chart hints at something )
It’s interesting that the price is getting squeezed toward the downward dynamic and a mountain/peak is being drawn as a breakout
Volta is somewhere with us in the room )
$TRUMP
1
555
·
--
ADA | USDT
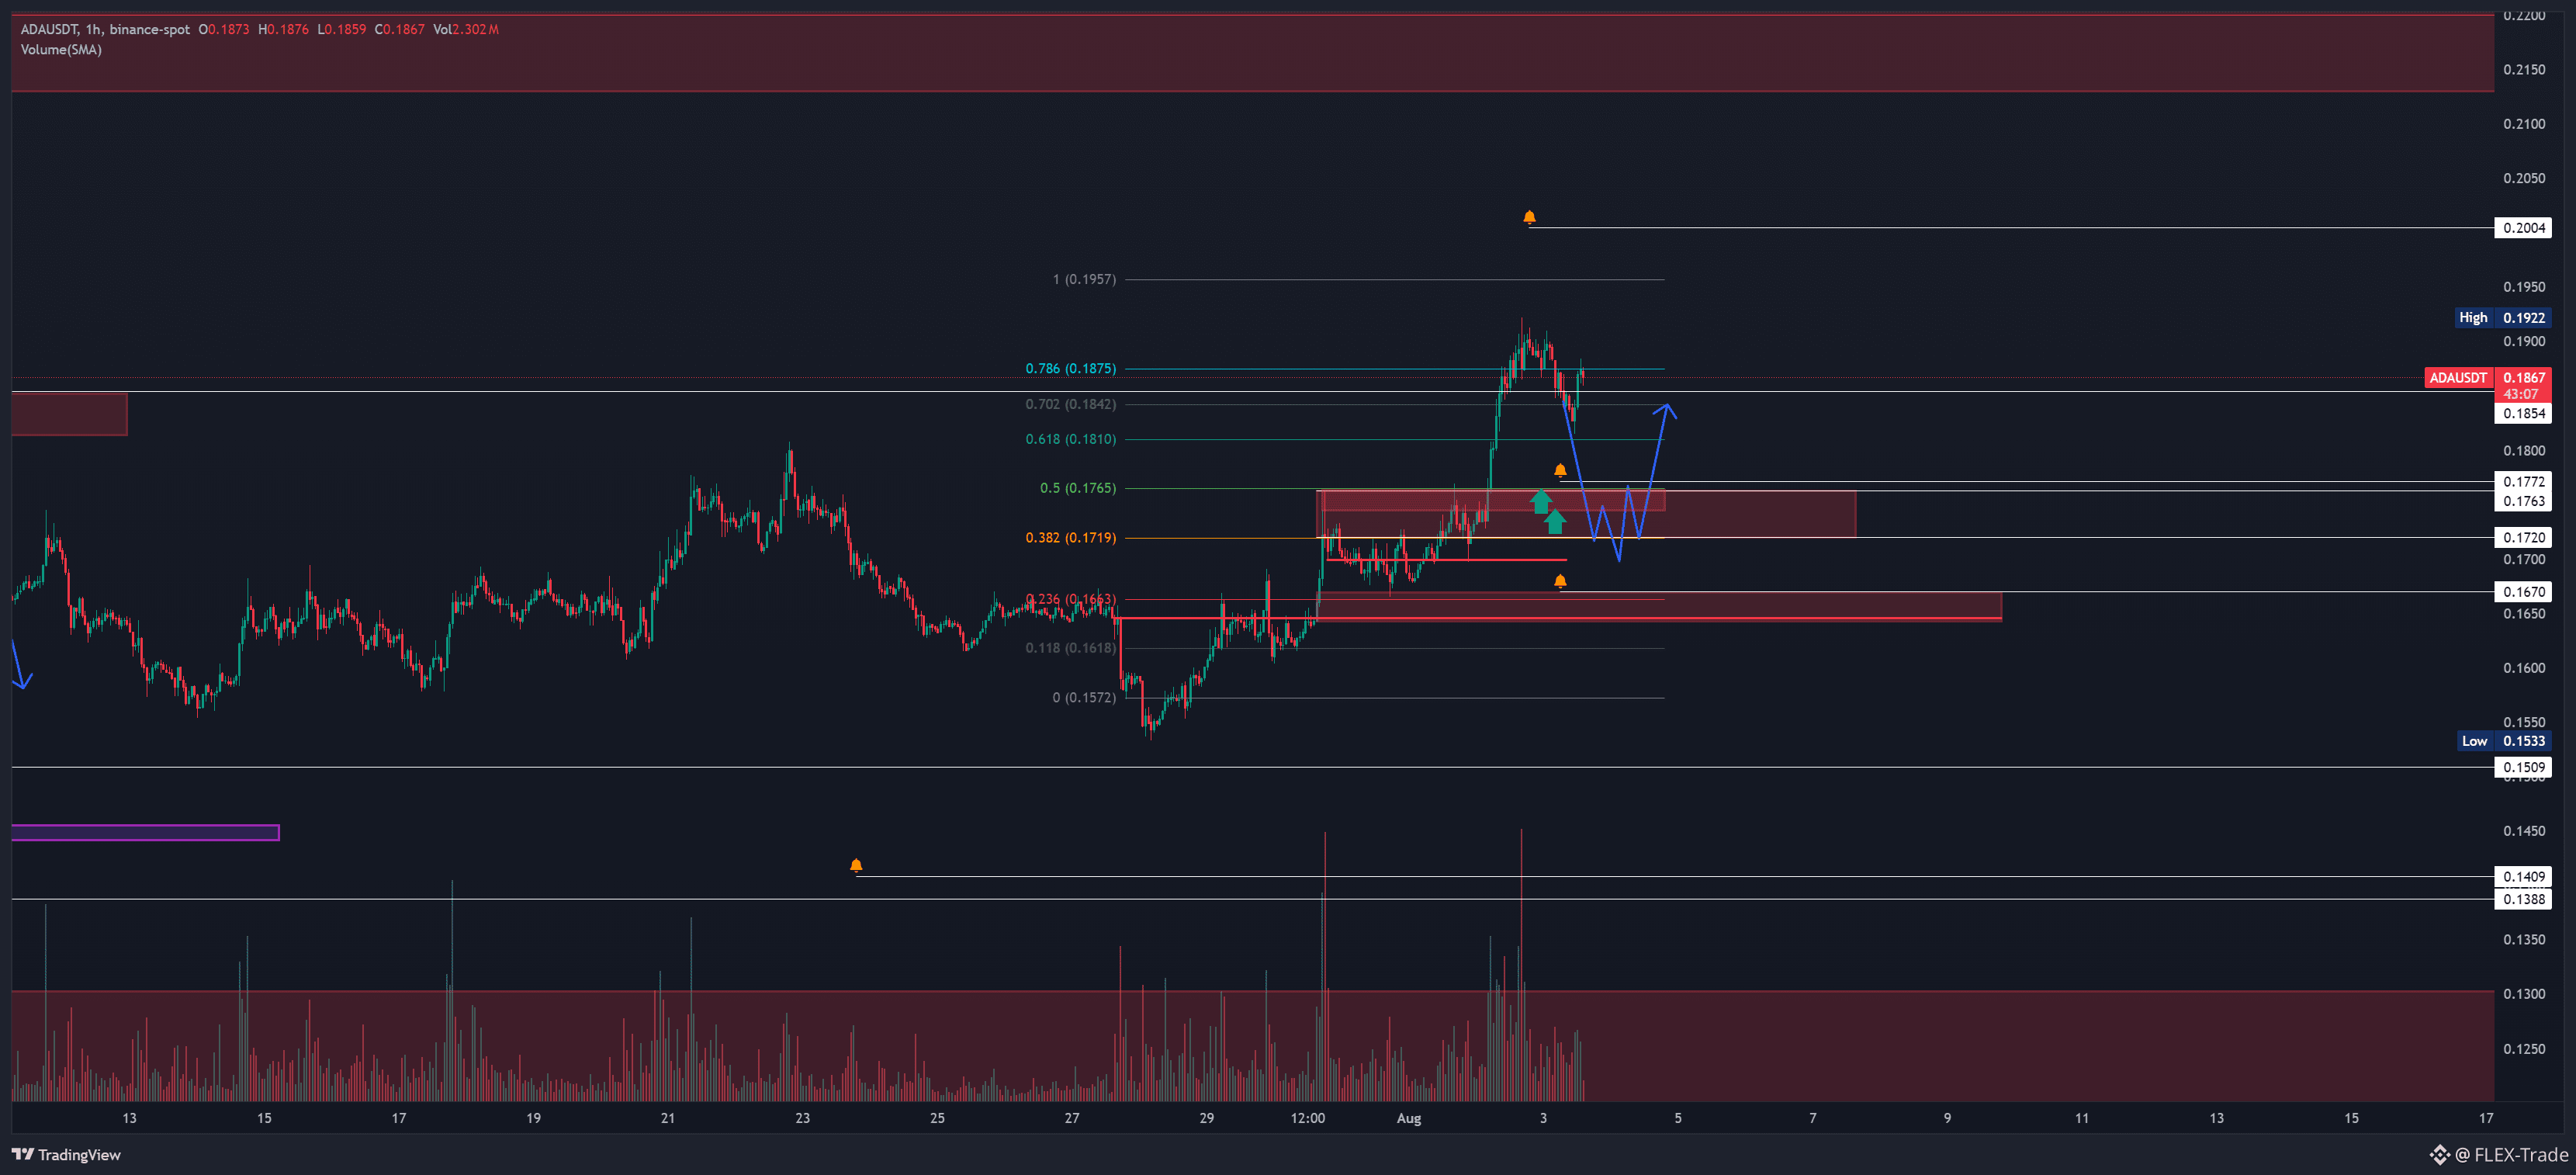
High risk and under supervision.
In today’s quick review, I already mentioned it.
Still, I’ll try it with a grid around the key level. The first shelf will most likely be put into operation with a split.
$ADA
{future}(ADAUSDT)
ADA | USDT
High risk and under supervision.
In today’s quick review, I already mentioned it.
Still, I’ll try it with a grid around the key level. The first shelf will most likely be put into operation with a split.
$ADA
High risk and under supervision.
In today’s quick review, I already mentioned it.
Still, I’ll try it with a grid around the key level. The first shelf will most likely be put into operation with a split.
$ADA
2
252
·
--
⚡ Fast market overview$$
BTC|USDT - Main observation zones: cascade ~61 900 and the order book and testing of the 4H key (60500-59 600).
ETH|USDT - Alarm at 1 800 and below; similar to BTC, the 4H key is ~1 700.
BNB|USDT - The take-profit target at the top is currently ~610. At the bottom, levels 550 and 540 are under the alarm.
ADA|USDT - Two areas of interest appeared: 0,1760 and 0,1670.
ZEC|USDT - 460 gave a move. At the bottom, ~420 remains.
SOL|USDT - Zone 71 worked out. If you’re holding, then the top cascade for the take-profit is a magnet. At the bottom, alarm at 68 and 62.
$BTC $ETH $BNB $ada $zec $sol
⚡ Fast market overview$$
BTC|USDT - Main observation zones: cascade ~61 900 and the order book and testing of the 4H key (60500-59 600).
ETH|USDT - Alarm at 1 800 and below; similar to BTC, the 4H key is ~1 700.
BNB|USDT - The take-profit target at the top is currently ~610. At the bottom, levels 550 and 540 are under the alarm.
ADA|USDT - Two areas of interest appeared: 0,1760 and 0,1670.
ZEC|USDT - 460 gave a move. At the bottom, ~420 remains.
SOL|USDT - Zone 71 worked out. If you’re holding, then the top cascade for the take-profit is a magnet. At the bottom, alarm at 68 and 62.
$BTC $ETH $BNB $ada $zec $sol
BTC|USDT - Main observation zones: cascade ~61 900 and the order book and testing of the 4H key (60500-59 600).
ETH|USDT - Alarm at 1 800 and below; similar to BTC, the 4H key is ~1 700.
BNB|USDT - The take-profit target at the top is currently ~610. At the bottom, levels 550 and 540 are under the alarm.
ADA|USDT - Two areas of interest appeared: 0,1760 and 0,1670.
ZEC|USDT - 460 gave a move. At the bottom, ~420 remains.
SOL|USDT - Zone 71 worked out. If you’re holding, then the top cascade for the take-profit is a magnet. At the bottom, alarm at 68 and 62.
$BTC $ETH $BNB $ada $zec $sol
10
11.7k
·
--
📊 Market overview
Altcoins are pressing up against the upper limits — moderate optimism, but confirmation is still lacking.
🟠 BTC — The low to watch is the same 62,100. The move toward 63,750 I’d rather ignore.
🔷 ETH — Breaking the highs. Test zone of interest: 1900–1920 (mirror zone; alarm is warranted).
🐸 PEPE — Sideways. The main interest is a breakout at 315 and a move beyond the long-term range boundaries.
🐶 SHIB — I’m waiting for a rehash/rediscovery. Levels to watch from below: 0.00468 and lower.
⚡️ PAXG — No changes. It’ll be interesting to catch a move from 3,700.
📲 Full breakdown: Telegram · YouTube
📊 Market overview
Altcoins are pressing up against the upper limits — moderate optimism, but confirmation is still lacking.
🟠 BTC — The low to watch is the same 62,100. The move toward 63,750 I’d rather ignore.
🔷 ETH — Breaking the highs. Test zone of interest: 1900–1920 (mirror zone; alarm is warranted).
🐸 PEPE — Sideways. The main interest is a breakout at 315 and a move beyond the long-term range boundaries.
🐶 SHIB — I’m waiting for a rehash/rediscovery. Levels to watch from below: 0.00468 and lower.
⚡️ PAXG — No changes. It’ll be interesting to catch a move from 3,700.
📲 Full breakdown: Telegram · YouTube
Altcoins are pressing up against the upper limits — moderate optimism, but confirmation is still lacking.
🟠 BTC — The low to watch is the same 62,100. The move toward 63,750 I’d rather ignore.
🔷 ETH — Breaking the highs. Test zone of interest: 1900–1920 (mirror zone; alarm is warranted).
🐸 PEPE — Sideways. The main interest is a breakout at 315 and a move beyond the long-term range boundaries.
🐶 SHIB — I’m waiting for a rehash/rediscovery. Levels to watch from below: 0.00468 and lower.
⚡️ PAXG — No changes. It’ll be interesting to catch a move from 3,700.
📲 Full breakdown: Telegram · YouTube
6
10.6k
·
--
📊 BTC Overview (excerpt from the full review)
I’m analyzing the current market structure and the main scenarios for the leading assets.
BTC: what’s important right now
Bitcoin is squeezed up to the upper bound of the range. I’m watching the reaction.
Key levels:
🔺 Resistance: 71,000, 82,000, 100,000
🔻 Support: 56,000–52,000, 48,000–44,000
I only work the breakout scenario upon confirmation (a close). If it bounces off the top, I’m expecting a move downward toward the nearest supports.
🎥 In the video — a detailed chart breakdown and entries depending on the situation.
$BTC
📊 BTC Overview (excerpt from the full review)
I’m analyzing the current market structure and the main scenarios for the leading assets.
BTC: what’s important right now
Bitcoin is squeezed up to the upper bound of the range. I’m watching the reaction.
Key levels:
🔺 Resistance: 71,000, 82,000, 100,000
🔻 Support: 56,000–52,000, 48,000–44,000
I only work the breakout scenario upon confirmation (a close). If it bounces off the top, I’m expecting a move downward toward the nearest supports.
🎥 In the video — a detailed chart breakdown and entries depending on the situation.
$BTC
I’m analyzing the current market structure and the main scenarios for the leading assets.
BTC: what’s important right now
Bitcoin is squeezed up to the upper bound of the range. I’m watching the reaction.
Key levels:
🔺 Resistance: 71,000, 82,000, 100,000
🔻 Support: 56,000–52,000, 48,000–44,000
I only work the breakout scenario upon confirmation (a close). If it bounces off the top, I’m expecting a move downward toward the nearest supports.
🎥 In the video — a detailed chart breakdown and entries depending on the situation.
$BTC
3
12.2k
·
--
$LINK
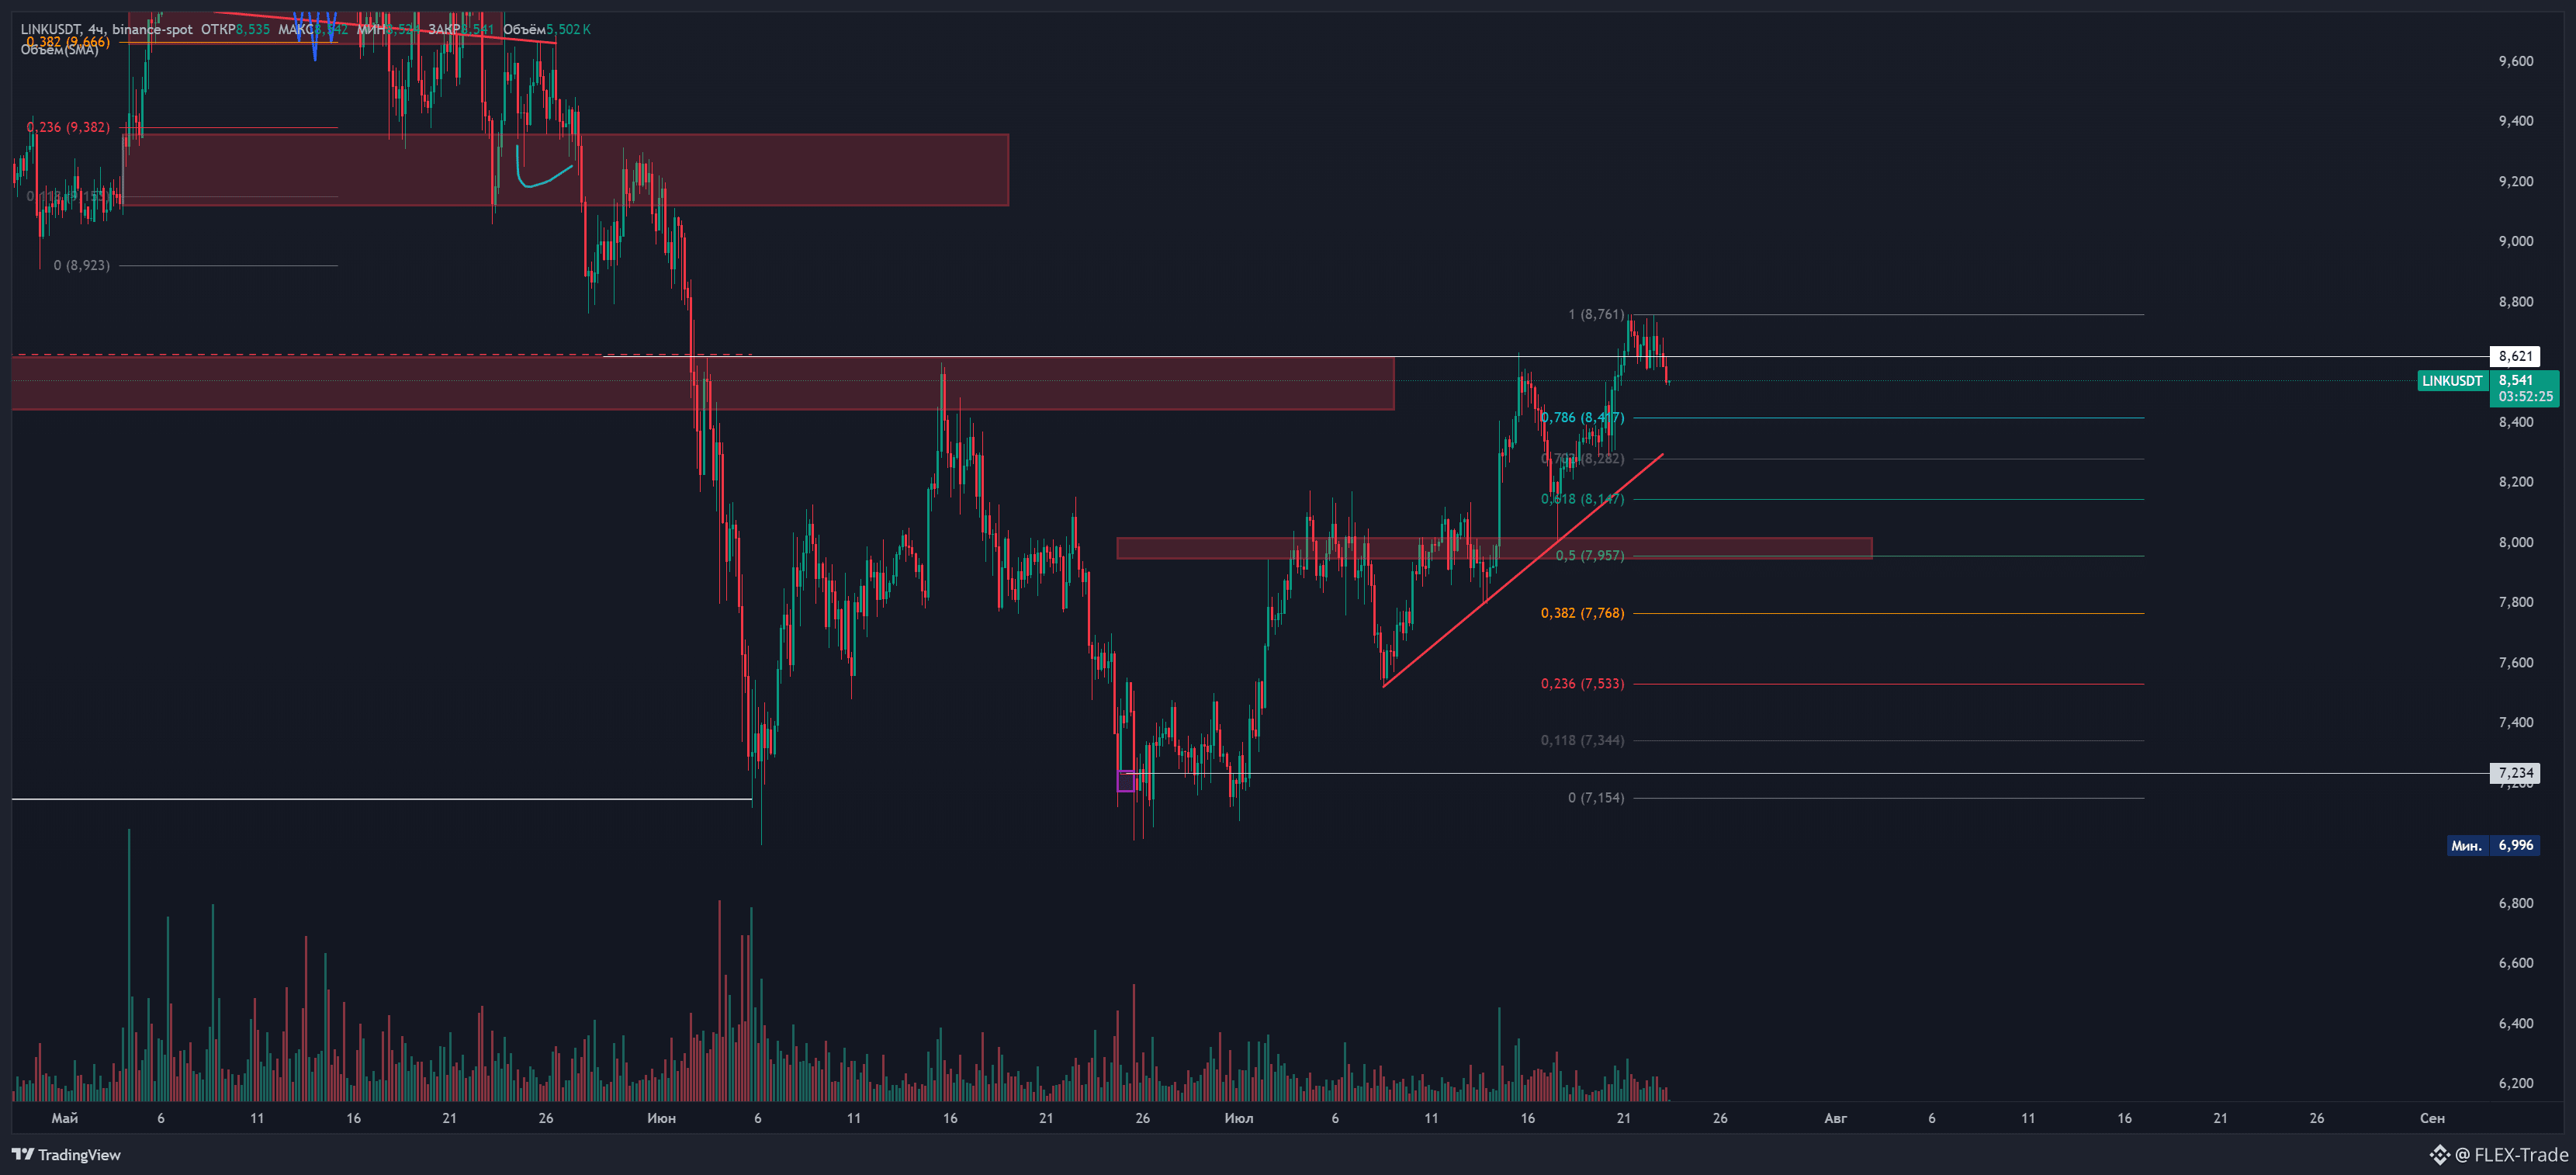
A complex and heavy asset in the ranges for me. A nice-looking level is the little mirror at the $8 level. It’s worth setting an alarm for it.
In general, I’m not in favor of averaging on the link within ranges.
But here I liked this grid, which starts working exactly from 0.5—i.e., working from that mirror that caught my eye. Overall, it could consolidate/assemble this cascade.
{future}(LINKUSDT)
{spot}(LINKUSDT)
$LINK
A complex and heavy asset in the ranges for me. A nice-looking level is the little mirror at the $8 level. It’s worth setting an alarm for it.
In general, I’m not in favor of averaging on the link within ranges.
But here I liked this grid, which starts working exactly from 0.5—i.e., working from that mirror that caught my eye. Overall, it could consolidate/assemble this cascade.
A complex and heavy asset in the ranges for me. A nice-looking level is the little mirror at the $8 level. It’s worth setting an alarm for it.
In general, I’m not in favor of averaging on the link within ranges.
But here I liked this grid, which starts working exactly from 0.5—i.e., working from that mirror that caught my eye. Overall, it could consolidate/assemble this cascade.
425
·
--
$BTC
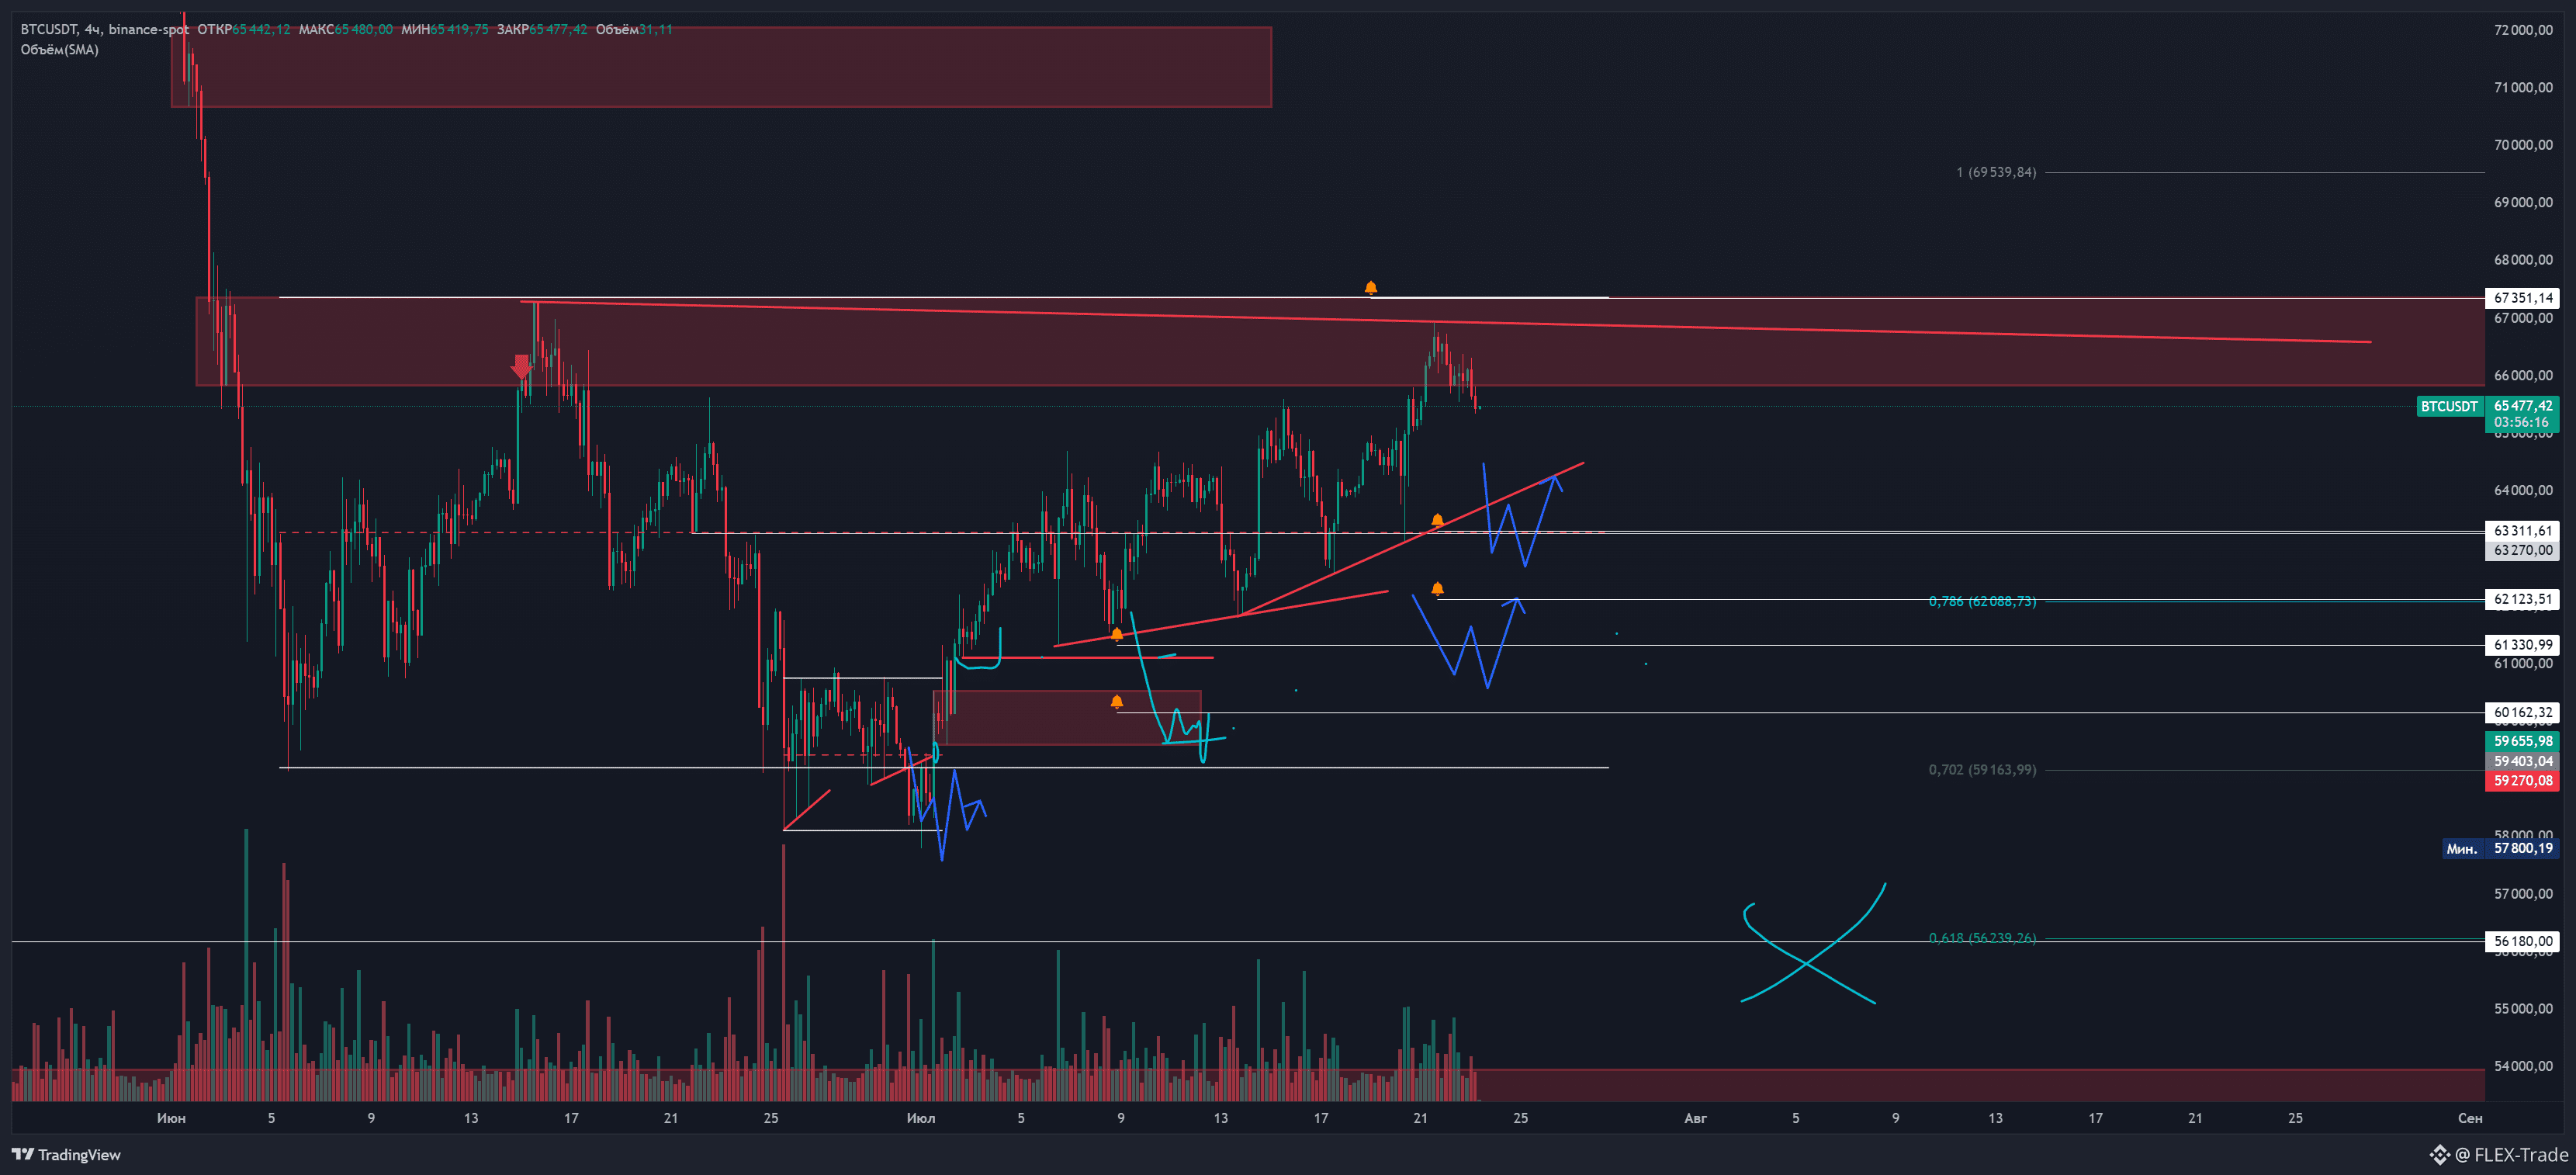
Approached the top of the trading range; it may be forming a cascade on breakout. There are no reliable support zones nearby at the bottom. The rise has left many cascade extremes that should be flagged to find the attachment point.
Areas of interest: 63,000; 62,000. Also, the active zone at 60,200 remains.
The overall breakdown unchanged—work from 50–52
{spot}(BTCUSDT)
{future}(BTCUSDT)
.
$BTC
Approached the top of the trading range; it may be forming a cascade on breakout. There are no reliable support zones nearby at the bottom. The rise has left many cascade extremes that should be flagged to find the attachment point.
Areas of interest: 63,000; 62,000. Also, the active zone at 60,200 remains.
The overall breakdown unchanged—work from 50–52
.
Approached the top of the trading range; it may be forming a cascade on breakout. There are no reliable support zones nearby at the bottom. The rise has left many cascade extremes that should be flagged to find the attachment point.
Areas of interest: 63,000; 62,000. Also, the active zone at 60,200 remains.
The overall breakdown unchanged—work from 50–52
.
302
·
--
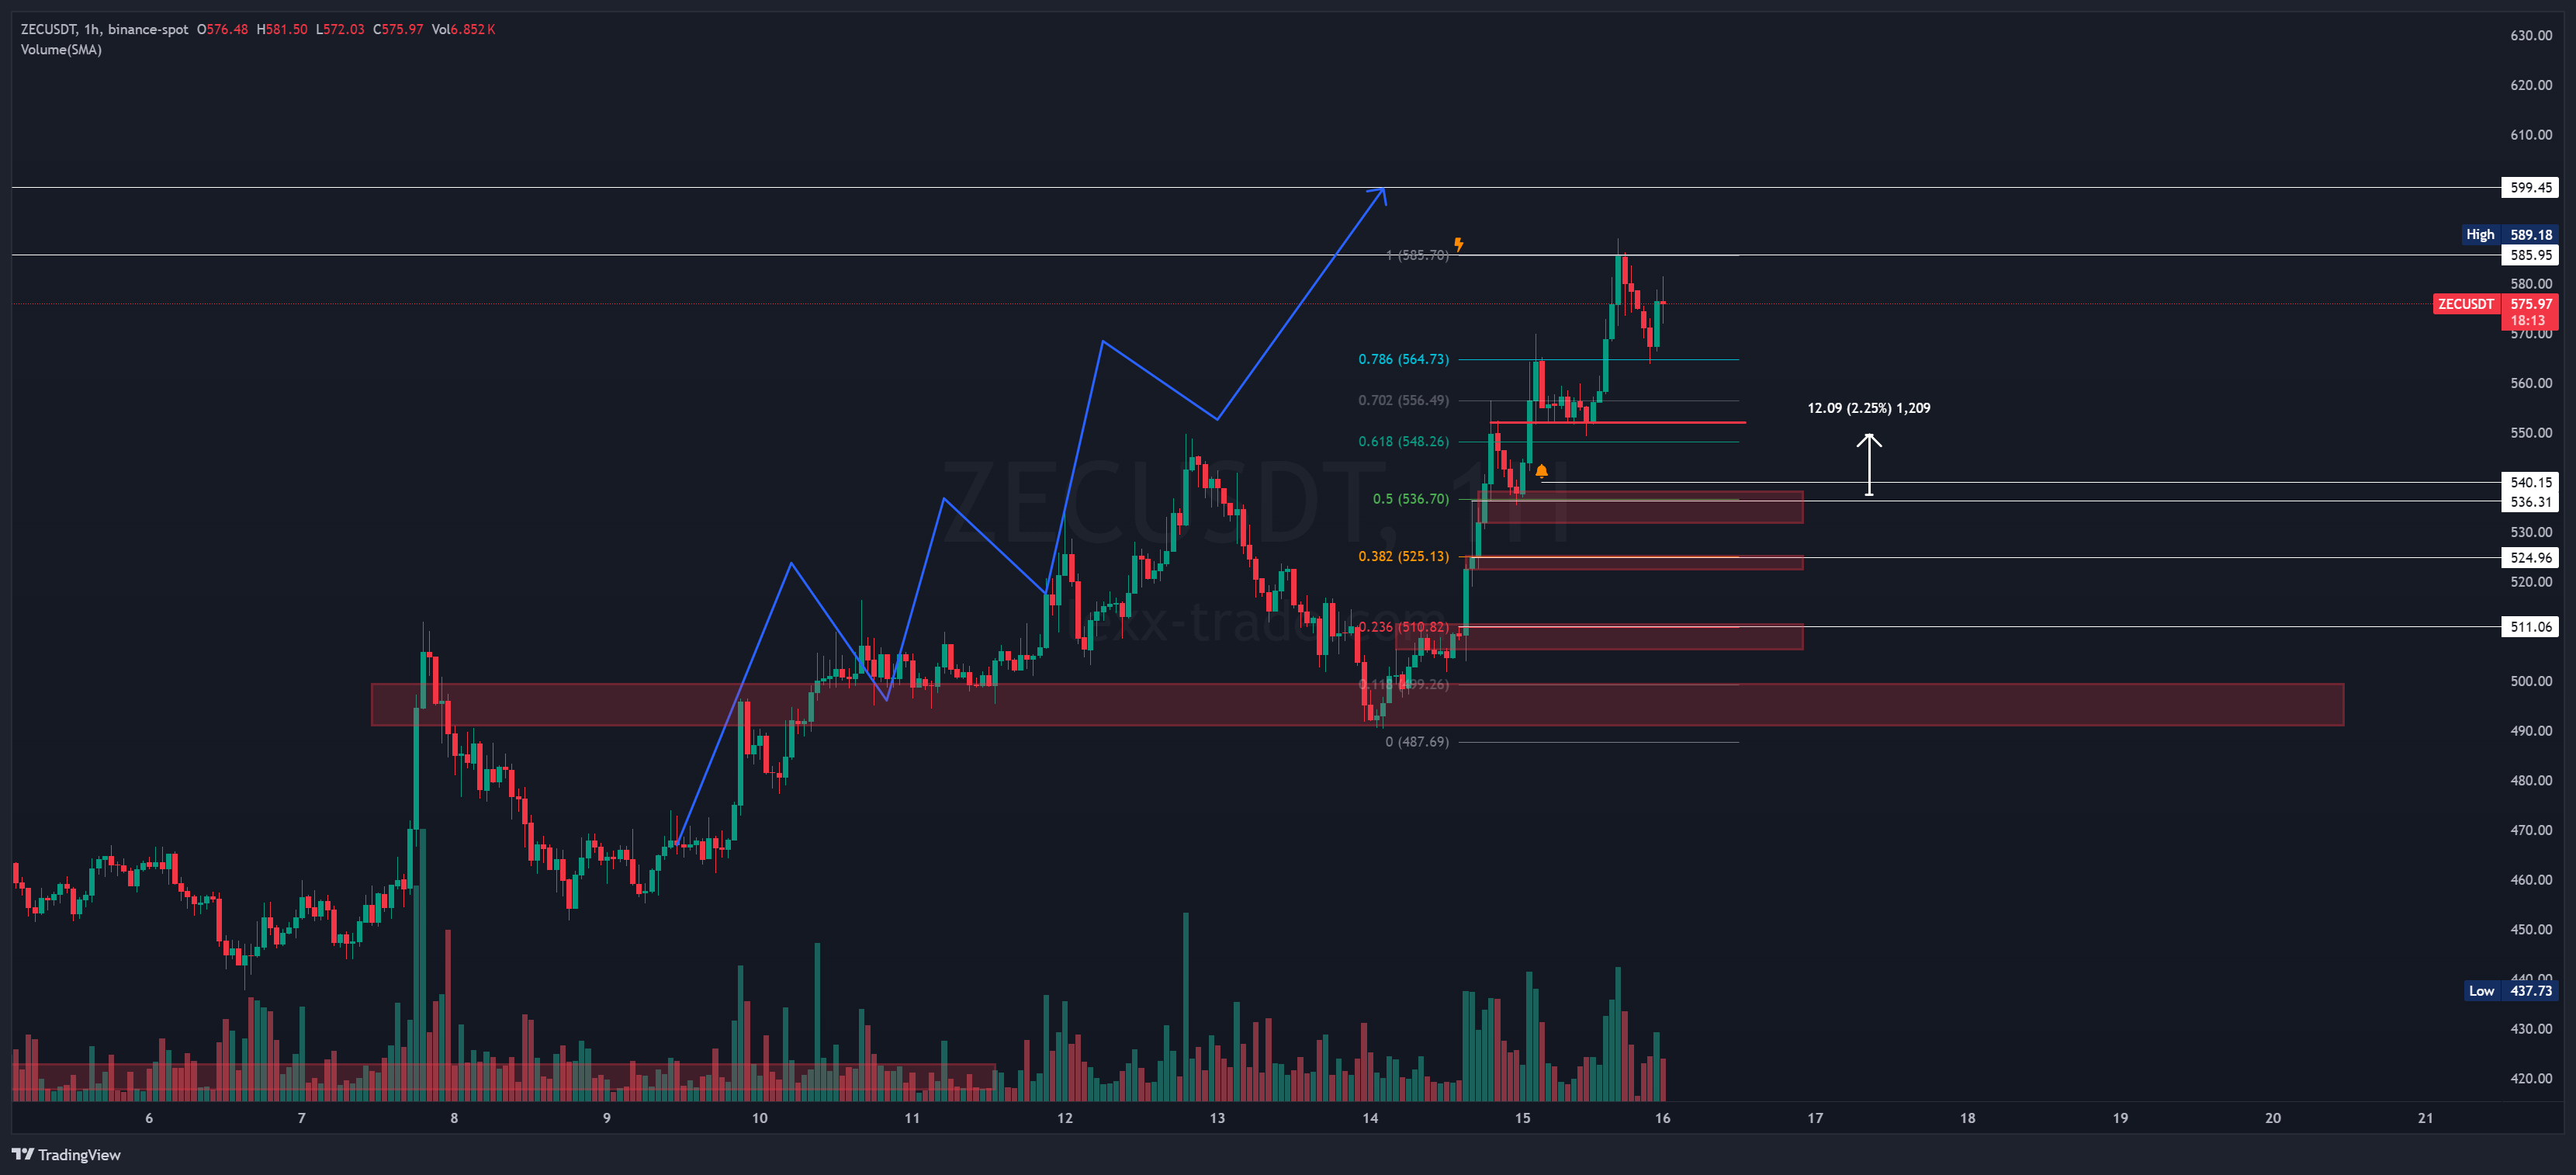
Well, the first shelf at the price of 536—let’s say it has worked... The price didn’t quite reach the level and resulted in a rebound, balancing the imbalance.
Looking straight at it, this level is already very dangerous.
We’re sliding lower, or we work already with one cartridge with a stop..\n{future}(ZECUSDT)
Well, the first shelf at the price of 536—let’s say it has worked... The price didn’t quite reach the level and resulted in a rebound, balancing the imbalance.
Looking straight at it, this level is already very dangerous.
We’re sliding lower, or we work already with one cartridge with a stop..\n
Looking straight at it, this level is already very dangerous.
We’re sliding lower, or we work already with one cartridge with a stop..\n
FLEX-Trade
·
--
$ZEC
As you may have noticed, the market has gone quiet, along with intraday trading.
But today an alarm came in for ZEC.
I drew a wave—not that it’s very strong, but there are interesting levels to bounce from.
In general, it needs to be put to work.
I highlighted the levels.
Maybe there’ll also be work for the grid—need to monitor..
As you may have noticed, the market has gone quiet, along with intraday trading.
But today an alarm came in for ZEC.
I drew a wave—not that it’s very strong, but there are interesting levels to bounce from.
In general, it needs to be put to work.
I highlighted the levels.
Maybe there’ll also be work for the grid—need to monitor..
165
·
--
$LINK
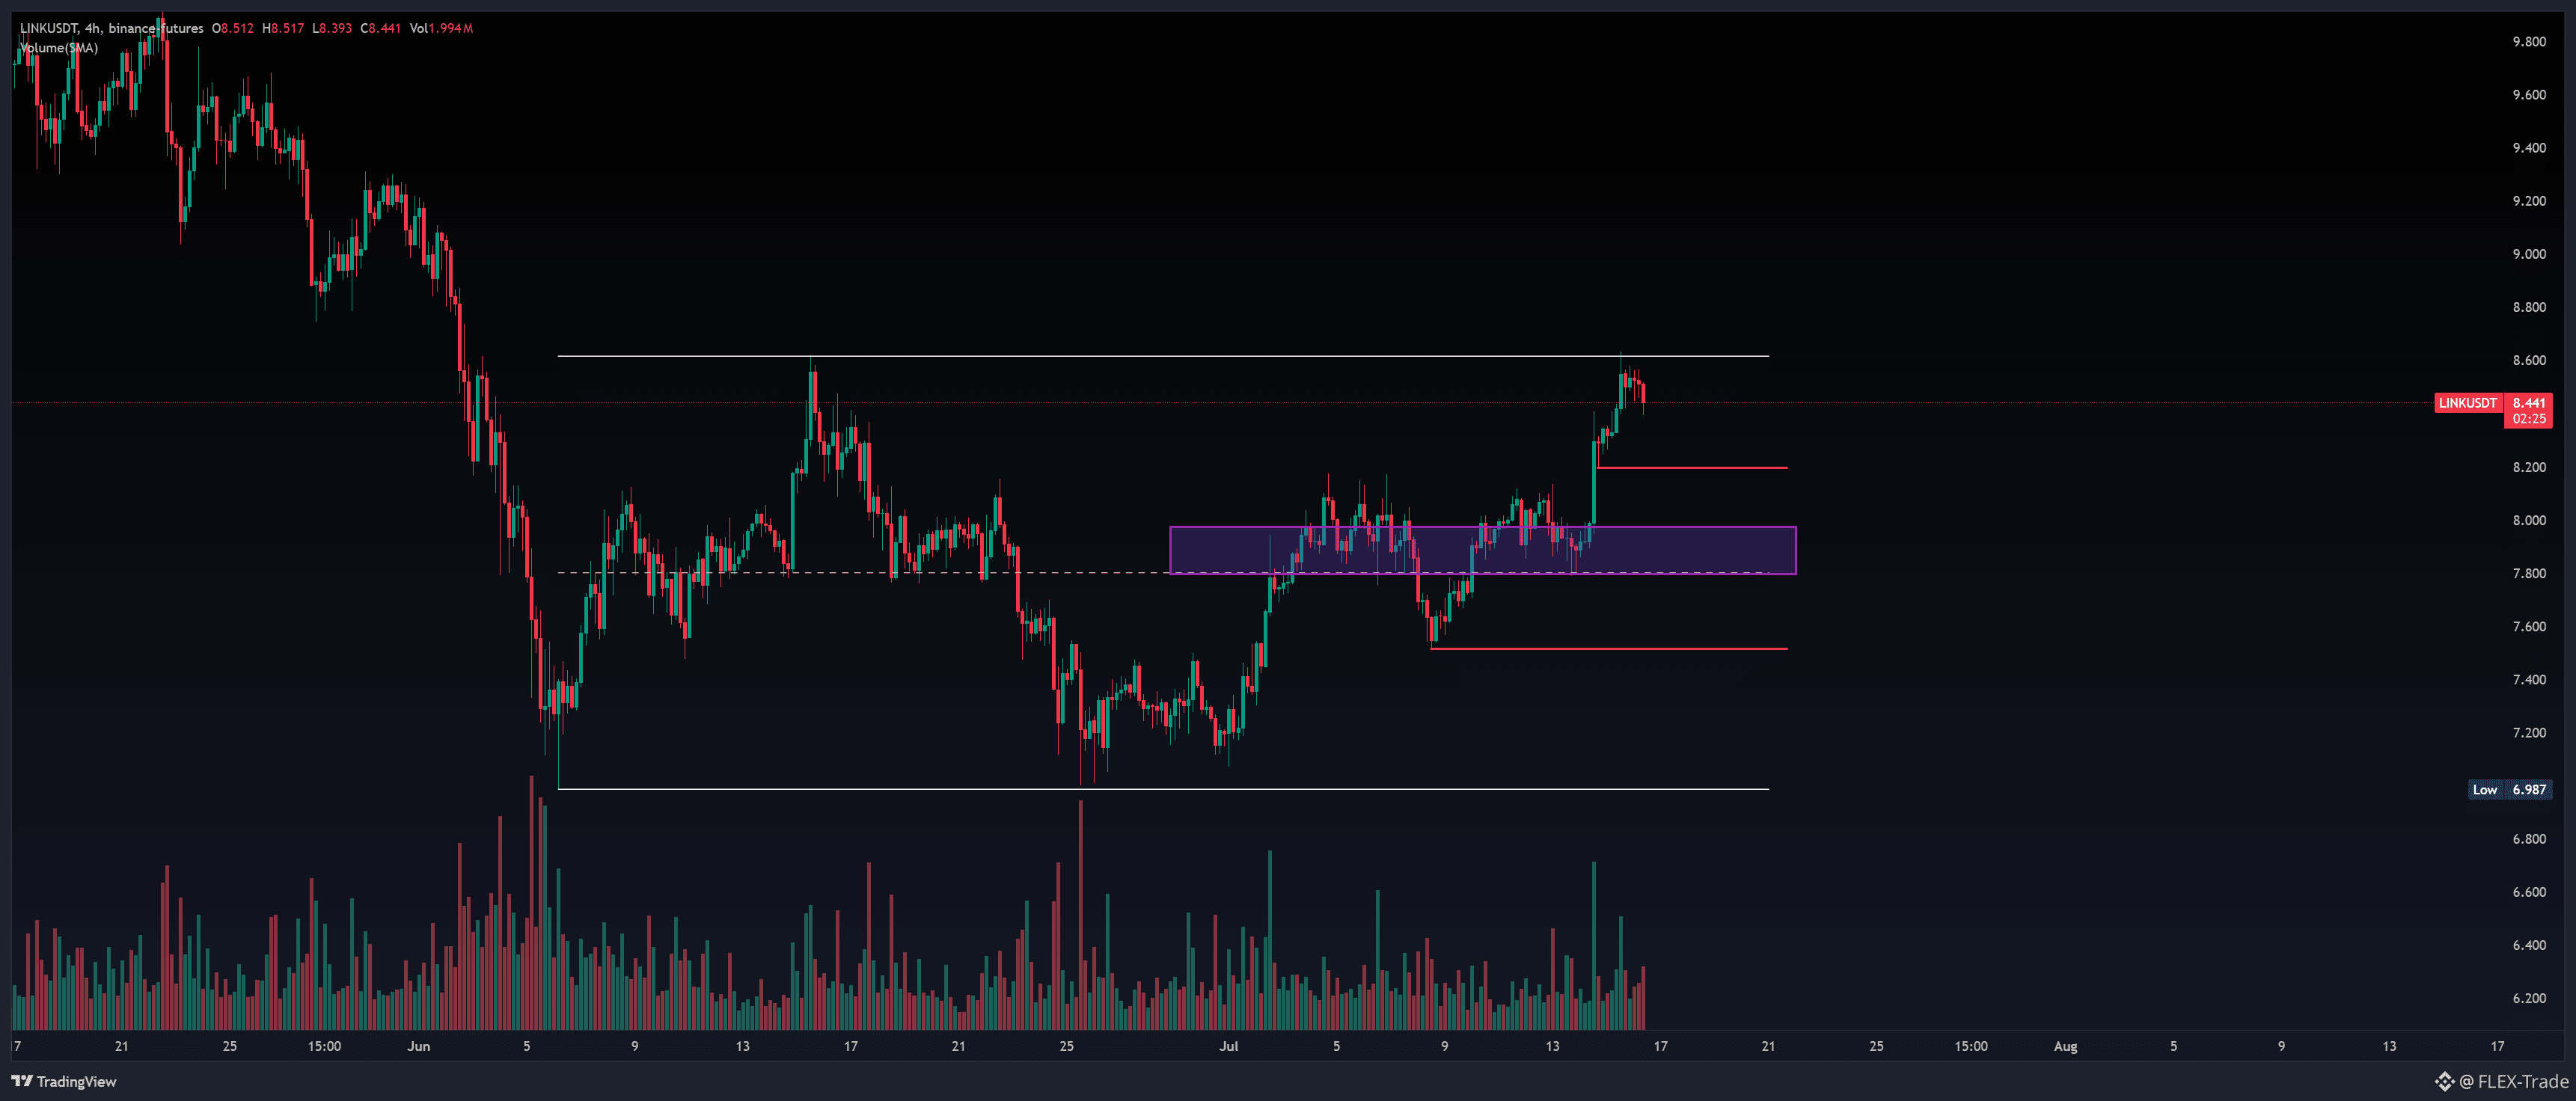
I often hear that they are pushing something on the link there...
While it’s in the range—and besides, there’s also an upturn by range.
So there’s a reason to set an alarm for the zones below and wait.
Nearest ones:
8.2 $
8 $
7.5$
Alarm at levels and entries from broken levels for longs or sweeps.
{future}(LINKUSDT)
{spot}(LINKUSDT)
$LINK
I often hear that they are pushing something on the link there...
While it’s in the range—and besides, there’s also an upturn by range.
So there’s a reason to set an alarm for the zones below and wait.
Nearest ones:
8.2 $
8 $
7.5$
Alarm at levels and entries from broken levels for longs or sweeps.
I often hear that they are pushing something on the link there...
While it’s in the range—and besides, there’s also an upturn by range.
So there’s a reason to set an alarm for the zones below and wait.
Nearest ones:
8.2 $
8 $
7.5$
Alarm at levels and entries from broken levels for longs or sweeps.
920
·
--
$ADA
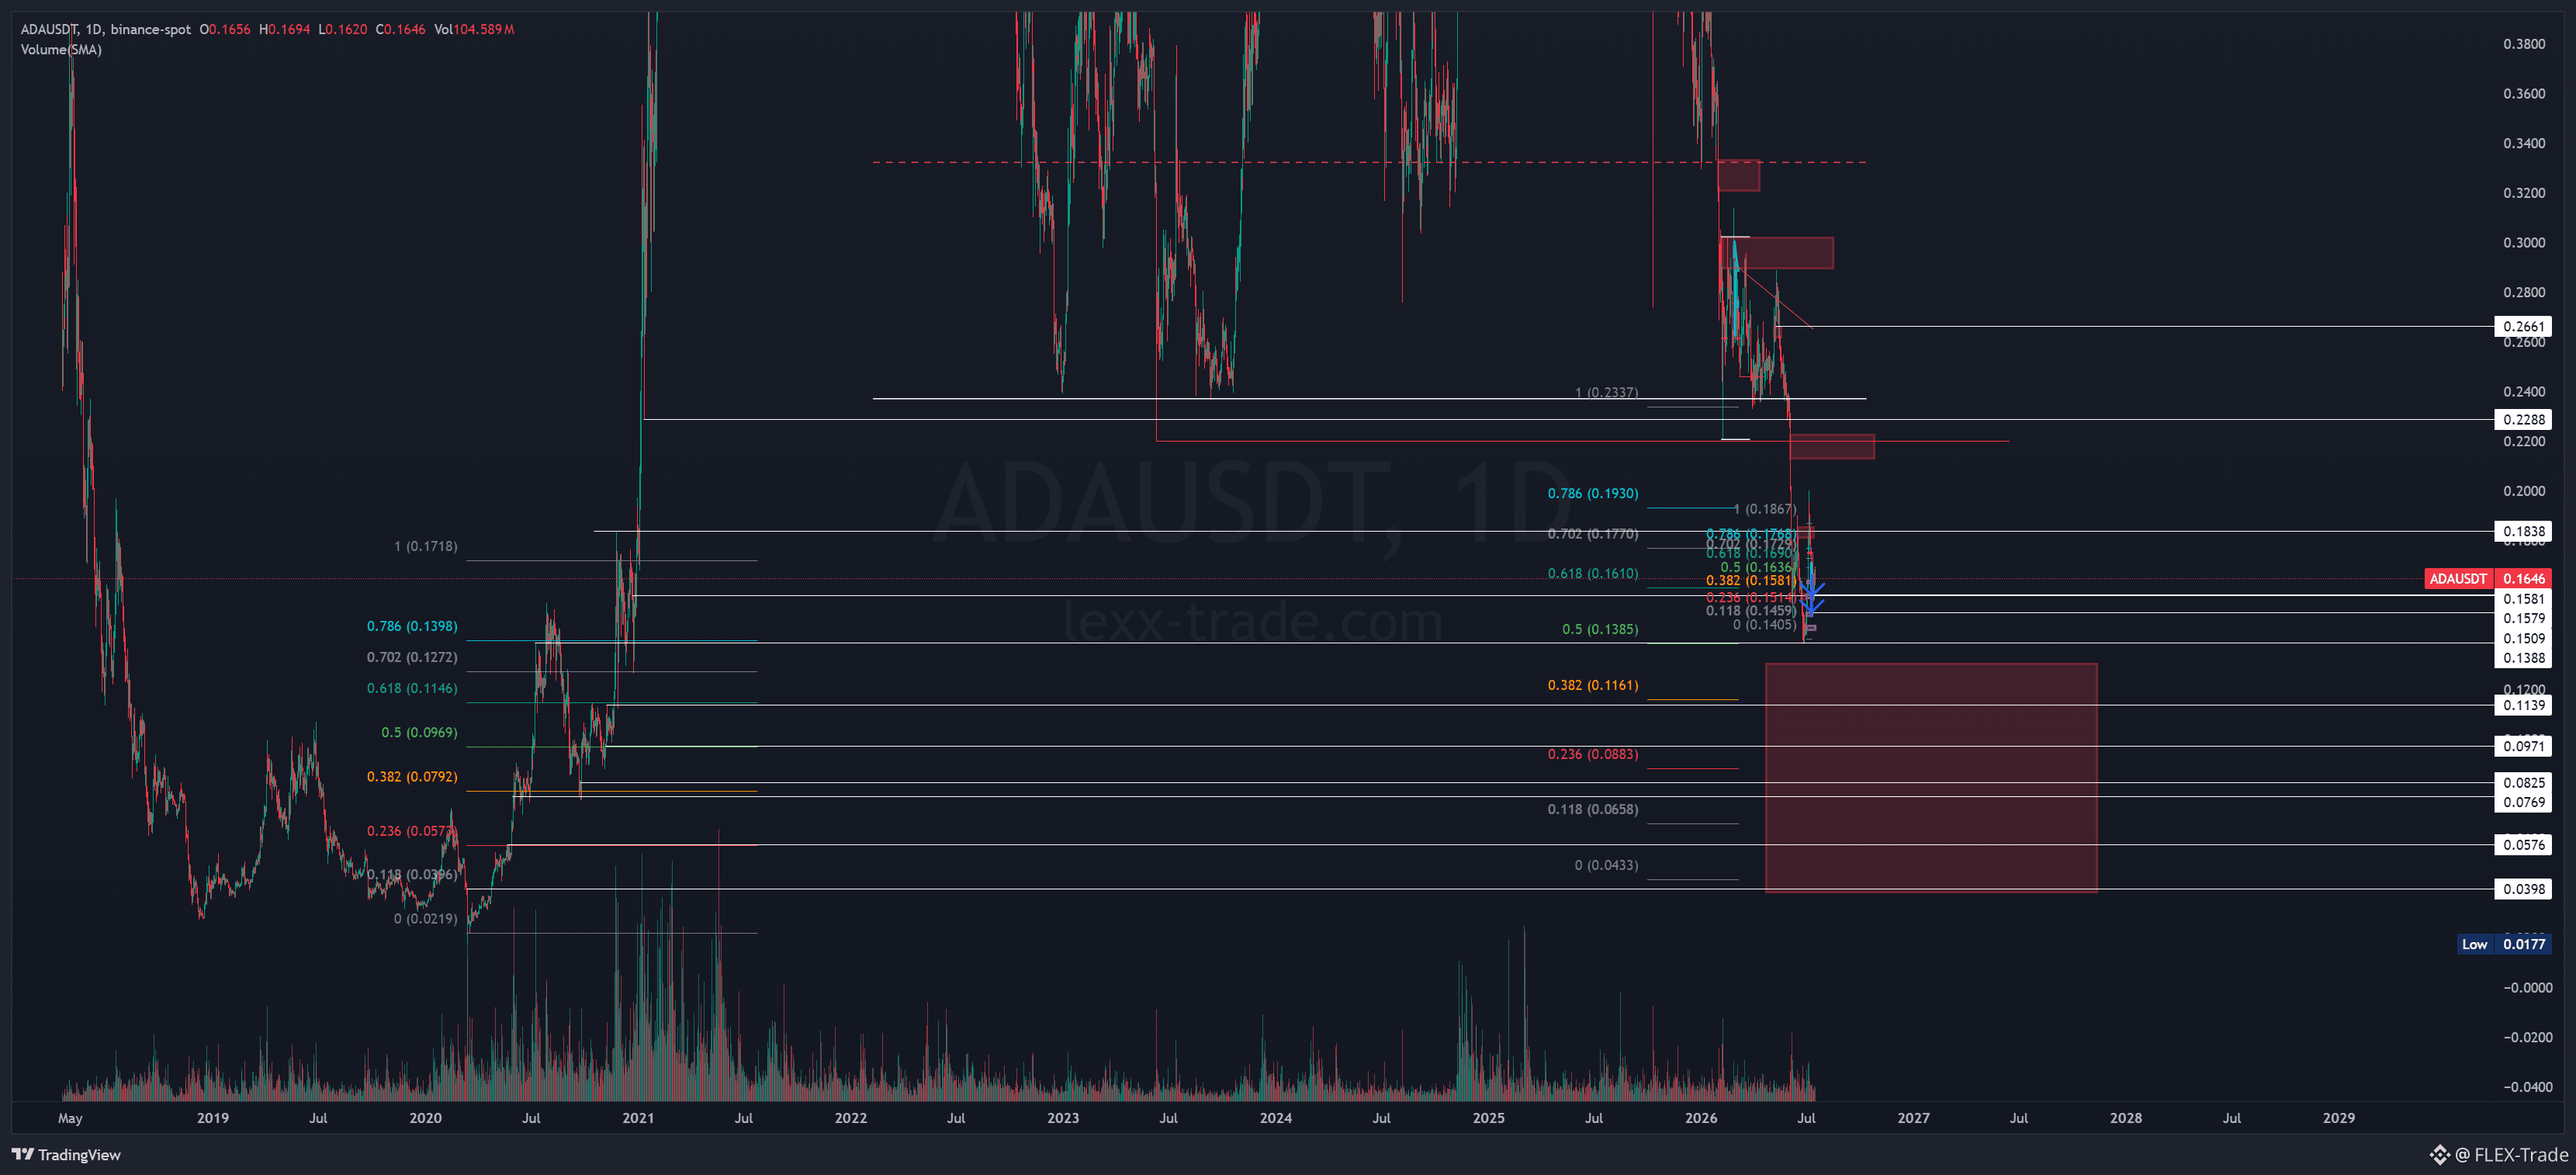
I don’t even remember anymore whether I gave you a positional setup for Ada—partly it already worked out from the 0.14 level.
Now you can confidently re-enter from 0.1150.
Either with a Fibonacci grid, or using grids in the range of the grid or the rectangle.
{spot}(ADAUSDT)
{future}(ADAUSDT)
$ADA
I don’t even remember anymore whether I gave you a positional setup for Ada—partly it already worked out from the 0.14 level.
Now you can confidently re-enter from 0.1150.
Either with a Fibonacci grid, or using grids in the range of the grid or the rectangle.
I don’t even remember anymore whether I gave you a positional setup for Ada—partly it already worked out from the 0.14 level.
Now you can confidently re-enter from 0.1150.
Either with a Fibonacci grid, or using grids in the range of the grid or the rectangle.
1
1.7k
·
--
$BTC
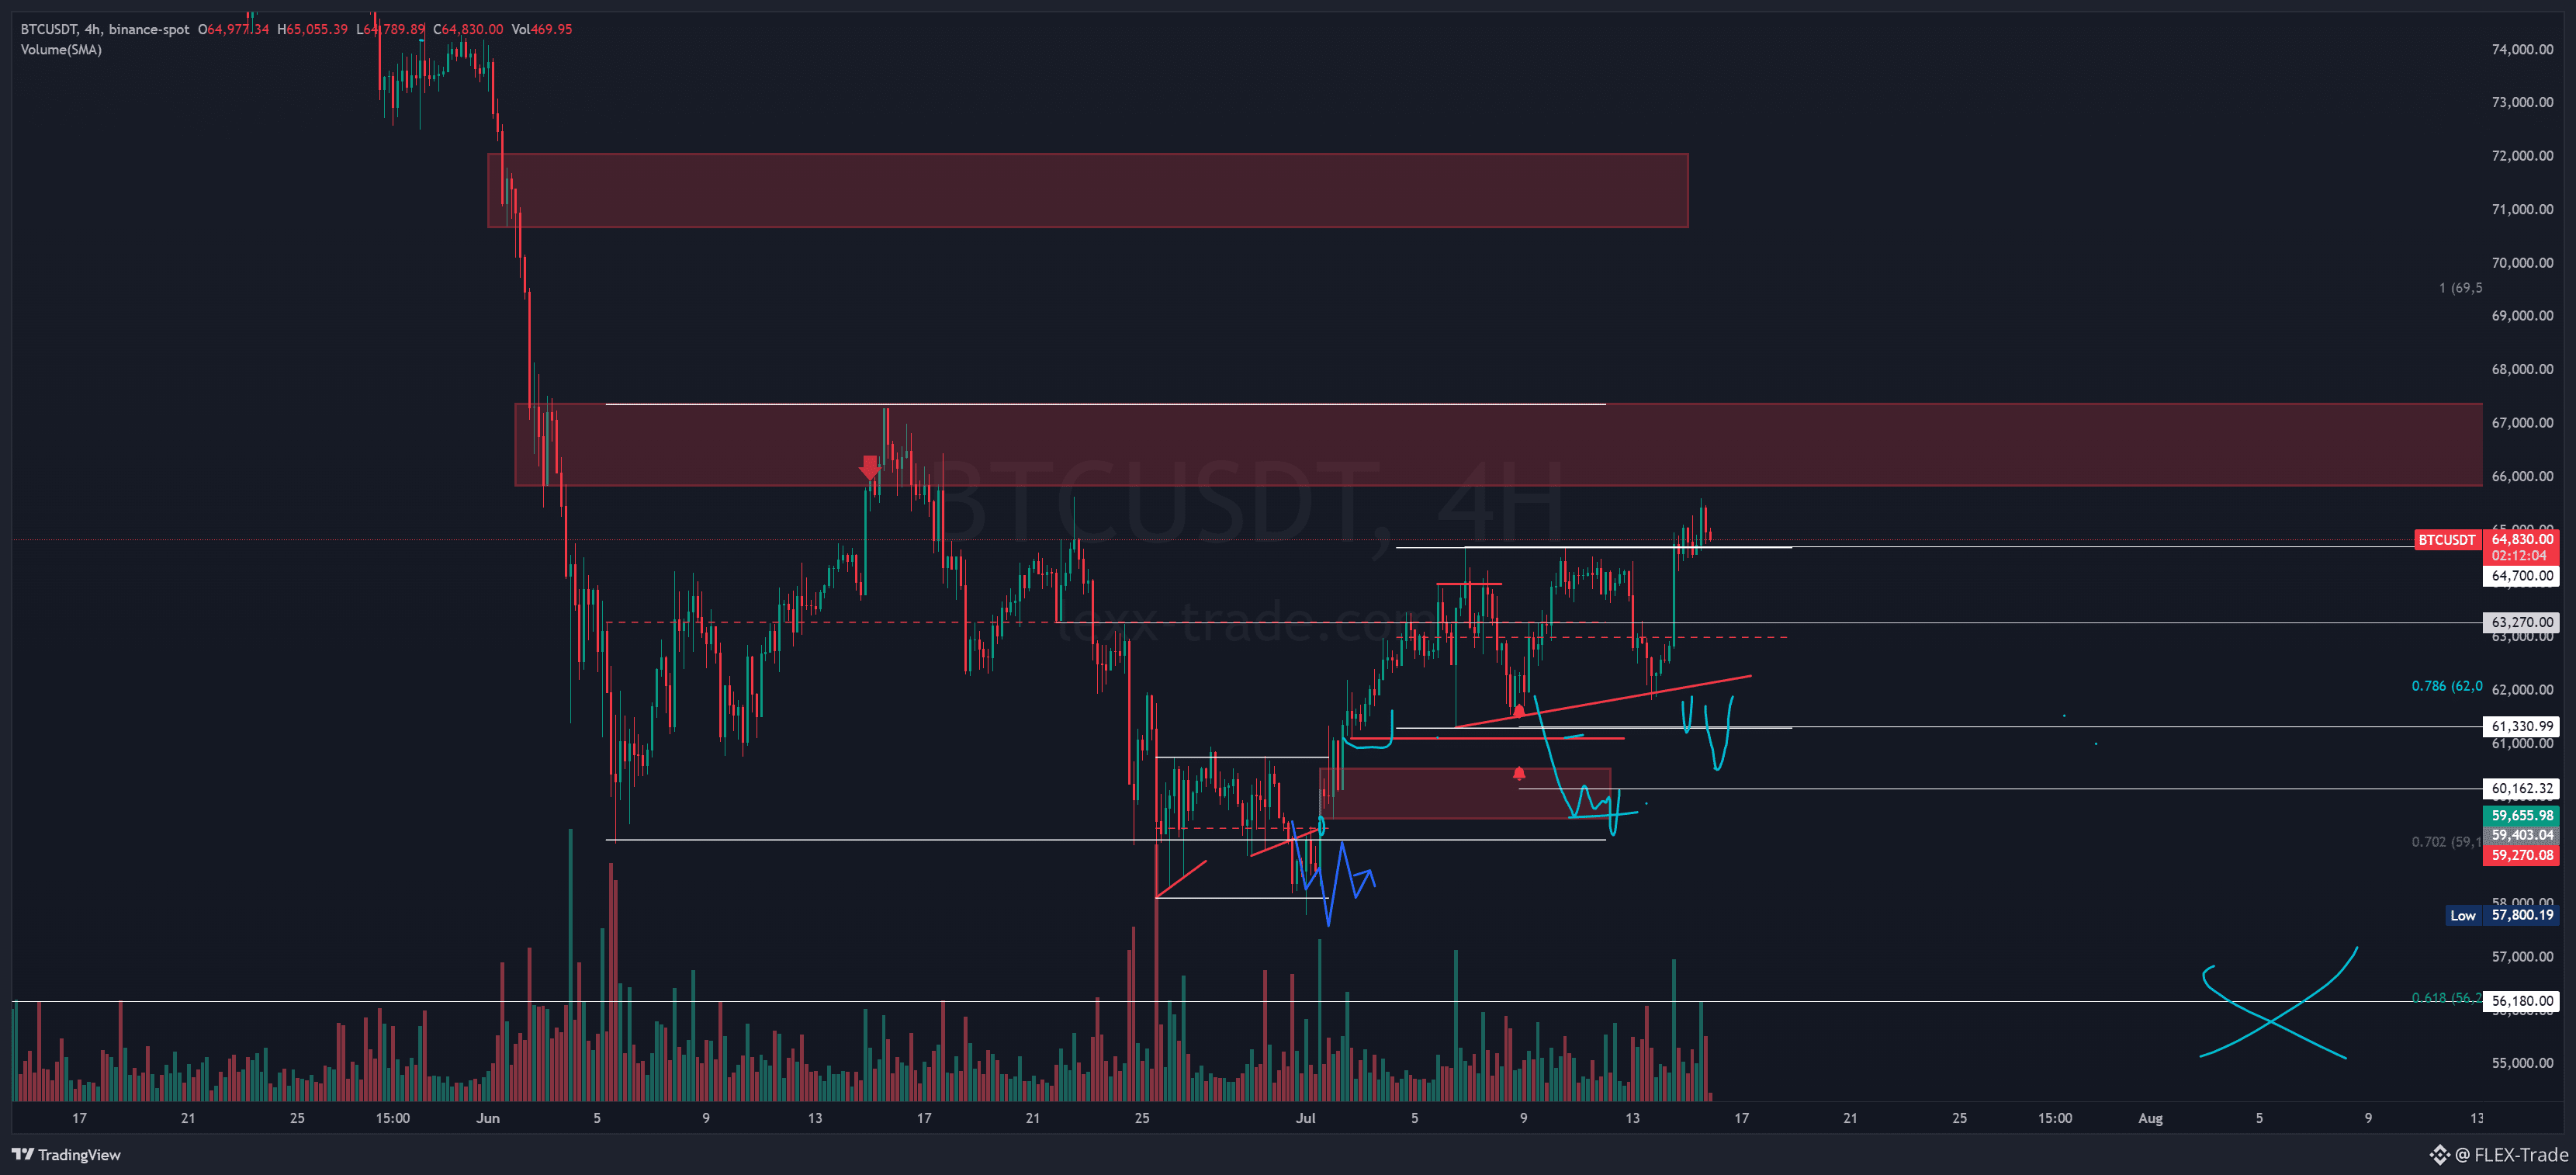
Here’s what I’m waiting for with Bitcoin...
It’s strongly congested.
Either we just wait for the breakout and then we’ll trade the altcoins,
Or there’s something interesting below under the cascade...
An alarm for the approach to the cascade zone under the spring, or we wait for the price to arrive and test the zone at 60200. No reversal changes—work from 50–52 with confidence will begin.
{future}(BTCUSDT)
{spot}(BTCUSDT)
$BTC
Here’s what I’m waiting for with Bitcoin...
It’s strongly congested.
Either we just wait for the breakout and then we’ll trade the altcoins,
Or there’s something interesting below under the cascade...
An alarm for the approach to the cascade zone under the spring, or we wait for the price to arrive and test the zone at 60200. No reversal changes—work from 50–52 with confidence will begin.
Here’s what I’m waiting for with Bitcoin...
It’s strongly congested.
Either we just wait for the breakout and then we’ll trade the altcoins,
Or there’s something interesting below under the cascade...
An alarm for the approach to the cascade zone under the spring, or we wait for the price to arrive and test the zone at 60200. No reversal changes—work from 50–52 with confidence will begin.
4
5
9k
·
--
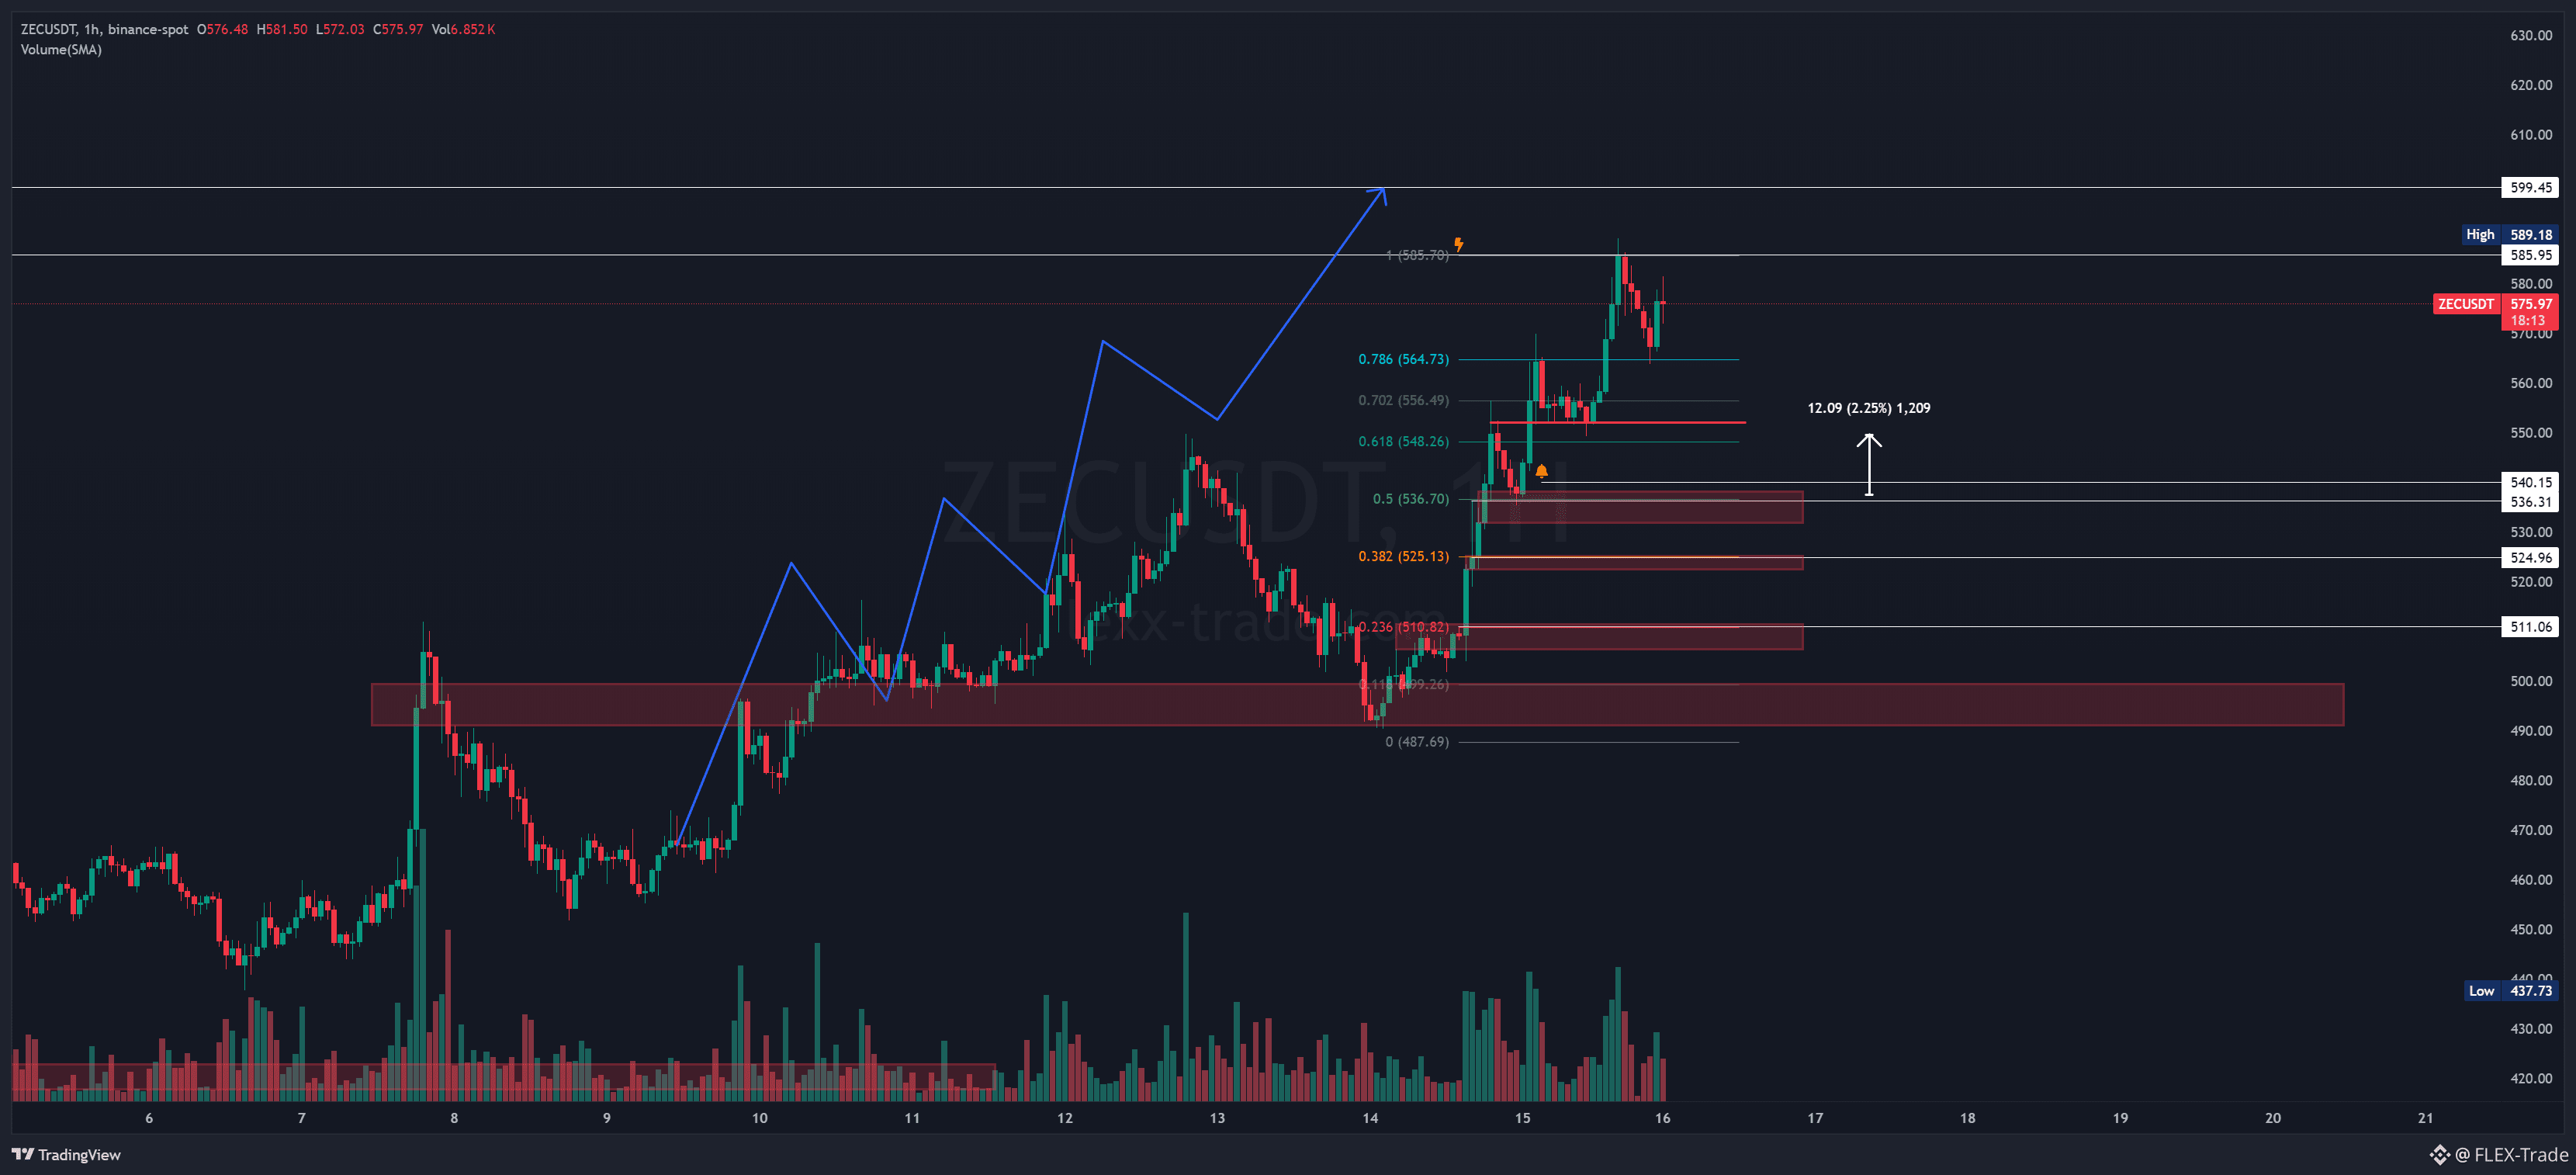
$ZEC
As you may have noticed, the market has gone quiet, along with intraday trading.
But today an alarm came in for ZEC.
I drew a wave—not that it’s very strong, but there are interesting levels to bounce from.
In general, it needs to be put to work.
I highlighted the levels.
Maybe there’ll also be work for the grid—need to monitor..
{future}(ZECUSDT)
{spot}(ZECUSDT)
$ZEC
As you may have noticed, the market has gone quiet, along with intraday trading.
But today an alarm came in for ZEC.
I drew a wave—not that it’s very strong, but there are interesting levels to bounce from.
In general, it needs to be put to work.
I highlighted the levels.
Maybe there’ll also be work for the grid—need to monitor..
As you may have noticed, the market has gone quiet, along with intraday trading.
But today an alarm came in for ZEC.
I drew a wave—not that it’s very strong, but there are interesting levels to bounce from.
In general, it needs to be put to work.
I highlighted the levels.
Maybe there’ll also be work for the grid—need to monitor..
1
1
686
·
--
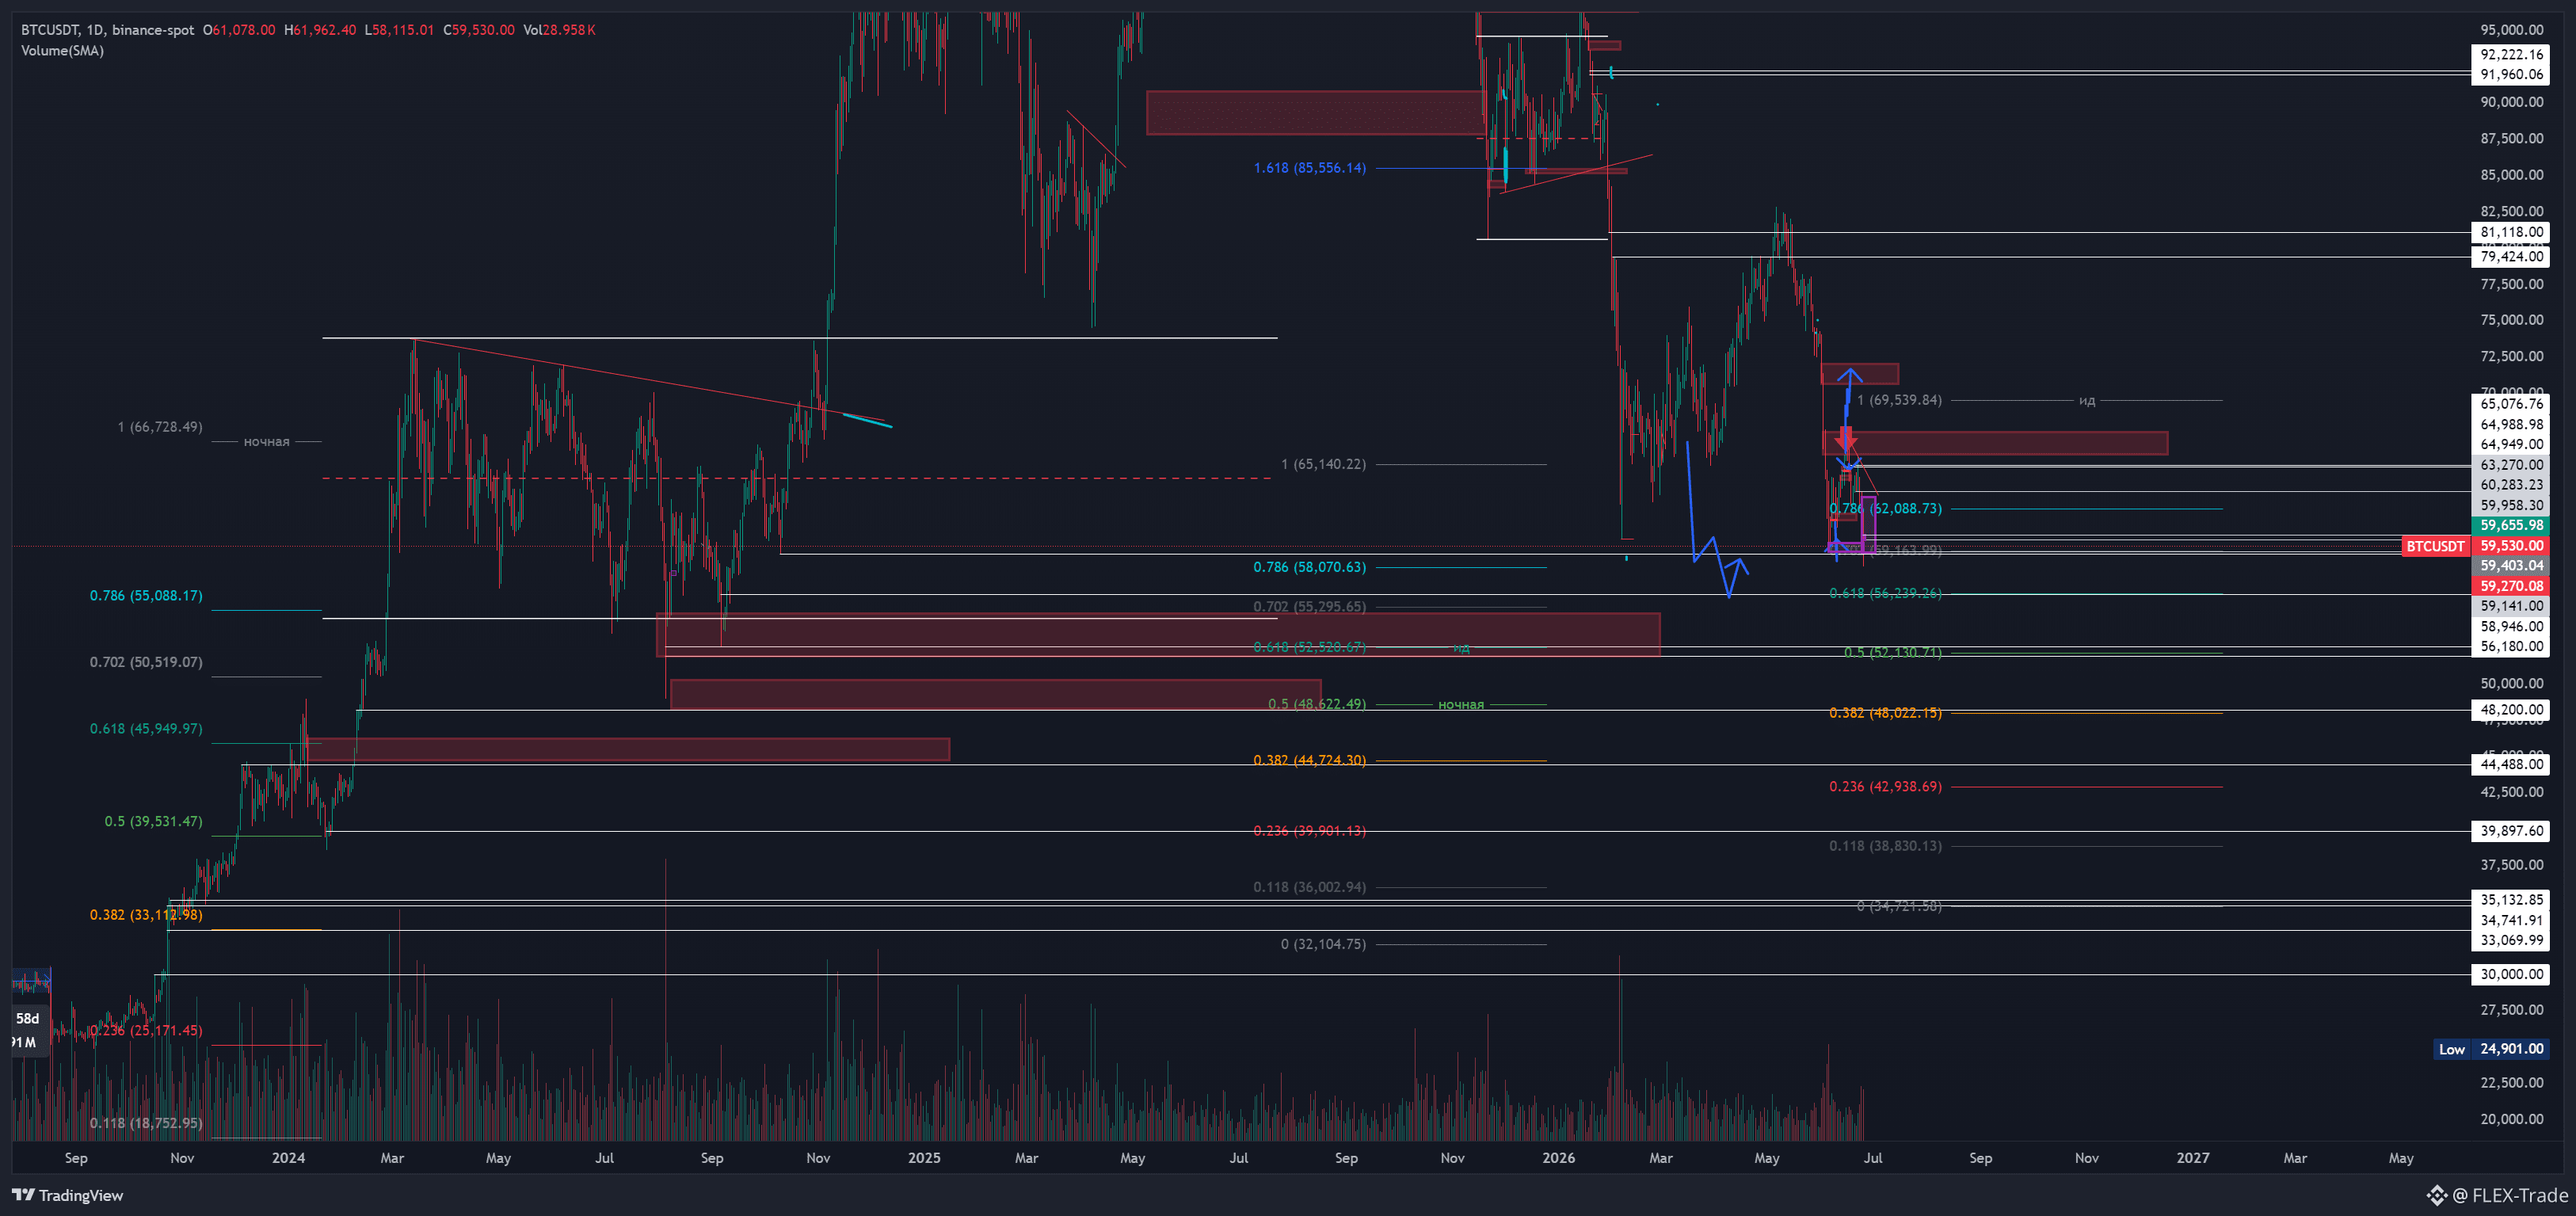
$BTC
So what? Are we rolling down?
Unfortunately, we didn't see an active market and targets around 71k...
But we work with what we have.
I'll wait a bit until the end of the week—if it closes with a spring, then we need to wait for a local break to the upside and go long.
As for the downside, everything is already waiting for entries.
I'm ready to work in grids.
I’ve marked the levels on the chart. I’ll catch entries with the fibs. And I’ll manage it intraday.
$BTC
So what? Are we rolling down?
Unfortunately, we didn't see an active market and targets around 71k...
But we work with what we have.
I'll wait a bit until the end of the week—if it closes with a spring, then we need to wait for a local break to the upside and go long.
As for the downside, everything is already waiting for entries.
I'm ready to work in grids.
I’ve marked the levels on the chart. I’ll catch entries with the fibs. And I’ll manage it intraday.
So what? Are we rolling down?
Unfortunately, we didn't see an active market and targets around 71k...
But we work with what we have.
I'll wait a bit until the end of the week—if it closes with a spring, then we need to wait for a local break to the upside and go long.
As for the downside, everything is already waiting for entries.
I'm ready to work in grids.
I’ve marked the levels on the chart. I’ll catch entries with the fibs. And I’ll manage it intraday.
1
525
·
--
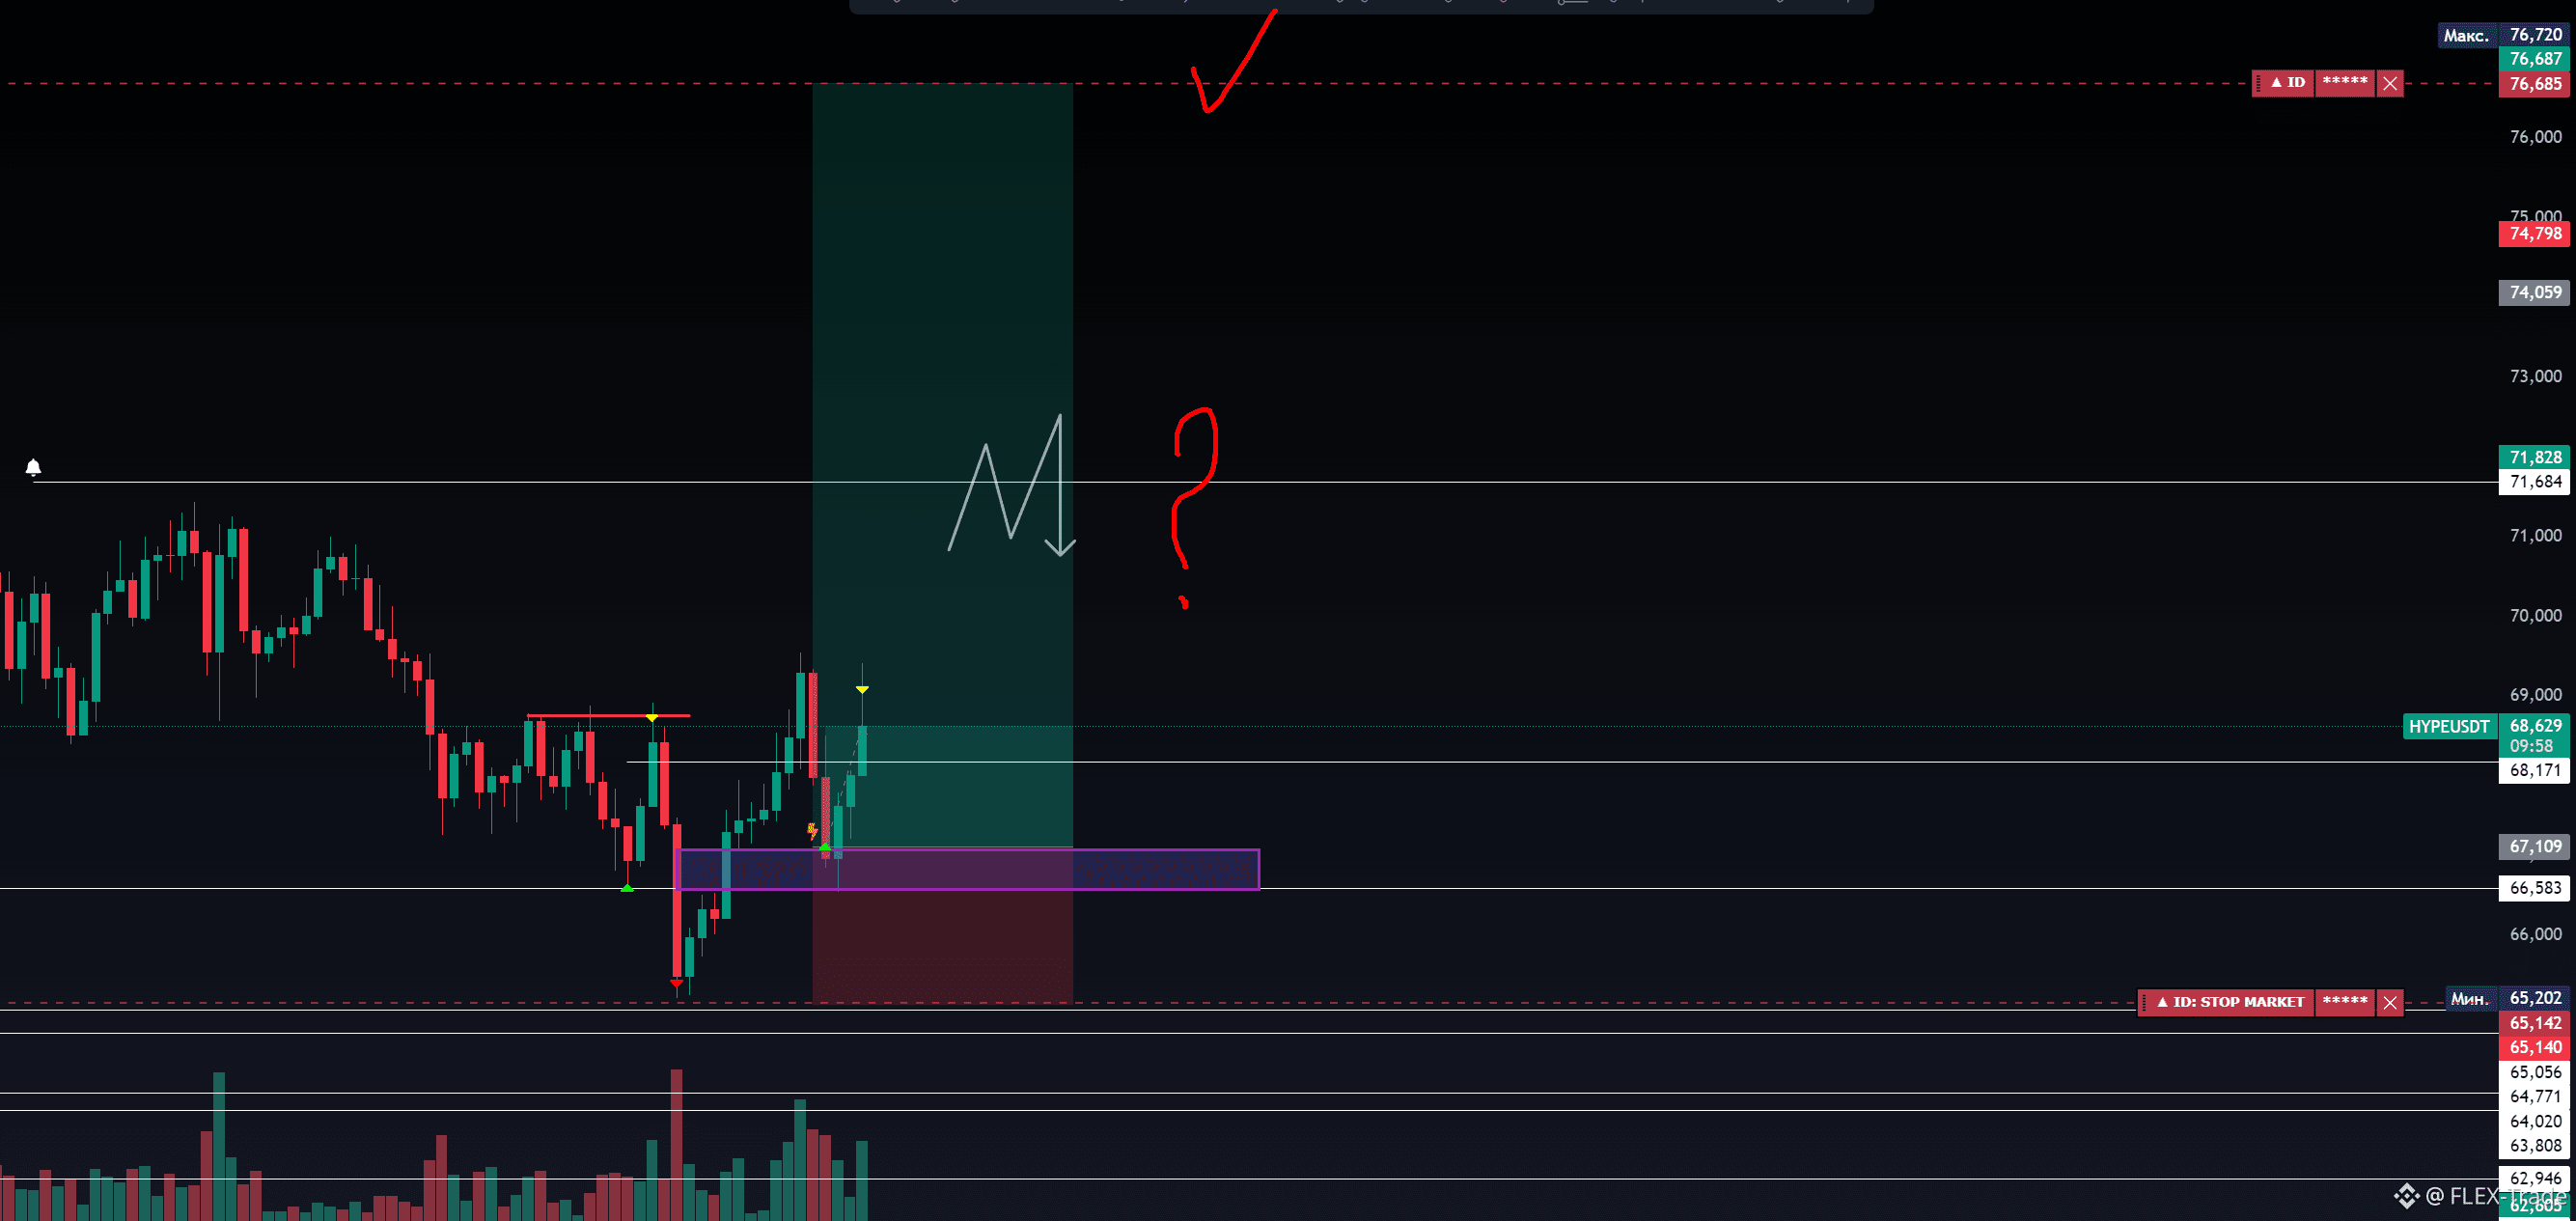
$HYPE
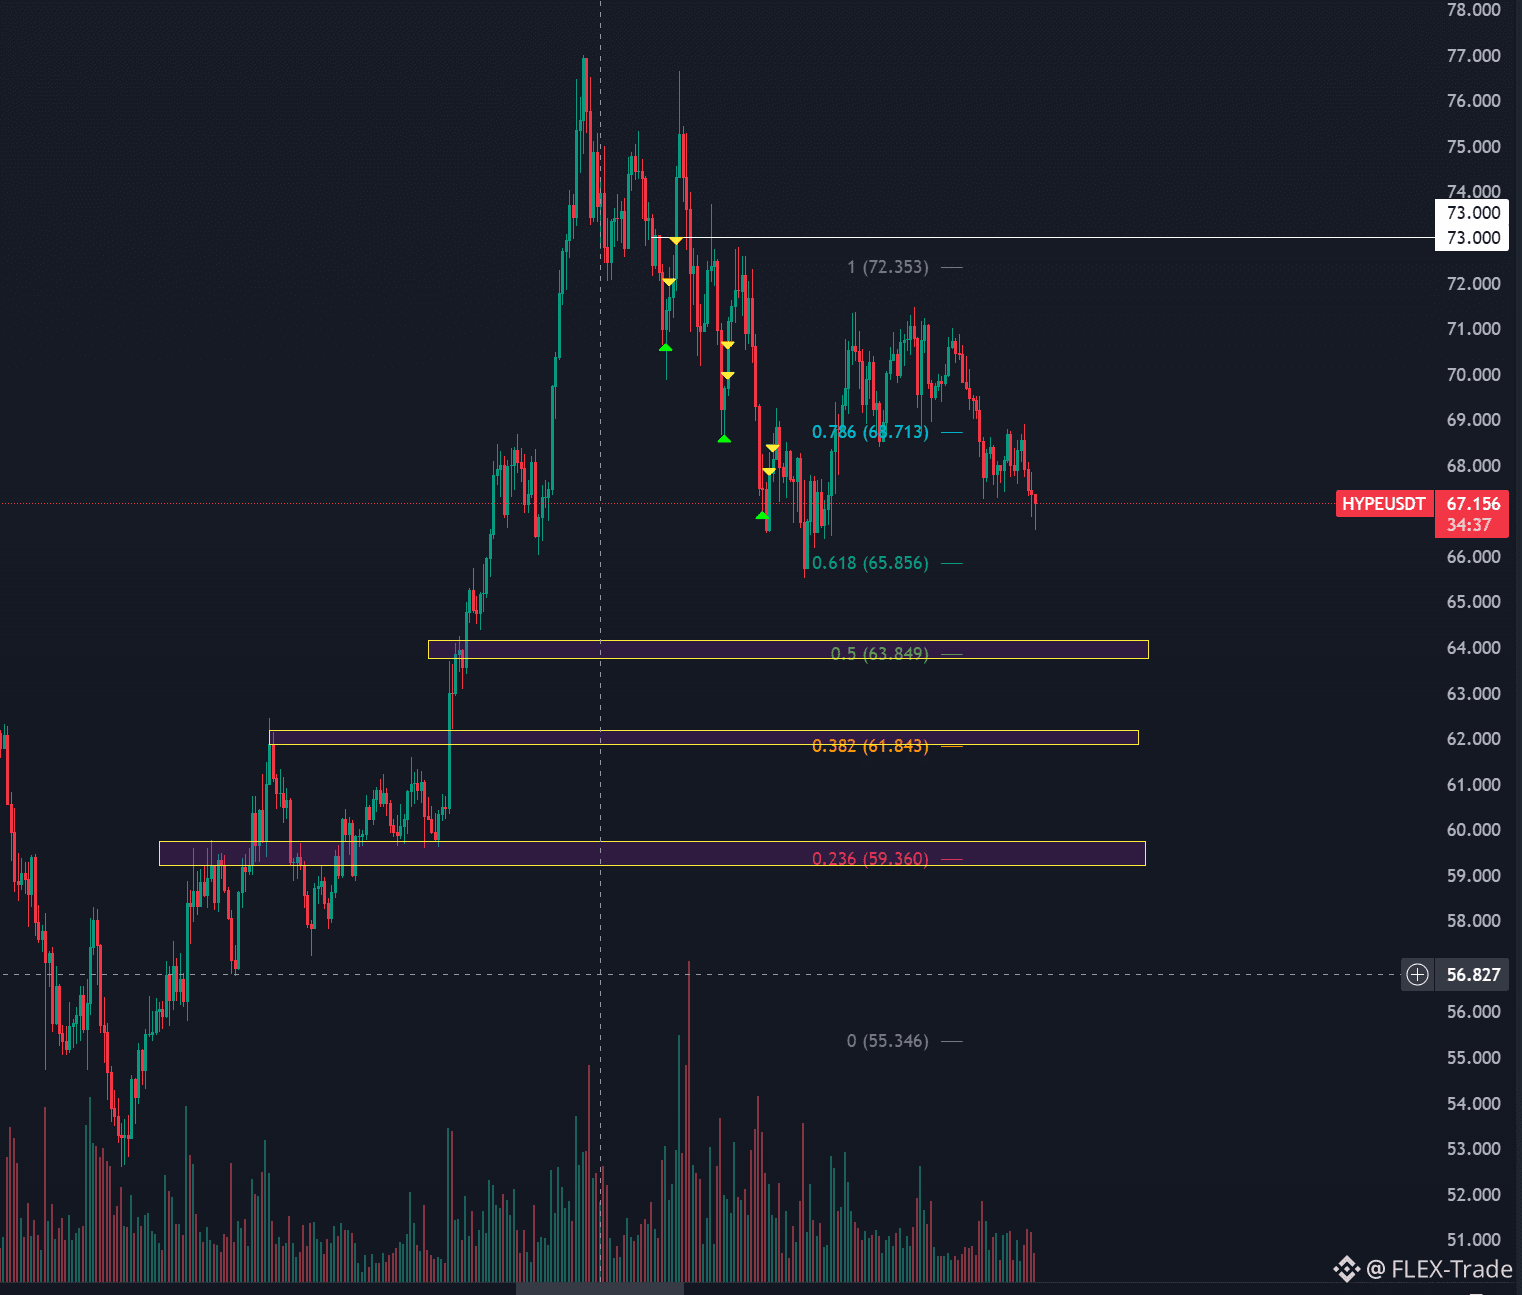
Attempt to sit down #2 is still in progress. Shelf 66.6, results are pending.
After entering, I dumped 50% of my position to stop loss and I'm waiting for take profits above.
In case of a break below, the trade will exit at breakeven.
Currently, I want to take profit in the 76 zone, but I will keep an eye on the price in the 71 dollar zone. If there’s a sharp spike and false breakout at that level, I’ll sell another 25% there.
{future}(HYPEUSDT)
$HYPE
Attempt to sit down #2 is still in progress. Shelf 66.6, results are pending.
After entering, I dumped 50% of my position to stop loss and I'm waiting for take profits above.
In case of a break below, the trade will exit at breakeven.
Currently, I want to take profit in the 76 zone, but I will keep an eye on the price in the 71 dollar zone. If there’s a sharp spike and false breakout at that level, I’ll sell another 25% there.
Attempt to sit down #2 is still in progress. Shelf 66.6, results are pending.
After entering, I dumped 50% of my position to stop loss and I'm waiting for take profits above.
In case of a break below, the trade will exit at breakeven.
Currently, I want to take profit in the 76 zone, but I will keep an eye on the price in the 71 dollar zone. If there’s a sharp spike and false breakout at that level, I’ll sell another 25% there.
FLEX-Trade
·
--
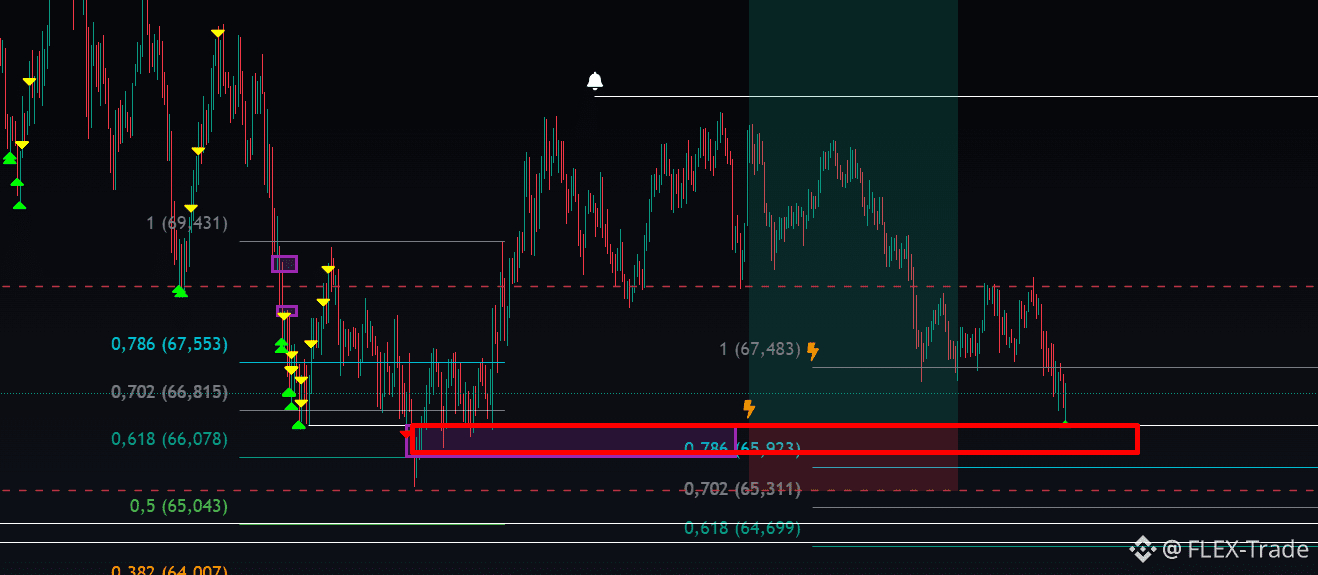
$HYPE
Already forgotten? Not me)
The asset is currently in an interesting long zone.
I've highlighted it in the first screenshot (~66.6+-)
Here, you can either go in hard with a stop loss below the recent low
Or look/wait for a break and latch onto the tests.
And if we consider the picture below, I'm waiting for these levels (screenshot #2)
Already forgotten? Not me)
The asset is currently in an interesting long zone.
I've highlighted it in the first screenshot (~66.6+-)
Here, you can either go in hard with a stop loss below the recent low
Or look/wait for a break and latch onto the tests.
And if we consider the picture below, I'm waiting for these levels (screenshot #2)
1
197
·
--
$HYPE
Already forgotten? Not me)
The asset is currently in an interesting long zone.
I've highlighted it in the first screenshot (~66.6+-)
Here, you can either go in hard with a stop loss below the recent low
Or look/wait for a break and latch onto the tests.
And if we consider the picture below, I'm waiting for these levels (screenshot #2)
$HYPE
Already forgotten? Not me)
The asset is currently in an interesting long zone.
I've highlighted it in the first screenshot (~66.6+-)
Here, you can either go in hard with a stop loss below the recent low
Or look/wait for a break and latch onto the tests.
And if we consider the picture below, I'm waiting for these levels (screenshot #2)
Already forgotten? Not me)
The asset is currently in an interesting long zone.
I've highlighted it in the first screenshot (~66.6+-)
Here, you can either go in hard with a stop loss below the recent low
Or look/wait for a break and latch onto the tests.
And if we consider the picture below, I'm waiting for these levels (screenshot #2)
1
1
2
118
·
--
$RE
QUESTION
Should I keep trading it?
On one hand, it hasn't dropped yet,
On the other, it's running out of steam and we don't have a history on the candlestick chart to predict how the asset will behave without interest...
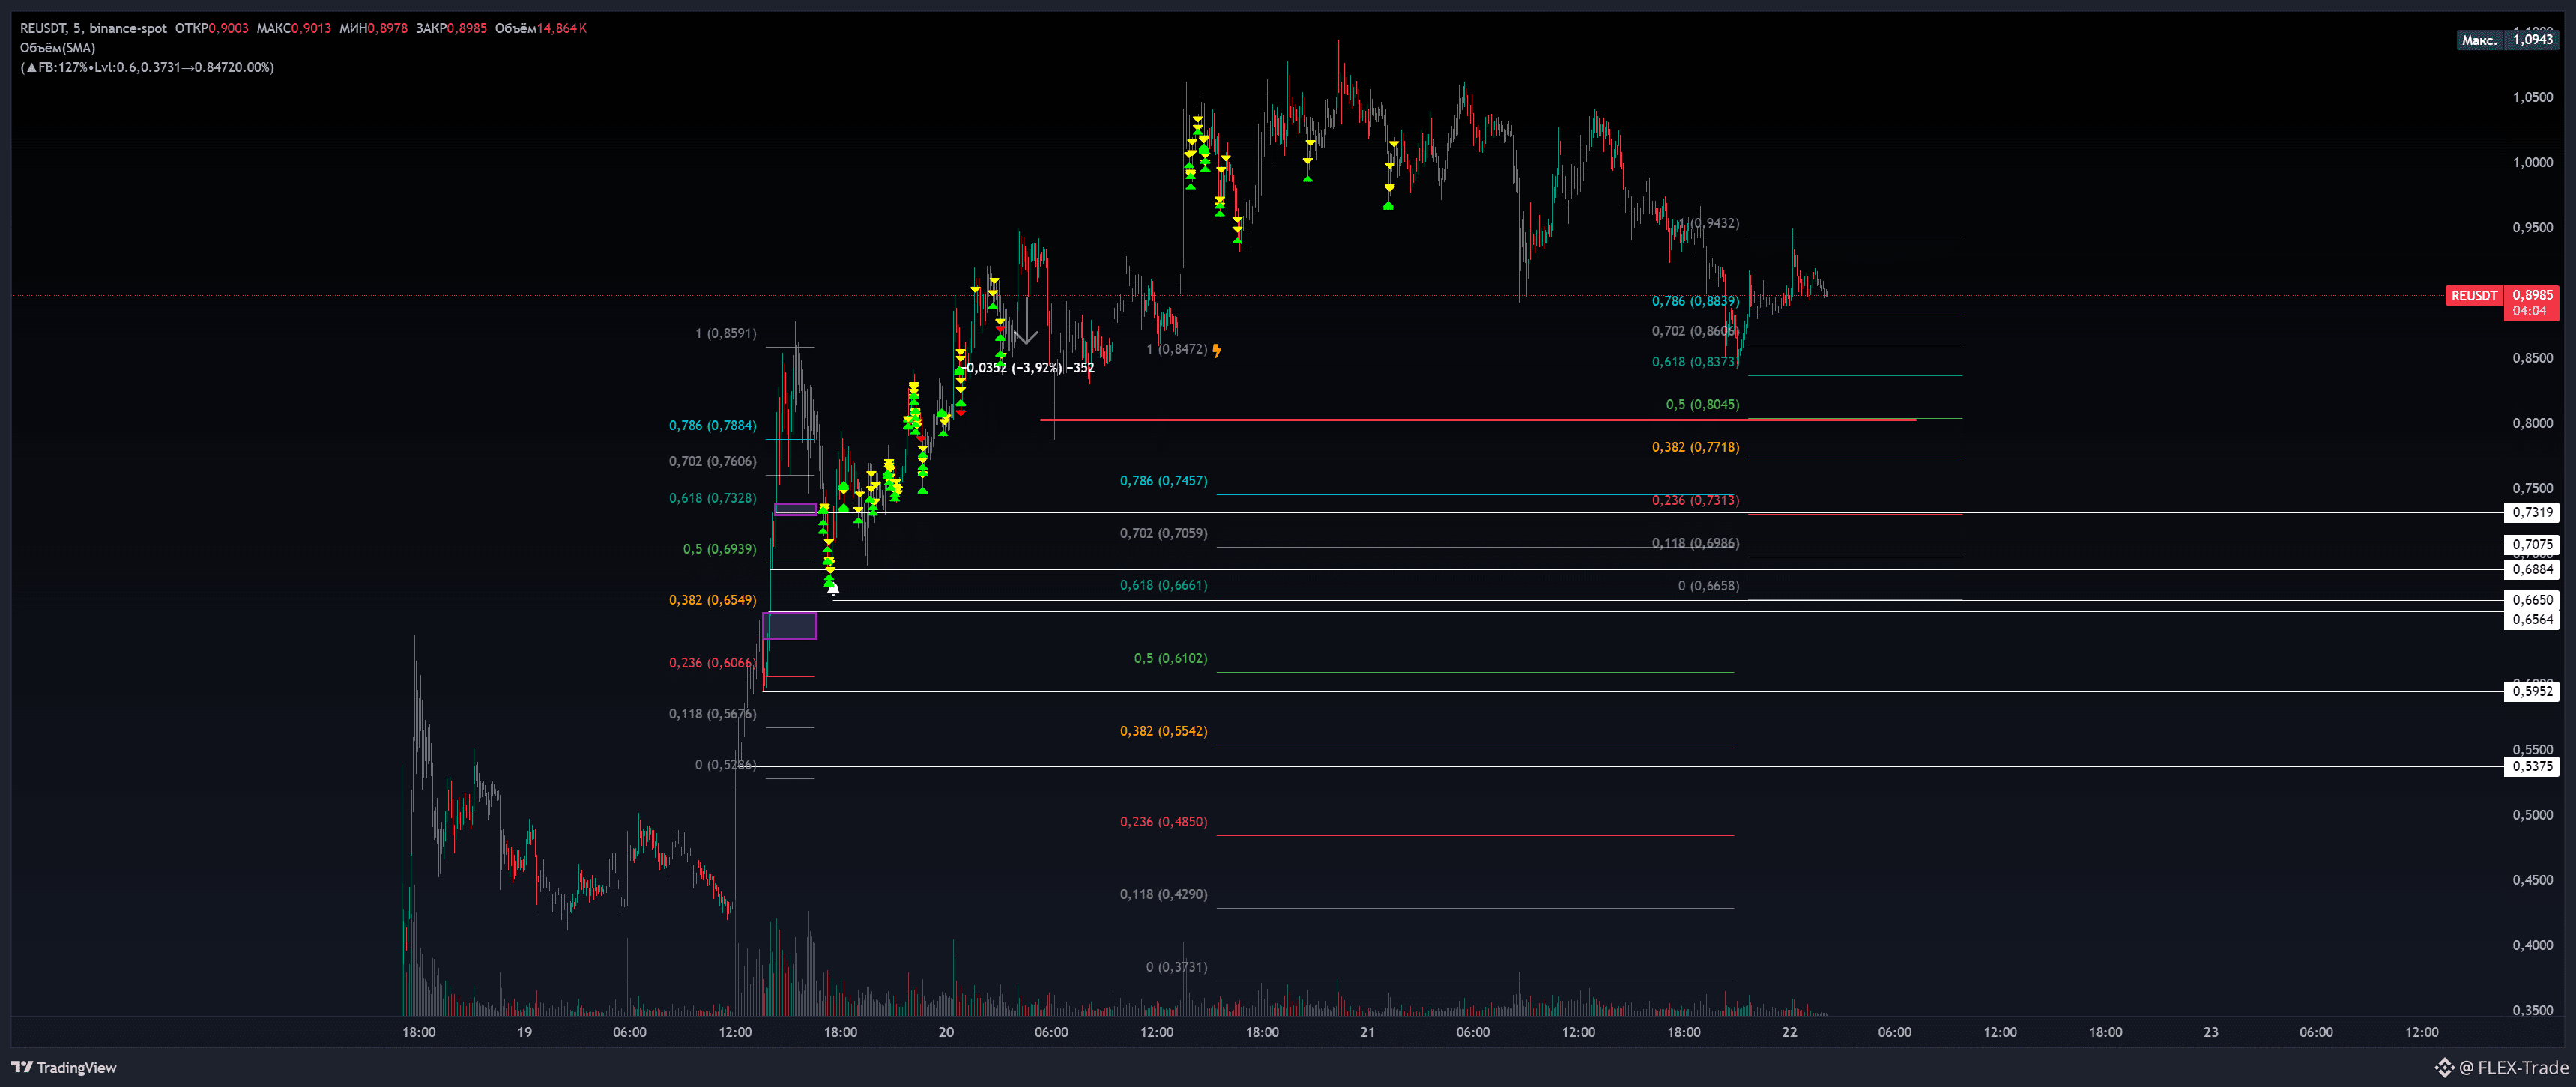
I'm interested in the 0.8 level for a local scalp.
It's just right for those active between 5-8 AM UTC+3. I've been missing out on the action during this time frame for days now.
To catch buyers, it looks like the live levels will be 0.66, 0.61, 0.55.
I've marked them on the chart.
$RE
QUESTION
Should I keep trading it?
On one hand, it hasn't dropped yet,
On the other, it's running out of steam and we don't have a history on the candlestick chart to predict how the asset will behave without interest...
I'm interested in the 0.8 level for a local scalp.
It's just right for those active between 5-8 AM UTC+3. I've been missing out on the action during this time frame for days now.
To catch buyers, it looks like the live levels will be 0.66, 0.61, 0.55.
I've marked them on the chart.
QUESTION
Should I keep trading it?
On one hand, it hasn't dropped yet,
On the other, it's running out of steam and we don't have a history on the candlestick chart to predict how the asset will behave without interest...
I'm interested in the 0.8 level for a local scalp.
It's just right for those active between 5-8 AM UTC+3. I've been missing out on the action during this time frame for days now.
To catch buyers, it looks like the live levels will be 0.66, 0.61, 0.55.
I've marked them on the chart.
1
2
921
·
--
$RE
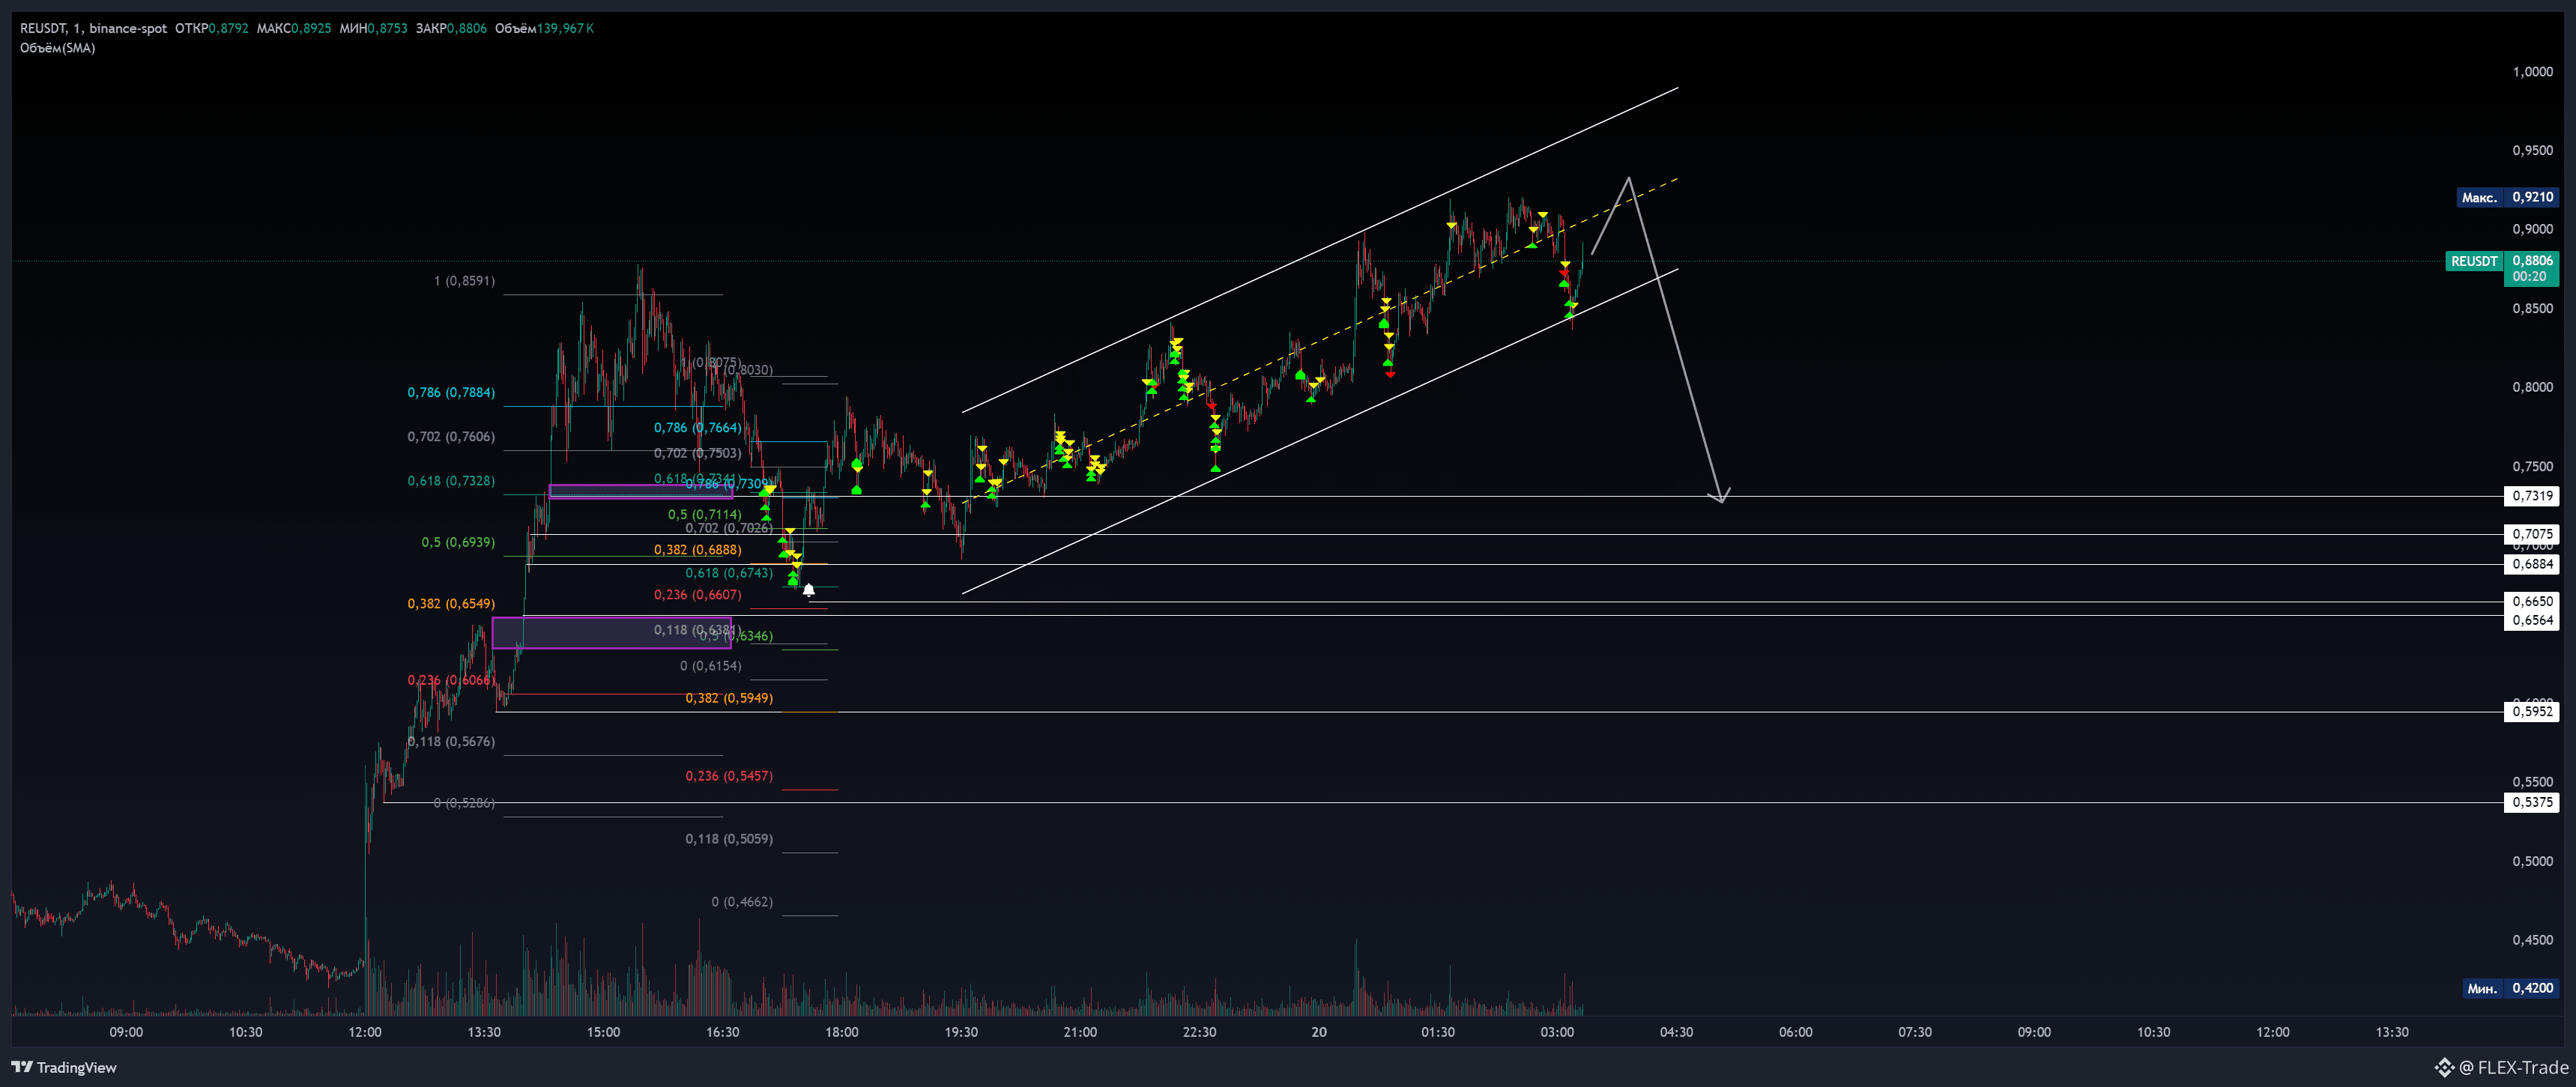
A bit of reasoning behind my thoughts on halting grid trading.
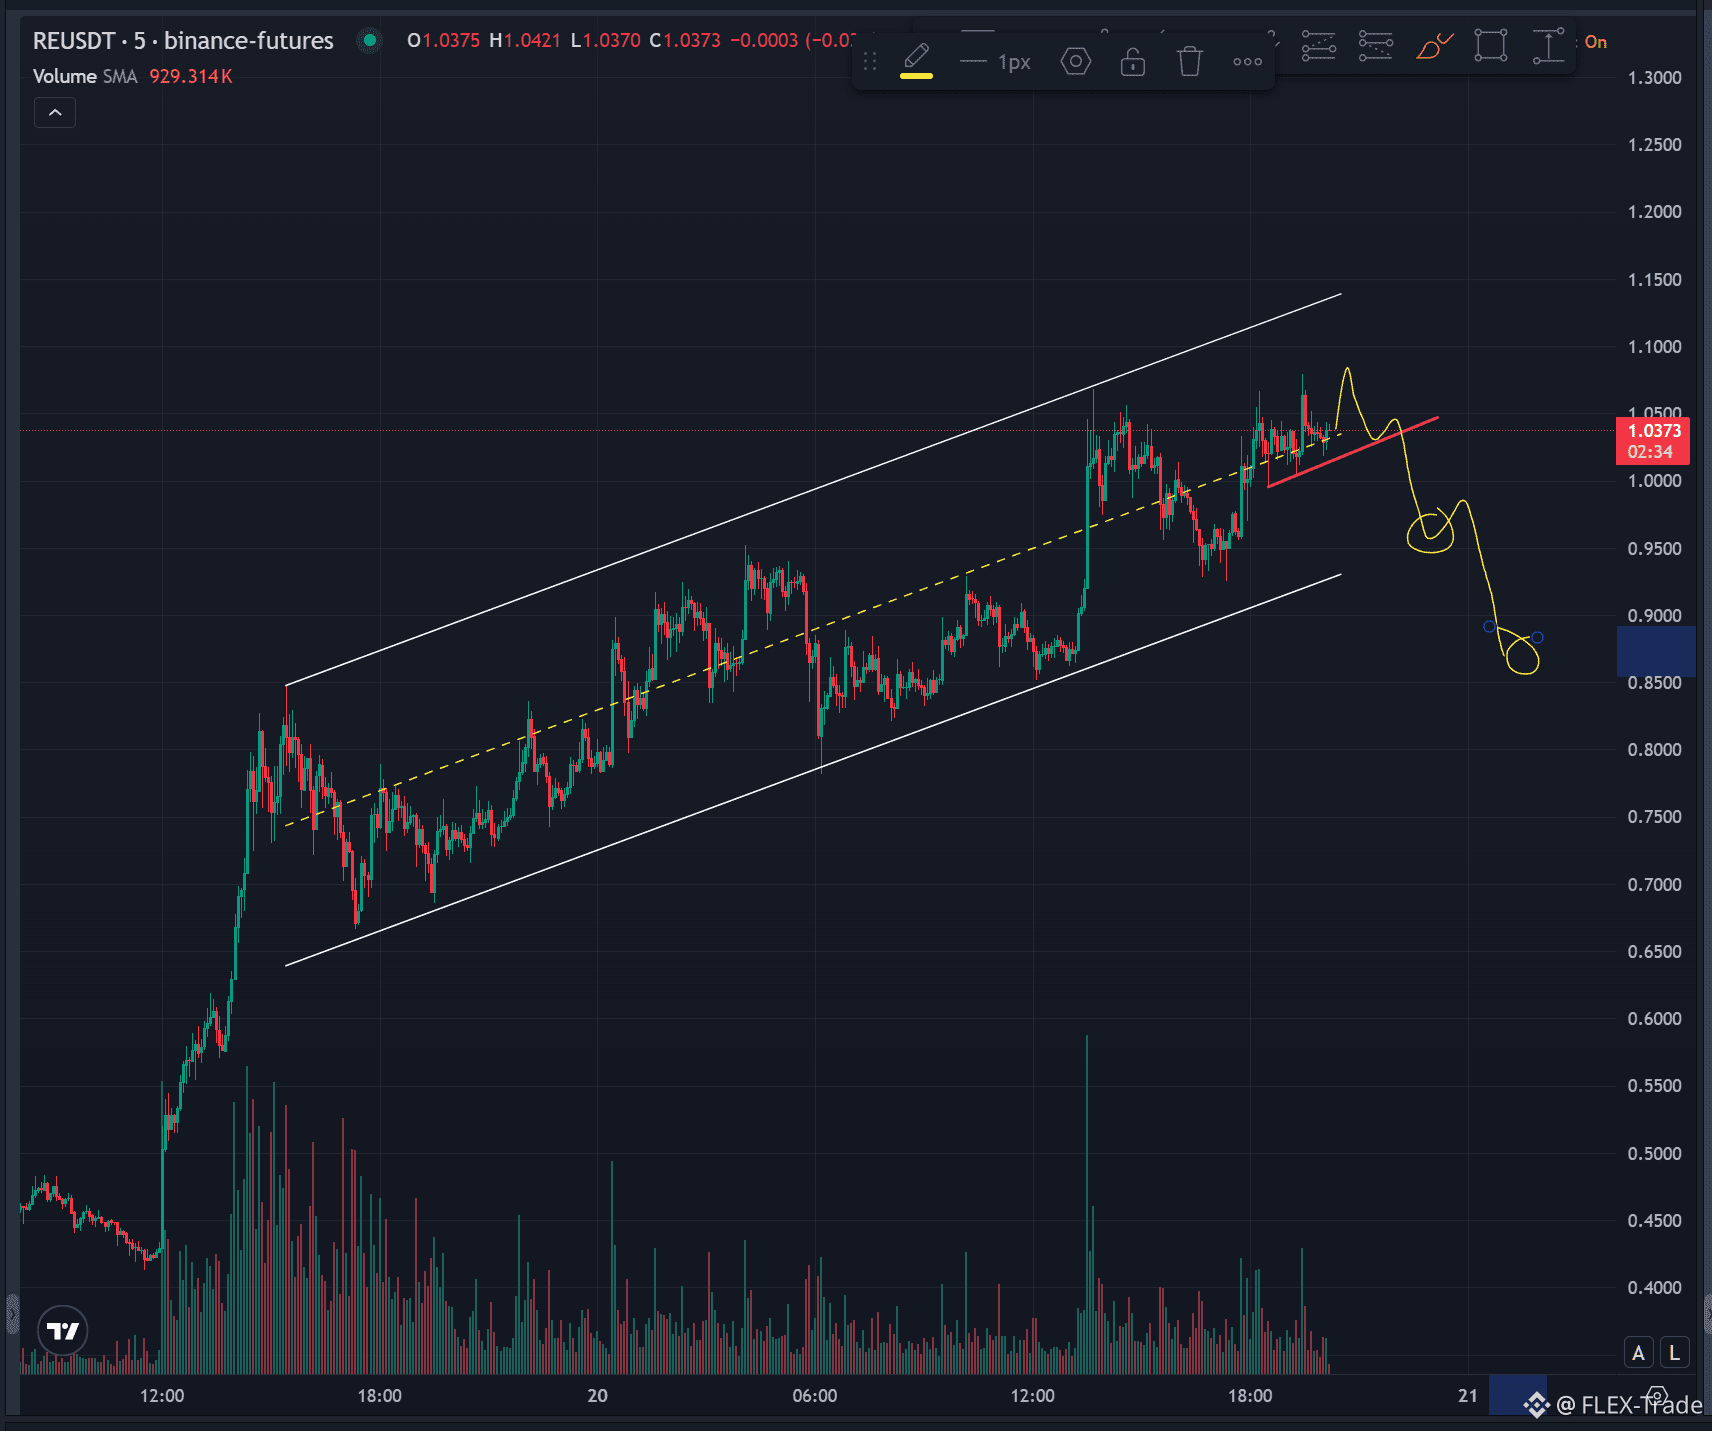
In the screenshot, there's a channel, and today’s impulse pushed the price to the dollar. There’s even been a test already.
The goal of this test is to update the highs... if it can’t manage that, we consider it a failure, along with its level.
And considering that it’s fractally drawing a cascade for a short, the impulses are often pretty strong.
It's not guaranteed that it will start closing its gaps...
For those who latch onto a short in case the channel breaks, you could ride that down to the mid-point of the channel and its base, naturally cutting risk along the way.
Since the uptrend hasn’t been broken yet - shorts are against the grain.
$RE
A bit of reasoning behind my thoughts on halting grid trading.
In the screenshot, there's a channel, and today’s impulse pushed the price to the dollar. There’s even been a test already.
The goal of this test is to update the highs... if it can’t manage that, we consider it a failure, along with its level.
And considering that it’s fractally drawing a cascade for a short, the impulses are often pretty strong.
It's not guaranteed that it will start closing its gaps...
For those who latch onto a short in case the channel breaks, you could ride that down to the mid-point of the channel and its base, naturally cutting risk along the way.
Since the uptrend hasn’t been broken yet - shorts are against the grain.
A bit of reasoning behind my thoughts on halting grid trading.
In the screenshot, there's a channel, and today’s impulse pushed the price to the dollar. There’s even been a test already.
The goal of this test is to update the highs... if it can’t manage that, we consider it a failure, along with its level.
And considering that it’s fractally drawing a cascade for a short, the impulses are often pretty strong.
It's not guaranteed that it will start closing its gaps...
For those who latch onto a short in case the channel breaks, you could ride that down to the mid-point of the channel and its base, naturally cutting risk along the way.
Since the uptrend hasn’t been broken yet - shorts are against the grain.
4
3
4.2k
·
--
$RE
Today continues.
I'm riding local impulses, or rather their tests.
The asset is doing a great job testing incoming volumes.
Yesterday's warning partially played out,
It did drop as expected but provided some solid bounces to profit from, though it was already early morning. I wouldn't have been able to stay awake without sleep...
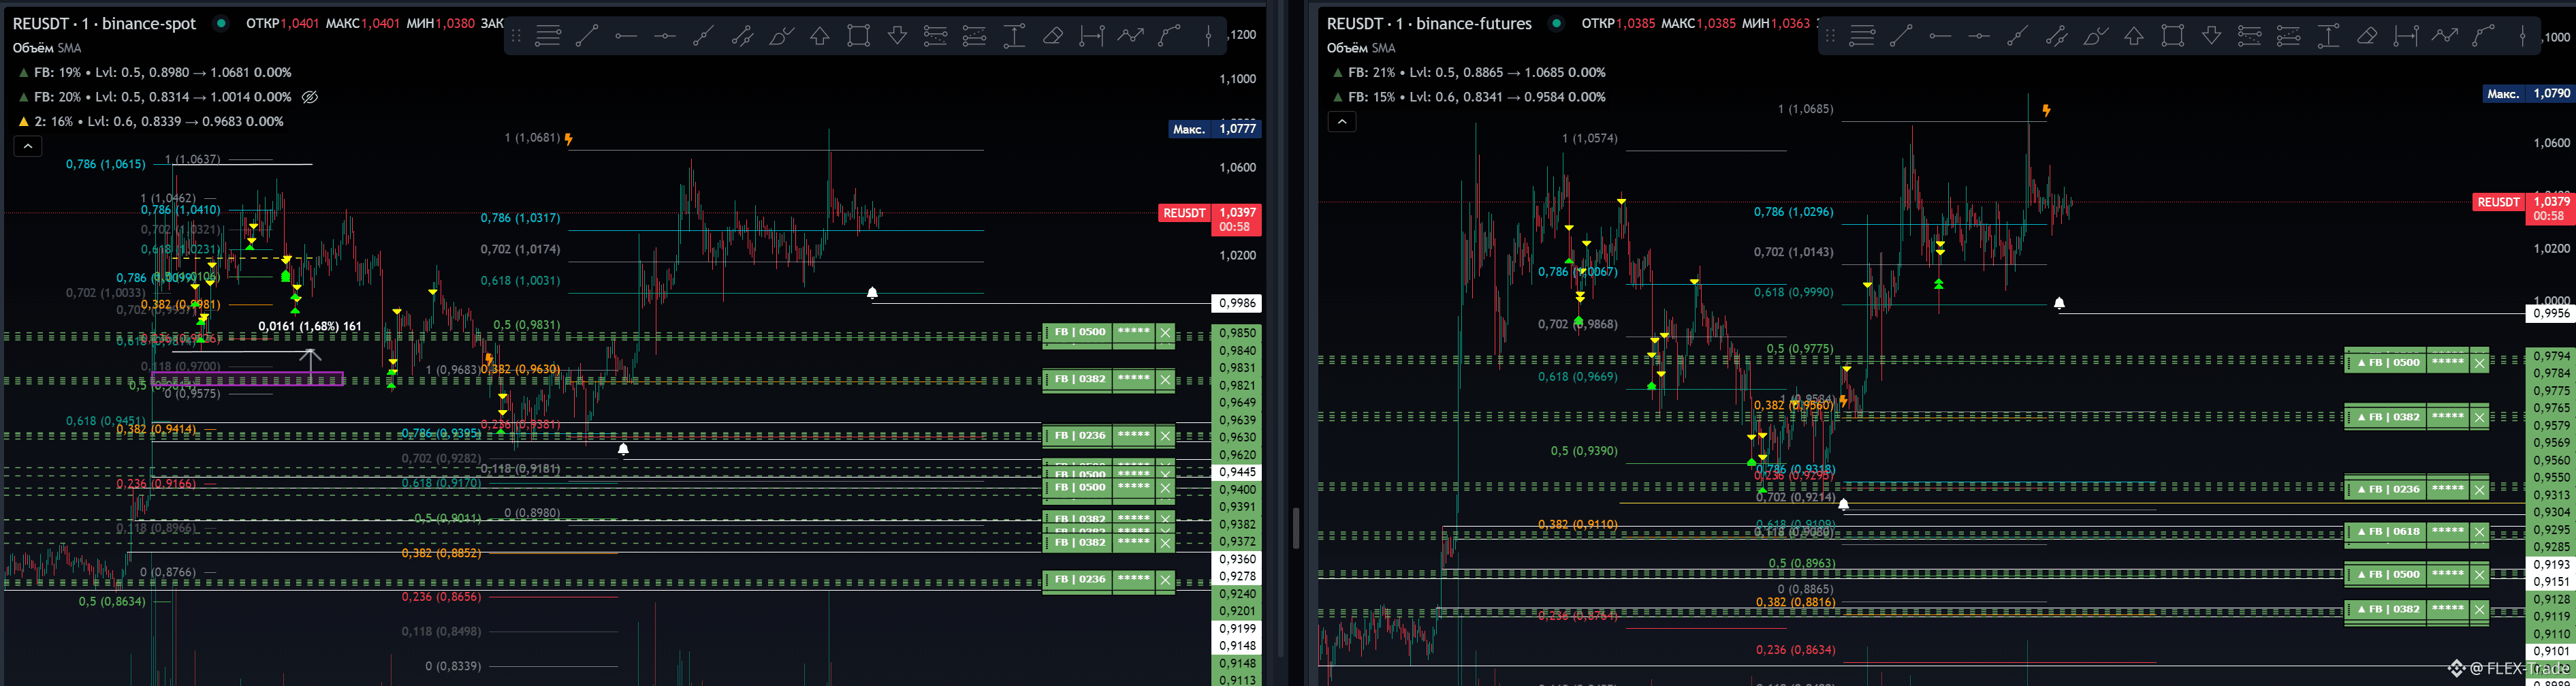
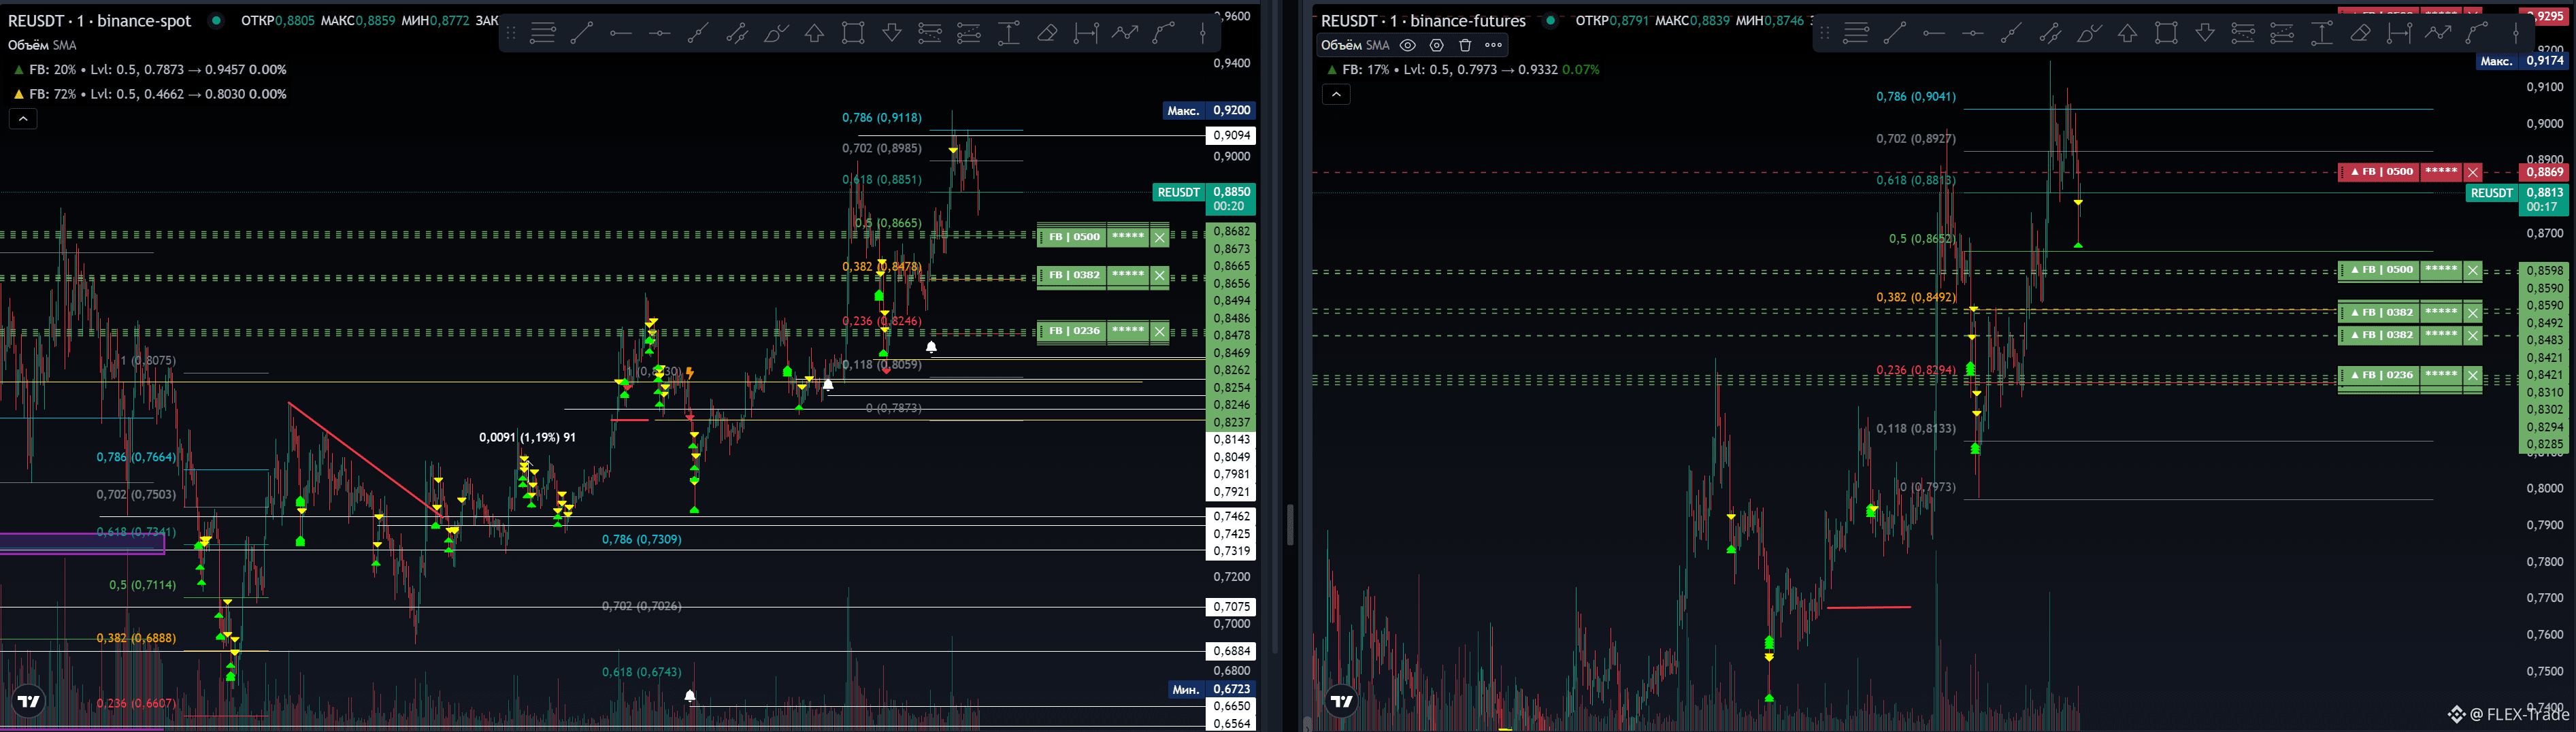
Right now, the setup is such that if the asset drops below the breakout/impulse test of 0.9, I’ll likely pull back on active grid trading, as the buyer will lose momentum.
They might start to not cover their drops/impulses.
If it goes for a new high - the trading will continue.
I'm trading it on both spot and futures simultaneously, as it moves a bit differently, and to compensate for any underfills - I'm processing two different charts for the overfills.
$RE
Today continues.
I'm riding local impulses, or rather their tests.
The asset is doing a great job testing incoming volumes.
Yesterday's warning partially played out,
It did drop as expected but provided some solid bounces to profit from, though it was already early morning. I wouldn't have been able to stay awake without sleep...
Right now, the setup is such that if the asset drops below the breakout/impulse test of 0.9, I’ll likely pull back on active grid trading, as the buyer will lose momentum.
They might start to not cover their drops/impulses.
If it goes for a new high - the trading will continue.
I'm trading it on both spot and futures simultaneously, as it moves a bit differently, and to compensate for any underfills - I'm processing two different charts for the overfills.
Today continues.
I'm riding local impulses, or rather their tests.
The asset is doing a great job testing incoming volumes.
Yesterday's warning partially played out,
It did drop as expected but provided some solid bounces to profit from, though it was already early morning. I wouldn't have been able to stay awake without sleep...
Right now, the setup is such that if the asset drops below the breakout/impulse test of 0.9, I’ll likely pull back on active grid trading, as the buyer will lose momentum.
They might start to not cover their drops/impulses.
If it goes for a new high - the trading will continue.
I'm trading it on both spot and futures simultaneously, as it moves a bit differently, and to compensate for any underfills - I'm processing two different charts for the overfills.
1
3
544
·
--
$RE
That's a wrap for today, for sure)
Things are heating up for the grids.
The wave has stretched into the channel, could give a nice impulse...
Either catch it at -15% with the first buckets...
Or just let it fly upwards forming a new growth wave.
$RE
That's a wrap for today, for sure)
Things are heating up for the grids.
The wave has stretched into the channel, could give a nice impulse...
Either catch it at -15% with the first buckets...
Or just let it fly upwards forming a new growth wave.
That's a wrap for today, for sure)
Things are heating up for the grids.
The wave has stretched into the channel, could give a nice impulse...
Either catch it at -15% with the first buckets...
Or just let it fly upwards forming a new growth wave.
2
1.7k
·
--
$RE
Overall, it turned out to be a really good day.
I was parallel trading on spot and futures.
I didn't share the setups because they were scalps on the one-second chart.
The situations change every minute. Even while I was screening, a trade jumped in...
Were we trading a shitcoin?
I feel like this ticker was familiar... a recognizable name... Especially since Binance has been into delisting and relisting all sorts of sketchy scams lately...
$RE
Overall, it turned out to be a really good day.
I was parallel trading on spot and futures.
I didn't share the setups because they were scalps on the one-second chart.
The situations change every minute. Even while I was screening, a trade jumped in...
Were we trading a shitcoin?
I feel like this ticker was familiar... a recognizable name... Especially since Binance has been into delisting and relisting all sorts of sketchy scams lately...
Overall, it turned out to be a really good day.
I was parallel trading on spot and futures.
I didn't share the setups because they were scalps on the one-second chart.
The situations change every minute. Even while I was screening, a trade jumped in...
Were we trading a shitcoin?
I feel like this ticker was familiar... a recognizable name... Especially since Binance has been into delisting and relisting all sorts of sketchy scams lately...
2
1.2k
Log in to explore more content
Join global crypto users on Binance Square
⚡️ Get latest and useful information about crypto.
💬 Trusted by the world’s largest crypto exchange.
👍 Discover real insights from verified creators.
Email / Phone number
Trending Topics
AIStocksWhatNext
732,345 views
5,553 Discussing
Share & Win Traffic Reward in our Trending Hashtag Campaign
✨Topic: What Other Investment Opportunities Remain as AI Stocks Keep Rising?
👉How to Join:
Publish a short post or article with hashtag #AIStocksWhatNext
Share whether you’re bullish or bearish, and post your AI stock holdings or trade — using the trade widget may improve your eligibility.
You can also strengthen your post by sharing data or charts, and avoiding AI-generated images.
✍️Create content based on the below angles:
- Nvidia says chip sales will double next year, and top AI companies keep hitting record revenue, the compute spend behind it is just as staggering. Is AI demand really taking off? And how long can it last? AI stocks are up across the board. Is this a real breakout, or just a short-term bounce?
- Industry leaders are calling to slow down AI development, while Trump plans to build an “AI Force”, claiming AI could account for 25% of U.S. GDP in the future. Whose side are you on? Will state-level backing be a long-term win for AI stocks?
- Are you buying AI stocks? Share your AI-related trade/holdings with our trade sharing widget.
⏰Campaign Period:
- 2026-09-22 7:00 - 2026-09-24 4:00 UTC
🎁Reward:
- Qualified posts that comply with the above guidelines and contain more than 100 words will be reviewed and may receive a random traffic boost of 500 to 3,000 views. You will receive a notification from your feed secretary if your post is selected.
- Get a chance to have your article featured on Binance Square Official
Need ideas for your post? Visit the topic page #AIStocksWhatNext or the Square Guide on How to Post for Better Reach.
Binance Square Official
·537 Likes
·1.5M views
BCHJumps28%OnCMEFuturesListing
0 views
40 Discussing
WallStreetEarningsRevisionsTurnBearish
0 views
22 Discussing